Embed Size (px)
Citation preview


Praise for the First Edition of The Option Trader’s Workbook
“Unlike most books that oversimplify trading situations, Augen’s approach forces you to learn by solvingreal-world problems where stock prices spike up and down and volatility changes constantly. Learningby doing is a distinct advantage for both novice and expert.”
—Sean Sztern, Alternative Strategies Group, Desjardins Securities
“This workbook represents a unique and effective learning tool. It will broaden your understanding ofoptions and raise your trading skills to a higher level.”
—Dr. W. Edward Olmstead, Northwestern University, author of Options for the Beginner and Beyond
“Serious options trading requires skills that can only be learned through practice. Augen’s progressivelymore challenging problems definitely provide that real-world practice. There are lessons here foreveryone, from beginner to sophisticated professional.”
—James Marcus, Partner, CMG Holdings, LLC

This page intentionally left blank

THE
OPTIONTRADER’SW O R K B O O K
SECOND EDITION

This page intentionally left blank
THE
OPTIONTRADER’SW O R K B O O K
A PROBLEM-SOLVING APPROACH
SECOND EDITION
Jeff Augen
Vice President, Publisher: Tim MooreAssociate Publisher and Director of Marketing: Amy NeidlingerExecutive Editor: Jim BoydEditorial Assistant: Pamela BolandSenior Marketing Manager: Julie PhiferAssistant Marketing Manager: Megan GraueCover Designer: Chuti PrasertsithCover Photograph: GlowImages, GettyImages, Inc.Managing Editor: Kristy HartProject Editor: Betsy HarrisCopy Editor: Cheri ClarkProofreader: Kathy RuizSenior Indexer: Cheryl LenserSenior Compositor: Gloria SchurickManufacturing Buyer: Dan Uhrig
© 2012 by Pearson Education, Inc.Publishing as FT PressUpper Saddle River, New Jersey 07458
This book is sold with the understanding that neither the author nor the publisher is engaged in renderinglegal, accounting or other professional services or advice by publishing this book. Each individual situationis unique. Thus, if legal or financial advice or other expert assistance is required in a specific situation, theservices of a competent professional should be sought to ensure that the situation has been evaluated care-fully and appropriately. The author and the publisher disclaim any liability, loss, or risk resulting directly orindirectly, from the use or application of any of the contents of this book.
FT Press offers excellent discounts on this book when ordered in quantity for bulk purchases or special sales. For moreinformation, please contact U.S. Corporate and Government Sales, 1-800-382-3419, [email protected] sales outside the U.S., please contact International Sales at [email protected].
Company and product names mentioned herein are the trademarks or registered trademarks of their respective owners.
All rights reserved. No part of this book may be reproduced, in any form or by any means, without permission in writingfrom the publisher.
Printed in the United States of America
First Printing October 2011
ISBN-10: 0-13-210135-1ISBN-13: 978-0-13-210135-6
Pearson Education LTD.Pearson Education Australia PTY, Limited.Pearson Education Singapore, Pte. Ltd.Pearson Education North Asia, Ltd.Pearson Education Canada, Ltd.Pearson Educación de Mexico, S.A. de C.V.Pearson Education—JapanPearson Education Malaysia, Pte. Ltd.
Library of Congress Cataloging-in-Publication Data
Augen, Jeffrey.
The option trader’s workbook : a problem-solving approach / Jeff Augen. — 2nd ed.
p. cm.
ISBN 978-0-13-210135-6 (pbk. : alk. paper)
1. Options (Finance) 2. Investment analysis. 3. Stock price forecasting. I. Title.
HG6024.A3A922 2012
332.63’2283—dc23
2011030802

To Lisa and our little friends both past and present—
Spokes, Hobie, Einstein, Regis, Rocky, Stella, Skooch,Rugby, and Bonzo.

This page intentionally left blank

Contents
Preface . . . . . . . . . . . . . . . . . . . . . . . . . . . . .xi
Notes . . . . . . . . . . . . . . . . . . . . . . . . . . . . . . .1
Chapter 1 Pricing Basics . . . . . . . . . . . . . . . . . . . . . . . . .3Summary . . . . . . . . . . . . . . . . . . . . . . . . . . . . . . . . 42
Chapter 2 Purchasing Puts and Calls . . . . . . . . . . . . . .43Basic Dynamics (Problems #1–#7) . . . . . . . . . . . . 45Protecting Profit (Problems #8–#19) . . . . . . . . . . 49Defensive Action (Problems #20–#38). . . . . . . . . 59Term Structure, Volatility Skews, and Theta (Problems #39–#46) . . . . . . . . . . . . . . . . . . . . . . . 78Summary . . . . . . . . . . . . . . . . . . . . . . . . . . . . . . . . 90
Chapter 3 Covered Puts and Calls . . . . . . . . . . . . . . . .91Traditional Covered Positions Involving Stock and Options (Problems #1–#23) . . . . . . . . . . . . . . 93Pure Option Covered Positions (Problems #24–#28) . . . . . . . . . . . . . . . . . . . . . . 115Summary . . . . . . . . . . . . . . . . . . . . . . . . . . . . . . . 123
Chapter 4 Complex Trades—Part 1 . . . . . . . . . . . . . .125Vertical Spreads (Problems #1–#15). . . . . . . . . . 126Calendar Spreads (Problems #16–#30) . . . . . . . 136Diagonal Calendar Spreads Spanning Multiple Expirations and Strike Prices (Problems #31–#34) . . . . . . . . . . . . . . . . . . . . . . 154Ratio Trades (Problems #35–#41) . . . . . . . . . . . 163Summary . . . . . . . . . . . . . . . . . . . . . . . . . . . . . . . 172

Chapter 5 Complex Trades—Part 2 . . . . . . . . . . . . . .173Butterfly Spreads (Problems #1–#8) . . . . . . . . . 174Straddles and Strangles (Problems #9–#16). . . . 185Four-Part Trades (Problems #17–#22) . . . . . . . . 194Volatility Index (Problems #23–#27) . . . . . . . . . 206Dividend Arbitrage (Problem #28). . . . . . . . . . . 215Summary . . . . . . . . . . . . . . . . . . . . . . . . . . . . . . . 218
Chapter 6 Advanced Ratio Trades . . . . . . . . . . . . . . .219
Chapter 7 Stock and Option Trades . . . . . . . . . . . . . .251
Chapter 8 Trading the Weekly Options Expiration . . . . . . . . . . . . . . . . . . . . . . . . .261
Glossary . . . . . . . . . . . . . . . . . . . . . . . . . . .273
Index . . . . . . . . . . . . . . . . . . . . . . . . . . . . .279
x THE OPTIONS TRADER’S WORKBOOK

Preface
There are two kinds of successful investors: those who admit tooccasionally losing money and those who don’t. Despite claims to thecontrary, every investor loses money because risk always scales in pro-portion to reward. Long-term winners don’t succeed by never losing;they succeed because their trades are well thought out and carefullystructured. That said, very few investors recognize the impact of theirown trading mistakes.
These mistakes can be subtle. The classic example goes some-thing like this:
1. “I bought calls.”
2. “The stock went up, but I still lost money!”
This frustrating scenario in which an investor correctly predicts astock’s direction but loses money is incredibly common in the optiontrading world. Leverage is almost always the culprit. More precisely, itis the misuse of leverage that stems from a fundamental misunder-standing of risk that so often turns investing into gambling with thesimple click of a mouse. Option traders are famous for this mistake.They know, for example, that a sharp rise in the price of a stock cangenerate tremendous profit from nearly worthless far out-of-the-money calls. But lead is not so easily transmuted into gold. The prob-lem is entangled with complex issues like collapsing volatility,accelerating time decay, and regression toward the mean. Institu-tional traders understand these issues and they rarely make these mis-takes. Thousands of trades have taught them that not losing money isthe very best way to generate a profit.
It’s the thousands of trades, winners and losers both, that separateprofessionals from amateurs. Option trading is just like playing chess:It requires study and practice. The comparison is more valid than youmight think. Both chess and option trading are governed by a complexset of rules. Risk analysis is at the center of both games; so is posi-tional judgment and the ability to react quickly. Chess players learn toidentify patterns; option traders, in their own way, must learn to dothe same.

This book is constructed around these themes. It is designed to letinvestors explore a vast array of rules and trade structures by solvingreal-life problems. This approach differs markedly from the catalog ofstructured trades that seems to have become the contemporary stan-dard for option trading books. Many fine texts have been written onthe subject, but most build on this design with slightly differentorganization or a few novel trading ideas. Collectively they miss thepoint. Learning to trade options is an active process, best accom-plished through doing rather than reading and memorizing. In thisregard we have avoided the familiar but bewildering list that includesnames like “reverse diagonal calendar spread,” “condor,” and “shortstrangle.” In their place you will find more descriptive phrases like“sell the near-dated option and buy the far-dated option.” But, moreimportantly, these descriptions appear in the context of trading situa-tions in which the reader is asked to make a choice, predict an out-come, or design a correction. Moreover, the problems build on eachother with each section progressing from basic to advanced.
Our goal was to challenge option traders at all levels. So take yourtime, work through the problems at a comfortable pace, and, mostimportant of all, make your trading mistakes here instead of in yourbrokerage account.
xii THE OPTIONS TRADER’S WORKBOOK

Acknowledgments
I would like to thank the team who helped pull the book together.First and foremost is Jim Boyd who was willing to take the risk of pub-lishing a new type of options book built around the problem-solvingconcept. His guidance and sound advice have added much clarity andorganization to the text. Authors create only rough drafts—finishedbooks are created by project editors. In that regard Betsy Harris wasresponsible for turning the original text into a publication-quality doc-ument. Without that effort the book would be nothing more than acollection of interesting math problems. I would also like to thankCheri Clark who carefully read and edited the text.
It is always difficult for an author to be objective about his ownwork. That job fell to Arthur Schwartz who patiently checked all mycalculations and made suggestions about new problems and examples.
Finally, I would like to acknowledge the excellent work of thePearson marketing team. I’ve certainly learned a great deal aboutweb-based digital marketing from working with Julie Phifer.
In these historic times of financial unrest, options have taken theirrightful place as sophisticated investment vehicles. Making themaccessible to a wider audience has been our principal goal.

About the Author
Jeff Augen, currently a private investor and writer, has spentmore than a decade building a unique intellectual property portfolioof databases, algorithms, and associated software for technical analysisof derivatives prices. His work, which includes more than a millionlines of computer code, is particularly focused on the identification ofsubtle anomalies and price distortions.
Augen has a 25-year history in information technology. Ascofounding executive of IBM’s Life Sciences Computing business, hedefined a growth strategy that resulted in $1.2 billion of new revenueand managed a large portfolio of venture capital investments. From2002 to 2005, Augen was President and CEO of TurboWorx Inc., atechnical computing software company founded by the chairman ofthe Department of Computer Science at Yale University. His booksinclude Microsoft Excel for Stock and Option Traders, Trading Reali-ties, Day Trading Options, Trading Options at Expiration, The OptionTrader’s Workbook, and The Volatility Edge in Options Trading. Hecurrently teaches option trading classes at the New York Institute ofFinance and writes a weekly column for Stocks, Futures and Optionsmagazine.

Notes
The following abbreviations will occasionally be used:
ATM = at-the-money (underlying security trades close to thestrike price)
OTM = out-of-the-money (underlying security trades belowthe strike price of a call or above the strike price of a put)
ITM = in-the-money (underlying security trades above thestrike price of a call or below the strike price of a put)
DITM = deep in-the-money (underlying security trades farabove the strike price of a call or far below the strike price of a put)
DOTM = deep out-of-the-money (underlying security tradesfar below the strike price of a call or far above the strike priceof a put)
Sqrt = Square root
StdDev = Standard deviations
1

This page intentionally left blank

Covered Puts and Calls
Covered positions are used by conservative investors who arewilling to accept a cap on their maximum gain in return for a hedgethat can offset potential losses. Covered calls—long stock combinedwith short calls—are the most popular and best understood. Manyinvestors find that covered calls are more profitable than simple longstock positions when the tendency is to hold the stock for a longperiod.
Bearish investors often take the same approach by shorting astock and selling puts. As we will see, covered put positions displaytrading dynamics that are very different from their covered call coun-terparts. Most of the difference is related to spikes in implied volatil-ity that often occur when a stock suddenly falls. Implied volatilityspikes increase the price of the put side of a trade and, therefore,affect the way the trade must be managed.
It is also important to note that covered calls and covered puts arelogically different with regard to the mechanism by which they areexercised. The two sides of a covered call are directly linked; theoption is exercised by calling away the covering stock from theinvestor who sold the call. Conversely, when a put is exercised, theowner sells (puts) the stock to the investor who originally sold theoption. If the original sale was covered with short stock, the investorwho is assigned would simply offset his or her loss by purchasing the
3
91

stock that was originally borrowed to create the trade. Both trades arecovered in the sense that no additional collateral is required to pro-tect the short put position.
In the option trading world it is more common to structure cov-ered positions without any stock at all. Long calls substitute for longstock, and long puts replace short stock. A short option position isconsidered covered if the account is long a corresponding number ofoption contracts having more favorable terms—that is, the same orfarther expiration date, and the same or closer strike price. Theserules add additional complexity because the two sides of the trade canhave different expiration dates. Various structures are possible and anappropriate set of names has evolved to describe them. Verticalspreads include long and short options with the same expiration date;calendar spreads span different expirations with the same strike price;diagonals have different strikes and expirations. Generally speaking,it is much more important to understand the trading dynamics ofeach structure than to memorize the names.
Finally, the term “covered” should not be misinterpreted as anindication that uncovered positions are always more dangerous. A sin-gle uncovered short put presents no more risk than 100 shares of longstock. Many investors miss this subtlety and lose the opportunity tocreate a large portfolio that benefits both from price movement andtime decay.
In this section we will explore various covered positions, includ-ing pure option trades that span multiple expirations. We previouslytouched on covered trades in our discussion of simple long call posi-tions. In that context we were either protecting profit after a rally ortaking defensive action in response to a price decline. This sectionbuilds on those discussions with trades that are structured as coveredpositions from the outset. (All calculations for this chapter are basedon a 1.5% risk-free interest rate.)
92 THE OPTION TRADER’S WORKBOOK

Traditional Covered Positions InvolvingStock and Options (Problems #1–#23)
1. Which of the following positions are considered covered?(Assume a stock price of $47.)
A. long 1,000 sharesshort 10 contracts—current month $50 call
B. long 1,000 sharesshort 15 contracts—current month $50 call
C. long 1,000 sharesshort 10 contracts—distant month $40 call
D. short 1,000 sharesshort 10 contracts—current month $40 put
E. short 1,000 sharesshort 10 contracts—distant month $60 put
F. long 10 contracts—current month $50 putshort 10 contracts—distant month $50 put
G. long 10 contracts—current month $50 putshort 10 contracts—distant month $40 put
H. long 10 contracts—distant month $70 callshort 10 contracts—current month $60 call
I. long 10 contracts—distant month $60 callshort 10 contracts—current month $60 call
J. long 10 contracts—distant month $50 callshort 10 contracts—current month $55 call
Answer: A, C, D, E, I, and J are covered. B is short 5 extra con-tracts. F and G are short the far-dated option. H is short thecloser strike price. A short position can be covered by an equiv-alent number of shares of stock or the same number of option
CHAPTER 3 • COVERED PUTS AND CALLS 93

contracts with more favorable terms. The phrase “more favor-able” refers to contracts that have the same or farther expira-tion date, and a strike price that is the same or closer to theunderlying security. Stated differently, the covering optionsmust have at least as many days left before expiration and astrike price that is at least as valuable as the short side of thetrade.
2. Which trade is more bullish for a stock trading at $47?
A. long 1,000 sharesshort 10 contracts—current month $50 call
B. long 1,000 sharesshort 10 contracts—current month $55 call
Answer: B—the $55 call has less value and offers less downsideprotection in return for greater potential upside.
3. What is the maximum profit for the long stock/short call posi-tion shown in the following table? What stock price yields themaximum profit at expiration of the short call?
Stock Long Short Call Short Call Short Call Price Shares Price Strike Contracts
$47.00 1,000 $3.50 $50 10
Answer: $6,500 with the stock trading at $50. The stock willhave a $3 profit, and the short call will expire worthless, return-ing $3.50 × 10 contracts = $3,500.
94 THE OPTION TRADER’S WORKBOOK

4. What would the break-even point be for question #3 at expira-tion of the short option.
Answer: $43.50. This amount is equal to the initial purchaseprice of the stock minus the amount of premium taken in byselling 10 calls.
5. Suppose in question #3 we had chosen to sell deep in-the-money $30 calls for $17.50 instead of the $50 calls mentioned inthe problem. Which short option position will provide the bestreturn if the stock climbs to $50? Which provides the most pro-tection if the stock falls to $45.
Answer: With the stock at $50, we would be forced to buy backthe $30 call for $20 (a $2.50 loss), and our stock would have a $3profit. Our overall gain would, therefore, be only 50¢ as opposedto the $6.50 profit of the trade described in question #3.
Conversely, if the stock declines to $45, the long stock positionwill lose $2 and the short $30 calls will be worth $15 ($2.50profit). The overall position will, therefore, gain 50¢. Under thesame circumstances, the short $50 calls will expire worthlessand the entire $3.50 of premium will remain in the account,providing an overall profit of $1.50 ($2 loss on the long stockposition + $3.50 gain from the short call position). Once againthe short $50 calls provide the larger return.
CHAPTER 3 • COVERED PUTS AND CALLS 95

6. At what expiration price are the two trades of the previousquestion equal? Which trade performs better if the stock fallsfurther?
Answer: A $3 decline in the stock price from $47 to $44 yieldsthe same profit (50¢) for both trades because each of the shortchoices returns $3.50 at that price. The short $50 call that orig-inally sold for $3.50 expires worthless, and the short deep in-the-money $30 call that originally sold for $17.50 would beworth $14 (its original price included 50¢ of time premium).
The short $30 call offers extended protection if the stockdeclines below $44. Because DITM options have a delta near1.0, the call price will decline in direct proportion to the stockprice until the price falls below $30.
Unfortunately, most options trading books and courses over-simplify the dynamics of complex positions. The most seriousoversimplifications are those that evaluate positions at expira-tion and ignore the real time-management issues. Calculatingthe value of a position at expiration is far easier than decidinghow to react to sharp price spikes that occur while the trade isopen. Most of the remainder of this section is devoted to prob-lems that address these issues.
7. The following table displays pricing data for the $50 call ofproblem #3 at four different stock prices with 54 days leftbefore expiration. Suppose, as before, we purchased 1,000shares of stock at $47 and sold 10 calls. What would the loss beif the stock fell to $44 after only 5 days and we closed the trade?What portion of the $3.50 downside protection were we able totake advantage of? Why?
96 THE OPTION TRADER’S WORKBOOK

Stock Call Call Days Price ($) Strike ($) Price ($) Volatility Remaining Theta
47 50 3.50 0.65 54 –0.04
46 50 3.06 0.65 54 –0.04
45 50 2.66 0.65 54 –0.04
44 50 2.29 0.65 54 –0.04
Answer: Because the option has an initial value of $2.29 withthe stock trading at $44, and theta is 4¢ per day, we can assumethat it would be worth $2.09 after 5 days of time have passed($2.29 – $0.04 × 5 days). Subtracting from the original value($3.50) that we obtained by selling the option with the stocktrading at $47 yields a gain of only $1.41. This gain offsets$1,410 of the $3,000 loss in the stock position. The difference($1,590) is the final loss after we sell our 1,000 shares of stockand buy back the short calls for $2.09.
We were only able to utilize 40% of the original downside pro-tection of the short $50 calls; the remaining 60% is locked up intime decay that can only be realized by keeping the trade openuntil expiration.
Note: When the underlying stock is trading out-of-the-money,theta can be used to accurately predict the price of an optionover a relatively short timeframe. In this example, 5 days repre-sents less than 10% of the remaining time, and all the optionvalue is derived from time premium. Theta, therefore, is a veryaccurate measure of time decay and it can be used to predictthe option price.
CHAPTER 3 • COVERED PUTS AND CALLS 97

8. Consider the following scenario: You have a bearish view of astock that is trading at $47, so you establish a covered put posi-tion by shorting 1,000 shares and selling $40 puts × 10 con-tracts. Two days later, the stock reacts to very negative financialrumors by plunging nearly 15%. With the stock now trading at$40, implied volatility soars to 180%. This scenario, depicted inthe following table, was fairly common among financial stocksduring the first quarter of 2008, when implied volatilities occa-sionally exceeded 400%.
Stock Days Put Price ($) Strike ($) Remaining Price ($) Volatility Delta
47.00 40 54 1.66 0.65 –0.22
40.00 40 52 10.58 1.80 –0.37
Does this trade lose money? If so, would closing the trade be agood strategy for preventing further loss? What are the relevantnumbers?
Answer: The trade will lose a substantial amount of money if it isclosed after the large downward price spike. While the shortstock position has gained $7,000 ($7 × 1,000 shares), the shortput position has lost $8,920 (10 contracts × $8.92). Immediatelyclosing the trade will cost $1,920. This unrealized loss is causedby the implied volatility spike that adds a substantial amount oftime premium to the short option position. Closing the tradewould be equivalent to throwing away the value of this premium.
9. If we keep the trade described in question #8, which of the fol-lowing would be better?
A. Stock falls another $5 to $35.
B. Stock rises $5 to $45.
98 THE OPTION TRADER’S WORKBOOK

Answer: A. Our position would benefit if the stock continuesfalling because we are more likely to lock in the maximum gainat expiration when all remaining time premium has run out. Ifthe stock closes at $45 on expiration day, we will keep $1.66from the short put and gain $2 on our short stock position—thefinal gain will be $3.66 or $3,660. Conversely, if the stock fallsanother $5 before expiration, we will realize the maximumgain—$7 for the short stock plus $1.66 of time premium fromthe short put. Specifically, we will buy back 1,000 shares ofshort stock at $35 for a $12,000 profit, and the short put posi-tion, now $5 in-the-money, will lose $3.34 ($3,340). Total profitfor the trade will, therefore, be $8,660.
10. Assume a scenario similar to that of the previous problem withone difference—we sell 10 puts at the $45 strike instead of $40.As before, we are short 1,000 shares of stock, the stock plungesto $40, and implied volatility climbs to 180%. These events areoutlined in the following table.
Stock Days Put Price ($) Strike ($) Remaining Price ($) Volatility Delta
47.00 45 54 3.59 0.65 –0.38
40.00 45 52 13.90 1.80 –0.43
We would likely establish this position because we are less bear-ish and would prefer the greater protection of the $45 put. Sup-pose that after the sharp decline we decide to buy back the $45puts and sell the next lower strike—$40, as described in the fol-lowing table.
Stock Days Put Price ($) Strike ($) Remaining Price ($) Volatility Delta
40.00 40 52 11.71 2.00 –0.35
CHAPTER 3 • COVERED PUTS AND CALLS 99

If the stock remains at this price until expiration, which shortput provides the greater return? Why? Is the new trade more orless bearish than the original?
Answer: At expiration the $45 put will be worth $5 and the $40put will be worth $0. Subtracting these values from their post-decline prices reveals that the $45 put has $8.90 of residualtime premium whereas the $40 put has $11.71. Therefore, ifthe stock remains at this price and we hold the position untilexpiration, the $40 put will generate more profit. However, thetransaction is complex because buying back the $45 put for$13.90 locks in a loss of $10.31 which is ultimately recovered inthe sale of the $40 put. We can calculate the returns for eachscenario as shown in the next two tables.
Scenario #1—Keep $45 short put until expiration (profit = $5,590)
Trade Open Close Profit/Loss ($)
Short stock Short 1,000 shares Buy to cover 1,000 7,000at $47 shares at $40
$45 put Sell 10 contracts at Buy back 10 contracts –1,410$3.59 at $5.00
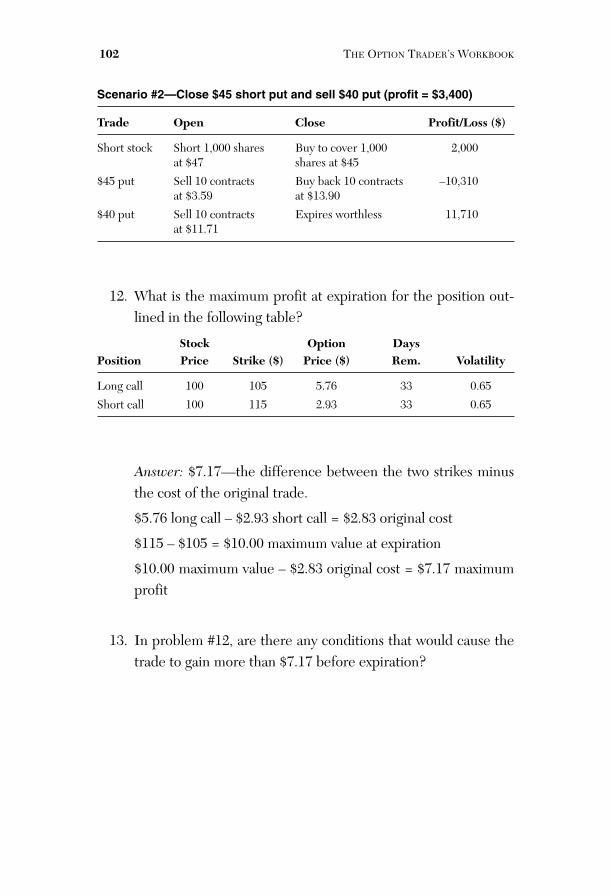
Scenario #2—Close $45 put and sell $40 put (profit = $8,400)
Trade Open Close Profit/Loss ($)
Short stock Short 1,000 shares Buy to cover 1,000 7,000at $47 shares at $40
Short $45 Sell 10 contracts Buy back 10 contracts –10,310put at $3.59 at $13.90
Short $40 Sell 10 contracts Expires worthless 11,710put at $11.71
The new trade is less bearish than the first. It replaces a shortput with a delta of –0.43 with a new option having a delta of
100 THE OPTION TRADER’S WORKBOOK

–0.35. Since short stock has a delta of –1.0, the original tradehas a net delta of –0.57 and the replacement trade has a netdelta of –0.65. In more practical terms, the short $40 puts pro-vide less protection against a recovery in the stock price andallows greater profit if the stock continues falling.
11. How would the two scenarios outlined in the previous tradecompare if the stock rallied back to $45 by expiration? (The sce-narios are listed next.)
Scenario #1short 1,000 shares at $47 and sell $45 puts (10 contracts)stock falls to $40keep trade as isstock rallies back to $45
Scenario #2short 1,000 shares at $47 and sell $45 puts (10 contracts)stock falls to $40buy back $45 puts and sell $40 putsstock rallies back to $45
Answer: Scenario #1 generates more profit because short $45in-the-money puts provide greater protection against a rallythan short $40 out-of-the-money puts. The two scenarios areoutlined in the tables that follow.
Scenario #1—Keep $45 short put until expiration (profit = $5,900)
Trade Open Close Profit/Loss ($)
Short stock Short 1,000 shares Buy to cover 1,000 2,000at $47 shares at $45
$45 put Sell 10 contracts Expires worthless 3,590at $3.59
CHAPTER 3 • COVERED PUTS AND CALLS 101
Scenario #2—Close $45 short put and sell $40 put (profit = $3,400)
Trade Open Close Profit/Loss ($)
Short stock Short 1,000 shares Buy to cover 1,000 2,000at $47 shares at $45
$45 put Sell 10 contracts Buy back 10 contracts –10,310at $3.59 at $13.90
$40 put Sell 10 contracts Expires worthless 11,710at $11.71
12. What is the maximum profit at expiration for the position out-lined in the following table?
Stock Option DaysPosition Price Strike ($) Price ($) Rem. Volatility
Long call 100 105 5.76 33 0.65
Short call 100 115 2.93 33 0.65
Answer: $7.17—the difference between the two strikes minusthe cost of the original trade.
$5.76 long call – $2.93 short call = $2.83 original cost
$115 – $105 = $10.00 maximum value at expiration
$10.00 maximum value – $2.83 original cost = $7.17 maximumprofit
13. In problem #12, are there any conditions that would cause thetrade to gain more than $7.17 before expiration?
102 THE OPTION TRADER’S WORKBOOK
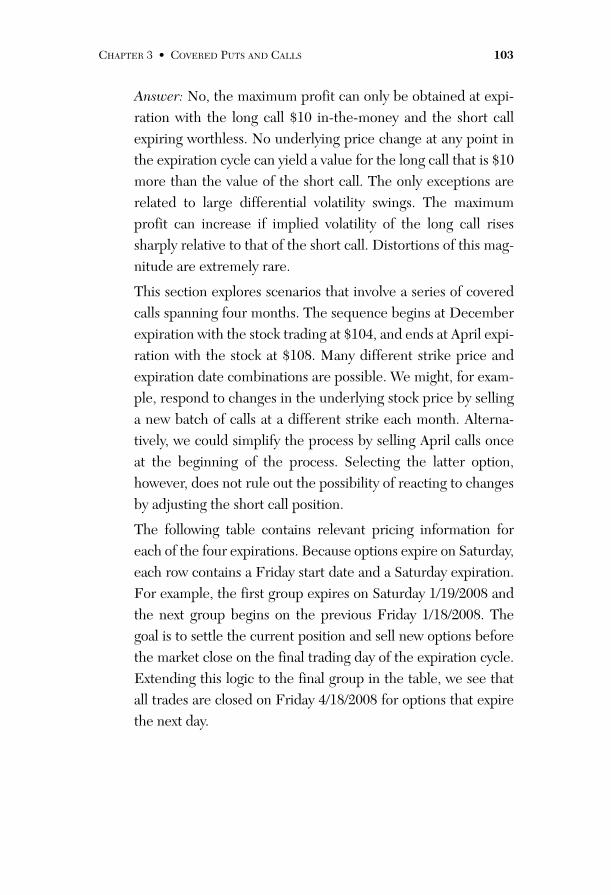
Answer: No, the maximum profit can only be obtained at expi-ration with the long call $10 in-the-money and the short callexpiring worthless. No underlying price change at any point inthe expiration cycle can yield a value for the long call that is $10more than the value of the short call. The only exceptions arerelated to large differential volatility swings. The maximumprofit can increase if implied volatility of the long call risessharply relative to that of the short call. Distortions of this mag-nitude are extremely rare.
This section explores scenarios that involve a series of coveredcalls spanning four months. The sequence begins at Decemberexpiration with the stock trading at $104, and ends at April expi-ration with the stock at $108. Many different strike price andexpiration date combinations are possible. We might, for exam-ple, respond to changes in the underlying stock price by sellinga new batch of calls at a different strike each month. Alterna-tively, we could simplify the process by selling April calls onceat the beginning of the process. Selecting the latter option,however, does not rule out the possibility of reacting to changesby adjusting the short call position.
The following table contains relevant pricing information foreach of the four expirations. Because options expire on Saturday,each row contains a Friday start date and a Saturday expiration.For example, the first group expires on Saturday 1/19/2008 andthe next group begins on the previous Friday 1/18/2008. Thegoal is to settle the current position and sell new options beforethe market close on the final trading day of the expiration cycle.Extending this logic to the final group in the table, we see thatall trades are closed on Friday 4/18/2008 for options that expirethe next day.
CHAPTER 3 • COVERED PUTS AND CALLS 103

Stock Start Expiration Days CallPrice ($) Date Date Remaining Strike($) Price ($) Volatility Delta
104 12/21/2007 1/19/2008 29 105 4.86 0.45 0.50104 12/21/2007 1/19/2008 29 110 2.97 0.45 0.36104 12/21/2007 1/19/2008 29 115 1.72 0.45 0.24104 12/21/2007 1/19/2008 29 120 0.94 0.45 0.15
112 1/18/2008 2/16/2008 29 115 4.42 0.45 0.45112 1/18/2008 2/16/2008 29 120 2.75 0.45 0.32112 1/18/2008 2/16/2008 29 125 1.63 0.45 0.21112 1/18/2008 2/16/2008 29 130 0.92 0.45 0.14
‘97 2/15/2008 3/22/2008 36 100 4.23 0.45 0.4597 2/15/2008 3/22/2008 36 105 2.60 0.45 0.3297 2/15/2008 3/22/2008 36 110 1.52 0.45 0.2197 2/15/2008 3/22/2008 36 115 0.85 0.45 0.13
94 3/21/2008 4/19/2008 29 95 4.35 0.45 0.5094 3/21/2008 4/19/2008 29 100 2.51 0.45 0.3494 3/21/2008 4/19/2008 29 105 1.35 0.45 0.2194 3/21/2008 4/19/2008 29 110 0.68 0.45 0.12
108 4/18/2008 4/19/2008 1 95 13.00 0.01 1.00108 4/18/2008 4/19/2008 1 100 8.00 0.01 1.00108 4/18/2008 4/19/2008 1 105 3.00 0.01 1.00108 4/18/2008 4/19/2008 1 110 0.00 0.01 0.00
104T
HE
OPT
ION
TR
AD
ER’S
WO
RK
BO
OK

14. For the timeframe beginning on 12/21 and ending on 4/19,which trade sequence generates the larger return? In percent-age terms, what is the overall profit for this trade?
Purchase 1,000 shares of stock on 12/21 and sell on 4/18.
or
Purchase 1,000 shares of stock and, for each expiration, sell 10contracts at the first strike that is at least $5 out-of-the-money.As mentioned earlier, each option trade should be settled, andthe next batch of calls sold, on an expiration Friday (12/21, 1/18,2/15, 3/21). All trades are finally settled at the market close on4/18.
Answer: The stock position alone returns $4,000 while the cov-ered call sequence returns $4,830. The following table outlinesthe gain or loss of the short call position at each expiration.
Initial Expiration Expiration Stock Stock Initial Final Gain/Date Price ($) Price ($) Strike ($) Call ($) Call ($) Loss ($)
1/19/2008 104 112 110 2.97 2.00 0.97
2/16/2008 112 97 120 2.75 0.00 2.75
3/22/2008 97 94 105 2.60 0.00 2.60
4/19/2008 94 108 100 2.51 8.00 –5.49
Total 0.83
The first three expirations return a profit of $6.32 but the finalexpiration loses $5.49, for a total short call return of only $0.83($830). Adding together the stock and short call profits yields anet return of $4,830. Since the total cost of the trade was 1,000shares of long stock at $104, the percent gain is $4,830 /$104,000 = 4.64%.
CHAPTER 3 • COVERED PUTS AND CALLS 105

15. In problem #14, what was the return for the short call portionof the trade? Was it necessary to set aside funds to collateralizethe short calls?
Answer: In each case the short calls were covered with longstock so additional collateral was not required. Initial tradeprices were $2,970, $2,750, $2,600, and $2,510—an average of$2,710. Dividing the return by this amount ($830 / $2,710)reveals that the short calls generated a profit equal to 31% oftheir value. Because there was no additional expense associatedwith the short calls, the revenue from their sale flows directly tothe bottom line as profit that is measured against the cost of thelong stock position (see problem #14).
16. In problem #14, would we have generated more profit by sell-ing the nearest out-of-the-money strike for each month and tak-ing in more premium, or selling the next further strike andtaking in less premium?
Answer: Moving out to the next strike yields significantly moreprofit. Selling the closest out-of-the-money strike for each expi-ration results in a loss of $2.14 ($2,140) for the combined shortoption trades. Moving one strike beyond those of question #14has the opposite effect—it generates a positive return of $3.22($3,220). The following tables provide detail for both cases.
106 THE OPTION TRADER’S WORKBOOK

Close Strikes
Initial Expiration Expiration Stock Stock Initial Final Gain/Date Price ($) Price ($) Strike ($) Call ($) Call ($) Loss ($)
1/19/2008 104 112 105 4.86 7.00 –2.14
2/16/2008 112 97 115 4.42 0.00 4.42
3/22/2008 97 94 100 4.23 0.00 4.23
4/19/2008 94 108 95 4.35 13.00 –8.65
Total –2.14
Far Strikes
Initial Expiration Expiration Stock Stock Initial Final Gain/Date Price ($) Price ($) Strike ($) Call ($) Call ($) Loss ($)
1/19/2008 104 112 115 1.72 0.00 1.72
2/16/2008 112 97 125 1.63 0.00 1.63
3/22/2008 97 94 110 1.52 0.00 1.52
4/19/2008 94 108 105 1.35 3.00 –1.65
Total 3.22
In summary, the closest OTM strike results in a loss of $2,140;the next strike generates $830; the far strike yields $3,220.
17. How do the short call trades of the preceding three questionscompare in percentage terms?
Answer: See the following table.
Average Call Price ($) Return ($) Return
Nearest OTM Strike 4.47 –2.14 –48%
Nearest strike > $5 OTM 2.71 0.83 31%
Nearest strike > $10 OTM 1.55 3.22 207%
CHAPTER 3 • COVERED PUTS AND CALLS 107

18. Why is the return so much larger for calls sold at the far strikeprice? (Hint: Measuring distances to strikes and price changesin standard deviations is helpful.)
Answer: Assuming a stock price near $100, we can calculate theapproximate value of a 1 standard deviation price change foreach 1-month timeframe as shown here:
Timeframes in 1 year 12Annualization factor Sqrt (12) = 3.46Volatility for 1 month 0.45 / 3.46 = 0.131 StdDev change 0.13 × $100 = $13
The greatest loss (4/19 expiration) was caused by a price changeof just over 1 standard deviation ($94 – $108) that was pro-tected by an option sale of $4.35 for a strike just $1.00 out-of-the-money. Total protection for this sale was, therefore, only$5.35, or less than 0.5 StdDev. Selling calls that protect againstsmall price changes is a bearish strategy that assumes mispricedvolatility. The 1/19 expiration displayed similar dynamics: Theshort $105 call lost 44% on a price increase of approximately 0.6StdDev.
19. In problem #17 we discovered that the largest return was gen-erated by selling new options each month that were close to 1standard deviation OTM. Suppose we decided, instead, to sellone batch of calls for the entire timeframe (120 days) that wereapproximately the same distance (1 StdDev) from the $104starting price. Which row in the following table would be mostrelevant? How would the results compare to the monthlyoption sales of the previous problems?
108 THE OPTION TRADER’S WORKBOOK

Stock Start Exp. Days CallPrice($) Date Date Rem. Strike ($) Price ($) Volat. Delta
104 12/21/07 4/19/08 120 125 4.22 0.45 0.29
104 12/21/07 4/19/08 120 130 3.30 0.45 0.24
104 12/21/07 4/19/08 120 135 2.57 0.45 0.19
104 12/21/07 4/19/08 120 140 1.99 0.45 0.16
Answer: We can calculate the value of 1 StdDev for the 120 daytimeframe as shown here:
Timeframes in 1 year1 65 / 120 = 3.04Annualization factor Sqrt (3.04) = 1.74Volatility for 120 days 0.45 / 1.74 = 0.261 StdDev change 0.26 × $104 = $27.041 We use calendar days for this calculation to precisely measure the fractionof a year that is represented by the entire timeframe. If we were calculating adaily price change, number of trading days (252) would provide a more appro-priate metric.
Using these values, we can assume that we would sell the $130strike price for $3.30 ($26 OTM). Since the stock closed at $108on expiration day, the full amount would be realized as profit.In this case, the simple trade would generate approximately thesame return as the more complex monthly sequence of optionsales.
20. With regard to risk, how does the long-dated trade of problem#19 compare with that of the monthly trades? Do the resultsvalidate or conflict with option pricing theory?
Answer: Delta closely approximates the chance of an optionexpiring in-the-money. The monthly short trades had deltas of0.24, 0.21, 0.21, and 0.21; the long-dated trade had a deltaequal to 0.24. We can, therefore, conclude that the risk of expir-
CHAPTER 3 • COVERED PUTS AND CALLS 109

ing in-the-money was approximately equal for monthly andlong-dated short calls. These dynamics make sense becausemonthly and long-dated strike choices were both based on a 1standard deviation price change.
The results are a strong validation of option pricing theorybecause equal risks yielded comparable profits regardless of thetimeframe. Selling more expensive closer strikes was not a goodstrategy because potentially larger profits were offset by greaterrisks that occasionally materialized into substantial losses.
Option traders frequently make the mistake of selling seem-ingly expensive near-dated options that exhibit high levels oftime decay. This approach is flawed because correctly pricedoptions have balanced risk:reward profiles regardless of thetimeframe. However, monthly short sales can provide an advan-tage in rising volatility environments—bear markets being themost notable case. The following problems are designed withthis concept in mind.
In this section we will explore scenarios that involve a series ofcovered puts spanning four months. The following table con-tains relevant pricing information. As before, each section’sstart date corresponds to expiration Friday of the previous sec-tion. The sequence begins at December expiration with thestock trading at $106, and ends at April expiration with thestock at $66.
110 THE OPTION TRADER’S WORKBOOK

Stock Start Expiration Days CallPrice ($) Date Date Remaining Strike ($) Price ($) Volatility Delta
106.00 12/21/2007 1/19/2008 29 105 4.79 0.45 –0.44106.00 12/21/2007 1/19/2008 29 100 2.71 0.45 –0.30106.00 12/21/2007 1/19/2008 29 95 1.34 0.45 –0.17106.00 12/21/2007 1/19/2008 29 90 0.57 0.45 –0.09
98.00 1/18/2008 2/16/2008 29 95 3.48 0.45 –0.3898.00 1/18/2008 2/16/2008 29 90 1.76 0.45 –0.2398.00 1/18/2008 2/16/2008 29 85 0.75 0.45 –0.1298.00 1/18/2008 2/16/2008 29 80 0.26 0.45 –0.05
103.00 2/15/2008 3/22/2008 36 100 3.78 0.41 –0.38103.00 2/15/2008 3/22/2008 36 95 2.01 0.41 –0.24103.00 2/15/2008 3/22/2008 36 90 0.92 0.41 –0.13103.00 2/15/2008 3/22/2008 36 85 0.35 0.41 –0.06
78.00 3/21/2008 4/19/2008 29 75 3.75 0.60 –0.3778.00 3/21/2008 4/19/2008 29 70 1.95 0.60 –0.2378.00 3/21/2008 4/19/2008 29 65 0.85 0.60 –0.1278.00 3/21/2008 4/19/2008 29 60 0.30 0.60 –0.05
66.00 4/18/2008 4/19/2008 1 75 9.00 0.01 –1.0066.00 4/18/2008 4/19/2008 1 70 4.00 0.01 –1.0066.00 4/18/2008 4/19/2008 1 65 0.00 0.01 0.0066.00 4/18/2008 4/19/2008 1 60 0.00 0.01 0.00
CH
APT
ER
3•
CO
VE
RE
DP
UT
SA
ND
CA
LL
S111

21. For the timeframe beginning on 12/21 and ending on 4/19,which trade sequence generates the larger return?
Short 1,000 shares of stock on 12/21 and close the trade on4/18.
or
Short 1,000 shares of stock and, for each expiration, sell 10 putsat the first strike that is at least $5 out-of-the-money. As men-tioned earlier, each option trade should be settled, and the nextbatch of puts sold, on an expiration Friday (12/21, 1/18, 2/15,3/21). All trades are finally settled at the market close on 4/18.
Answer: The stock position returns $40,000 while the coveredput sequence subtracts $14,570. The net result is a profit of$25,430. The following table outlines the gain or loss of theshort put position at each expiration.
Initial Expiration Expiration Stock Stock Initial Final Gain/Date Price ($) Price ($) Strike ($) Put ($) Put ($) Loss ($)
1/19/2008 106 98 100 2.71 2.00 0.71
2/16/2008 98 103 90 1.76 0.00 1.76
3/22/2008 103 78 95 2.01 17.00 –14.99
4/19/2008 78 66 70 1.95 4.00 –2.05
Total –14.57
22. When a company reports very negative financial news thatshocks the market, the resulting stock drawdown is normallyaccompanied by a sharp increase in implied volatility. Spikes of300%, 400%, and even 500% are not uncommon in thesesituations.
112 THE OPTION TRADER’S WORKBOOK
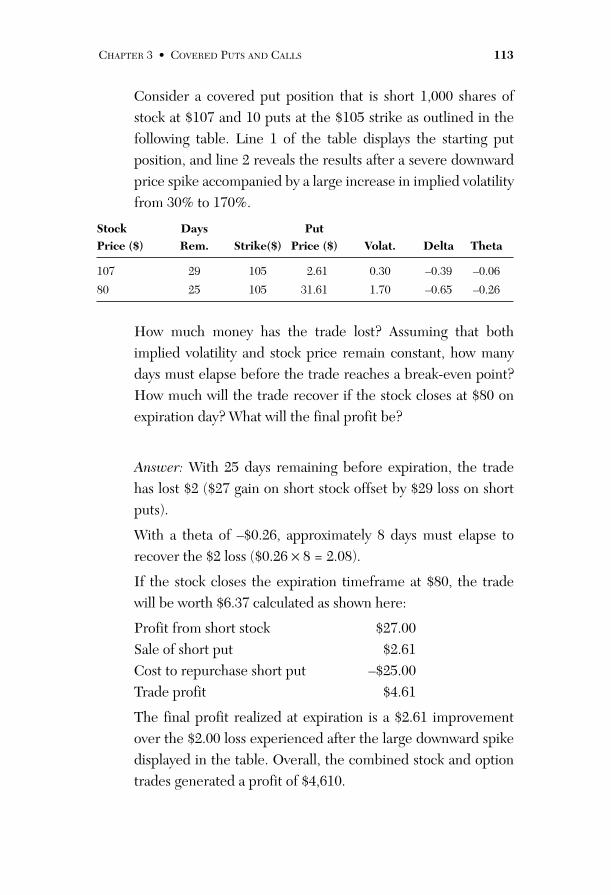
Consider a covered put position that is short 1,000 shares ofstock at $107 and 10 puts at the $105 strike as outlined in thefollowing table. Line 1 of the table displays the starting putposition, and line 2 reveals the results after a severe downwardprice spike accompanied by a large increase in implied volatilityfrom 30% to 170%.
Stock Days Put Price ($) Rem. Strike($) Price ($) Volat. Delta Theta
107 29 105 2.61 0.30 –0.39 –0.06
80 25 105 31.61 1.70 –0.65 –0.26
How much money has the trade lost? Assuming that bothimplied volatility and stock price remain constant, how manydays must elapse before the trade reaches a break-even point?How much will the trade recover if the stock closes at $80 onexpiration day? What will the final profit be?
Answer: With 25 days remaining before expiration, the tradehas lost $2 ($27 gain on short stock offset by $29 loss on shortputs).
With a theta of –$0.26, approximately 8 days must elapse torecover the $2 loss ($0.26 × 8 = 2.08).
If the stock closes the expiration timeframe at $80, the tradewill be worth $6.37 calculated as shown here:
Profit from short stock $27.00Sale of short put $2.61Cost to repurchase short put –$25.00Trade profit $4.61
The final profit realized at expiration is a $2.61 improvementover the $2.00 loss experienced after the large downward spikedisplayed in the table. Overall, the combined stock and optiontrades generated a profit of $4,610.
CHAPTER 3 • COVERED PUTS AND CALLS 113

23. Suppose that in problem #22 we responded to the sharp pricedecline by buying back our original short put position for$31.61 and selling new puts at a lower strike. Which of thechoices shown in the following table generates the largest profitif the stock falls another $10? Which generates the most profitif the stock rises? Which choices generate at least as muchreturn as the original $105 put if the stock remains at $80 untilexpiration?
Stock Days Put Price ($) Rem. Strike($) Price ($) Volat. Delta Theta
80 25 75 11.28 1.70 –0.36 –0.26
80 25 70 8.78 1.70 –0.30 –0.25
80 25 65 6.60 1.70 –0.24 –0.22
Answer:
Decline to $70: If the stock falls another $10, the short $70strike that sells for $8.78 will generate the largest profit—theshort stock will generate an additional $10 and $8.78 of pre-mium will be realized when the options expire out-of-the-money. The more valuable $75 puts will generate $6.28 ($11.28initial sale – $5.00 cost to repurchase), and the $65 puts willreturn the sale price ($6.60).
Protection against a rally: Of the three choices, the higheststrike ($75) provides the most protection against a stock rally—it has the most negative delta and the most value. However, theoriginal $105 short puts would provide superior protection.Keeping this trade open is the best choice if a price reversalseems likely.
114 THE OPTION TRADER’S WORKBOOK

Stock remains at $80: At the time of the downward spike, theoriginal $105 puts were $25 in-the-money but traded for$31.61. Subtracting intrinsic from actual value ($31.61 –$25.00) reveals that the contracts had $6.61 of remaining timepremium that must decay away before expiration. We can usethis number for comparison against the three new choices,which each return their full sale price at expiration as theyexpire out-of-the-money. The first two choices yield higherreturns than the original trade ($11.28 and $8.78). The thirdchoice provides approximately the same return ($6.60).
Pure Option Covered Positions(Problems #24–#28)
The following section focuses on covered positions composed ofequal numbers of long and short options in which the long side hasmore favorable terms (same or later expiration and same or closerstrike). Many investors who trade covered positions favor thisapproach because it requires less capital, limits downside exposure,and benefits from leverage.
The following two tables display relevant pricing information forthe problems that follow. The first table is organized by month andstrike price. As before, each section’s start date corresponds to expira-tion Friday of the previous group. The sequence begins at Decemberexpiration with the stock trading at $104, and ends at April expirationwith the stock at $133.
The second table is composed of a single set of entries that spanthe entire timeframe. It provides long-dated option prices that com-plement those of the previous table.
CHAPTER 3 • COVERED PUTS AND CALLS 115

Monthly Expirations
Stock Start Expiration Days CallPrice ($) Date Date Remaining Strike ($) Price ($) Volatility Delta
104 12/21/2007 1/19/2008 29 105 4.86 0.45 0.50104 12/21/2007 1/19/2008 29 110 2.97 0.45 0.36104 12/21/2007 1/19/2008 29 115 1.72 0.45 0.24104 12/21/2007 1/19/2008 29 120 0.94 0.45 0.15
112 1/18/2008 2/16/2008 29 115 4.42 0.45 0.45112 1/18/2008 2/16/2008 29 120 2.75 0.45 0.32112 1/18/2008 2/16/2008 29 125 1.63 0.45 0.21112 1/18/2008 2/16/2008 29 130 0.92 0.45 0.14
117 2/15/2008 3/22/2008 36 120 5.35 0.45 0.46117 2/15/2008 3/22/2008 36 125 3.60 0.45 0.35117 2/15/2008 3/22/2008 36 130 2.34 0.45 0.25117 2/15/2008 3/22/2008 36 135 1.47 0.45 0.18
103 3/21/2008 4/19/2008 29 105 4.37 0.45 0.47103 3/21/2008 4/19/2008 29 110 2.63 0.45 0.33103 3/21/2008 4/19/2008 29 115 1.49 0.45 0.21103 3/21/2008 4/19/2008 29 120 0.80 0.45 0.13
133 4/18/2008 4/19/2008 1 105 28.00 0.01 1.00133 4/18/2008 4/19/2008 1 110 23.00 0.01 1.00133 4/18/2008 4/19/2008 1 115 18.00 0.01 1.00133 4/18/2008 4/19/2008 1 120 13.01 0.01 1.00
116T
HE
OPT
ION
TR
AD
ER’S
WO
RK
BO
OK

Long-Dated Expirations
Stock Start Expiration Days CallPrice ($) Date Date Remaining Strike ($) Price ($) Volatility Delta
104 12/21/2007 4/19/2008 120 100 13.53 0.48 0.62
104 12/21/2007 4/19/2008 120 105 11.17 0.48 0.55
104 12/21/2007 4/19/2008 120 110 9.15 0.48 0.48
104 12/21/2007 4/19/2008 120 115 7.45 0.48 0.42
104 12/21/2007 4/19/2008 120 120 6.02 0.48 0.36
104 12/21/2007 4/19/2008 120 125 4.84 0.48 0.30
104 12/21/2007 4/19/2008 120 130 3.87 0.48 0.26
104 12/21/2007 4/19/2008 120 135 3.07 0.48 0.21
104 12/21/2007 4/19/2008 120 140 2.44 0.48 0.18
CH
APT
ER
3•
CO
VE
RE
DP
UT
SA
ND
CA
LL
S117

24. Assume we purchase $105 calls with 120 days remaining andsell near-dated calls each month to offset time decay. Whichsequence of strike prices would be most appropriate if our viewis completely neutral as opposed to bearish or bullish? Whatwould be the profit engine for such a trade?
Answer: Consistently selling the most expensive option (closeststrike) creates positions that are essentially neutral becauseboth sides have similar deltas. The trade would be designed toprofit from time decay. The sequence is listed in the followingtable. (Note that we sold the $110 strike for the final monthbecause we were already long the $105 strike.)
Expiration Date Strike ($) Call Price ($)
1/19/2008 105 4.86
2/16/2008 115 4.42
3/22/2008 120 5.35
4/19/2008 110 2.63
25. What would the profit or loss be in problem #24 for a trade con-sisting of 10 short and 10 long calls?
Answer: The collective trade gains $2.09 ($2,090 for 10 con-tracts), as shown in the next table.
118 THE OPTION TRADER’S WORKBOOK

Initial Expir.Expir. Stock Stock Initial Final Gain/
Position Date Price ($) Price ($) Strike ($) Call ($) Call ($) Loss ($)
Short 1/19/2008 104 112 105 4.86 7.00 –2.14
Short 2/16/2008 112 117 115 4.42 2.00 2.42
Short 3/22/2008 117 103 120 5.35 0.00 5.35
Short 4/19/2008 103 133 110 2.63 23.00 –20.37
Long 4/19/2008 104 133 105 11.17 28.00 16.83
Total 2.09
26. Would purchasing the far-dated $100 call create a more bullishor bearish position? Why? (Note: Assume that we would alsoadjust the short April position by shifting from the $110 call tothe $105 call.)
Answer: Initially it would appear that the higher delta of the$100 call represents a more bullish view. (The $105 strike ofproblem #25 had a delta of 0.55 and the new delta is 0.62.)However, the new trade is more bearish because it shifts theoptimal return point from $110 to $105.
The largest price increase occurred in April, and we are adjust-ing both the short and long positions for this month. On thelong side we pay an additional $2.36 for the $100 strike,whereas the new short call only generates an additional $1.74.(Strike price spacing remains the same.) This difference repre-sents an increased cost of $0.62 that is lost if the underlyingstock closes above or below both strikes at expiration. However,if the stock closes April expiration nearly unchanged at $105,lowering both strikes provides a $5.00 improvement becausethe long side of the trade moves $5.00 in-the-money while theshort side remains worthless. Since the initial position cost is
CHAPTER 3 • COVERED PUTS AND CALLS 119

increased by $0.62, the net improvement at expiration is $4.38.This improvement is reduced as the stock moves away from the$105 strike in either direction.
We can verify these numbers by calculating the return for eachposition with the stock trading at $105 at expiration. The origi-nal trade—long $105 calls / short $110 calls—would lose $8.54if the stock closed April expiration at $105 ($11.17 loss on thelong side offset by $2.63 gain on the short side). Shifting thestrikes down $5.00 adjusts these values so that the long sideloses only $8.53 ($13.53 initial cost – $5.00 value at expiration)which is partially offset by a gain of $4.37 on the short side for anet loss of $4.16. The improvement from an $8.54 loss to $4.16loss is exactly equal to $4.38.
27. How would a trade structured using the far-dated $100 call forthe long side and each month’s nearest OTM strike for the shortside compare with the position of problem #25?
Answer: Based on the answer to problem #26, we can predictthat the new trade will generate a return that is $620 smaller—$1,470 as opposed to $2,090 for the original trade. The detailsare outlined in the following table.
Initial Expir.Expir. Stock Stock Initial Final Gain/
Position Date Price ($) Price ($) Strike ($) Call ($) Call ($) Loss ($)
Short 1/19/08 104 112 105 4.86 7.00 –2.14
Short 2/16/08 112 117 115 4.42 2.00 2.42
Short 3/22/08 117 103 120 5.35 0.00 5.35
Short 4/19/08 103 133 105 4.37 28.00 –23.63
Long 4/19/08 104 133 100 13.53 33.00 19.47
Total 1.47
120 THE OPTION TRADER’S WORKBOOK

28. Would the preceding trade yield a larger return if we sellmonthly calls that are approximately 1 standard deviation out-of-the-money? How would we structure both sides of the tradeso that it is still considered covered—that is, the long side hasmore favorable terms?
Answer: First we must calculate the value of a 1 StdDev pricechange for each timeframe.
Near-Dated OptionsTimeframes in 1 year 12Annualization factor Sqrt (12) = 3.46Volatility for 1 month 0.45 / 3.46 = 0.131 StdDev change 0.13 × $104 = $13.521 StdDev change 0.13 × $112 = $14.561 StdDev change 0.13 × $117 = $15.211 StdDev change 0.13 × $103 = $13.39Average 1 StdDev change $14.17
Far-Dated OptionsTimeframes in 1 year 365 / 120 = 3.04Annualization factor Sqrt (3.04) = 1.74Volatility for 120 days 0.48 / 1.74 = 0.2761 StdDev change 0.28 × $104 = $28.70
Using these numbers as a guide, we can select appropriatestrikes and construct a table that includes prices and other rele-vant information.
Expiration Initial Stock Initial Date Price ($) Strike ($) Call ($) Delta
1/19/2008 104 115 1.72 0.24
2/16/2008 112 125 1.63 0.21
3/22/2008 117 130 2.34 0.25
4/19/2008 103 115 1.49 0.21
CHAPTER 3 • COVERED PUTS AND CALLS 121

However, the requirement to select long-dated options withmore favorable terms caps our strike price at $115. Addition-ally, because we have chosen this strike for the short April call,we must move closer and purchase the far-dated $110. Thisoption is only $6.00 (0.21 StdDev) out-of-the-money for the120-day timeframe. We can now complete a table that outlinesthe entire trade.
Initial Expir.Expir. Stock Stock Initial Final Gain/
Position Date Price ($) Price ($) Strike($) Call ($) Call ($) Loss ($)
Short 1/19/08 104 112 115 1.72 0.00 1.72
Short 2/16/08 112 117 125 1.63 0.00 1.63
Short 3/22/08 117 103 130 2.34 0.00 2.34
Short 4/19/08 103 133 115 1.49 18.00 –16.51
Long 4/19/08 104 133 110 9.15 23.00 13.85
Total 3.03
Reducing the risk of each short trade by selecting more distantstrikes increased the return by 45% to $3,030. Additionally, withregard to the initial trade outlined in problem #25, the cost ofthe long April call was reduced by $2.02 while the short Aprilcall price only changed $1.14. Strike price spacing remained thesame at $5. This dynamic locked in an additional 88¢ of profitbecause the stock closed above both strikes at April expiration.
Additional notes for problems #24–#28:
In the previous five problems the April price increase was thepredominant force affecting profit. However, we have calcu-lated that a 1 StdDev price change for the 120-day timeframe isapproximately $29 and, therefore, the rise from $104 to $133should not be considered a surprise. Unfortunately, it is difficultto structure covered calls against the April $130 or $135 strikeon a monthly basis because some of the short sale candidates
122 THE OPTION TRADER’S WORKBOOK

have virtually no value. More specifically, both the January andthe April $135 calls would be worth only 10¢ at the time of sale.Generally speaking, it is more reasonable to allow short-termrisk parameters for each short option sale to drive strike priceselection.
Summary
Our discussion began with traditional covered calls that are struc-tured with long stock and an equivalent number of short calls. As wehave seen, the dynamics of position management change dramaticallywhen long calls are substituted for long stock or long puts replaceshort stock, because stock always has a delta of 1.00 and options obvi-ously do not.
The present discussion focused on covered trades in which theshort side has less favorable terms and potential losses are somewhatlimited. The next section will expand this discussion to include tradestructures in which the time decay of a far-dated long position is offsetby near-dated options with a more favorable strike price. Such trades,because they are uncovered, require a more sophisticated approach torisk management.
Finally, we will build on these dynamics with more complex struc-tures that involve ratios where the two sides—long and short—con-tain different numbers of contracts. These trades can take manydifferent forms, including some that are quite complex. All variationsinclude uncovered short components. Risk management will play anincreasingly important role as the complexity increases. Generallyspeaking, not losing money is the most efficient way for an optiontrader to generate a profit.
CHAPTER 3 • COVERED PUTS AND CALLS 123

This page intentionally left blank
271
INDEX
Aabsolute values, 220Amazon.com (AMZN), 19analysis
statistical analysis facility,258-264
tools, 16-21“A New Method to Determine the
Value of Derivatives,” 23announcements, exploiting,
207-209, 212-216annualizing volatility
calculations, 51Apple Computer (AAPL), 93, 214
covered calls and puts, 142differential volatility, 67price spike chart for, 104ratio calls
backspread, 167spreads, 164
volatility smiles, 72arbitrages, 25
Black-Scholes model, 32Asia, market collapse in(1997), 2ask, assumptions of stock rise and
fall, 6assessing volatility, 47-48
calculating historical, 50-60profiling price change behavior,
61-75standard deviations and, 48-50
at-the-money straddle, 238
BBachelier, Louis, 24backspread, ratio call, 167backup facilities, 248Banc of America Securities, 245Base Volatility column, 87Bear Sterns (BSC), 92Behavior, profiling price change,
61-75bid, assumptions of stock rise and
fall, 6bid-ask spreads, 77, 79-82binomial trees, 42-44Black Rock (BLK), 92Black, Fischer, 23, 31Black-Scholes model, 5, 24,
29-32, 265calculations, 50, 82Greeks, utilization of
Delta, 33-37Gamma, 37-39Rho, 41-42Theta, 40-41Vega, 39-40
volatility smiles, 71-72Bollinger Bands, 65-67Brownian motion model, 28-29building toolsets, 243-244
data mining, 252-257data visualization tools, 245-247database infrastructure, 248-251statistical analysis facility,
258-264trade modeling facility, 264-268
butterfly spreads, 183-186

Ccalculations
Black-Scholes, 82Bollinger Bands, 65-67historical volatility, 50-60intraday volatility, 110-111option volatility, 86price spike, 63VIX, 195-201volatility, 17, 50
calendarsintegrity databases, 248-249ratio calls, 176spreads, 152-162
callscovered, 137-143diagonal spreads pricing, 153-156options, 12ratio
backspread, 167calendar spreads, 176trades, 164
reverse calendar spreads, 159single-sided put and call
positions, 100, 103-118straddles, 118-136strangles, 118-136
CBOE (Chicago Board OptionsExchange), 5, 23
CBOT (Chicago Board of Trade), 5Cephalon (CEPH), 62Chairman of the U.S. Federal
Reserve, influence of, 3chaos, operation of price discovery,
7-9charts
data visualization tools, 245-247database infrastructure, 248-251
price spike for Apple (APPL), 104technical limitations of, 9-12
Chicago Board of Trade (CBOT), 5Chicago Board Options Exchange
(CBOE), 5, 23Chicago Board Options Exchange
Volatility Index (VIX), 38closing price, standard deviation
of, 65collapse (volatility)
exploiting, 216-222final trading day, 229
collateral requirements, 187long/short contracts, 81
combinations, strangles, 118-136complex positions
calendar and diagonal spreads,152-162
hedging with the VIX, 195-201managing, 151multipart trades, 182
butterfly spreads, 183-186condors, 187-195
multiple expiration dates,175-182
ratio trades, 162-175condor trades, 187-195
bid-ask spreads, 79-82context discovery, 253continuous stream of transactions,
creation of market liquidity, 6contracts
binomial trees, 42-44Bollinger Bands, measuring
volatility, 65-67collateral requirements, 81liquidity, affect on, 91-94
covered calls and puts, 137-143Cox, John, 42
272 THE VOLATILITY EDGE IN OPTIONS TRAINING

Cox-Ross-Rubenstein model, 44crashes
of 1987, 6cause of, 7October 1929, 4September 11, 2001, 16
Credit Fund, 3currency, Japanese, 257CurrencyShares Japanese Yen Trust
(FXY), 255cycles
earning, 205-206implied volatility collapse,
216-222scheduled announcements,
207-216single-sided put and call posi-
tions, 100-118volatility, 69-71
Ddaily price changes, distribution
of, 4data cleansing programs, 248data export facilities, 248data import facilities, 248data mining, 252-257data visualization tools, 245-247database infrastructure, 248-251days preceding expiration, 237-240decay (time), days preceding
expiration, 237-240decimal/system/calendar date
conversion, 248-249deep in-the-money options,
116-118delay neutral positions, 232Dell (DELL.O), 92
Delta, 32-33utilization of, 33-37
delta-neutral, 210strangles, 215
Department of Energy OilInventory Report, 69
Depositary Receipts (SPDRs), 255Der Hovanesian, Mara, 245Deviations of standard normal
distributions, 27diagonal spreads, 152-162DIAMONDS Trust (DIA), 92, 190differential volatility, 67-69discovery
content, 253price, 6-9
distances of strikes, 226-236distribution
of daily price changes, 4kurtosis, 74standard normal, 27
dividends, Black-Scholes model, 31Division of Market Regulation of
the Securities and ExchangeCommission, 1
DJIA (Dow Jones IndustrialAverage), 1
download facilities, 248
Eearnings
cycles, 205-206implied volatility collapse,
216-222scheduled announcements,
207-209, 212-216price earnings ratios, 210put-call parity violations, 78,
89-90volatility swings, 78-88
Index 273

efficient market hypothesis (EMH), 25
European-style options,Black-Scholes model, 29-32
event extraction, 252expiration
datesfour-sided positions, 192-195multiple expiration dates,
175-182ratio trades, 162-175strike price considerations, 116
deltas and, 35out-of-money options, 106trading, 225
days preceding expiration,237-240
final trading days, 226-236weeks, volatility swings in, 87
extraction, event, 252Exxon Mobil (XOM), 69
Ffair volatility, 47Fairfax Financial Holdings
(FFH), 92Fama, Eugene, 25FedEx (FDX), 228final trading days, 226-236financial analysts, opinions of, 3Ford (F), 3forecasting, 11four-sided positions, 187, 190-195
GGamma, 32-33
utilization of, 37-39GDP (gross domestic product), 3General Motors (GM), 3
geometric Brownian motion model,28-29
GLG Partners, 3gold process, 26Goldman Sachs (GS), 90
price spikes as triggers, 113-115Google (GOOG), 88
earnings cycles, 208earnings-associated price
spikes, 213final trading days, 228four-part trades, 192implied volatility collapse, 217
Greeks, utilization of, 32-33Delta, 33-37Gamma, 37-39Rho, 41-42Theta, 40-41Vega, 39-40
gross domestic product (GDP), 3
Hhedging with the VIX, 195-201high kurtosis, 73historical volatility, 48, 207-209,
212-216calculating, 50-60
holidays, historical volatility, 51HOLX (Hologic, Inc.), 18
IIBM, 14,247implied volatility collapse,
exploiting, 216-222indexes
mathematical properties of, 4VIX, 5, 53, 195-201
infrastructure, databases, 248-251
274 THE VOLATILITY EDGE IN OPTIONS TRAINING

interest rate values, Rho, 41-42intraday volatility, 110-111investment strategies, 2-4
J–KJapanese currency, 257Journal of Political Economy, 23
KOSP (KOS Pharmaceuticals,Inc.), 18
kurtosis, 73-75
Llimitations of technical charting,
9-12liquidity, 78, 91-94
markets, 6long butterfly trades, 184long contracts, 81long positions, 47long straddles, 118-129, 209long strangles, 120-129long synthetic stock positions,
143-146Lotus development Corp., 14
MMalkiel, Burton, 25-27managing
complex positions, 151calendar and diagonal spreads,
152-162hedging with the VIX, 195-201multipart trades, 182-195multiple expiration dates,
175-182ratio trades, 162-175
option positions, 4
positions, 99covered calls and puts, 137-143single-side put and call,
100-118straddles, 118-136strangles, 118-136synthetic stock, 143-146
risk. See risk-managementmarkets
chaos, operation of price discovery, 7-9
crashes. See crashesliquidity, 6movement, effect on volatility, 16stability, 6-9technical charting, limitations of,
9-12martingales, 24mathematical properties, 4measurements
Bollinger Bands, 65-67volatility, using sliding windows
to, 52-60MedcoHealth Solutions (MHS),
straddles/strangles, 126Merton, Robert, 23models
binomial trees, 42-44Black-Scholes, 5, 29-32
calculations, 50Deltas, utilization of, 33-37Gamma, utilization of, 37-39Rho, utilization of, 41-42Theta, utilization of, 40-41Vega, utilization of, 39-40volatility smiles, 71-72
Black-Scholes pricing, 24Brownian motion, 28-29
Index 275
Cox-Ross-Rubenstein, 44random-walk, 25-29trade modeling facility, 264-268
movement, effect of on volatility, 16multipart trades, 182
butterfly spreads, 183-186condors, 187-195
multiple expiration dates, ratiotrades that span, 175-182
Nnaked positions, 13naked short trades, 221-222NASDAQ
drawdown of 2000, 6volatility of, 4
negative kurtosis, 73neutral kurtosis, 73Nobel Prize in Economic
Sciences, 23nonearnings spikes, 220
OOil Service HOLDRS Trust (OIH),
83, 188opposing position, 137“Option Pricing: A Simplified
Approach,” 42options
deep in-the-money, 116-118out-of-money, 106out-of-the-money, 167positions
covered calls and puts, 137-143managing, 99single-sided put and call, 100,
103-118straddles, 118-136strangles, 118-136synthetic stock, 143-146
ratio trades, 162-175that span multiple expiration
dates, 175-182out-of-money options, 106out-of-the-money option, 167overnight exposure, 119
Pparameters
liquidity, 91tables, 248
parity, put-call, 25Philadelphia Gold/Silver Index
(XAU), 253planned events, volatility swings,
78-88positions
complexcalendar and diagonal spreads,
152-162hedging with the VIX, 195-201managing, 151multipart trades, 182-195multiple expiration dates,
175-182ratio trades, 162-175
covered calls and puts, managing,137-143
four-sided, 187-195managing, 99modeling, 268single-side put and call, 100,
103-118straddles, 118-136strangles, 118-136synthetic stock, 143-146
positive kurtosis, 73predictions, random-walk
hypothesis, 25-29
276 THE VOLATILITY EDGE IN OPTIONS TRAINING

premium, 15pricing
binomial trees, 42-44Black-Scholes model, 24, 29-32change behavior, profiling, 61-75diagonal call spreads, 153-156discovery, 6-9earnings ratios, 21price spikes
calculations, 63for Apple (APPL), 104standard deviations, 67as triggers, 113
random-walk hypothesis, 25-29standard deviation, 48-50, 65strike price, 116. See also
strike priceproperties, mathematical, 4put-call parity, 25
violations, 78, 89-90puts
covered, 137-143options, 12single-sided put and call
positions, 100-118straddles, 118-136strangles, 118-136
Q–Rquarterly earnings, 205-206
implied volatility collapse,216-222
scheduled announcements,207-216
A Random Walk Down Wall Street, 25
random-walk hypothesis, 25-29
ratiosmultiple expiration dates,
175-182price earnings, 210trades, 162-175
reduced collateral requirements, 187
releases, earnings, 85returns, volatility, 48-50reverse calendar spreads, 152, 159Rho, 32-33
utilization of, 41-42rising volatility
advantages of, 209ratio call spreads, 174
riskassessment
Greeks, Delta, 33-37Greeks, Gamma, 37-39Greeks, Rho, 41-42Greeks, Theta, 40-41Greeks, utilization of, 32-33Greeks, Vega, 39-40
calendar and diagonal spreads, 153
condors, 188overnight exposure, 119short straddles/strangles, 135-136
risk-management, 13investment strategies, 2
Ross, Stephen, 42Rubenstein, Mark, 42Ryland Group (RYL), 121
Sscheduled announcements,
exploiting, 207-216Schlumberger Limited (SLB), 217
Index 277

Scholes, Myron, 23. See alsoBlack-Scholes model
Sears (SHLD), 79SEC (Securities and Exchange
Commission), 1Securities and Exchange
Commission. See SECsemi-strong efficiency, 26September 11, 2001, effect on
markets, 14short butterfly trades, 184-186short contracts, 81short positions, 13
volatility, assessing, 47short straddles, 119, 130-136short strangles, 130-136short synthetic stock positions,
143-146single-sided put and call positions,
100-118skewed volatility, 71-72skewness, 73-75sliding windows, measuring
volatility, 52-60smiles, volatility, 71-72software, 245
data mining, 252-257data visualization tools, 245-247database infrastructure, 248-251
spanningdifferent expiration dates,
four-part trades, 192-195multiple expiration dates, ratio
trades, 175-182spreads
bid-ask, 77-82butterfly, 183-186calendar
ratio call, 176and diagonal, 152-162reverse, 159
stability of markets, 6-9Standard & Poor’s (S&P), 255standard deviation
log of the price, 65price spikes, 67volatility and, 48-50
standard normal distribution, 27statistical analysis facility, 258-264stocks
assumptions of rise and fall, 6data mining, 252-257expiration cycles, 226-236.markets, 9. See also marketsmathematical properties of, 4ratio trades, 162-175
that span multiple expirationdates, 175-182
statistical analysis facility,258-264
synthetic stock positions,143-146
trade modeling facility, 264-268straddles, 13
managing, 118-136time decay cost of, 209
strangles, 13managing, 118-136
strategiesimplied volatility collapse,
216-222investment, 2-4scheduled announcements,
207-209, 212-216strike price, 12
butterfly spreads, 183-186condors, 187, 190-195expiration date
considerations, 116synthetic stock position, 145
278 THE VOLATILITY EDGE IN OPTIONS TRAINING

strikes, distances of, 226-236strong-form efficiency, 26summaries, data visualization tools,
245-247surface, volatility, 44swings, volatility, 78-88synthetic stock positions, 143-146
Ttables
parameters, 248templates, 248
technical analysis systems, 26technical charting, limitations of,
9-12templates, tables, 248ten contract strangle, 212terminology, overview of, 12-15terrorism, effect on markets, 14Theta, 32-33
increasing, 209utilization of, 40-41
time decaycost of straddles, 209days preceding expiration,
237-240deltas and, 35short straddles/strangles, 130-136straddles and strangles, 119Theta, 40-41
time series correlation, 253tools, analysis, 16-21toolsets (building), 243-244
data mining, 252-253, 255, 257data visualization tools, 245, 247database infrastructure, 248-251statistical analysis facility,
258-264trade modeling facility,
264-265, 268
Toyota Motor (TM), 246-247trade modeling facility, 264-268trading
bid-ask spreads, 79-82condor trades, bid-ask spreads,
79-82earnings cycles, 205-206
implied volatility collapse,216-222
scheduled announcements,207-216
expiration cycles, 225days preceding expiration,
237-240final trading days, 226-236
liquidity, 91-94multipart trades, 182
butterfly spreads, 183-186condors, 187, 190-195
naked short, 221-222ratio trades, 162-175
that span multiple expirationdates, 175-182
toolsets (building), 243-244data mining, 252-257data visualization tools,
245-247database infrastructure,
248-251statistical analysis facility,
258-264trade modeling facility,
264-268volatility cycles, 69-71
trading year, volatility calculations, 50
transactions, stocks, 6trees, binomial, 42-44triggers, price spikes as, 113
Index 279

UU.S. Federal Reserve, influence of, 3uncovered positions, 13United States, GDP (gross domestic
product), 3University of Chicago Graduate
School of Business, 25USNA Health Sciences (USNA),
straddles/strangles, 123utilization of Greeks, 32-33
Delta, 33-37Gamma, 37-39Rho, 41-42Theta, 40-41Vega, 39-40
Vvalues
absolute, 220interest rates, 41-42
Vega, 32-33utilization of, 39-40
violations, put-call parity, 78, 89-90visualization tools, 245-247VIX (volatility index), 5, 53
hedging with, 195-201
volatility, 4analytical tools, 16-21assessing, 47-48Black-Scholes model, 31-32calculations, 17, 50collapse, final trading day, 229cycles, trading, 69-71differential, 67-69fair, 47historical, 48-60intraday, 110-111price change behavior, profiling,
61-75rising, ratio call spreads, 174short straddles/strangles, 135-136smiles, 71-72and standard deviation, 48-50surface, 44swings, 78-88
volatility index. See VIX
W–Zweak-form efficiency, 26weekends, historical volatility, 51windows, measuring volatility,
52-60
Yahoo! (YHOO), earnings-relatedprice spikes for, 219
280 THE VOLATILITY EDGE IN OPTIONS TRAINING