Embed Size (px)
Citation preview

lent or Functional
Responsibility


AN INFORMATION REPORT
Pragmatic Federalism: The Reassignment
of Functional Responsibility
a Advisory Commission on 1 Intergovernmental Relations WASHINGTON, D. C. JULY 1976
M-105


Preface
P ursuant to its statutory responsibilities outlined in Section 2 of Public Law 380, passed by the first session of the 86th Congress and approved by the President on September 24, 1959, the Commission singles out for study and recommendation particular problems impeding the effectiveness of the federal system.
The assignment of functional responsibilities was first identified as an important intergovernmental problem by the Commission in 1963. In that year, we issued an information report on the Performance of Urban Functions: Local and Areawide that described 15 major urban functions and the various criteria pertaining to the appropriate area of jurisdiction for each of these functions. Eleven years later, in Govern- mental Functions and Processes: Local and Areawide, the Commission updated this study, refined the crite- ria, and made recommendations for state and Federal action to develop functional assignment policies and undertake functional assignment reevaluations.
This information report is the third phase of the Commission's research in this area. It presents infor- mation that has been collected for the first time on the extent of, reasons for, and results from municipal transfers of functional responsibilities. The fourth phase, to be completed later this year, will probe state assumptions of functions and mandating of local responsibilities. Both of these reports are the work of Joseph F. Zimmerman, professor of political science at the State University of New York, Albany. The Com- mission is grateful to Dr. Zimmerman for these efforts and hopes that they will lead to more informed discus- sion of and action on the assignment of functional responsibilities in our federal system.
Robert E. Merriam Chairman
iii


Contents Foreword . . . . . . . . . . . . . . . . . . . . . . . . . . . . . . . . . . . . . . . . . . . . . . . . . 1
Chapter I Introduction . . . . . . . . . . . . . . . . . . . . . . . . . . . . . . . . . . 3 The State and Functional Reallocation . . . . . . . 4 ACIR Criteria . . . . . . . . . . . . . . . . . . . . . . . . . . . . 7
Chapter 11 Constitutional and Statutory Provisions . . . . . . . . . . . 9 Chapter III County Assumption of Responsibility for Functions 15
Home Rule Counties . . . . . . . . . . . . . . . . . . . . . . 17 Chapter IV State Assumption of Functional Responsibility . . . . . 19 Chapter V Functional Assignments in Transition . . . . . . . . . . . . . 25
Transfers of Functional Responsibility . . . . . . . 26 Types of Functional Transfers . . . . . . . . . 34 Recipients of Transfers . . . . . . . . . . . . . . . . 38
. . . . . . . . . . . . . . . . . Reasons for Transfers 38 Results of Transfers . . . . . . . . . . . . . . . . . . 44 Effects on Middle-Tier Units . . . . . . . . . . . 49 Plans for Future Transfers . . . . . . . . . . . . . 53 Other Service Arrangements . . . . . . . . . . . 54
Assumption of Functional Responsibility . . . . . 57 Private Firms . . . . . . . . . . . . . . . . . . . . . . . . 59
. . . . . . . . . . . . . . . . . . . . . . . . . The County 60 . . . . . . . . . . . . . . . . . Another Municipality 60 . . . . . . . . . . . . . . . . The State Government 60
. . . . . . . . . . State-Mandated Assumptions 62 . . . . . . . . . . . . . . . . . . . . . . . . . . Chapter VI Pragmatic Federalism 63
. . . . . . . . . . . . . . . Summary of Survey Findings 63 Assumption of Functional Responsibility 65
. . . . . . . . . . . Who Should Provide the Services? 65 . . . . . . . . . . . . . . . . . . ACIR Recommendations 68
. . . . . . . . . . . . . . . . . . . . . . . . . . . . . . Conclusions 69 Functional Transfers and the Federal System . 70


Foreword
T he adoption of a federal system of government necessitates the assignment of complete or partial responsibility for the various governmental functions and components of functions to each level of govern- ment. The United States Constitution is the document that makes the assignment of functional responsibili- ties between the national and the state levels, and state constitutions and statutes make a similar assignment between the state and the local levels.
The drafters of the United States Constitution envisioned a national government exercising dele- gated powers and states exercising reserved or resid- ual powers not prohibited by the Federal or state constitutions. Federal constitutional amendments, statutory elaboration of constitutional grants of power, conditional grants-in-aid to state and local governments, and judicial interpretations of constitu- tional provisions over the years have produced a substantial increase in the functional involvement of the Federal government. As a consequence, we find the Federal government engaged today in activities that once were considered to be the exclusive respon- sibility of state and local governments.
The formal dividing line between state and local government responsibility for specific functions also has been altered in many states by a number of developments, particularly the adoption of constitu- tional home rule amendments. The early home rule amendments attempted to divide responsibility for all governmental functions between the state government and local governments, and to forbid state interfer- ence with functions assigned to local governments. This imperium in imperio type of home rule was negated generally by court decisions narrowly inter- preting the constitutional grant of powers to local governments. A 1953 report by Jefferson B. Fordham suggested removing from the judicial system the responsibility for determining the dividing line be- tween state powers and local powers.1 All states adopting constitutional home rule amendments since the issuance of the Fordham report generally have followed its recommendation that local governments be authorized to exercise any power the legislature is capable of devolving subject to preemption or super-
session by general law. The legislature, under the Fordham Plan, is forbidden to pass a special act affecting a single local government unless the govern- ing body of the unit has requested the enactment of the law.
State supreme courts have interpreted Fordham- type home powers both broadly and narrowly. In Massachusetts, for example, the supreme judicial court upheld the creation of the Human Relations Commission by the Worcester City Council. The creation of the council had been challenged on the ground the city exercised a power that was "inconsist- ent" with the general laws enacted by the general court on the subject of human rights. The supreme judicial court, in 1973, ruled that "in the absence of any express legislative intent to forbid local activities consistent with the purpose of the state's anti- discrimination legislation, and in the absence of any circumstances indicating that any legislative purpose would be frustrated and from which, therefore, a legislative intent to preempt the field would have to be inferred, the ordinance in question was, as a whole, valid and authorized by law."2
The supreme judicial court, in a 1975 case, construed home rule powers narrowly. Acting under the authority of its home rule charter, the Methuen Town Council reorganized all town agencies. The planning board was made an appointed body and increased in size from five to seven members. In addition, the term of office of members of the board was reduced from five to three years. The town administrator failed to appoint to the new board the two members of the old board whose terms of office had not expired. The two members brought suit seeking to be restored to the board. The supreme judicial court, on June 4, 1975, ruled that the term of office for members of the planning board could not be less than five years since the town had accepted section 81A of the General Laws which provides for a planning board with a five-year term for members and which applies to all cities and towns with a population over 10,000 except Boston.3
Responding to pressures created by rampant ur- banization during the past 30 years, many state

legislatures have enacted statutes mandating the transfer of responsibility for functions and compo- nents from one level to another level of government or to the state government, and also have enacted laws authorizing local governments to voluntarily transfer responsibility for functions and to enter into agree- ments for the receipt of services with other govern- mental units.
Responsibility for a function or component has been informally o r formally transferred by one gov- ernment to another with increasing frequency during the past three decades. An earlier study documented the extent to which municipalities over 2,500 popula- tion have entered into formal and informal agree- ments for the provision of services to their citizens by other governmental units and private firms.4 The use of service agreements for the receipt of services may be viewed as an informal and temporary-type func- tional transfer in which administration of the function is centralized, but policy-making remains decentral- ized.
This report builds upon the earlier study of inter- governmental service agreements by presenting and analysing data on the formal transfer by municipali- ties over 2,500 population of responsibiiity for func- tions and components of functions to other govern- mental units and data on the assumption of responsibility by these municipalities for functions and components never previously performed. The title of this report aptly describes the nature of American federalism in action, a system that has proved to be amazingly flexible in adapting to chang- ing conditions.
Data on transfers and assumptions of functional responsibilities by municipalities over 2,500 popula- tion were collected 'cooperatively by the Advisory Commission on Intergovernmental Relations, the International City Management Association, and the State University of New York at Albany. Several individuals associated with each of the cooperating
organizations contributed to this report. David T. Rowel1 and Sanford F. Schram of the university's Graduate School of Public Affairs prepared the computer program for the analysis of the data and merged the files with the assistance of James J. Quinn of the university's Computer Center. Mrs. Hilda A. Scanlon, the university's supervisor of key punching, was most helpful in arranging for the transfer of data from the questionnaires to computer cards. The contribution made by David T. Rowell, Crystal J. Smith, and Margaret B. Zimmerman in reviewing and editing the questionnaire returns prior to key punch- ing is gratefully acknowledged as is the legal research conducted by David T. Rowel1 and David R. Lynch. Mrs. Edith K. Connelly kindly typed part of the manuscript and Richard L. Tastor solved the admin- istrative problems connected with the university's participation in the joint project.
Barbara H. Grouby, Linda K. Ganschinietz, and Stanley M. Wolfson of the International City Man- agement Association's Data Services Center helped to develop and code the survey questionnaire. Emily Evershed and Betty Lawton of the association's publi- cation center handled the final editing, layout, and production of the Urban Data Service Report which was the first of the series of three publications flowing from the survey.5 The third publication will be an article - "Transfers of Functional Responsibilities" - in the 1976 County Year Book.
David B. Walker and Carl W. Stenberg of the Advisory Commission on Intergovernmental Rela- tions participated in the design of the survey and the questionnaire. Margaret Moore of the ACIR staff was particularly helpful in coordinating the activities of the Commission, the association, and the university throughout the study.
Joseph F. Zimmerman Delmar, New York March 1976
FOOTNOTES
'Jefferson B. Fordham, Model Constitutional Prox,ision.s for Mu- nicipal Home Rule (Chicago: American Municipal Association. 1953).
2Bloom v. City of Worcester, 293 N . E . (2nd) 268 (1973). 3DelDuca v. Town Administrator of Methuen, 329 N . E . (2d) 748 (1975).
4Joseph F. Zimmerman, "lntergovernmental Service Agreements
and Transfer of Functions: in Advisory Commission on Intergov- ernmental Relations. Substate Regionulisn~ and the Federal System, Volume i l l , Challenge of Local Government Reorganiza- tion (Washington, D.C.: U.S. Government Printing Office, 1974). pp. 29-52 and 176-84. See also Joseph F. Zimmerman, "Meeting Service Needs through lntergovernmental Service Agreements," Tire Municipal Year Book: 1973 (Washington, D.C.: International City Management Association, 1973), pp. 79-88, and Joseph F. Zimmerman, "lntergovernmental Service Agreements for Smaller Cities," Urban Data Service Report, January 1973, entire issue.
3Joseph F. Zimmerman, "Municipal Transfers of Functional Re- sponsibilities," Urban Data Service Report, September 1975, entire issue.

Chapter I
Introduction
P ragmatism has been characteristic of the rela- - tionship between the levels of government in the American federal system. The pragmatic nature of the system has come into clearer focus during the past three decades as responsibility for various govern- mental functions or components of functions (such as police communications) has been shifted from one governmental unit to another unit. Most transfers have been vertical - between levels of govern- ment - but some transfers have been horizon- tal - between governmental units on the local level. Although the bulk of the vertical transfers have involved the elevation of responsibility to a higher level of government, pressures began to grow in the 1960s for the devolution of responsibility for some functions and components of functions.'
In an earlier report, we documented the extent of informal functional consolidation or transfer of func- tional responsibility resulting from municipalities entering into agreements for the provision of services to their citizens by other governmental units.2 We refer to intergovernmental service agreements as a form of informal functional consolidation since agree- ments are not permanent and the unit contracting for a service retains responsibility for providing the ser- vice.
The permanent transfer of responsibility for func- tions and components of functions has become more common in recent years for three principal reasons. First, an increasing number of municipal officials and citizens are becoming convinced that certain services can best be provided by a unit with a larger areal base than a municipality. As a consequence, there has been a resurgence of efforts to modernize county govern- ments and authorize them to perform new functions such as airports, air pollution abatement, civil de- fense, fire and police protection, industrial develop- ment, sewage disposal, and water supply.
Second, the growing magnitude of a number of areawide problems, particularly environmental ones, and failure to muster sufficient support among the

electorate for the creation of a metropolitan govern- ment have combined in some states to promote interest in the upward shift to the county and state levels of responsibilities for functions perceived to be best performed on a broader geographical basis. Since organized county governments exist in all but three states3 and 99 Standard Metropolitan Statistical Areas (SMSAs) fall within the confines of a single county, many reformers have concluded that the most feasible approach to the creation of an areawide government is the restructuring of the existing county government and endowing it with additional powers.4
Third, the growing fiscal problems of municipali- ties, which have been compounded by the current economic recession, have induced municipalities to voluntarily transfer responsibility for one or more expensive functions to the county, regional special district, or the state. Most of the older central cities have been experiencing serious financial problems because they have lost population and parts of their commercial and industrial tax base to suburban communities while experiencing an influx of low- income, or "high-cost" citizens during the past 30 years.
We may view functional consolidation on a higher governmental level resulting from a transfer of re- sponsibility as complete or partial; i.e., responsibility for all components of a function or only one compo- nent of a function may be transferred. A case in point is the shift of responsibility for police communica- tions to the county level while all other police func- tions remain on the municipal level.
The achievement of economies of scale, more even service provision throughout the entire area, and a more equitable system of financing the service are the principal arguments advanced in favor of an upward shift of functional responsibility. We must point out that partisan considerations may be at least partially responsible for a transfer. Economies of scale may not result from a transfer, even though unit costs gener- ally tend to decrease with an increase in output, because diseconomies may be encountered as output continues to increase.'
The' transfer of responsibility for certain functions and components, such as police communications and tax collection, does not involve significant questions of equity. Relative to other functions and compo- nents, whether efficiency and equity will be improved depends, of course, on the quality of the service provided by the upper-tier unit and the method of financing the service compared to the quality of the service provided and the method of financing em- ployed by cities, towns, and villages. Nevertheless,
equity usually is improved as responsibility for func- tions and components is shifted upward. Unfortu- nately, few studies have been conducted to determine whether the transfers have achieved their objectives. In Chapter V we report the results of functional transfers as perceived by municipal officials.
Accompanying the upward shift of functional responsibility during the past decade has been another trend - assumption by many municipalities of re- sponsibility for functions never previously performed such as public transportation and solid waste collec- tion. Responsibility for public transportation has been assumed in a number of cases to preserve a service threatened by the bankruptcy or near bank- ruptcy of the local private transportation company. In other instances, the state has mandated that munici- palities assume responsibility for a new service such as operation of a sanitary landfill.
THE STATE AND FUNCTIONAL REALLOCATION
There has been relatively little state interest in a comprehensive reallocation of functional responsibili- ties. Five states - New Jersey, New York, California, Maryland, and Hawaii - have created major study commissions during the past decade.
The New Jersey County and Municipal Govern- ment Study Commission, created in 1966 and popu- larly known as the Musto Commission,6 examined criteria for the allocation of responsibility for local and areawide functions and components.7 The com- mission in 1969 recommended modernizing county governments and authorizing them "to provide other services as need arises and local leaders desire them."s In a subsequent report, the commission recommended that the county should be responsible for developing regional landfills for solid waste.9
In 1970, Governor Nelson A. Rockefeller of New York appointed the Temporary Commission on the Powers of Local Government.Io Chaired by former New York City Mayor Robert F. Wagner, the com- mission became popularly known as the Wagner Commission and submitted three reports in 1973. One of its major recommendations was a constitutional amendment requiring "a referendum with a single countywide majority for the adoption of a county charter when no transfer of function is involved."^^ The commission also recommended that the power to transfer responsibility for functions from cities, towns, and villages should be limited to counties that have adopted charters subject to approval by a major- ity of the voters in the county.12

The Wagner Commission recommended that re- - Local property assessors should be re- sponsibility for the following functions and compo- quired to meet minimum state qualifica- nents of functions be shifted to county governments: tions.14
police support services such as communi- cations, laboratories, equipment stand- ards, records, research, and training; solid waste disposal outside of New York City; construction and maintenance of sewage treatment facilities and major sewer trunk lines; road maintenance including snow removal outside of New York City (Larger munici- palities, however, "should have the option of performing such services themselves with reimbursements from the county in which they are located."); provision of bus service; assessment of real property except in the six largest cities; and approval or disapproval of land use plans and zoning ordinances of cities, towns, and villages.13
The commission also recommended the partial and complete assumption of responsibility for specified functions by the state.
The New York State Environmental Facil- ities Corporation should be authorized to initiate solid waste disposal projects where localities are unable to act.
The Environmental Facilities Corporation should be authorized to construct sewage disposal facilities if a local government "has failed to correct deficiencies over a specified period of time."
"Decisions with respect to the allocation of major new water sources among com- peting jurisdictions should be made at the state level . . ."
The state should establish additional standards for various police activities, including the purchase of equipment, re- cordkeeping, and minimum police force size requirements.
Water quality standards should be estab- lished and enforced by the state.
The California Council on Intergovernmental Re- lations issued a report in 1970 containing criteria for the assignment of functional responsibilities and two major recommendations for the shift of functional responsibilities.15 The council recommended that the state "assume policy and financial responsibility for the foundation school programs" and the functions of special districts should be shifted to cities and coun- ties.16
In a September 8, 1972, speech, California Gover- nor Ronald Reagan asked: "Do we have the will and the courage to look at our governmental structure; to evolve a practical plan whereby tasks and services performed by government will be assigned to those levels of government best qualified to handle them regardless of what has been the pattern of the past; to construct a revenue system to match with sufficient tax resources for the tasks assigned to each level of government?"17
Governor Reagan appointed the Task Force on Local Government Reform in early 1973 to critically analyze the state's 58 counties, 407 cities, 1,140 public school districts, and 4,155 non-school districts. A survey of California citizens by Haug and Associates, commissioned by the task force, revealed that "there is a strong preference by citizens to maintain the autonomy of local governments, instead of elevating authority to higher levels of government," and citizens favor the decentralization of governmental authority to the local level.18
In its 1974 report, the task force offered several recommendations relating to the transfer of func- tional responsibility:
A local government policy review board should be established "to review all pres- ent and proposed allocations of functions and fiscal resources to and among local governments and make recommendations to the governor and the legislature for program and tax system realignments."
The local government policy review board should study the state-local tax system and suggest changes designed to ensure that local governments possess sufficient taxa- tion powers to meet their functional re- sponsibilities.
The legislature, upon the receipt of recom- mendations from the local government policy review board, should reassign func-
. tional responsibility from the state level to the local level, and base the reassignment on the principle that authority and respon- sibility for each function should rest at only one level of government.19
This report clearly favors a "layer-cake," as opposed to a "marble-cake," type of federalism within the state.
The Maryland Commission on the Functions of Government was created in 1972 and charged with conducting "an in-depth study of the various func- tions of government in the State of Maryland, in order to define those functions which should be solely the responsibility of the state, those functions which should be solely the responsibility of the local subdivi- sions, and those functions which should be jointly performed . . ."20
Reporting in July 197.5, the commission offered the following recommendations relating to functional assignment:
The state should phase out its use of the property tax and reserve the tax for exclu- sive use by local governments.
Financial responsibility for the operation of the election offices in Baltimore City and 23 counties should be assumed by the state.
Local governments should be allowed to impose stricter environmental standards than the standards set by a proposed new state department of environmental regula- tion.
The Maryland Environmental Service should be responsible for all water quality and solid waste environmental planning.
If a local government is unable or refuses to provide a water treatment facility, the Maryland Environmental Service "should take whatever action is necessary in arbi- trating and resolving the problem."
Responsibility for all professional and occupational licensing should be assumed by the state.
The secretary of the Department of Public Safety and Correctional Services, in coop- eration with the Fire and Rescue Services Advisory Council, should establish "min- imum standards for apparatus, equip- ment, facilities, and training of personnel for all fire and rescue companies . . ."
"Municipal police forces should be re- quired to meet minimum police standards within a fixed time period or be required to disband and contract with other police forces for services."
The state should encourage the consolida- tion of the police forces of small munici- pa l i t i e~ .~ '
We may summarize these four study commission reports on functional allocation as follows: New Jersey and New York recommended the assignment of additional functions to counties, New York and Maryland recommended state assumption of respon- sibility for additional functions, and California urged the devolution of functional responsibilities from the state level to the local level and establishment of a "layer-cake" type of federal system within the state.
Hawaii and Wisconsin are the only states currently studying the assignment of functions.22 The 1975 Hawaii Legislature created a 12-member reorganiza- tion commission and charged it with several duties, including a study of the "organization and distribu- tion of all state and county financial powers, func- tions, and responsibilities" and the "elimination of duplication and overlapping of services, activities, and functions." The commission is directed to submit its final report to the legislature within ten days after the 1977 Legislature convenes.
In October 1975, Governor Patrick J. Lucey of Wisconsin issued an executive order creating the Governor's Commission on State-Local Relations and Financing Policy and charging the Commission with "evaluating the relationship between state and local government in Wisconsin, their system of pro- viding and financing public services . . ." The com- mission was directed to report to the governor and the legislature by January 1, 1977.
Although Montana has not initiated a study of the possible reassignment of functional responsibilities, the 1972 state constitution mandates that the legisla- ture provide for a review of the structure of each local government and submission of one "alternative form

of government" to the voters no later than November 2, 1976.23 The review process must be repeated decen- nially. Under provisions of a 1974 law, 632 members of 182 county and municipal local government study commissions were elected.24 The review process may lead to two actions resulting in the transfer of func- tional responsibility. First, a municipality may vote to disincorporate, an action automatically transferring municipal functions to the county. Second, a city study commission and a county study commission may decide to draft a city-county consolidation char- ter; several groupings of a city study commission and a county study commission are exploring this possi- b i l i t ~ . ~ s
ACiR CRITERIA
The Advisory Commission on Intergovernmental Relations has been attempting to generate state-local interest in functional reassignment. To facilitate the rational reassignment of functional responsibilities, the Commission in 1963 developed the following seven criteria for the assignment of urban functions:
1. The governmental jurisdiction responsible for providing any service should be large enough to enable the benefits from that service to be consumed primarily within the jurisdiction.
2. The unit of government should be large enough to permit realization of the econo- mies of scale.
3. The unit of government carrying on a function should have a geographic area of jurisdiction adequate for effective per- formance.
4. The unit of government performing a function should have the legal and ad- ministrative ability to perform the ser- vices assigned to it.
5. Every unit of government should be re- sponsible for a sufficient number of func- tions so that it provides a forum for reso- lution of conflicting interests, with significant responsibility for balancing governmental needs and resources.
6. The performance of functions by a unit of government should remain controllable
by and accessible to its residents.
7. Functions should be assigned to that level of government which maximizes the con- ditions and opportunities for active citi- zen participation and still permits ade- quate p e r f o r m a n ~ e . ~ ~
The Commission, in a 1974 report, recommended that there be "a jointly developed state-local assign- ment of functions policy and pr0cess."2~ Responding to developments since its 1963 report, the Commis- sion in its 1974 report recast and simplified the as- signment criteria as follows:
1. Economic Efficiency. Functions should be assigned to jurisdictions (a) that are large enough to realize economies of scale and small enough not to incur diseconomies of scale (economies of scale); (b) that are willing to provide alternative service offerings to their citizens and specific services within a price range and level of effectiveness acceptable to local citizenry (service competition); and (c) that adopt pricing policies for their functions when- ever possible (public pricing).
2. Fiscal Equity. Appropriate functions should be assigned to jurisdictions (a) that are large enough to encompass the cost and benefits of a function or that are will- ing to compensate other jurisdictions for the service costs imposed or for bene- fits received by them (economic exter- nalities); and (b) that have adequate fiscal capacity to finance their public service responsibilities and that are willing to implement measures that insure interpersonal and interjurisdictional fiscal equity in the performance of a function fiscal equalization).
3. Political Accountability. Functions should be assigned to jurisdictions (a) that are controllable by, accessible to, and ac- countable to their residents in the perform- ance of their public service responsibili- ties (access and control); and (b) that maximize the conditions and opportuni- ties for active and productive citizen participation in the performance of a function (citizen participation).

4. Administrative Effectiveness. Functions should be assigned to jurisdictions (a) that are responsible for a wide variety of func- tions and that can balance competing functional interests (general-purpose character); (b) that encompass a geo- graphic area adequate for effective per- formance of a function (geographic ade- quacy); (c) that explicitly determine the goals of and means of discharging public service responsibilities and that periodi- cally reassess program goals in light of performance standards (management capability); (d) that are willing to pursue intergovernmental policies for promoting interlocal functional cooperation and re- ducing interlocal functional conflict (inter- governmental flexibility); and (e) that
have adequate legal authority to perform a function and rely on it in administering the function (legal adequacy).28
To assist state legislatures, the Commission drafted a model constitutional amendment and a bill to facili- tate the transfer of functional responsibility.29 The suggested constitutional amendment provides that "by law, ordinance, or resolution of the governing bodies of each of the governments affected, any func- tion or power of a county, municipality, or special district may be transferred to, or contracted to be performed by, another county, municipality, or special district as provided by law.")O In Chapter 11, we will examine the existing constitutional and statutory provisions relating to the transfer of func- tional responsibility and authorizing municipalities to enter into intergovernmental service agreements.
FOOTNOTES
!For an analysis of the neighborhood government movement, see Joseph F. Zimmerman, The Federated City: Community Control in Lorge Cities (New York: St. Martin's Press, 1972).
2Joseph F. Zimmerman, "Intergovernmental Service Agreements and Transfer of Functions" in Advisory Commission on Intergov- ernmental Relations, Substate Regionalism and the Federal System, Volume 111: Challenge of Local Government Reorganiza- tion (Washington, D.C.: U.S. Government Printing Office, 1974). pp. 29-52 and 176-84.
3Rhode Island and Connecticut abolished organized county gov- ernments in 1842 and 1960, respectively, and Alaska entered the Union without county governments in 1959.
4For factual information on county governments, see Advisory Commission on Intergovernmental Relations Profile of County Government (Washington, D.C.: U.S. Government Printing Office, January 1972).
5"Size Can Make a Difference - A Closer Look," ACIR Infor- mation Bulletin, September 16, 1970.
6New Jersey Lows of 1966, Chap. 28., William V. Musto was chairman of the commission.
7Creafive Localism: A Prospectus (Trenton: New Jersey County and Municipal Study Commission, 1968). pp. 88-104.
8County Government: Challenge and Change (Trenton: New Jersey County and Municipal Study Commission, 1969), pp. x- xiii.
9Solid Waste: A Coordinated Approach (Trenton: New Jersey County and Municipal Study Commission, 1972), p. 43.
10Public Papers of Governor Nelson A. Rockefeller: 1970 (Albany: Executive Chamber, n.d.), p. 918.
IISfrengthening Local Government in New York, Part 1: The Capacity for Change (New York: New York State Temporary Commission on the Powers of Local Government, 1973), p. 94.
I2lbid. IWrengthening Local Government in New York, Part 2: Services,
Structure & Finance (New York: New York State Temporary State Commission on the Powers of Local Government, 1973), pp. 13,23,29, 39.44, 50, and 60.
I4Ibid., pp. 14, 23, 29, 35, and 51. 15Allocation of Public Service Responsibilities (Sacramento: Cali-
fornia Council on Intergovernmental Relations, 1970). I6Ibid., pp. 16 and 20-2 1. I7The Numbers Game (Sacramento: The California Office of
Intergovernmental Management, n.d.), p. 5. 18Public Benefits from Public Choice (Sacramento: California
Task Force on Local Government Reform, n.d.), pp. 26-27. I9Ibid., pp. 52-54. 2oMaryland Senate Joint Resolution, Number 32, 1972. ZIReport of the Maryland Commission on the Functions of Gov-
ernment (Annapolis: July 1975). 22Hawaii Laws of 1975, Act 148; and Wisconsin Executive Order
Number 21, October 1975. 23Constitution of the State of Montana, Art. XI, $9. 24Revised Code of Montana, Title 16, Chap. 5 1. 15For further details, see Dale A. Harris, "Home Rule in Montana,"
a paper presented at the Fourth "Toward '76" Conference of the Center for the Study of Federalism, Chicago, Illinois, November 19, 1975.
26Advisory Commission on Intergovernmental Relations, Perform- ance of Urban Functions: Local and Areawide (Washington, D.C.: U.S. Government Printing Office, 1963), p. 41.
2'Advisory Commission on Intergovernmental Relations, Substate Regionalism and the Federal System, Volume IV: Governmental Functions and Processes: Local and Areawide (Washington, D.C.: U.S. Government Printing Office, 1974), p. 20.
Z8Ibid., p. 7. Z9Advisory Commission on Intergovernmental Relations, ACIR
State Legislative Program, Vol. 2, Local Government Moderniza- tion (Washington, D.C.: Advisory Commission on Intergovern- mental Relations, November 1975). pp. 97-107.
jolbid., p. 98.

Chapter I1
Constitutional and Statutory Provisions
A lthough most transfers of functional responsi- bility are accomplished on a voluntary basis, some have been mandated by the state legislature as in Massachusetts in 1968 when responsibility for public welfare was transferred from cities and towns to the commonwealth; the Massachusetts League of Cities and Towns had lobbied strenuously for a state take- over of complete responsibility for public welfare.'
Functional consolidation may be viewed as either permanent or temporary. Under the first form of consolidation, responsibility for a function is shifted permanently to a higher level, most often the county. Only ten states have general constitutional and/ or legislative authorization for the voluntary transfer of functional responsibility (see Table I). Four states have solely constitutional authority, one has only statutory authority, and five have a combination. A stipulation is not found in any of the constitutions or statutes making transfers permanent. Alaska, Califor- nia, Michigan, and Ohio provide for revocation of a voluntary transfer, while Pennsylvania requires the transfer action to cite its duration.
Constitutional and statutory provisions dealing with the voluntary transfer of functions fall into two main groups, those requiring voter approval - Flor- ida, New York, Ohio, Pennsylvania, and Vermont - and provisions that d o not - Alaska, Califor- nia, Illinois, Michigan, and Virginia. Transfers to the county level are hindered by the requirement of voter approval. T o cite only one illustration, the New York State Constitution requires the separate approval of voters of cities as a unit and voters of towns as a second unit within a county before a function can be transferred by a city or town to the county.2 The

Citation
Art. X, 513 Art. XI, 58 (a)
Art. VIII, 54 Art. VII, 510 Art. VII, 528 ~ r t . - l ~ , $1 (h)
Art. X, $1
Art. IX, 55 Art. VII, 53
529.33.260 5525204 and 51 330
55124.531-124.536 Municipal Home Rule
Law, 533-a Chap. 53,55481-89 Chap. 24, 554901-
4902 (b) (4)
Table 1
Authority for Transfer of Functions 1976
Approval of Approval of Concurrent Governing Body Governing Body Voter
of Transferor of Transferee Majorities Revocation
Constitutional Provisions
Alaska (city) California' (municipality) Florida Illinois' Michigan
Ohio1 (municipality or township) Pennsylvania Virginia
Pennsylvania Pennsylvania Virginia'
Statutory Provisions
Alaska1 Alaska (borough) California1 California (municipality) (county) Michigan Michigan
New York2 New York (county)
Pennsylvania Pennsylvania1 Vermont2 Vermont1 Vermont3
Alaska
Florida Florida Illinois1 Michigan New York2 New York (county) Ohio Ohio (county)
Ohio
California
Michigan New York
'The necessity of the consent of the governing body is implied, not explicitly stated. The Pennsylvania "Home Rule Charter and Optional Plans Law" -Act 62, 1972 - allowsacounty, by adoption of an ordinance, toexercise a power currently exer- cised by a municipality provided the municipality within 120 days does not enact an ordinance excluding the county from exercising the power within the municipality.
2Thecounty begins the act of transfer by local law or ordinance, but is not necessarily the body the function is transferred to as the county may transfer functions between and among the political subdivisions within it.
3The transfer also must be recommended by a joint survey committee from the municipalities and approved by the attorney general of the state.

States
Alabama Alaska Arizona Arkansas California Colorado Connecticut Delaware District of
Columbia Florida Georgia Hawaii Idaho Illinois Indiana Iowa Kansas Kentucky Louisiana Maine Maryland Massachusetts Michigan Minnesota Mississippi Missouri Montana Nebraska
Table 11
General Intergovernmental Cooperation Authorization, 1976
Power Requires
General Law Citation or Code Reference
29.48.010 (4) Sec. 1 1-951 Sec. 14-901 Gov. 6500 Title 29, Art. 1 Sec. 7-339a
Sec. 163.01 Sec. 2-5901
67-2326 127 Sec. 741-48 Sec. 53-1 104 Sec. 28E.1 12-2901 65.210 33 Sec. 1321 30 Sec. 1951
Ch. 40 Sec. 4a 124.501 Sec. 471.59
Sec. 70.210 16-4901 Sec. 23-220
Nevada 277.080
Local Co- Unit
opera- Con- Across With tion tract
Power* Power** State Lines
X X X X X
X
X X X X X X
X X
X
X X
Home St.
X X X X X X
X X
X X X X X X
X
X X
X X X X
Local Unit With U.S.
X X X X X
X
X X X X X X
X
X X
X X
of Only Action One of Unit Govern-
Neces- mental sary Bodies
AP- proval
of Attorney General
X X
X
X
X
X
X X
X
X9
X
X
Other Reno- Stat- vation utes or Respon-
Unaf- Termi- sibility fected nation Clause

Table I1 (Cont'd)
Co- General Law opera- Con- Across Citation or tion tract State
States Code Reference Power* Power** Lines
New Hampshire New Jersey New Mexico .
New York
North Carolina North Dakota Ohio Oklahoma Oregon Pennsylvania Rhode Island South Carolina South Dakota Tennessee Texas Utah Vermont Virginia Washington West Virginia Wisconsin Wyoming
Ch. 53-A 40:48B-1 4-22-1 Gen. Munic. Law Art. 5G and 14G Sec. 160A-461 54-40-01
74 Sec. 1001 Sec. 190.003 53 Sec. 481 4543-1 Sec. 1-75 1 -24-1 12-801 Art. 4413 (32c) Sec. 11-13-1 24 Sec.-4801 Sec. 15.1-21 39.34.01 0 Sec. 8-23-1 66.30 Sec. 9-18.7
'Power to undertake joint or cooperative provision of services. "Power of one unit to provide services for another.
'The functions are limited.- seem to include everything but general govern- ment.
'Cities and counties only. 3Only for contracting. - 4May be provided for, but is not mandated. 5May be perpetual.
Power Requires Local of Only Action Ap- Other Reno- Unit Local One of proval Stat- -vation With Unit Unit Govern- of utes or Respon- Home With Neces- mental Attorney Unaf- Termi- sibility
St. U.S. sary Bodies General fected nation Clause
6One-year renewable - if more, it must be approved by concurrent voter majorities.
'Binding for specified tlme. ERequires concurrent voter majorities. 9Requires approval of governor when state money is used. When state, US., another state or subdivision, Canada or subdivision are party to the agree- ment.
1oRequires approval of local government commission ~f agreement is with any unit except Pennsylvania municipality.

transfer of a village function to the county is even more difficult to accomplish since a triple concurrent majority - separate affirmative votes in referenda by city voters, town voters, and village voters is required.
The requirement of an affirmative concurrent majority for the adoption of a county charter in New York State was challenged successfully in a federal district court which on November 22, 1974, struck down the requirement in a decision involving a 1972 referendum on the adoption of a charter for Niagara County.3 On appeal, the U.S. Supreme Court vacated the decision and remanded the case to the district court for a determination of the effect on the issue of the adoption by Niagara County voters of a charter on November 5, 1974.4 The district court on October 23, 1975, reinstated the judgment and expanded it to incorporate the 1974 charter. Although New York State did not appeal this decision, it has been ap- pealed by interveners.
Mayor Henry W. Maier of Milwaukee has de- scribed the difficulty of persuading suburban voters to agree to the transfer of responsibility for a city function to the county.
Nor is it likely that suburbs will volun- tarily take up the costs of city-owned facilities their citizens often use. This is a basic conflict. In Milwaukee, the conflict has been expressed by the rebuffs of at- tempts to transfer the city-owned museum to the county with a fair return to city taxpayers for their equity in the facility. While attendance records show a higher percentage of suburban use of this munici- pal facility, suburban voters have twice voted against negotiations for transfer while the transfer was overwhelmingly favored by the voters of the city. More recently, county supervisors turned down a move to set up a countywide assessment system, even though state assistance would substantially underwrite the cost if assess- ing were performed by the county rather than by the individual municipalities.5
For the purposes of this study, we defined the transfer of responsibility for the performance of a function or component of a function (e.g., police patrol, water supply, solid waste disposdl) as a per- manent change in the unit of government responsible for performing a given function or component of a function. The permanence of the situation obviously is not the essential difference between an intergovern- mental service agreement and a voluntary transfer of functional responsibility since five states with consti- tutional and/or statutory provisions authorizing transfers provide for revocation of a transfer, three by a very simple process.
Fiscal responsibility is another possible criterion for distinguishing between a service agreement and a functional transfer. When a government contracts to obtain a service from another government, the former pays - in money or other services - the latter for the service. When responsibility for a function is transferred by a municipality to a county, the latter usually assumes the total cost of providing the service. This distinction between a transfer and a contract, however, is blurred in California, Michigan, and Pennsylvania, since these states require that a reim- bursement be made for a transfer.
Policy control - a third distinguishing criterion - is not useful when examining statutes and consti- tutions. The intergovernmental cooperation statutes of 19 states contain clauses stating that the responsi- bility for a particular function remains with the recipient government (see Table If ) . This responsibil- ity presumably would be shifted in a functional transfer. Idaho, at one time, had statutory authority for local governments to transfer functions. The authorization, however, was repealed and replaced by an interlocal cooperation act providing for joint services and contracting, but not mentioning the transfer of functional responsibility. The implication seems to be that explicit provisions for the transfer of functions are unnecessary under the cooperation act.
Chapter III focuses upon county assumption of municipal responsibilities flowing from city-county consolidations, state-mandated transfers, and adop- tion of home rule charters.
FOOTNOTES *Constirut~on of the Stare of New York, Art. IX, $ 1 (h). 'Citizens for Community Acrion at rhe Local Level, Incorporated v . John J. Ghezzi, 386 Fed. Supp. 1 (1974).
4Town of Lockport, New York, er a1 v . Clrizens for Communiry Action ar!rhe Local Level, Incorporared, er al, 96 S . Ct. 1 1 (1975).
1Massachusetrs Laws of 1967, Chap. 658; Massachusetts General 5Henry W: Maier, "Conflict in Metropolitan Areas," The Annals, Lows, Chap. 1 1 7-19. November 1974, pp. 156-57.


Chapter 111
County Assumption of Responsibility for Functions
A lthough not usually thought of as a transfer of functional responsibility, voter approval of city- county consolidation charters (see Table III) and legislatively mandated mergers of a city and a county have resulted in the effective upward transfer of functions to the county level as the new government is responsible for functions previously performed by the lower tier units.
The Carson City-Ormsby County, Juneau-Greater Juneau Borough, and Sitka-Greater Sitka Borough mergers occurred in non-metropolitan areas. The Baton Rouge area currently is a Standard Metropoli- tan Statistical Area (SMSA), but was not one in 1947. The voter approved consolidations in Virginia must be placed in a special category as each city is responsi- ble for county functions and the county lacks jurisdic- tion within the city. An incorporated town within a county may be separated from its county and become a city when it reaches a population of 5,000 with the approval of the General Assembly. Consequently, each Virginia merger typically involves the amalga- mation of a city-county with a county or a city- county.
Each of the remaining voter-sanctioned mergers occurred within an SMSA and involved the central city and the county. The Nashville and Jacksonville reorganizations were partial consolidations in that the few existing small municipalities were given the op- tion, by referendum, to remain out of the consolida- tion and all chose to do so. In addition, the constitu- tional county officers were retained. The Baton Rouge consolidation retained the city, the parish, and two small municipalities.
We must point out that there was relatively little 20th century interest in city-county consolidation until the post-World War I1 period, and voters gener- ally have disapproved merger proposals referred to them. Only 15, or 26 percent, of the proposals were sanctioned by the electorate in the period 1947-1975.

Table 111
Voter Approved City-County Consolidations, 1947-1 975
Area
Baton Rouge and East Baton Rouge Parish, Louisiana
Hampton and Elizabeth City County, Virginia
City of Newport News and City of Warwick, Virginia1
Virginia Beach and Princess Anne County, Virginia
South Norfolk and Norfolk County, Virginia
Nashville and Davidson County, Tennessee
Jacksonville and Duval County, Florida
Carson City and Ormsby County, Nevada
Juneau and Greater Juneau Borough, Alaska
Columbus and Muscogee County, Georgia
Sitka and Greater Sitka Borough, Alaska
Nansemond and Towns of Holland and Whaleyville, Virginia2
City of Suffolk and City of Nansemond, Virginia1
Lexington and Fayette County, Kentucky
Cities of Anchorage, Glen Alps, and Girdwood and the Greater Anchorage Area Borough, Alaska
'The merger of two city-counties.
Year Approved
>The first and only town-county merger in Virginia.
county mergers - Indianapolis and Marion County, Indiana, in 1970 and Las Vegas and Clark County, Nevada, effective in 1977. These consolidations must be placed in a special category since the amalgama- tions are the only city-county mergers mandated by state legislatures without provision for a referendum since 1898 when the New York State Legislature formed New York City by merging completely all local governments in a five-county area.'
Lord James Bryce, a perceptive observer, wrote in 1888 that "it is possible that by the middle of the next century there will prevail one system, uniform in its outlines over the whole country, with the township as its basis, and the county as the organ called to deal with those matters which, while they are too large for township management, it seems inexpedient to remit to the unhealthy atmosphere of a state capital."* Lord Bryce obviously was overly optimistic relative to the date when the county would become the governmen- tal unit responsible for solving areawide problems resulting from urbanization, but it appears that his forecast will become a fact in many states by the end of the century.
A number of transfers to the county have been mandated on a statewide basis by the state legislature. In Florida, property tax administration has been shifted to the county level and in New York State welfare has been shifted to the county level? Minne- sota, in 1973, abolished the township system of poor relief by assigning the function to the ~ o u n t y . ~ In Mississippi, municipal health departments automati- cally are abolished when the county creates a health department.5 And the county auditor in Iowa, Minne- sota, and South Dakota has been made responsible for voter r eg i~ t ra t ion .~
The voluntary transfer of responsibility for a function from the municipal level to the county level occurs with a much greater rate of frequency than the mandatory transfer of responsibility. Most com- monly, a function is shifted voluntarily from one or more municipalities to the county. An amendment to the Pennsylvania Constitution, approved by the vot- ers in 1968, classifies the county as a municipality and extends home rule to the county.' The 1972 Pennsylvania Legislature enacted the Home Rule Charter and Optional Plans Law implementing the amendment by authorizing both county and sub- county units to adopt home rule charter^.^ A county desiring to exercise a power currently exercised by a municipality must enact a n ordinance authorizing the exercise of the power by the county within each municipality in the county. The ordinance does not

become effective for 15 months and the governing body of any municipality within 120 days of the enactment of the county ordinance may pass a munic- ipal ordinance excluding the county from exercising the power within the municipality. The county is forbidden to levy taxes within the municipality to finance the excluded functions. A subcounty unit electing to exclude the county from performing a function may repeal the exclusionary ordinance and request the county to perform the function. If the municipality does not exclude the county from per- forming the function within the statutorily prescribed 120 days, the municipality may not enact an ordi- nance excluding the county from performing the function within the municipality for a period of four years.
HOME RULE COUNTIES
The extension of constitutional o r statutory home rule to county government has led to the adoption of charters authorizing the county to perform new func- tions. To cite only one example, home rule was extended to counties in New York State in 1958. A survey of 52 counties in 1972 revealed that the average charter county provides 35 services compared to 21 services provided by the average non-charter c ~ u n t y . ~ Currently, 71 county-type governments have home rule charters, including nine of the 21 city-county consolidated governments.
A most interesting development is the adoption of home rule charters by Dade, Volusia, and Broward Counties, Florida, partially preempting responsibility for functions. The Dade County Charter, adopted in 1957, authorizes the Board of County Commissioners to "set reasonable minimum standards for all govern- mental units in the county for the performance of any service or function."lO If a municipality fails t o
comply with the standards, the county "may take over and perform, regulate, o r grant franchises to operate any such service." This power has not been exercised by the county to date.
The Volusia County Charter, approved by the electorate in 1970, grants the county the power of preemption with respect to protection of the environ- ment.
County ordinances shall prevail over mu- nicipal ordinances whenever the county shall set minimum standards protecting the environment by prohibiting or regulat- ing air and water pollution or the destruc- tion of the resources of the county belong- ing to the general public.11
The Volusia County Council has exercised its power of preemption once to regulate the location, construction, repair, and abandonment of wells, and the installation and repair of pumps and pumping equipment. l 2
The Broward County Charter, sanctioned by the voters in 1974, created the Broward County Planning Council and directed it to adopt, within nine months of its appointment, a land use plan for the county." The council is authorized to approve o r reject any land use plan submitted by any governmental unit within the county. If a submitted plan is found to be in substantial conformity with the county land use plan, the submitted plan will be certified and will become the effective plan for the unit submitting the plan. If a plan is re!ected o r a unit fails to submit a plan for certification, the county plan becomes effec- tive within the unit.
In Chapter IV, we will examine the assumption of complete and partial responsibility for certain func- tions by state governments.
FOOTNOTES
IIndiana Acts of 1969, Chap. 173. .Veevoda Revised Statutes, Title 21, Chap. 274.
2James Bryce, The American Commortw~ealrh (New York: The Macmillan Company, 1900), p. 416.
3Florida Laws of 1970, Chap. 243; West's Florrda Statutes Anno- tated, Chap. 195. (1973). New York Laws of 1972, Chap. 28 (McKinney 1972).
4Minnesota Laws of 1973. Chap. 650; Minnesota Statutes Anno- tated, Chap. 2560 (1975 Supp.).
5Mississippi Code, $97082 and 71 29-1 50.
Vowa A c u of1973, Chap. 136, 997; Iowa Code Annotated, $48.1 Minnesota La!-t>s of 1973, Chap. 676, 93; Minn~sota Statutes .4nnototed, 5201.02 1 (1975 Supp.). South Dakota Compiled Laws, 5 12-4-2 (1 967).
7Con.rritu~ion q f t h e Commonu~ecrlth of Penns~lvunia. Art. 9. 952 and 14.
Vennsvlvania Art 62 q f 1972; Purdonk Pcnn.sjsl~'ania Statutes, Title 53, Chap. '/2, $51-101 to 1-1309.
Tharles W. Jorgensen, Survej o f Func~ions at Countl, Level: Fall 1972 (Albany: County Officers Association of the Stateof New York, 1972).
loMetropolitan Dade Count.); Charter, Art. 1, $1 .O I A 18 (b). 1 1 Volusia County Charter, $1 305. '2Volusia County Ordinance Number 72-6. '-'Broward Counrv Charter, Art. VI, 996.01 and 6.05.


Chapter IV
State Assumption of
Functional Responsibility
I n contrast to the generally voluntary nature of the upward transfer of functional responsibility from the municipal level to the county level, transfers to the state level usually have been involuntary although often favored by many municipalities. State assump- tion of responsibility for one or more functions in major metropolitan areas is traceable to the 19th century. Massachusetts, for example, created three state-controlled public authorities prior to the turn of the century - the Metropolitan Sewage Commission in 1889, the Metropolitan Parks Commission in 1893, and the Metropolitan Water Commission in 1895.' The sewage commission was merged in 1901 with the water commission to form the Metropolitan Water and Sewage Board, which in turn was merged in 1919 with the Metropolitan Parks Commission to form the Metropolitan District Commission (MDC), one of the very few multifunctional state-controlled public au- thorities in the United States.? M D C administers a park district composed of four cities and 37 towns, a sewage district composed of four cities and 43 towns, and a water district composed of three cities and 32 towns.
A report on regional governance by three faculty members of the Maxwell Graduate School of Syra- cuse University concluded with the following recom- mendation:
The Massachusetts experience with the M D C should be capitalized rather than abandoned. It is a metropolitan jurisdic- tion, providing metropolitan services, and having a sound political base. It is our judgment that the route for Massachusetts to take is to build on the experience of the MDC, adjust it t o fit the contemporary world of greater citizen participation, and employ that example for the establishment of a statewide system of regional govern- ments.'
This recommendation has 'not been adopted and the Massachusetts General Court, since establishing the MDC, has created three other state-controlled

regional bodies in eastern Massachusetts: Massachu- setts Bay Transportation Authority, Massachusetts Port Authority, and Metropolitan Boston Air Pollu- tion Control District. In addition, the general court has authorized the creation of regional transportation authorities throughout the commonwealth outside the greater Boston area, and one was organized in 1975: the Southeastern Massachusetts Regional Transit Au- thority.
In 1947, Rhode lsland established the Blackstone Valley Sewer District and granted it jurisdiction in the cities of Central Falls, East Providence, and Paw- tucket and in the towns of Cumberland and L i n ~ o l n . ~ The district is governed by a commission composed of the state director of transportation, the state director of health, and three others appointed by the governor.
The most major transfer in terms of the number of functions occurred in 1960 when Connecticut abol- ished county governments and shifted their responsi- bilities to the state level.5
The Massachusetts approach to solving metropoli- tan problems in the Greater Boston area was not replicated by another state until New York, under Governor Nelson A. Rockefeller, decided, in the 1960s, to use its plenary authority to directly solve areawide problems and adopted the authority ap- proach to deal with problems in multicounty areas. In the 1962 Godkin Lectures at Harvard University, Governor Rockefeller stated:
The problems of urbanism have outrun individual local government boundaries, legal powers, and fiscal resources. And the national government is too remote to sense and to act responsively on the widely varying local or regional concerns and aspirations. The states - through their relations with local governments, their greater resources and powers, and their closeness to the people and the prob- lems - can and should serve as leaders in planning, and the catalysts in develop- ing, cooperative action at the local-state- Federal level^.^
Both statewide and regional authorities - quasi- public corporations - have been created in the state for special purposes: Urban Development Corpora- tion (which currently is experiencing serious financial difficulties), Environmental Facilities Corporation, J o b Development Authority, five regional transporta- tion authorities, and 34 others.'
One of the nine state-controlled public authori-
ties - the Public Transit Authority - operating on a statewide basis in Rhode Island is responsible for a function previously performed by a municipality (Providence).s
Five Connecticut state-controlled public authori- ties operate statewide. Only the Resources Recovery Authority, which is constructing its first facility in the Bridgeport area, is involved in a function that has been a traditional local government responsibility.9
An unusual approach to the solution of areawide problems was initiated by the Minnesota Legislature in 1967 with the establishment without a referendum of the gubernatorially appointed Metropolitan Coun- cil for the seven-county Twin Cities area.10 The council deliberately was created as a powerful policy- making body possessing no operating authority. Serv- ing as the comprehensive areawide planning agency, the council possesses the power to review and suspend plans indefinitely of each metropolitan special district in conflict with the council's development guide, review and suspend, for up t o one year, proposed projects of local governments, act as a housing au- thority, and appoint all members other than the chairman of each regional commission with the ex- ception of the Airport Commission. The chairmen are appointed by the governor. Each metropolitan com- mission - Waste Control Commission, Airport Commission, Transit Commission, Mosquito Control Commission - is required to prepare a development program to implement the council's policy plans subject to the council's approval. The capital improvement parts of the commissions' budgets also are subject to council approval.
The transfer of responsibility for certain traditional local functions to the state government appears to be an accelerating trend. The functions most often shifted to the state are public health, public welfare, municipal courts, pollution abatement, property tax assessment standards, building codes, land use regula- tions including coastal zones and wetlands, and regu- lation of surface mining.
The 1966 Rhode Island Legislature abolished city and town health departments and transferred their functions to the State Health Department.' ' Although most Vermont towns have a town health officer, the State Health Department is responsible for nearly all health programs.12 The 1967 Vermont Legislature enacted a law authorizing six towns which owned and operated airports t o transfer the airports t o the state, and the towns in 1968 voted to transfer control of the airports to the state.13
In 1967, Vermont transferred responsibility for social welfare from cities, towns, and villages to the

state, thereby providing substantial financial relief for the local units.14 Massachusetts and Delaware took similar action in 1968 and 1970 respectively.15 Al- though Connecticut has not yet assumed full responsi- bility for public welfare, the state currently reimburses municipalities for 90 percent of the cost of local welfare assistance.
Boards of county commissioners in Massachusetts, with the exceptions of Nantucket County and Suffolk County, are required to submit their proposed annual budgets to the general court for approval.16 In 1972, the general court eliminated funds for forest fire patrols from all county budgets, thereby making the function entirely a commonwealth responsibility.
A Florida constitutional amendment, adopted in 1972, stipulates that all municipal courts will cease to exist no later than January 3, 1977, and their func- tions will be transferred to the state court system."
In Maryland, the 1970 General Assembly created the Maryland Environmental Service and endowed it with authority to supply water and dispose of liquid and solid waste.'* The three officers of the service - a director, a secretary, and a treasurer - are appointed by the secretary of natural resources with the approval of the governor. Although the service posseses the power of eminent domain, the service is forbidden to construct a solid waste disposal facility within "the boundaries of a municipality without the express consent of the governing body of the munici- pality ."I9
In the event a municipality fails "to comply with an order of the secretary of health and mental hygiene to provide a sewerage system or refuse disposal work," the secretary is authorized to direct the service to install and operate the necessary f ac i l i t i e~ .~~ Similarly, if a municipality fails to correct deficiencies in "the operation of sewerage systems or refuse disposal works," the secretary may direct the service to operate the systems or works.21
Currently, the service operates 45 water and waste water treatment plants for state and local governmen- tal agencies and private firms. The service also oper- ates a major sludge composting project at Beltsville and a 400-tons-a-day resource recovery plant in Baltimore County.
In 1972, the New Hampshire General Court di- rected the New Hampshire Water Supply and Pollu- tion Control Commission "to acquire, plan, con- struct, and operate, to serve certain municipalities within the Winnipesaukee River basin (including, but not necessarily limited to, Meredith, Laconia, Gil- ford, Belmont, Sanbornton, Tilton, Northfield, and Franklin), any and all sewage and waste disposal
facilities (meaning only those facilities eligible for Federal and state aid) in accordance with basin and regional treatment needs consistent with Federal and state requiremenkW22 The powers and duties of the municipalities within the basin in connection with sewage and waste treatment facilities were transferred to the commission, and municipal employees engaged in these functions were given the opportunity to become employees of the commi~sion.~3
A 1973 Maryland law provides for complete state responsibility for property tax assessment subsequent to July 1, 1975.24 Hawaii is the only other state to have transferred to the state level responsibility for the assessment of property, although the 1973 Wis- consin Legislature enacted a law providing for state assessment of manufacturing property, and the Flor- ida Department of Revenue establishes standard measures of value which must "be used by tax asses- sors in all counties, including taxing districts, to assist them in arriving at assessments of all property."25 The 1974 Maine Legislature directed the State Bureau of Property Taxation to hold qualifying examinations for assessors twice a year.26
Although New York State has not shifted responsi- bility for building codes to the state level, the general law allowing municipalities to adopt the State Build- ing Code by reference provides that a municipality adopting the code may not "supersede, void, or repeal or make more restrictive any of the provisions of this article or of the rules and regulations adopted by the State Building Code Council hereunder."Z7
In 1974, the Florida Legislature provided for partial state preemption of responsibility for building codes.28 The Florida Building Codes Act of 1974 created the State Board of Building Codes and Stand- ards within the Department of Community Affairs. The gubernatorially appointed 15-member board was directed to adopt an interim state building code for local governments failing to adopt a code by January 1, 1975, and enforce it if the city or county fails to enforce the code. Local governments may adopt codes with standards higher than the standards of the state code. In 1969, the California Legislature established the California Commission of Housing and Commu- nity Development and authorized it to promulgate rules and regulations for factory built h0mes.~9
Several states have totally or partially preempted responsibility for land use regulation. The Vermont Legislature enacted a law in 1970 requiring a devel- oper to obtain a permit from one of seven district environmental commissions for a proposed develop- ment exceeding ten acres in a city or town with zoning regulations and one acre in a city or town without

zoning regulation^.^^ The 1974 Tennessee Legislature enacted The New Community Development Act which created the Tennessee Community Develop- ment Board with power to adopt minimum standards for the development of new comrnuni t i e~ .~~
The Florida Local Government Comprehensive Planning Act of 1975 requires all local governments to adopt a comprehensive plan by July 1, 1979, and provides on a default basis for the upward shift of responsibility for preparation of the plan.32 If a municipality fails to prepare and adopt a comprehen- sive plan meeting standards set forth in the act by the deadline, the comprehensive plan prepared by the county becomes effective within the municipality. Should the county fail to prepare a comprehensive plan meeting the prescribed standards, the State Land Planning Agency is directed to prepare a comprehen- sive plan for the county and local governments lo- cated within it and recommend the plan's adoption to the Administration Commission - governor and cabinet - which is authorized to adopt the plan.
The Federal Coastal Zone Management Act of 1972 encourages states to assume responsibility for management of coastal areas by authorizing the Secretary of Commerce to make grants to states to prepare management plans.33 Once the secretary approves a state's management program, all Federal actions affecting the state's coastal zone must be consistent with the state's program to the maximum possible extent. To date, 12 states have enacted laws making the state responsible for the regulation of coastal lands and wetlands.34
On November 7, 1972, California voters approved Initiative Proposition 20, creating the Coastal Zone Conservation Commission and mandating prepara- tion by 1976 of comprehensive growth plans for a five-mile wide area along the 1,000 mile coastline.35 Until the plan is prepared and adopted, all proposed development in a 1,000 yard wide strip along the shoreline requires 'the approval of one of six regional commissions, composed of citizens and public offi- cials, with the statewide commission authorized to veto any proposed development. Construction of buildings which would obstruct the view of the ocean from shoreline highways is prohibited, and home- owners must obtain a permit for additions costing in excess of $7,500. Applications for development exceeded 6,000 in 1973, but decreased to 4,700 in 1974.36 The vast majority of applications - over 90 percent - have been for single-family dwellings and have been approved. Rejected applications generally have involved proposed high-rise beach apartment houses.
The 1975 New York State Legislature enacted the Freshwater Wetlands Act providing for partial state preemption of responsibility for regulating freshwater wetlands and providing for a default system of regula- tion3' Each local government may adopt a freshwater wetlands protection law or ordinance meeting state minimum standards. If a local government fails to adopt a plan meeting state standards, the local gov- ernment is deemed to have transferred the function to the county.3s Should the county fail within a 90-day period to adopt a freshwater wetlands protection law or ordinance, the county is deemed to have trans- ferred the function to the State Department of Envi- ronmental Conservation.
The Florida Environmental Land and Water Man- agement Act of 1972 empowers the State Planning Agency to recommend to the Administration Com- mission "specific areas of critical state concern."39 If a local government fails to transmit to the State Plan- ning Agency within 120 days land use regulations in conformance "with the principle for guiding develop- ment set out in the rule designating the area of critical state concern," the agency may institute judicial proceedings to enforce the land development regula- tions. On April 21, 1975, the Administration Commis- sion, by a five to two vote, placed the Florida Keys - a 130 mile chain of islands - under state control by designating the Keys as an area of "critical state ~oncern."~O This action represents the first time that an area has been so designated.
A 1973 Florida law provides for partial state preemption of responsibility for water resources by authorizing the Department of Natural Resources "to exercise general supervisory authority over all water management di~tricts."~i
The Maine Legislature, in 1973, partially preemp- ted responsibility for shoreland zoning and subdivi- sion controls by mandating that municipalities adopt such controls for "land within 250 feet of the normal high water mark of any pond, river, or salt water body."42 If a municipality fails to adopt a shoreland zoning and subdivision ordinance or fails to enforce the ordinance, the Maine Department of Environ- mental Protection and the Maine Land Use Regula- tion Commission are directed to adopt a suitable ordinance which the municipality must enforce. The Maine wetlands act forbids an owner to fili, dredge, or alter any coastal wetland or drain or deposit sanitary sewage into or on any coastal wetland with- out a permit issued by the Maine Board of Environ- mental Protection.43
The Connecticut Inland Wetlands Act of 1972 requires all 169 towns to regdate the use of areas

designated as inland wetlands in accordance with criteria contained in the act.44 In the event a munici- pality failed to exercise its regulatory powers by January I, 1974, the commissioner of natural resour- ces was directed to regulate the municipality's wet- lands.45
In New York State, the 1973 Legislature created a state agency - The Adirondack Park Agency - to regulate land use in the large Adirondack Park Re- serve.46 On May 30, 1975, Governor Hugh L. Carey proposed legislation adding 1,033 miles of rivers to the 171 miles in the state's wild, scenic, and recreational rivers system in the Adirondack Park area.4' And the Temporary State Commission to Study the Catskills recommended a default system under which the coun- ties would assume responsibility for land use plans, controls, and enforcement machinery "when localities fail to, or choose not to, meet minimum performance criteria."48 Neither proposal was accepted by the 1975 State Legislature.
In 1974, the New York State Legislature enacted a law providing for state regulation of mined land in order to promote its r e ~ l a m a t i o n . ~ ~ The new law supersedes all other state and local laws relating to the 1,000 active mines and estimated 12,000 to 15,000 abandoned mines, but allows local governments to enact zoning ordinances imposing stricter mined land reclamation standards than the state's standards.50 Governor Dolph Briscoe, on June 21, 1975, signed into law the Texas Surface Mining and Reclamation Act, placing strip mining of coal, lignite, and uranium under the regulatory control of the Texas Railroad Commission, which also regulates the bus, gas, oil, railroad, and trucking industries.5' Florida and North Dakota also regulate mining.52
In 1972, the New York State Legislature enacted a law providing for state preemption of responsibility for finding sites for power plants and the following year the Oregon Legislature enacted a similar law.53 North Dakota also regulates power plant sites; a certificate of site compatibility must be obtained from the state before a plant can be constructed.54
The Massachusetts General Court in 1969 enacted a controversial law - Low and Moderate Income Housing Act - creating a board in the State Depart- ment of Community Affairs with power to overturn specified decisions of city and town boards of ap-
peal.55 Challenged as violating the commonwealth's constitutional home rule amendment, the law was held by the supreme judicial court to be a proper exercise of the general court's zoning powers even though the decisions of the board would affect indi- vidual cities and towns.5h
Stimulated in part by Federal environmental pro- tection legislation - particularly the Water Quality Act of 1965, Air Quality Act of 1967, Clean Air Amendments of 1970, and Water Pollution Control Act Amendments of 1972 - states have totally or partially preempted responsibility for air and water pollution abatement.s7 To cite only two examples of state preemptory actions in the environmental area, Rhode Island has forbidden its cities and towns to enact air pollution control ordinances and bylaws, whereas Delaware allows local governments to estab- lish standards higher than those established by the state air pollution control agency.58
Federal legislation also has led to the voluntary transfer of authority for regulating certain intrastate activities to the Federal government as illustrated by the following three examples. The secretary of agri- culture, as of January 1976, has assumed responsibil- ity in 16 states for the inspection of slaughterhouses preparing meat from cattle, equines, goats, sheep, and swine for distribution solely within the state, and in 23 states he has responsibility for the inspection of poultry slaughterhouses preparing poultry products for distribution solely within the state.59 And the Fed- eral Occupational Safety and Health Administration, at the request of 1 1 states, has assumed responsibility for the occupational safety and health of private sector employees.60
The statutes cited in this chapter and in Chapter III provide for the transfer of responsibility for a specific function or component to the state and county levels, respectively, on either a voluntary or mandatory basis. The constitutional provisions and statutes cited in Table I authorize municipalities at their option to shift responsibility for a function or component to another municipality, the county, the state, a special district, or a council of governments. Data on transfers to these units by municipalities are presented in the next chapter along with data on planned transfers and municipal assumption of responsibility for new functions.
FOOTNOTES
1Massachusetts Acts of 1889, Chap. 439.
Massachusetts Acts of 1893, Chap. 407. Massachusetts Acts of 1895, Chap. 488.
ZMassachuserts Acts of 1901, Chap. 168. Massachusetts Acts of 1919, Chap. 350.

3Guthrie S. Birkhead, Alan K. Campbell, and Marsha Weissman, Massachusetts Substate Government: A Report to the Secretary of Environmental Affairs (Syracuse: Metropolitan Studies Pro- gram, Maxwell Graduate School, Syracuse University, August 15, 1972), p. 83.
4Rhode Island Acts of 1947, Chap. 1837. 5Connecticut Public Acts of 1959, Number 152. Connecticut General Statutes Annotated, Title 6-2a and 6-2b. The State of Rhode Island and Providence, Plantations in 1842 abolished organized county governments and transferred their functions to the state.
6Nelson A. Rockefeller, The Future of Federalism (New York: Atheneum, 1964), p. 47.
7For additional details, see Joseph F. Zimmerman, "The Metro- politan Area Problem," The Annals, Vol. 416, November 1974, pp. 133-47.
8Rhode Island Laws of 1974, Chap. 176; Rhode Island General Laws Annotated, $23-46.1-9.
VConnecticut General Statutes Annotated, $1 9-524t. "JMinnesota Statutes, Chap. 473B. (1971). "Rhode Island Laws of 1964, Chap. 45; General Laws of Rhode
Island, $923-1-17 to 23-1-29. See also John 0. Stitely, "Home Rule in Rhode Island: Twenty Years Later," Newsletter (King- ston: Bureau of Government Research, The University of Rhode Island, November 1972), p. 2.
12Vermont Statutes Annotated, Title 18, Chap. I and 9. 13 Vermont Adjourned Session of 1967. Act 232. 14Vermont Acts of 1967, Act 147; Vermont Statutes Annotated,
Title 33, $$2501-3075. 15Massachusetts Laws of 1967, Chap. 658; Massachusetts General
Laws, Chap. 117-19. Delaware Code Annotated, Title 29, 97901.
16The Boston City Council appropriates funds to cover Suffolk County costs not financed by the general court, and the Nan- tucket town meeting appropriates funds for Nantucket County.
~7Constitution of the State of Florida, Art. V, $20 (4). 1Vnnotated Code of Maryland, $93-101 through 3-201. IgIbid., $3-104 (u). "JIbid., $3-1 10 (a). ZIIbid., $3-1 10 (c). 22New Hampshire Lnws of 1972, Chap. 36; New Hampshire
Revised Statutes Annotated, Chap. 149-G: I. (1973 Supp.). 2jNew Hampshire Revised Statutes Annotated, Chap. 149-G:4
(1973 Supp.). 24Maryland Acts of 1973, Chap. 784; Annotated Code of Mary-
land, Art. 8 1, $4245-246D. 25Wisconsin Laws of 1973, Chap. 90; West's Wisconsin Statutes
Annotated, $870 and 995 (1974 Supp.). Florida Laws of 1970, Chap. 70-243; West's Florida Statutes Annotated, $195.032 (1973).
2bMaine Acts of 1974, Chap. 695.86; Maine Revised Statutes, Title 36, $310.
27New York Executive Law, Art. 18,$§370-87 (McKinney 1973). 28Florida Acts of 1974, Chap. 74-167. 2vCalifornia Laws of 1969, Chap. 1422; California Health and
Safety Code, Chap. 1, $6 19960 et seq. 3OVermont Acts of 1970, Act 250. 31 Tennessee Acts of 1974, Chap. 749; Tennessee Code, $$13-150 1 el
seq. 32Florida Laws of 1975, Chap. 75-257. 33Coastal Zone Management Act of 1972, 86 Stat. 1280, 16
U.S.C.A. 1451 et seq., (1973). 34As examples, see New York Environmental Conservation Law,
Art. 25, $$25-0101 to 25-0602 (McKinney 1973), Connecticut General Statutes Annotated, Chap. 440, $$22a-28 through 22a- 45.
35West's Public Resources Code, Div. 18, $$2700 et seq., (1973). 36Gladwin Hill, "California Lists Gains in 2 Years of Coast Regula-
tion," The New York Times, April 22, 1975, p. 22. l7New York Laws of 1975, Chap. 614; New York Environmental
Conservation Law, Art. 24, $$24-0101 through 24-1301 (McKin- ney 1975 Supp.).
38New York Environmental Conservation Law, Art. 24, 924-0501 (4). (McKinney 1975 Supp.).
3PFlorida Laws of 1972, Chap. 72-317. West's Florida Statutes Annotated, Title 26, Chap. 380, $$380.012 through 380.10. (1973).
4o"Florida Takes Control of Development of the Keys," The New York Times, April 22, 1975, p. 23.
41Florida Laws of 1972, Chap. 72-299, Part I, $5; West's Florida Statutes Annotated, $373.026 (7), (1973).
42Maine Revised Statutes, Title 12, $48 1 1. 43Ibid., Title 12, $$4701-709 and 4751-758. 44Connecticut Public Acts of 1972, Number 155. Connecticut
General Statutes Annotated, Chap. 440, $$22a-36 through 22a- 45.
45Ibid., $22a-42 (f) (2). 46New York Laws of 1973, Chap. 348; New York Executive Law,
Art. 27, $8810-17 (McKinney 1973). 47Press release on wild, scenic, and recreational rivers system
(Albany: Executive Chamber, May 30, 1975). 48The Future of the Catskills (Stamford, New York: New York
State Temporary State Commission to Study the Catskills, April 30, 1975), p. 32.
49New York Laws of 1974, Chap. 1043; New York Environmental Conservation Law, $923-2701 through 23-2727. (McKinney 1975 SUPP.).
5oNew York Environmental Conservation Law, $23-2703 (2). 51 Texas Laws of 1975, Chap. 690; Vernon's Texas Civil Statutes,
Art. 5920-10. 52WestS Florida Statutes Annotated, $205.391. (1973).
North Dakota Century Code Annotated, $838-16-01 through 38- 16-06.
s3New York Laws of 1972, Chap. 385. New York Public Service Law, Art. VIII, New York Public Authorities Law, $$I014 and 1870, New York Condemnation Law, $4 (3) (b), and New York Public Health Law, $$I230 and 1277, (McKinney 1973); Oregon Laws of 1973, Chap. 503,816; Oregon Revised Statutes, $215.273.
54North Dakota Century Code Annotated, $49-22-07. SsMassachusetts General Laws Annotated, Chap. 40B, $$20-23. 56Board of Appeals of Hanover v. Housing Appeals Committee in
the Department of Community Affairs, 294 N.E. (2d) 393. (1973). 57Water Quality Act of 1965, 79 Stat. 903, 33 U.S.C.A. $$I151 el
seq., (1969). Air Quality Act of 1967, 81 Stat. 485,42 U.S.C.A. $81857 et seq., (1969). Clean Air Amendments of 1970, 84 Stat. 1676, 42 U.S.C.A. $$I857 et seq., (1973). Water Pollution Control Act Amendments of 1972, 86 Stat. 816, 33 U.S.C.A. $$I151 et seq., (1973).
5aRhode Island General Laws Annotated, $23-25-19. (1968). Delaware Code Annotated, Title 7,66207. (1968).
59Wholesome Meat Act, 81 Stat. 584,21 U.S.C.A. 661. (1973). Poultry Products Inspection Act, 82 Stat. 791, 21 U.S.C.A. 451, (1973).
~QOccupational Safety and Health Act, 84 Stat. 1590, 29 U.S.C.A. $865 1-78, (1973).

Chapter V
Functional Assignments in Transition

T o obtain data on recipients of transfers of functional responsibility by municipalities, reasons for the transfers, perceived results of the transfers, municipal plans for future transfers, and municipal assumption of responsibility for functions never pre- viously performed, a questionnaire was posted in 1975 to 5,930 incorporated municipalities - cities, vil- lages, boroughs, incorporated towns - over 2,500 population. Returns from 55.9 percent of these units were received in time for inclusion in this report. The results have been classified by population categories, geographic regions, forms of government, and central city, suburban, or non-metropolitan locations.
This report also draws upon data gathered by a 1974 survey by the author of state municipal leagues and state agencies for local affairs. This survey re- vealed that no transfers of functional responsibility from the municipal level to the county level had occurred in Arkansas, Arizona, Illinois (under its 1970 constitution), Massachusetts, New Hampshire, New Mexico, Vermont, and Washington.
The use of a mail questionnaire to collect data results in a n under-reporting of the number of transfers and municipal assumptions of responsibility for new functions for two major reasons. First, respondents were requested to report on the complete or partial transfer and /o r assumption of functional responsibility during the past ten years. In examining returned questionnaires from states with which the author is personally familiar, it became apparent that a number of respondents had not reported a transfer such as the shift of responsibility for public welfare t o the state level in Massachusetts. The explanation for the failure t o report a transfer(s) may be failure of memory or a respondent who was not a municipal official at the time of the transfer(s).
The understating of the number of transfers also stems from the fact that several respondents indicated that they did not have time or the desire to complete the questionnaire and returned it blank. We can safely assume that some of these municipalities, as well as some municipalities which failed to return the ques- tionnaire, have transferred responsibility for a func- t ion(~) to another governmental unit or have assumed responsibility for a function never previously per- formed.
Analysis of the survey data has been hindered to a limited extent by the failure of a number of municipal respondents to indicate whether responsibility for an entire function or only a component of the function had been transferred. For example, several respon- dents wrote that "solid waste" had been shifted whereas other respondents wrote that "solid waste
collection and disposal," o r "solid waste collection," or "solid waste disposal" had been transferred.
Table IV classifies responding municipalities in terms of population categories, geographic regions of the %ation, forms of government, and central city, suburban, and non-metropolitan locations. The bulk of the responding municipalities are in the 2,500 to 24,999 population categories as one would anticipate, since units in these population groupings account for the overwhelming majority of municipalities in the United States. The relatively high number of re- sponses from the North Central K'egion and the relatively low number of responses from the West reflect the number of units of local government in these two regions. A bare majority of the responding municipalities have the mayor-council form of gov- ernment and a bare majority are suburban munici- palities. Two hundred and fourteen of the 269 central cities of Standard Metropolitan Statistical Areas (SMSAs), as defined by the United States Office of Management and Budget, returned the transfer of function questionnaire.
TRANSFERS OF FUNCTIONAL RESPONSIBILITY
Thirty-one percent, or 1,039, of the 3,319 respond- ing municipalities reported that they had transferred responsibility for one or more functions or compo- nents of functions during the past ten years t o another municipality, the county, the state, special districts, and councils of governments (see Table I V ) . Several additional municipalities reported they had shifted responsibility for a function to another governmental unit ten or more years ago. Albany, New York, for example, shifted its municipal airport to Albany County more than ten years ago.
Table V reveals that the rate of population change between 1960 and 1970 does not correlate strongly with the transfer of functional responsibilities by municipalities. However, 34 percent of the rapidly growing municipalities compared to 29 percent of the declining or slow growth municipalities shifted re- sponsibility for a function or component to another governmental unit.
The responding municipalities reporting transfers are classified in Table VI by the number of functions transferred. Not unexpectedly, the largest number of units (608) transferred responsibility for only one function. Of interest is the fact that 38 municipalities transferred responsibility for five or more functions to other governmental units during the past decade. Santa Monica, California, reported shifting responsi-

Table IV
Survey Response and Number of Cities Which Have Transferred Functions
Total Cities
Number Responding of Cities Surveyed Number Percent
(A) (B) of (A)
Cities That Have
Transferred
Percent Number of (B) Classification
Total, all Cities . . . . . . . . . . . . . . . . . . . . . 5,930 3,319 56
Population Group Over 500,000 . . . . . . . . . . . . . . . . . . . . . 26 250,000-500,000 . . . . . . . . . . . . . . . . . . 30 100,000-249,999 . . . . . . . . . . . . . . . . . . 98
. . . . . . . . . . . . . . . . . . 50,000- 99,999 256 25,000- 49,999 . . . . . . . . . . . . . . . . . . 520 10,000- 24,999 . . . . . . . . . . . . . . . . . . 1,360 5,000- 9,999 . . . . . . . . . . . . . . . . . . 1,550 2,500- 4,999 . . . . . . . . . . . . . . . . . . 2,090
Geographic Region' Northeast . . . . . . . . . . . . . . . . . . . . . . . . North Central . . . . . . . . . . . . . . . . . . . . South . . . . . . . . . . . . . . . . . . . . . . . . . . . West . . . . . . . . . . . . . . . . . . . . . . . . . . . .
MetroICity Type2 Central . . . . . . . . . . . . . . . . . . . . . . . . . . Suburban . . . . . . . . . . . . . . . . . . . . . . . . Non-Metropolitan . . . . . . . . . . . . . . . .
Form of Government Mayor-Council . . . . . . . . . . . . . . . . . . .
. . . . . . . . . . . . . . . . . Council-Manager . . . . . . . . . . . . . . . . . . . . . Commission
Town Meeting. . . . . . . . . . . . . . . . . . . . . . . . . Representative Town Meeting
'Geographic rogions: Northeast - the New England and Mid-Atlantic Divisions, which include the states of Connecticut, Maine, ~ a s s ~ c h u s e t t s , New Hampshire, New Jersey, New York, Pennsylvania, Rhode Island, and Vermont; North Central - the East and West North Central Divisions, which include thestates of Illinois, Indiana, Iowa, Kansas, Michigan, Minne- sota, Missouri, Nebraska, North Dakota, Ohio, South Dakota, and Wisconsin; South - the South Atlantic and West South Central D~visions, which include the states of Alabama, Arkansas, Delaware, Florida, Georgia, Kentucky, Louisiana, Maryland, Mississ~ppi, North Carolina, Oklahoma, South Carolina, Tennessee, Texas, Virginia, and West Virginia, plus the District of Columbia; West - the Mountain and Pacific Coast Divisions, which include the states of Alaska, Arizona, California, Colorado, Hawaii, Idaho, Montana, Nevada, New Mexico, Oregon, Utah, Washington, and Wyoming.
2Metro/city type: Central - the city(ies) appearing in the Standard Metropolitan Statistical Area (SMSA) title; Suburban - other municipalities located within an SMSA; Non-Metropolitan - Municipalities not located in an SMSA.

Table V
Transfer of Functional Responsibility Classified by Population Change,
1960-1 970
Transferred a Function
Did Not Transfer a Function
Population Change Number Percent Number Percent
788 Declining Municipalities . . . . . . . . . . . . . . . . . . . (0 to 10O0Io) 230 29 558 7 1
688 Slow Growth Municipalities . . . . . . . . . . . . . . . . . . . . (0 to 10°/O). 201 29 487 71
693 Moderate Growth Municipalities
(10 to 25%) ................... 213 31 480 69 1,116 Rapid Growth Municipalities
(25 to l,OOOO/o). ................ 383 34 733 66
--
bility for 1 1 functions or components of func- tions - four to the county, six to the state, and one to a council of governments.
Table VI reveals that the tendency to transfer functional responsibility is positively correlated with population size, since larger units of government generally have a greater propensity to shift functional responsibility than smaller units. Municipalities over 500,000 population transferred responsibility for an average of 4.2 functions or components compared to an average of 1.5 functions or components for units under 25,000 population. Only 18 percent of the cities over 500,000 population shifted responsibility for a single function, whereas 63 percent of the units in the 2,500 to 4,999 population group shifted responsibility for one function. The difference in the proclivity to shift functional responsibility is even more noticeable relative to municipalities transferring five or more functions. Thirty-six percent of the responding units over 500,000 population shifted five or more func- tions compared to 2 percent of the municipalities in each of the three smallest population groupings.
A partial explanation for this finding is the fact that many central city institutions and facilities -- hospitals, airports, marine ports, major p a ~ k s , libraries, museums, and zoos - are utilized by subur- banites, and the city has been able t o convince the county, or arrange for the formation of a regional special district, to take over an institution or facility in
order to enlarge the tax base for its support, thereby I
reducing benefit overspill. A growing financial cri- sis - the product of several developments - also has impelled central cities to investigate the possibility of the upward shift of responsibility for an expensive facility which serves the region.
The data reveal relatively little geographical differ- ence in the tendency to transfer functions. The mean number of transfers per municipality ranges from 1.3 in the Northeast to 1.8 in the South.
Relative to metropolitan and non-metropolitan location, central cities transferred responsibility for an average of 2.6 functions per unit compared to 1.5 functions per unit transferred by suburban and non- metropolitan municipalities, This finding corresponds to the finding that larger u& have a greater procliv- ity to transfer functions than smaller units.
There is only a small difference in the mean number of transfers between the two principal forms of municipal government - 1.7 for council-manager units and 1.6 for mayor-council units. The principal explanation for the smaller mean number of transfers by town meeting and representative town meeting units is the fact that organized county government does not exist in Connecticut and Rhode Island and the county is a weak unit of government in the other, four New England States. As a consequence, transfers in New England are to the state government or a special district.

I Table VI
Classification
Number of Municipalities Transferring Functions. By Number of Transfers. 1965-75
Number of Transfers Mean Num- Five or Not
Per- Total ber One Two Three Four More Reported Total cent Num- of Cities of ber Trans- Per- Per- Per- Per- Per- Per- Trans- Cities of fers cent cent cent cent cent cent ferring Trans- Trans- Per Num- of Num- of Num- of Num- of Num- of Num- of
(A) ferring fen City ber (A) ber (A) ber (A) ber (A) ber (A) ber (A)
.................. I Total. All Cities 1. 039 100 1. 708 1.6 608 59 222 21 88 8 30 3 38 4 53 5
Population Group Over500. 000 ................. 11 1 46 4.2 2 18 0 0 3 2 7 2 1 8 4 3 6 0 0 250.000-500. 000 .............. 14 1 39 2.8 5 36 3 21 1 7 2 1 4 3 2 1 0 0 100$00-249. 999 .............. 31 3 58 1.9 17 55 6 1 9 5 1 6 0 0 2 7 1 3 50.00 0- 99. 999 .............. 60 6 122 2.0 28 47 18 30 7 12 1 2 5 8 1 2 25.00 0- 49. 999 .............. 127 12 252 2.0 70 55 26 20 10 8 4 3 10 8 7 6 10.00 0. 24. 999 .............. 255 25 387 1.5 150 59 53 21 21 8 9 4 4 2 18 7 5.00 0- 9. 999 .............. 254 24 387 1.5 155 61 60 24 19 7 4 2 4 2 12 5 2.500- 4. 999 .............. 287 28 417 1.5 181 63 56 20 22 8 8 3 6 2 14 5
Geographic Region Northeast .................... 261 25 341 1.3 171 66 57 22 10 4 2 1 3 1 1 8 7 North Central ................. 331 32 572 1.7 185 56 75 23 33 10 13 4 13 4 12 4 South ........................ 270 26 487 1.8 152 56 52 19 31 12 8 3 14 5 13 5 West ......................... 177 17 308 1.7 100 56 38 22 14 8 7 4 8 5 10 6
MetroICity Type Central .... .,. ................ 109 10 384 2.6 46 42 20 18 16 15 8 7 18 17 1 1 Suburban .................... 505 49 772 1.5 297 59 110 22 40 8 14 3 11 2 33 7 Non-Metropolitan ............. 425 41 652 1.5 265 62 92 22 32 8 8 2 9 3 19 4
Form of Government Mayor-Council ............... 404 39 649 1.6 246 61 82 20 33 8 10 2 15 4 18 4 Council-Manager ............. 558 54 951 1.7 309 55 129 23 52 9 20 4 20 4 28 5 Commission ................. 25 2 48 1.9 17 68 3 1 2 2 8 0 0 2 8 1 4 Town Meeting ................ 39 4 46 1.2 26 67 7 1 8 0 0 0 0 1 3 5 13 Representative Town Meeting . . 13 1 14 1.1 10 77 1 8 1 8 0 0 0 0 1 8
Note: Percentages may not add to 100 percent owing to rounding .

Classification
Table VII
Types of Functions Transferred by Municipalities in the Last Ten Years
Solid Waste Total Number of Collection and Sewage Collection
Transfers Disposal Law Enforcement Public Health and Treatment
Num- Percent Percent Percent Percent Percent Percent Percent Percent Percent ber of Num- of of Num- of of Num- of of Num- of of (A) Transfers ber (A) Transfers ber (A) Transfers ber (A) Transfers ber (A) Transfers
Total Transfers ................ 1. 708 100 294 17 100 185 11 100 185 11 100 166 10 100
Population Group Over 500. 000 . . . . . . . . . . . . . . . 46 3 0 0 0 12 26 250.000.500. 000 . . . . . . . . . . . . 39 2 0 0 0 6 15
100.000.249. 999 58 3 6 10 2 5 9 50.00 0. 99. 999 ............ 1 22 7 7 6 2 13 11 25.00 0. 49. 999 . . . . . . . . . . . . 252 15 19 8 6 2 1 8 10.00 0. 24. 999 ............ 387 23 65 17 22 39 10 5.00 0. 9. 999 ............ 387 23 95 25 32 35 9 2.50 0. 4. 999 ............ '417 24 102 25 35 54 13
Geographic Region Northeast . . . . . . . . . . . . . . . . . . 341 20 47 14 16 16 5 9 40 12 22 48 14 29 North Central . . . . . . . . . . . . . . . 572 33 94 17 32 74 13 40 59 10 32 67 12 40 South . . . . . . . . . . . . . . . . . . . . . . 487 29 107 24 40 49 10 26 49 10 26 35 7 21 West . . . . . . . . . . . . . . . . . . . . . . . 308 18 46 15 16 46 15 25 37 12 20 16 5 10
MetroICity Type Central . . . . . . . . . . . . . . . . . . . . . 284 17 14 5 5 46 16 25 48 17 26 16 6 10 Suburban . . . . . . . . . . . . . . . . . . 772 45 103 13 35 6 1 8 33 77 10 42 119 15 72 Non-Metropolitan .......... 652 38 177 27 60 78 12 42 60 9 32 3 1 5 19
Form of Government Mayor-Council . . . . . . . . . . . . . 649 38 143 22 49 69 11 37 6 1 9 33 79 12 48 Council-Manager . . . . . . . . . . . 951 56 139 15 47 105 11 57 117 12 63 80 8 48 Commission . . . . . . . . . . . . . . . . 48 3 5 10 2 8 17 4 4 8 2 3 6 2 Town Meeting . . . . . . . . . . . . . . 46 3 5 11 2 2 4 1 3 7 2 3 6 2 Representative Town Meeting 14 1 2 14 1 1 7 . 0 0 0 1 7 1

Classification
Table VII (Cont.)
Building and Taxation and Assessment Social Services Safety Inspections
Per- Per- Per- cent Percent cent Percent cent Percent
Num- of of Num- of of Num- of of ber (A) Transfers ber (A) Transfers ber (A) Transfers
Total Transfers . . . . . . . . . . . . . . . 153 9 100 134 8 100 66 4 100
Population Group Over 500. 000 . . . . . . . . . . . . . . 1 2 1 5 11 4 3 7 250.000.500. 000 . . . . . . . . . . . 0 0 0 5 13 4 2 5 100.000.249. 999 . . . . . . . . . . . 1 2 1 8 14 6 3 5 50.00 0. 99. 999 . . . . . . . . . . . 12 10 8 9 7 7 4 3 25.00 0. 49. 999 . . . . . . . . . . . 28 11 18 20 11 4 27 11 10.00 0. 24. 999 . . . . . . . . . . . 42 11 27 32 8 24 12 3 5.00 0. 9. 999 . . . . . . . . . . . 35 9 23 31 8 23 8 2 2.50 0. 4. 999 . . . . . . . . . . . 34 8 22 17 4 13 23 6
Geographic Region Northeast . . . . . . . . . . . . . . . . . 14 4 9 82 24 61 8 2 12 North Central . . . . . . . . . . . . . . 51 9 33 26 5 19 27 4 41 South . . . . . . . : .. . . . . . . . . . . . 70 14 46 17 3 13 17 3 26 West . . . . . . . . . . . . . . . . . . . . . . 18 6 12 9 3 7 14 5 21
Metrotcity Type Central . . . . . . . . . . . . . . . . . . . . 12 4 8 26 9 19 13 5 20 Suburban . . . . . . . . . . . . . . . . . 76 10 50 65 8 49 28 4 42 Non-Metropolitan . . . . . . . . . . 65 10 42 43 6 32 25 4 38
Form of Government Mayor-Council . . . . . . . . . . . . 65 10 42 40 6 30 24 4 36 Council-Manager . . . . . . . . . . 84 9 55 58 6 43 40 4 61 Commission . . . . . . . . . . . . . . . 3 6 2 4 8 3 2 4 3
. . . . . . . . . . . . . Town Meeting 1 2 1 24 52 18 0 0 0 Representative Town
Meeting . . . . . . . . . . . . . . . . 0 0 0 8 57 6 0 0 0
Num- ber
Planning Water Supply
Per- Per- cent Percent cent Percent of of Num- of of (A) Transfers ber (A) Transfers

Table VII (Cont.)
Fire Protection Administrative and Civil Defense Transportation and Legal Education Elections
Per- Per- Per- Per- Per- cent Percent cent Percent cent Percent cent Percent cent Percent
Num- of of Num- of of Num- of of Num- of of Num- of of Classification ber (A) Transfers ber (A) Transfers ber (A) Transfers ber (A) Transfers ber (A) Transfers
Total Transfers ............... 59 4 100 56 3 100 53 3 100 49 3 100 44 3 100
Population Group Over 500. 000 .............. 2 4 250.000-500. 000 ........... 1 3 100.000-249. 999 . . . . . . . . . . . 1 2 50.00 0- 99.999 ........... 4 3 25.00 0- 49. 999 ........... 11 4 10.00 0- 24. 999 ........... 18 5
........... 5.00 0 -9 .999 8 2
........... 2.50 0- 4. 999 14 3
Geographic Region Northeast ................. 4 1 7 13 4 23 10 3 19 13 4 27 0 0 0 North Central .............. 20 4 34 18 3 32 14 2 26 11 2 22 19 3 43 South ..................... 16 3 27 8 2 14 18 4 34 11 2 22 21 4 48 West ...................... 19 6 32 17 6 30 11 4 21 14 5 29 4 1 9
MetrofCity Type .................... Central 9 3 15 18 6 32 15 5 28 10 4 20 8 3 18
Suburban ................. 28 4 47 18 2 32 20 3 38 20 3 41 16 2 36 Non-Metropolitan .......... 22 3 37 20 3 36 18 3 34 19 3 39 20 3 45
Form of Government Mayor-Council ............ 14 2 24 14 2 25 14 2 26 12 2 24 15 2 34 Council-Manager .......... 39 4 66 40 4 71 39 4 74 32 3 65 26 3 59 Commission ............... 4 8 7 1 2 2 0 0 0 0 0 0 3 6 7 Town Meeting ............. 1 2 2 0 0 0 0 5 11 10 0 0 0 0 0 Representative Town
I Meeting ................ 1 7 2 1 7 2 0 0 0 0 0 0 0 0 0

Classification
Table VII (Cont.)
Environmental Housing and Community Public Works ~ecreation' Protection Development Miscellaneous
Per- Per- Per- Per- Per- cent Percent cent Percent cent Percent cent Percent cent Percent
Num- of of Num- of of Num- of of Num- of of Num- of of ber (A) Transfers ber (A) Transfers ber (A) Transfers ber (A) Transfers ber (A) Transfers
Total Transfers . . . . . . . . . . . . . . . 44 3 100 44 3 100 27 2 100 15 1 100 9 1 100
Population Group Over 500. 000 . . . . . . . . . . . . . . 1 2 2 2 250.000.500. 000 . . . . . . . . . . . 3 8 7 2 100.000.249. 999 . . . . . . . . . . . 1 2 2 1 50.00 0. 99. 999 6 5 14 4 25.00 0. 49. 999 ........... 7 3 16 5 10.00 0. 24. 999 . . . . . . . . . . . 14 4 32 9 5.00 0. 9. 999 . . . . . . . . . . . 3 1 7 13 2.50 0. 4. 999 . . . . . . . . . . . 9 2 20 8
Geographic Region Northeast . . . . . . . . . . . . . . . . . 5 1 11 5 North Central . . . . . . . . . . . . . . 17 3 39 23 South . . . . . . . . . . . . . . . . . . . . . 14 3 32 8 West . . . . . . . . . . . . . . . . . . . . . . 8 3 18 8
MetroICity Type ..... . . . . . . . . . . . . . . . Central 7 3 16 9
Suburban . . . . . . . . . . . . . . . . . 28 4 64 23 Non-Metropolitan . . . . . . . . . . 9 1 20 12
Form of Government . . . . . . . . . . . . Mayor-Council 19 3 43 17
Council-Manager .......... 25 3 57 25 . . . . . . . . . . . . . . . Commission 0 0 0 2
Town Meeting . . . . . . . . . . . . . 0 0 0 0 Representative Town
Meeting ............. . . . 0 0 0 0
Note: Percentages may not add to 100 percent owing to rounding . - indicate rounds to less than 0.5 percent .

Types of Functional Transfers
A total of 1,708 transfers of functions or compo- nents of a function have been made by the reporting municipalities in the period 1965-1975 (see Table VII) . The most common transfer was solid waste collection and disposal (294 municipalities), which comprised 17 percent of all transfers. This function was followed in terms of frequency of transfer by law enforcement (11%), public health (l l%), sewage collection and treatment (lo%), taxation and assessment of property (9%), and social services (8%). Each remaining func- tion comprised less than 5 percent of all transfers. Solid waste and sewage collection and disposal com- bined account for more than one-fourth (27%) of all reported transfers. Functions transferred least often were environmental p r~ tec t ion (2%) and housing and community development (1%).
The most popular function transferred by cities over 500,000 population was law enforcement (26%), with public health the second most popular (13%). Cities between 250,000 and 500,000 transferred law enforcement and public health with the same fre- quency (15%). Public health was transferred most frequently by cities between 25,000 and 250,000.
Municipalities below 10,000 population trans- ferred solid waste collection and disposal most often, and public works, environmental protection, and housing and community development least often.
Northeastern munic?palities showed the greatest preference for the transfer of social services (24%) while North Central and Southern municipalities favored the transfer of solid waste collection and disposal. Western municipalities transferred law en- forcement and solid waste collection and disposal most frequently.
Solid waste collection and disposal was the func- tion transferred most often by mayor-council and council-manager municipalities (22% and 1576, re- spectively). Environmental protection and housing and community development were transferred least often by these units. Commission municipalities (17%) favored the shifting of responsibility for law enforcement. Town meeting and representative town meeting units reported that social services was the function most commonly transferred. This finding is explained by the fact that Vermont in 1967 and Massachusetts in 1968 shifted responsibility for social welfare from cities and towns to the state.
Central cities reported that public health (17%) and law enforcement (16%) were the most commonly transferred functions. Spburban municipalities (1 5%)
most often shifted responsibility for sewage collection and disposal, and non-metropolitan municipalities (27%) most often shifted responsibility for solid waste collection and disposal. These three classes of munici- palities least often transferred responsibility for en- vironmental protection and housing and community development.
Relative to solid waste collection and disposal transfers (294), the largest number, in their respective classifications, was transferred by: municipalities under 2,500 population (35%), Southern municipali- ties (40%), mayor-council municipalites (49%), and non-metropolitan municipalities (60%).
In terms of geographical regions, the law enforce- ment function was shifted most often by North Central municipalities (40%) and least often by Northeastern municipalities (9%). Responsibility for taxation and assessment of property was transferred most often by Southern municipalities (46%) and least often by Northeastern municipalities (9%). Planning was shifted to another unit most often by Western municipalities and least by Southern mu- nicipalities.
Classifying transfers by forms of government, we discover that 73 percent of all housing and commu- nity development transfers were made by council- manager municipalities - well over three times the percentage for mayor-council municipalities (20%). Transportation and administrative/legal functions were shifted three times as often by council-manager municipalities as by mayor-council municipalities.
With respect to the metrolcity type classification, 72 percent of all sewage collection and treatment transfers were made by suburban municipalities which also made half o r slightly more of all taxation and assessment, water supply, public works, recrea- tion, and environmental protection transfers. Non- metropolitan municipalities, accounting for over one- third of all transfers (38%), made 60 percent of all solid waste collection and disposal transfers, 42 per- cent of both law enforcement and taxation and assessment transfers, and 45 percent of all election transfers.
Central cities over 500,000 population, constituting 1 percent of all municipalities reporting the transfer of a t least one function, made 3 percent of all transfers. Municipalities under 25,000 population, which com- prise 28 percent of all municipalities shifting func- tional responsibilities, accounted for 24 percent of all transfers. Cities between 25,000 and 50,000 popula- tion, which constitute 12 percent of all cities transfer- ring responsibility for functions, made 15 percent of all reported transfers.

Table Vl l l
Municipalities with Agreements for Receipt of Services With
Numberof Have Agree- With With Other Reporting ment for Munici- With School Special
Cities Services pality County District Districts
Num- Per- Num- Per- Num- Per- Num- Per- Num- Per- ber cent ber cent ber cent ber cent ber cent
Total. All Cities . . . . . . . . . . . . . . . . . . 2. 375
Population Group Over 500. 000 . . . . . . . . . . . . . . . . 1 0 250.000.500. 000 . . . . . . . . . . . . . . 1 0 100.000.250. 000 . . . . . . . . . . . . . . 50 50.000.100. 000 . . . . . . . . . . . . . . 1 1 0 25.00 0. 50. 000 . . . . . . . . . . . . . . 236 10.00 0. 25. 000 . . . . . . . . . . . . . . 532 5.000.10. 000 . . . . . . . . . . . . . 618 2.50 0. 5. 000 . . . . . . . . . . . . . . 812
Under 2. 500 . . . . . . . . . . . . . . . . . . 17
Geographic Region Northeast . . . . . . . . . . . . . . . . . . . . 502 North Central . . . . . . . . . . . . . . . . . 791 South . . . . . . . . . . . . . . . . . . . . . . . . 706 West . . . . . . . . . . . . . . . . . . . . . . . . . 398
Form of Government Mayor-Council . . . . . . . . . . . . . . . 1. 148 Council-Manager . . . . . . . . . . . . . 1. 098 Commission . . . . . . . . . . . . . . . . . . 78 Town Meeting . . . . . . . . . . . . . . . . 57 Representative Town Meeting . 14
MetroICity Type . . . . . . . . . . . . . . . . . . . . . . Central 155
Suburban . . . . . . . . . . . . . . . . . . . . 1. 076 Non-Metropolitan . . . . . . . . . . . . . 1. 164
With Public
Authority
Num- ber
249
0 5
14 31 46 5 1 52 49
1
67 58 8 1 43
91 157
5 6 1
37 142 70
Per- cent
17
0 63 39 35 46 14 14 11 14
24 11 2 1 14
14 2 1 11 20 13
32 19 11
With State
With Other Units
Num- ber
429
1 7
22 39 64 93 98
104 2
79 122 123 105
167 233
16 11 2
53 201 176
Per- cenl
29
13 88 61 44 36 26 27 23 29
29 24 32 34
26 3 1 35 37 25
45 26 29
Num- ber
21 7
3 6
12 2 1 3 1 4 1 4 1 62
0
37 73 66 4 1
88 118
4 4 2
39 112 76
Per- cent
15
38 75 33 24 17 11 11 14 0
13 14 17 13
14 15
9 13 25
33 13 12
Source: Joseph F . Zimmerman. "lntergovernmental Service Agreements and Local Governmental Reorganization (Washington. D.C Transfer of Functions. " in Advisory Commission on lntergovernmental Rela- Printing Office. 1974). p . 36 . tions. Substate Regionalism and the Federal System. Vol . Ill; Challenge of
U.S . Government

Council-manager municipalities, constituting 54 percent of all transferring municipalities, made 56 percent of all transfers, while mayor-council munici- palities, constituting 39 percent of all transferring municipalities, accounted for 38 percent of all transfers.
Central cities comprised 10 percent of all transfer- ring municipalities and made 17 percent of all transfers, while suburban municipalities, which make up 49 percent of all transferring units, accounted for 45 percent of all transfers. Our earlier survey of inter- governmental service agreements revealed that central cities and suburban municipalities entered into agree- ments with other governments for the receipt of
services with about the same degree of fre- quency - 75 percent and 71 percent respectively (see Table VIII).
Table IX relates the shift of functional responsibil- ity to the change in the transferring units' population between 1960 and 1970. Although all four classes of municipalities most often shifted responsibility for solid waste collection and disposal, rapid growth units did so significantly less often - 13 percent compared to 19 or 20 percent for the other units. Whereas rapid growth units shifted responsibility for sewage collec- tion and treatment at the same rate as solid waste collection and disposal, the transfer of responsibility for sewage collection and treatment ranked fourth or
Table IX
Cities Transferring Responsibility for a Function Classified by Population Change,
Declining Municipalities
(0 to 10O0/o)
1 960- 1970
Slow Growth Municipalities
(0 to 1O0/0)
Moderate Growth Municipalities
(1 0 to 25%)
Rapid Growth Municipalities (25 to 1000%) Total
tdministrative and . . . . . . . . . . Legal
Taxation and Assessment . . . . . . . . .
Elections. . . . . . . . . . . . . . . . . . . . . . . . Social Services
Planning . . . . . . . . . . . . . . . Recreation . . . . . . . . . . . . . Law Enforcement.. . . . . . Fire Protection and
Civil Defense . . . . . . . . Environmental
. . . . . . . . . . Protection. Public Works Sewage Collection and
Treatment . . . . . . . . . . . Solid Waste Collection
. . . . . . . . and Disposal . . . . . . . . . Water Supply..
Transportation . . . . . . . . . . . . . . . . . . . . . . . Education
. . . . . . . . . Public Health.. Housing and
Community Development . . . . . . . .
Building and Safety . . . . . . . . . . Inspection.
Miscellaneous . . . . . . . . . . Total. . . . . . . . . . . . . . . . . . .
Num- be r
15
25 9
33 19 6
5 1
10
5 12
30
74 10 17 12 51
2
15 3
399
Per- cent
4
6 2 8 5 2
13
3
1 3
8
19 3 4 3
13
1
4 1
100
Num- ber
12
30 5
25 5
10 30
8
6 4
24
63 7
10 6
42
6
17 1
31 1
Per- cent
4
10 2 8 2 3
10
3
2 1
8
20 2 3 2
14
2
5 0
100
Num- ber
7
38 11 28 17 7
30
14
4 5
25
67 8
13 10 36
2
17 2
34 1
Per- cent
2
11 3 8 5 2 9
4
1 1
7
20 2 4 3
11
0
5 0
1 00
Num- ber
18
60 19 48 21 21 71
27
12 22
84
84 32 16 20 53
5
17 3
633
Per- cent
3
9 3 8 3 3
11
4
2 3
13
13 5 3 3 8
1
3 0
100
Num- ber
52
153 44
134 62 44
182
59
27 43
163
288 57 56 48
182
15
66 9
1,684
Per- cent
3
9 3 8 4 3
11
4
2 3
10
17 3 3 3
11
1
4 1
1 00

Function
Table X
Recipients of Functions1 Transfers. By Type
Total Another Council Number Munici- Special of
of ~ a l i t y County State District Governments Functional Transfers Percent Percent Percent Percent Percent
(A) Number of (A) Number of (A) Number of (A) Number of (A) Number of (A)
............... I Total Functions 1. 708 121 7 958 56 231 14 324 19 74 4 1 Administrative and Legal ...... Taxation and Assessment ..... Elections ..................... Social Services ............... Planning ..................... Recreation ................... Law Enforcement ............. Fire Protection and Civil
Defense ................... Environmental Protection ..... Public Works ................. Sewage Collection and
Treatment ................. Solid Waste Collection
and Disposal .............. Water Supply ................. Transportation ............... Education .................... Public Health ................. Housing and Community
Development .............. Building and Safety
Inspections ................ Miscellaneous ................
Note: Percentages may not add to 100 percent owing to rounding .

Chart I
Reasons for Transferring Functional Responsibilities
Reason for Transferring Function Percentage of Cities Transferring
Achieve Economies of Scale 58
Eliminate Duplication 44
Lack of Facilities and Equipment - 41
Fiscal Restraints 29
Lack of Personnel 26
Inadequate Services 22
Jurisdictional or Geographic Limitations - 21
Federal Aid Requirements/lncentives 20
I I I 0 20 40 60 80 100
lower in terms of frequency by municipalities in the other population change categories.
Recipients of Transfers
The county was the recipient of 56 percent of the 1,708 functions or components transferred to other units of government by reporting municipalities. Special districts and the state were the recipients of 19 percent and 14 percent, respectively, of the functions shifted by municipalities. Transfers of functions and components to other municipalities and councils of governments were minimal - 7 percent and 4 per- cent, respectively (see Table X).
Nearly one-fourth (23%) of all transfers to the county involved solid waste collection and disposal. The most commonly shifted function to the state was social services which accounted for more than one- third (35%) of all transfers to the state. Thirty percent of all transfers to special districts involve sewage collection and treatment. Thirty-one percent of all transfers to councils of governments involved plan- ning.
Functions most often transferred to the county were elections (98%), solid waste collection and dispo- sal (75%), public health (74%), and law enforcement (73%).
The state was the recipient of 61 percent of all social service transfers and the county was the recip- ient of 34 percent of such transfers. The county and the state were the recipients of 49 percent and 23 percent, respectively, of all transfers of administrative and legal functions and components.
Special districts were the recipients of 47 percent of all water supply transfers, and other municipalities were the recipients of 40 percent of such transfers. Responsibility for planning most often was shifted to the county (42%) and councils of governments (35%).
Reasons for Transfers
The survey questionnaires requested each respon- dent reporting one or more transfers to "check the three most important reasons that best explain your municipality's decision" to shift responsibility for the function(s) or component(s) to another governmental

unit. In addition to "other," eight reasons were listed - (1) achieve economies of scale, (2) lack of facili- ties and equipment, (3) lack of personnel, (4) elimi- nate duplication, (5) inadequate services, (6) fiscal restraints, (7) jurisdictional or geographic limitations, and (8) Federal aid requirements1 incentives.
Six hundred of the municipalities (58%) reporting the transfer of at least one function or component checked "achieve economies of scale" as a reason for shifting the responsibility for the function or compo- nent (see Chart I and Table XI). In addition, respon- dents checked the following reasons: eliminate dupli- cation, 457 (44%); lack of facilities and equipment, 427 (41%); fiscal restraints, 299 (29%); lack of per- sonnel, 270 (26%); inadequate services, 223 (22%); jurisdictional or geographic limitations, 219 (21%); and Federal aid requirements/incentives, 21 1 (20%).
With respect to the principal forms of administra- tion, manager municipalities (69%) checked "achieve economies of scale" significantly more often than mayor municipalities (54%). Larger units also checked the achievement of economies of scale more frequently than smaller units with all municipalities in the 250,000 to 500,000 population category checking this reason compared to 54 percent of the units in the 2,500 to 4,999 population class. Since central cities on the average are larger than suburban or non- metropolitan units, the finding that 84 percent of the central cities checked this reason compared to 62 percent of the suburban and 57 percent of the non- metropolitan units was to be expected.
Significant regional variations are found relative to the achievement of economies of scale as a reason motivating municipalities to shift responsibility for functions. Ninety-five percent of the 142 municipali- ties in the Northeast who had transferred functions checked this reason compared to 20 percent of the municipalities in the North Central region, 58 percent of the units in the South, and 71 percent of the units in the West.
Larger units also checked "eliminate duplication" more often than smaller units. Eighty-eight percent of the municipalities over 500,000 population checked this reason compared to only 38 percent of the units in the 2,500 to 4,999 population category. There were no significant regional differences in the percentage of municipalities checking the elimination of duplication as a motivation for shifting responsibility for a func- tion or component, but there were significant differ- ences between central cities (83%), suburban units (38%), and non-metropolitan units (50%). Slightly over one-half of the council-manager municipalities (51%) and slightly under one-half (45%) of the mayor-
council municipalities were motivated by this reason. The third reason checked by more than one-third
of the respondents (41%) - "lack of facilities and equipment" - was a motivating factor for units over 500,000 (63%) and units in the 2,500 to 4,999 popula- tion category (52%). Interestingly, only 23 percent of the cities in the 250,000 to 500,000 population class checked this reason. Municipalities in the Northeast (67%) were motivated more often by this reason than municipalities in each of the other three regions which each checked this reason with approximately the same degree of frequency. In view of the fact that 63 percent of the units over 500,000 population checked this reason, it is somewhat surprising to discover that only 36 percent of the central cities as compared to 46 percent of the suburban municipalities checked this reason. Lack of facilities and equipment was a slightly more important motivating factor in mayor-council municipalities (48%) than in council-manager munici- palities (42%).
Table XI1 is a breakout of responses on a func- tional basis. The percentages are based on all reasons for transferring a particular function or component. Fifty-one percent of the responses indicated that achievement of economies of scale was the dominant reason for transferring functional responsibilities, while 41 percent indicated elimination of duplication, 29 percent lack of facilities, and 22 percent fiscal restraints.
Achievement of economies of scale was the pre- dominant reason indicated for shifting responsibility for education (71%), public works (62%), taxation and assessment (58%), fire protection and civil de- fense (58%), solid waste collection and disposal (56%), and public health (56%).
State mandate was the motivating factor in shifting responsibility for elections (51%) and social services (48%). Federal air requirements and incentives were one of the prime motivating factors in the transfer of responsibility for sewage collection and treatment (39%).
Table XIII classifies the reasons for the transfer of responsibility for functions and components by recip- ient unit. Achievement of economies of scale was a significantly less important motivating reason for transfers to the state (34%) than for transfers to the other recipient units. Lack of facilities and equipment was a much more important reason for shifting functional responsibility to another municipality (54%) than for shifts to the other recipient units. The elimination of duplication ranked considerably higher as a reason for functional transfers to the county (51%) than for transfers to the other recipient units.

Total. All Cities ...............
Population Group Over 500. 000 ..............
........... 250.000~500. 000
........... 100.000.250. 000
........... 50.000.100. 000 25.00 0. 50. 000 ........... 10.00 0. 25. 000 . . . . . . . . . . . 5.00 0. 10. 000 ........... 2.50 0. 5. 000 . . . . . . . . . . .
Geographic Region ................. Northeast
.............. North Central South ..................... West ......................
Form of Government ............ Mayor-Council
Council-Manager .......... ............... Commission
Town Meeting ............. Representative Town
Meeting ................
Metro/CWy Type Central .............. Suburban ................. Non-Metropolitan ..........
Achieve Economies
of Scale
Number
600
6 13 18 46 92 148 132 145
135 203 147 116
205 362 16 14
4
80 290 231
Percent
58
75 100 60 78 77 63 55 54
95 20 58 71
54 69 70 4 1
33
84 62 57
Table XI
Reasons for Functional Transfers
Lack of
Facilities
Lack of
Personnel
Number
427
5 3 7 23 40 90 119 140
95 143 119 70
183 22 1 1 1 9
3
34 214 179
Percent
4 1
63 23 29 39 34 38 49 52
67 45 47 43
48 42 48 26
25
36 46 44
Number
270
1 4 2
1 1 26 64 65 97
59 89 63 59
97 160 6 6
1
19 139 112
Percent
26
13 31 7 19 22 27 27 36
42 28 25 36
25 31 26 18
8
20 30 28
Eliminate Duplication
Number
457
7 10 22 32 70 105 107 103
75 162 128 92
171 267 10 7
2
79 177 20 1
Percent
44
88 77 73 54 59 44 44 38
53 5 1 51 56
45 51 43 2 1
17
83 38 50
Inadequate Services
Number
223
6 7 6 13 27 52 52 59
53 84 50 36
92 114 39 7
1
33 107 83
Percent
21
75 54 20 22 23 22 22 22
37 26 20 22
24 22 9 21
8
35 23 20

Total. All Cities . . . . . . . . . . . . . . .
Population Group Over 500. 000 . . . . . . . . . . . . . .
. . . . . . . . . . . 250.000.500. 000
. . . . . . . . . . . 100.000.250. 000 50.000.100. 000 . . . . . . . . . . . 25.00 0. 50. 000 . . . . . . . . . . . 10.00 0. 25. 000 . . . . . . . . . . . 5.00 0. 10. 000 . . . . . . . . . . . 2.50 0. 5. 000 . . . . . . . . . . .
Geographic Region . . . . . . . . . . . . . . . . . Northeast
North Central . . . . . . . . . . . . . . . . . . . . . . . . . . . . . . . . . . . South
...................... West
Form of Government Mayor-Council . . . . . . . . . . . . Council-Manager . . . . . . . . . .
. . . . . . . . . . . . . . . Commission ............. Town Meeting
Representative Town Meeting . . . . . . . . . . . . . . . .
Metro/City Type . . . . . . . . . . . . . . . . . . . . Central
. . . . . . . . . . . . . . . . . Suburban Non-Metropolitan . . . . . . . . . .
Fiscal Restraints
Number
299
6 11 16 20 46 70 65 65
70 100 66 64
104 181
7 6
2
50 136 114
Percent
29
75 85 53 34 39 30 27 24
49 3 1 26 39
27 35 30 18
17
53 29 28
Table X I (Cont.)
Jurisdictibnal Limitations
Number
21 9
6 7
12 23 36 49 57 29
30 83 59 48
67 147
2 0
4
47 92 8 1
Percent
21
75 54 40 39 30 2 1 24 11
21 26 23 29
18 28 9 0
33
49 20 20
Federal Aid Requirements or Incentives
Number
21 1
5 5
10 14 37 50 50 40
55 67 53 36
77 123
2 7
2
37 98 76
Percent
20
63 38 33 24 31 21 2 1 15
39 21 2 1 22
20 24
9 21
17
39 21 19
Number
31 9
4 7
10 19 42 86 77 74
80 124 80 36
123 169
8 17
3
39 141 140
Other
Percent
31
50 54 33 32- 35 36 32 27
56 39 32 22
32 32 35 50
25
41 30 35

Table XI1
Reasons Municipalities Transferred, By Type of Function Total
Functions Achieve Jurisdic- Federal Aid with Economies Eliminate Lack of Fiscal Lack of tional State Inadequate Require-
Reasons of Scale Duplication Facilities Restraints Personnel Limitations Mandate Services ment Other
Per- Per- Per- Per- Per- Per- Per- Per- Per- Per- cent cent cent cent cent cent cent cent cent cent
Indicated Num- of Num- of Num- of Num- of Num- of Num- of Num- of Num- of Num- of Num- of Function (A) ber (A) ber (A) ber (A) ber (A) ber (A) ber (A) ber (A) ber (A) ber (A) ber (A)
I Total Reasons.. . . . 1,596 818 51 656 41 457 29 349 22 307 19 301 19 280 18 240 15 232 15 137 9 I Administrative and
Legal . . . . . . . . . . Taxation and
Assessment . . . . Elections . . . . . . . . . . Social Sewices . . . . Planning . . . . . . . . . . Recreation . . . . . . . . Law Enforcement.. Fire Protection and
Civil Defense . . . Environmental
Protection. . . . . . Public Works . . . . . . Sewage Collection
and Treatment.. Solid Waste
Collection and Disposal . . . . . . .
Water Supply.. . . . . Transportation . . . . Education . . . . . . . . . Public Health.. . . . . Housing and
Community Development . . .
Building and Safety Inspections. . . . .
Miscellaneous . . . . .
I Note: Percentages add to more than 100 percent owing to multiple responses. I

Table Xlll
Reasons for Transfers Classified by Recipient Unit
Another Municipality
Reason Number Percent
The County
Number Percent
Special Council of District Governments
Number Percent Number Percent
The State
Number Percent
Achieve Economies of Scale.. . . . . . . . . . . .
Lack of Facilities and Equipment . . . . . .
Lack of Personnel ...... Eliminate Duplication ... Inadequate Services . . . . Fiscal Restraints . . . . . . . . Jurisdictional
Limitations . . . . . . . . . . Federal Air Requirements
or Incentives . . . . . . . . . . . . . . . . . . . . . . State Law
Other Reason . . . . . . . . . . Total Number of
Respondents . . . . . . . .
Table XIV
Reasons for Functional Transfers Classified by Population Change, 1960-1 970
Declining Slow Growth Moderate Growth Rapid Growth Municipalities Municipalities Municipalities Municipalities
(0 to 100%) (0 to 10%) (10 to 25%) (25 to 1000%) Total
Reason Number Percent Number Percent Number Percent Number Percent Number Percent
Achieve Economies of Scale.. . . . . . . . . . . . 136 56
Lack of Facilities and Equipment . ..... 96 40
Lack of Personnel . . . . . . 57 24 . . . Eliminate Duplication 113 47
. . . . Inadequate Services 55 23 Fiscal Restraints.. . . . . . . 70 29 Jurisdictional
Limitations . . . . . . . . . . 45 19 Federal Aid
Requirements or Incentives . . . . . . . . . . . 52 22
. . . . . . . . . . Other Reason 68 28

This finding was to be anticipated since a municipality and a county engage in several common functional activities. Also expected was the finding that fiscal restraints motivated the shift of functional responsi- bility more often to the special district (33%) than for transfers to the other recipient units. Fiscal restraints in several states refer to constitutional and/or statu- tory debt and tax limitations which apply to munici- palities but not to special districts. There is relatively little correlation between rates of population change and the reasons for functional transfers (see Table X I v. Results of Transfers
Each respondent reporting the transfer of a func- tion or a component was requested to indicate the effect of the transfer of the function(s) and compo- nent(~) in terms of (1) more uniform service levels, (2) more efficient use of capital resources, (3) more efficient use of personnel, (4) better management of the function or component, (5) lower unit costs, (6) higher unit costs, (7) poorer quality service, (8) higher quality service, (9) other.
Table X V , reveals general satisfaction with the results of functional transfers. Forty-four percent of the respondents cited higher quality service, and 43 percent cited lower unit costs compared to 14 percent of the respondents who checked poor quality service and 21 percent who checked higher unit costs. More uniform service levels was checked by 44 percent of the respondents, better management of the function or component was checked by 43 percent, more efficient use of personnel was checked by 41 percent, and more efficient use of capital resources was checked by 40 percent.
Cities over 500,000 population were most satisfied with the results of the transfers as evidenced by the fact that ten of the 11 (91%) cities checked more uniform service levels and eight (73%) checked better management of function and higher quality service. By way of contrast, we note that only 43 percent of the cities in the 250,000 to 500,000 population class checked more uniform service levels; 36 percent checked better management of function and 43 per- cent checked higher quality service.
Relative to regional differences in perceptions of the effects of the transfers, municipalities in the Northeast are least satisfied and municipalities in the West are most satisfied. Only 36 percent of the units in the Northeast checked more uniform service levels compared to 52 percent of the units in the West. A similar difference is to be noted with respect to more
efficient use of capital resources; only slightly more than one-fourth of the Northeastern municipalities checked this reason whereas it was checked by nearly one-half of the municipalities in the West.
Council-manager governments generally were more satisfied with the results of functional transfers than mayor-council governments, but the differences in the rates of satisfaction do not vary greatly with the exception of better management of function, which was checked by 63 percent of the council-manager municipalities and by only 43 percent of the mayor- council municipalities.
Central cities also are generally more satisfied with the effects of the functional transfers than suburban and non-metropolitan municipalities. Twenty-two percent of the central cities, however, reported poorer quality service whereas only 12 percent of the subur- ban units and 13 percent of the non-metropolitan units reported a deterioration in the quality of the service as a result of transfers of functional responsi- bilities.
Table X V I breaks down the perceived results of transfers by function. Fifty-three percent of the re- spondents perceived the transfer of responsibility for public works as resulting in more uniform service levels, but only 28 percent perceived higher quality service as a result of the transfer. Only 6 percent of the respondents felt that the transfer of responsibility for public works resulted in higher unit costs whereas 50 percent of the respondents perceived the transfer resulting in lower unit costs.
Perceptions of better management of the function as a product of a transfer ranged from 30 percent of the respondents with respect to water supply to 58 percent with respect to recreation. The range for more efficient use of capital resources was 14 percent for social services to 58 percent for education. Percep- tions of more efficient use of personnel varied from 18 percent for water supply to 54 percent for administra- tive and legal transfers. The range for lower unit costs was 8 percent for environmental protection to 51 percent for taxation and assessment. And perceptions of higher quality services varied from 22 percent for elections to 58 percent for recreation.
Table XVZI classifies the perceived results of transfers by recipient unit. Forty-two percent of the municipal respondents believe that more uniform service levels have resulted from transfers to the county, but only 25 percent of the respondents believe that a similar result is a product of transfers to a council of governments. Transfers to the state are least often perceived as resulting in more efficient use of capital resources (13%) and higher quality service

I Classification
Table XV
Results of Functional Transfers
More Better More Efficient Use More Manage- Poorer Higher
Uniform of Capital Efficient Use ment Lower Unit Higher Unit Quality Quality Service Levels Resources of Personnel of Function Costs Costs Service Service
Total Cities Per- Per- Per- Per- Per- Per- Per- Per-
Transferring cent cent cent cent cent cent cent cent Functions Num- of Num- of Num- of Num- of Num- of Num- of Num- of Num- of
(A) ber (A) ber (A) ber (A) ber (A) ber (A) ber (A) ber (A) ber (A)
............... Total. Allcities 1. 039 460 44 415 40 422 41 451 43 442 43 221 21 148 14 455 44
Population Group Over 500. 000 .............. 250.000400. 000 ........... 100.000.249. 999 ........... 50.00 0- 99. 999 ........... 25.00 0. 49. 999 ...........
........... 10.00 0. 24. 999 5.00 0- 9. 999 ........... 2.50 0. 4. 999 ...........
Geographic Region Northeast ................. 261 94 36 69 26 78 30 99 38 90 34 51 20 38 15 90 34 North Central . . . . . . . . . . . . . . 331 162 49 143 43 135 31 135 31 152 46 78 24 53 16 155 47 South ..................... 270 112 40 122 45 120 44 131 49 122 45 51 19 35 13 125 46 West ...................... 177 92 52 81 46 89 50 86 49 78 44 41 23 22 12 84 47
Metro/City Type Central .................... 109 61 66 52 58 63 67 55 50 44 40 20 19 24 22 47 43 Suburban ................. 505 225 41 193 35 186 34 214 39 222 22 107 19 67 12 219 39 Non-Metropolitan .......... 425 174 41 170 40 173 41 182 43 176 41 94 22 57 13 188 44
Form of Government Mayor-Council ............ 404 173 43 153 38 154 38 173 43 174 43 86 21 49 12 170 42 Council-Manager .......... 558 266 46 245 44 246 44 254 63 248 44 115 21 88 16 262 47 Commission ............... 25 8 32 8 32 14 56 12 48 8 32 7 28 1 4 11 44 Town Meeting ............. 39 12 31 8 21 7 18 11 28 10 26 12 31 9 23 10 26 Representative Town
................ Meeting 13 1 8 1 8 1 8 1 8 2 1 5 1 8 1 8 1 8
Note: Percentages add to more than 100 percent owing to multiple responses .
Other
Per- cent
Num- of ber (A)

Function
Administrative and Legal . . . . . . Taxation and Assessment ..... Elections .....................
............... Social Services Planning . . . . . . . . . . . . . . . . . . . . .
................... Recreation Law Enforcement ............. Fire Protection and
Civil Defense .............. Environmental Protection ..... Public Works .. . . . . . . . . . . . . . . . Sewage Collection and
Treatment . . . . . . . . . . . . . . . . . Solid Waste Collection
and Disposal . . . . . . . . . . . . . . . . . . . . . . . . . . . . . . . Water Supply
Transportation . . . . . . . . . . . . . . . . . . . . . . . . . . . . . . . . . . . Education
Public Health ................. Housing and Community
Development . . . . . . . . . . . . . . Building and
Safety Inspection .......... Miscellaneous . . . . . . . . . . . . . . . . Totals ........................
Table X VI
Perceived Results of Transfers. By Function
More Uniform Sewice Levels
Number Percent
22 44 65 46 15 4 1 43 4 1 24 39 16 40 7 1 4 1
19 37 12 46 19 53
48 29
60 23 22 39 25 46 20 47 83 48
5 36
30 50 2 25
596 39
More Efficient Use of Capital
Resources
Number Percent
More Efficient Use of
Personnel
Number Percent
Better Management of Function
Number Percent

Function
Administrative and Legal . . . . . . Taxation and Assessment . . . . . Elections . . . . . . . . . . . . . . . . . . . . . Social Services . . . . . . . . . . . . . . . Planning . . . . . . . . . . . . . . . . . . . . . Recreation . . . . . . . . . . . . . . . . . . . Law Enforcement . . . . . . . . . . . . . Fire Protection and
Civil Defense .............. Environmental Protection . . . . . Public Works . . . . . . . . . . . . . . . . . Sewage Collection and
Treatment ................. Solid Waste Collection
and Disposal . . . . . . . . . . . . . . Water Supply . . . . . . . . . . . . . . . . . Transportation ... . . . . . . . . . . . . Education . . . . . . . . . . . . . . . . . . . . Public Health . . . . . . . . . . . . . . . . . Housing and Community
Development .............. Building and
Safety Inspection . . . . . . . . . . Miscellaneous . . . . . . . . . . . . . . . . Totals ........................
Lower Unit Costs
Number
20 71 11 15 15 15 78
25 2
18
45
111 16 14 11 62
4
14 3
550
Percent
40 51 30 14 25 38 45
49 8
50
30
42 28 26 26 36
29
23 38 36
Table XVI (Cont.)
Perceived Results of Transfers. By Function
Higher Unit Costs
Number
2 10 4
3 1 2 3
2 1
5 1 2
38
57 2 1
4 4
20
0
10 0
235
Percent
4 7
11 30
3 8
12
10 4 6
26
22 37
7 9
12
0
17 0
15
Poorer Quality Service
Number
7 18 5
20 7 2
22
1 2 4
10
15 5 3 2
20
20
5 0
150
Percent
14 13 14 19 12 5
13
2 8
11
7
6 9 6 5
12
4
8 0
10
Higher Quality Service
Number
14 43
8 24 27 23 66
28 8
10
5 1
88 29 27 18 60
8
16 2
550
Percent
28 31 22 23 44 58 38
55 31 28
34
33 5 1 50 42 35
57
27 25 36
Other
Number Percent Number of
Respondents
50 140 37
105 61 40
175
51 26 36
149
265 57 54 43
174
14
60 8
1. 545

Perceived Results
More Uniform Service Levels . . More Efficient Use of
Capital Resources ......... More Efficient Use of
Personnel ................. Better Management
.............. of Function.. Lower Unit Costs ............. Higher Unit Costs.. ...........
........ Poorer Quality Service Higher Quality Service ........ Other Result.. ................ Total Number of
Respondents ..............
Table XVll
Perceived Results of Transfers Classified by Recipient Unit
Another Municipality The County Special District
Number Percent Number Percent Number Percent
36 3 1 367 42 101 35
4 1 36 309 35 123 43
34 30 344 39 87 30
42 37 33 1 38 120 42 48 42 342 39 95 33 20 17 112 13 6 1 2 1 8 7 85 10 13 5
54 47 307 35 118 41 8 7 88 10 39 14
115 100 880 100 289 100
Council of Governments
Number Percent
17 25
The State
Number Percent
75 39
25 13
5 1 26
54 28 42 22 36 19 39 20 40 2 1 24 12
193 100
Table XVlll
Perceived Results of Transfers Classified by Population Change, 1960-1 970
Declining Municipalities (0 to 100%)
Number Percent
More Uniform Service Levels . . 108 45 More Efficient Use of
Capital Resources ......... 105 43 More Efficient Use
.............. Of Personnel 96 40 Better Management of
Function .................. 105 43 Lower Unit Costs . . . . . . . . . . . . . 102 42 Higher Unit Costs.. . . . ........ 42 17
........ Poorer Quality Service 3 1 13
........ Higher Quality Service 99 41 Other Result.. ................ 29 12
Slow Growth
Number Percent
8 1 40
Moderate Growth Municipalities
(1 0 to 25%)
Number Percent
76 36
Rapid Growth Municipalities (25 to 1000%)
Number Percent
153 40
Total
Number Percent
41 8 40

(21%), and are most often perceived as resulting in poorer quality service (20%). In contrast, transfers to a special district are most often perceived as resulting in more efficient use of capital resources (43%) and least often as resulting in poorer quality service (5%).
Classifying the perceived results of transfers by the population change of the respondents' municipalities in the period 1960-1970 reveals that declining munici- palities most often (45%) and moderate growth units (36%) least often perceive transfers as resulting in more uniform service levels (see Table XVIII) . A similar pattern exists with respect to more efficient use of capital resources. Rapid growth units (44%) most often and slow growth units (37%) least often
of the functions. Interestingly, declining municipali- ties (41%) and rapid growth municipalities (40%) most often report that functional transfers have resulted in higher quality service.
Effects on Middle-Tier Units
Each respondent was asked his or her perception of the effect of transfers of responsibility for the perfor- mance of functions and components of functions on the need for subcounty special districts, a modernized county government, a multicounty regional service agency, and a council of governments or regional
perceived transfers as resulting in better management planning commission.
Table XIX
Effects of Transfers on Subcounty Special Districts
Classification
Total, All Cities . . . . . . . . . . . .
Population Group Over 500,000 . . . . . . . . . . . . . . 250,000-500,000 .....:..... 100,000-249,999 . . . . . . . . . . . 50,000- 99,999 . . . . . . . . . . . 25,000- 49,999 . . . . . . . . . . . 10,000- 24,999 . . . . . . . . . . . 5,000- 9,999 . . . . . . . . . . . 2,500- 4,999 . . . . . . . . . . .
Geographic Region Northeast . . . . . . . . . . . . . . . . . North Central. . . . . . . . . . . . . .
. . . . . . . . . . . . . . . . . . . . . South West . . . . . . . . . . . . . . . . . . . . . .
MetroICity Type . . . . . . . . . . . . . . . . . . . Central.
. . . . . . . . . . . . . . . . . Suburban Independent. . . . . . . . . . . . . . .
Form of Government Mayor-Council . . . . . . . . . . . . Council-Manager . . . . . . . . . . Commission. . . . . . . . . . . . . . . Town Meeting ............. Representative Town Meeting
Reduced the Number Need for of Cities
Reporting Percent Number
242
4 3
12 9
37 54 62 6 1
35 76 55 76
29 118 95
7 1 162
7 2 0
Increased the Need for
Percent Number of (A)
No Effect
Percent Number of (A)
Note: Percentages may not add to 100 percent owing to rounding.

Table XX
Effect of Transfers on Modernized County Government
Classification
Total. All Cities . . . . . . . . . . . . . .
Population Group Over 500,000 .............. 250,000-500,000 ...........
. . . . . . . . . . . 100,000-249,999 50,000- 99,999 . . . . . . . . . . . 25,000- 49,999 . . . . . . . . . . . 10,000- 24,999 . . . . . . . . . . . 5,000- 9,999 . . . . . . . . . . .
. . . . . . . . . . . 2,500- 4,999
Geographic Region Northeast . . . . . . . . . . . . . . . . . North Central.. . . . . . . . . . . . . South . . . . . . . . . . . . . . . . . . . . . West . . . . . . . . . . . . . . . . . . . . . .
MetroICity Type Central. . . . . . . . . . . . . . . . . . . . Suburban . . . . . . . . . . . . . . . . . Non-Metropolitan . . . . . . . . . .
Form of Government Mayor-Council . . . . . . . . . . . . Council-Manager . . . . . . . . . .
. . . . . . . . . . . . . . Commission. Town Meeting . . . . . . . . . . . . . RepresentativeTown Meeting
Reduced the Number Need for of Cities
Reporting Percent (B) Number of (6)
Increased the Need for
Percent Number of (B)
No Effect
Percent Number of (6)
Note: Percentages may not add to 100 percent owing to rounding.
Subcounty Special Districts. Sixty-one percent of the 1,106 municipalities reported that transfers had no effect on the need for subcounty special districts compared with 22 percent that indicated a reduced need and 17 percent that indicated an increased need for such districts (see Table XIX) . While one-third of the cities over 500,000 population perceived a reduced need for such districts, only 13 percent of the cities in the 50,000 to 99,999 population class held the same perception. Twenty percent of the municipalities in the latter population category felt the need for sub- county special districts had been increased whereas only 7 percent of the municipalities in the 250,000 to 500,000 population class held a similar perception.
A significant regional difference in responses is apparent. Only 16 percent of the municipalities in the Northeast perceived a reduced need for subcounty special districts, while one-third of the municipalities in the West perceived a reduced need. The difference in the perceptions of responding mayor-council munici- palities and council-manager municipalities is notice- able but not striking with 17 percent of.the former and 26 percent of the latter perceiving that the need for such districts had been reduced. The differences in perceptions among central, suburban, and non- metropolitan municipalities is not significant. ,
Modernized County Governments. Table XX con-

tains a significant finding: 45 percent of the 1,168 responding municipalities perceive an increased need for a modernized county government as a result of the shifting of responsibility for functions and compo- nents of functions. Only 6 percent indicated that the transfers had reduced the need for a modernized county government, but 49 percent reported that transfers had no effect on the need for such a govern- ment.
Only minor differences appear in the perceptions of municipalities in the various population classes with one exception. None of the municipalities in the 250,000 to 500,000 population category felt that transfers had reduced the need for a modernized county government.
Geographical differences of opinion are more pronounced: Only 35 percent of the municipalities in the Northeast perceived an increased need for a modernized county government compared to 49 per- cent in the North Central region and in the South. The perception of Northeastern municipalities reflect a t least in part the fact that organized county govern- ment was abolished in Rhode Island and Connecticut in 1842 and 1960, respectively, and is a relatively weak unit of local government in the other four New England states.
Mayor-council municipalities and council- manager municipalities generally held the same opin- ions regarding the impact of functional transfers on the need for a modernized county government, al-
Table XXI
Effect of Transfers on Multicounty Service Agency
Classification
Total, All Cities . . . . . . . . . . . . . . .
Population Group Over 500,000 . . . . . . . . . . . . . . 250,000-500,000 . . . . . . . . . . . 100,000-249,999 . . . . . . . . . . . 50,000- 99,999 . . . . . . . . . . . 25,000- 49,999 . . . . . . . . . . . 10,000- 24,999 ........... 5,000- 9,999 . . . . . . . . . . . 2,500- 4,999 ...........
Geographic Region Northeast . . . . . . . . . . . . . . . . . North Central.. ............
. . . . . . . . . . . . . . . . . . . . . South West . . . . . . . . . . . . . . . . . . . . . .
MetroICity Type Central. . . . . . . . . . . . . . . . . . . . Suburban . . . . . . . . . . . . . . . . . Non-Metropolitan . . . . . . . . . .
Form of Government Mayor-Council . . . . . . . . . . . . Council-Manager . . . . . . . . . . Commission.. , . . . . . . . . . . . . Town Meeting . . . . . . . . . . . . . Representative Town Meeting
Reduced the Number Need for of Cities
Reporting Percent Number
119
2 1 4 8
14 30 29 3 1
32 33 26 28
11 60 48
42 72
2 2 1
Increased the Need for
Percent Number of (C)
No Effect
Percent Number of (C)
Note: Percentages may not add to 100 percent owing to rounding.

Table X X l l
Effect of Transfers on Council of Governments
Reduced the Number Need for
Increased the Need for No Effect
Classification
. . . . . . . . Total, All Cities
Population Group Over 500,000 . . . . . . . . . . . . . . 250,000-500,000 . . . . . . . . . . . 100,000-249,999 . . . . . . . . . . . 50,000- 99,999 . . . . . . . . . . . 25,000- 49,999 . . . . . . . . . . . 10,000- 24,999 . . . . . . . . . . . 5,000- 9,999 . . . . . . . . . . . 2,500- 4,999 . . . . . . . . . . .
Geographic Region Northeast . . . . . . . . . . . . . . . . . North Central.. . . . . . . . . . . . . South . . . . . . . . . . . . . . . . . . . . . West . . . . . . . . . . . . . . . . . . . . . .
MetroICity Type Central. . . . . . . . . . . . . . . . . . . . Suburban . . . . . . . . . . . . . . . . . Non-Metropolitan . . . . . . . . . .
Form of Government Mayor-Council . . . . . . . . . . . . Council-Manager . . . . . . . . . . Commission. .............. Town Meeting . . . . . . . . . . . . .
of Cities Reporting
(Dl Number Percent of (Dl
7
8 0 8 8 7 7 8 6
7 7 8 6
5 7 8
8 7 0 4 0
Number
390
5 3
12 30 43 88 90
119
85 131 82 92
47 203 140
146 220
12 9 3
Percent of (Dl
34
42 2 1 32 38 28 33 34 38
37 35 27 39
36 35 32
34 34 36 39 27
Number
674
6 11 22 42
101 163 156 173
130 218 194 132
78 334 262
250 382 2 1 13 8
Percent of (Dl
59
50 79 60 54 65 60 58 56
56 58 65 55
59 58 60
58 59 64 57 73
Note: Percentages may not add to 100 percent owing to rounding.
though the former (41%) were less inclined to perceive an increased need than the latter (49%). The percep- tions of central cities, suburban municipalities, and non-metropolitan municipalities did not vary greatly as regards the increased need for a modernized county government because of functional transfers.
Multicounty Regional Service Agencies. Two-thirds of the municipalities reported that the shifting of re- sponsibility for functions and components had no effect on the need for a multicounty regional service agency (see Table XXZ). Only 23 percent of the municipalities indicated an increased need for such an agency. The major difference in perception of an increased need for such an agency was between su-
burban municipalities and non-metropolitan munici- palities. Twenty-five percent of the former saw an increased need compared to 19 percent of the latter. Perceptions did not vary greatly by population size, geographic region, o r form of government.
Councils of Governments. Thirty-four percent of the reporting municipalities saw an increased need for a council of governments or a regional planning com- mission as a consequence of functional transfers (see Table XXII). Fifty-nine percent of the municipalities perceived that functional transfers had no effect on the need for a council of governments or a regional planning commission. Significantly, 42 percent of the

cities over 500,000 population indicated there was an increased need compared to only 21 percent of the cities in the 250,000 to 500,000 population category. Responses did not vary greatly by geographic regions, forms of government, or central city, suburban, and non-metropolitan locations.
Plans for Future Transfers
Relative to plans for the future transfer of respon- sibility for a function or a component of a function to another governmental unit, only 360 municipal re- spondents (12%) indicated that their governments were planning to transfer functional responsibilities within the next two years (see Table XXIII). Signifi- cantly, 43 percent of the cities over 500,000 popula- tion plan to shift responsibility for one or more functions. In contrast, only 9 percent of the units in the 2,500 to 4,999 population category and 10 percent of the units in the 5,000 to 9,999 population category plan to transfer functional responsibility. Regional differences in plans to shift functions and components to another governmental unit vary from 9 percent of the municipalities in the South, to 12 percent of the municipalities in the North Central region, to 13 percent of the units in the Northeast, to 16 percent of the units in the West.
In conformity with our earlier finding relative to the frequency of transfers during the past ten years, 17 percent of the council-manager municipalities plan to shift responsibility for functions and components compared to only 8 percent of the mayor-council municipalities. In view of the fact that a large percent- age of the cities over 500,000 population plan to transfer functions and components within the next two years, it is not surprising that twice as many central cities (22%) report they plan to shift functional responsibility to another governmental unit as non- metropolitan municipalities ( 1 1%). Suburban munici- palities (12%) plan to transfer functional responsibil- ity with approximately the same degree of frequency as non-metropolitan municipalities (1 1%).
Table XXIV reveals that the county is the favored recipient unit for functions municipalities are plan- ning to transfer during the next two years. Three functions - solid waste collection and disposal (48), law enforcement (41), and public health (26) - stand out as the functions municipalities are most willing to transfer to the county. The special district is the favorite intended recipient for sewage collection and treatment (1 8) and transportation ( 1 6). Interestingly, municipalities have indicated a greater preference for the state than for the special district as the recipient
Table XXlll
Municipalities Planning to Transfer A Function or a Component Within
The Next Two Years
Cities Number Planning of Cities to Transfer Report-
Classification
......... Total, All Cities
Population Group ........ Over 500,000
..... 250,000-500,000
..... 100,000-249,999 50,000- 99,999 ..... 25,000- 49,999 ..... 10,000- 24,999 ..... 5,000- 9,999 ..... 2,500- 4,999 . . . . .
Geographic Region Northeast ........... North Central.. ...... South . . . . . . . . . . . . . . . West ................
MetroICity Type Central. .............
........... Suburban Non-Metropolitan ....
Form of Government Mayor-Council . . . . . . Council-Manager . . . .
......... Commission Town Meeting ....... Representative
Town Meeting ....
Number
360
6 3
12 31 48 93 79 88
94 112 80 74
45 175 1 40
1 20 21 6
10 12
2
Percent
unit for solid waste collection and disposal. The smallest number of planned transfers involve elec- tions, environmental protection, housing and com- munity development, and building and safety inspec- tion.
Rapidly growing municipalities are planning to transfer responsibility for the largest number of func- tions and components during the next two years (see Table XXV). Law enforcement (22), sewage collection and treatment (22), and solid waste collection and disposal (19) are the three functions which these municipalities plan to transfer with the greatest fre- quency. Declining, slow growth, and moderate

growth municipalities report that solid waste collec- tion and disposal is the function that they plan to transfer most often during the next two years.
Other Service Arrangements
To obtain data on the nature and scope of inter- governmental agreements for the provision of 76 services, a 20-page questionnaire was mailed in 1972 to 5,930 municipalities over 2,500 population. Re- sponses received from 38 percent of the units were classified by population categories, geographical re- gions, forms of government, and central city, subur- ban, and non-metropolitan locations (see Table VIIZ). Sixty-three percent of the responding municipalities reported that they had entered into formal and infor-
I
ma1 agreements for the provision of services to their citizens by other governmental units or private firms. The latter play a major role in providing certain services to municipalities. Of the 385 municipalities reporting the receipt of refuse collection service under contracts, 339 (88%) received the service from private firms. Eighty-six percent of the 253 agreements rela- tive to engineering services involved the private sec- tor. The percentage was 84 for legal services, 79 for street lighting, 67 for public relations services, and 64 for microfilm services.
In our 1975 survey, respondents were asked to indicate whether their municipalities preferred to use intergovernmental service agreements and/or contracts with private firms for the provision of services to their citizens rather than a permanent
I Table XXlV
Planned Transfers Classified by Function and Recipient Unit
Another Council of Munici- The Special Govern- The Other Did Not pality County District ments State Unit Specify Total
I Reason Num- Per- Num- Per- Num- Per- Num- Per- Num- Per- Num- Per- Num- Per-
ber cent ber cent ber cent ber cent ber cent ber cent ber cent I Administrative
andLegal . . . . . . . . . . . 1 5 3 2 1 1 2 6 0 0 0 0 0 0 7 Taxation and
Assessment ......... 0 0 13 7 3 3 0 0 1 4 1 33 0 0 18 Elections ............... 0 0 1 0 0 0 0 0 0 0 0 0 0 0 1 Social Services . . . . . . . . . 1 5 5 3 1 1 0 0 0 0 0 0 0 0 7 Planning . . . . . . . . . . . . . . . 1 5 12 6 9 10 12 39 0 0 1 33 0 0 35 Recreation . . . . . . . . . . . . . 0 0 2 1 7 8 1 3 1 4 0 0 0 0 1 1 LawEnforcement ....... 1 5 41 22 2 2 2 6 3 13 0 0 2 8 5 1 Fire Protection
and Civil Defense.. . . 1 5 5 3 4 4 0 0 0 0 0 0 1 4 1 1 Environmental
Protection ........... 1 5 2 1 0 0 1 3 0 0 0 0 0 0 4 Public Works.. . . . . . . . . . 0 0 1 0 2 2 2 6 0 0 0 0 1 4 6 Sewage Collection
andTreatment . . . . . . . 8 41 10 5 18 19 4 13 0 0 0 0 3 12 43 Solid Waste
Collection and Disposal ............ 3 16 48 26 11 12 2 6 14 61 0 0 5 20 83
Water Supply.. ......... 1 5 2 1 8 9 1 3 0 0 0 0 2 8 1 4 Transportation ......... 1 5 4 2 16 17 2 6 0 0 1 33 3 12 27 Education ............... 0 0 3 2 3 3 0 0 0 0 0 0 2 8 8 Public Health.. ......... 0 0 26 14 5 5 2 6 2 9 0 0 3 12 38 Housing and
Community Development . . . . . . . . 0 0 1 0 2 2 0 0 0 0 0 0 2 8 5
Building and Safety Inspection . . . . . . . . . . . 0 0 3 2 1 1 0 0 1 4 0 0 0 0 5
Miscellaneous . . . . . . . . . . 0 0 3 2 0 0 0 0 1 4 0 0 1 4 5 Totals.. ................ 19 100 185 100 93 100 31 100 23 100 3 100 25 100 379

Table XXV
Cities Planning to Transfer Responsibility for a Function Classified by Population Change,
Declining Municipalities
(0 to 10O0Io)
Slow Growth Moderate Growth Municipalities Municipalities
(0 to 10%) (10 to 25%)
Rapid Growth Municipalities (25 to 1 000°10)
Function
Administrative and . . . . . . . . . . . . . . . Legal
Taxation and Assessment . . . . . . . . .
. . . . . . . . . . . . . . Elections. Social Services . . . . . . . . . Planning . . . . . . . . . . . . . . .
. . . . . . . . . . . . . Recreation Law Enforcement.. ..... Fire Protection
and Civil Defense .... Environmental
. . . . . . . . . . Protection. Public Works . . . . . . . . . . . Sewage Collection
and Treatment.. . . . . . Solid Waste
Collection and Disposal . . . . . . . . . . . .
Water Supply.. . . . . . . . . . Transportation . . . . . . . . . Education . . . . . . . . . . . . . . Public Health.. . . . . . . . . . Housing and
Community Development . . . . . . . .
Building and Safety Inspection. . . . . . . . . . .
Miscellaneous .......... . . . . . . . . . . . . . . . . . Totals
Num- ber
0
4 0 3 6 4
13
3
0 2
6
2 1 3 5 3 7
1
2 0
83
Per- cent
0
5 0 4 7 5
16
3
0 2
7
25 4 6 4 8
1
2 0
100
Num- ber
3
2 0 0 6 2 7
1
2 0
4
24 2 7 0 7
2
1 2
72
Per- Num- cent ber
4 1
3 5 0 1 0 1 8 4 3 2
10 7
1 1
3 0 0 1
6 11
33 18 3 0
10 6 0 1
10 6
3 1
1 0 3 1
100 67
Per- cent
1
7 1 1 6 3
10
1
0 1
16
27 0 9 1 9
1
0 1
100
Num- ber
3
7 0 3
18 3
22
6
2 3
22
19 9 9 4
14
1
2 2
149
Per- cent
2
5 0 2
12 2
15
4
1 2
15
13 6 6 3 9
1
1 1
100
Num- ber
7
18 1 7
34 11 49
11
4 6
43
82 14 27 8
34
5
5 5
37 1
Total
Per- cent
2
5 0 2 9 3
13
3
1 2
12
22 4 7 2 9
1
1 1
100
transfer of responsibility for a function or a compo- nent of a function.
Service Agreements. Table XXVI reveals that ap- proximately one-third of the municipal respondents prefer to use intergovernmental service agreements for the receipt of services than to transfer the respon- sibility for a function to another governmental juris- diction. The preference for service agreements over transfers of functional responsibility is associated directly with increasing population size. Only 23 percent of the municipalities in the 2,500 to 4,999 population group and 30 percent of the units in the
5,000 to 9,999 population group expressed a prefer- ence for service agreements compared to 69 percent of the cities in the 250,000 to 500,000 population cate- gory and in the over 500,000 population category. This finding also is reflected in the fact that a prefer- ence for service agreements over the transfer of functional responsibility was checked by 24 percent of the non-metropolitan municipalities and 50 percent of the central cities.
A significant regional difference in preference is apparent as 48 percent of the municipalities in the West indicate they prefer to use intergovernmental service agreements rather than to transfer responsibil-

ity for a function or a component compared to 26 percent of the municipalities in the Northeast express- ing a similar preference. This finding may be attribu- table to the fact that a relatively strong unit of local government capable of providing services (the county) to municipalities under agreements exists in many areas of the West, whereas there are no organized county governments in Connecticut and Rhode Is- land, and the county governments in the other four New England states have an outmoded organizational structure and lack the authority and resources needed to provide urban type services under agreements to municipalities.
Another significant finding is the greater prefer- ence for intergovernmental service agreements over functional transfers expressed by council-manager
municipalities (41%) compared to mayor-council mu- nicipalities (25%).
Contracts with Private Firms. Slightly over one-third of the respondents, as indicated by Table XXVI expressed a preference for contracting with a private firm for the provision of a service than for shifting responsibility for a function or component to another governmental unit. Again, the preference for private contracts is associated directly with increasing popu- lation size, with only 32 percent of the municipalities in the 2,500 to 4,999 population class and 37 percent of the municipalities in the 10,000 to 24,999 popula- tion class indicating a preference for contracts with private firms, compared to 53 percent of the units in the 250,000 to 500,000 population class and 71 per-
Classification
Table X X Vl
Municipalities Preferring Service Agreements and Private Contracts to Functional Transfers
Intergovernmental Service Agreements Contracts with Private Firms
Total, Ail Cities ...........................
Population Group Over 500,000 . . . . . . . . . . . . . . . . . . . . . . . . . . 250,000-500,000 .......................
....................... 100,000-249,999 50,000- 99,999 ....................... 25,000- 49,999 ....................... 10,000- 24,999 ....................... 5,000- 9,999 ....................... 2,500- 4,999 . . . . . . . . . . . . . . . . . . . . . . .
Geographic Region Northeast ............................. North Central.. . . . . . . . . . . . . . . . . . . . . . . . . South ................................. West . . . . . . . . . . . . . . . . . . . . . . . . . . . . . . . . . .
MetroICity Type Central. ...............................
. . . . . . . . . . . . . . . . . . . . . . . . . . . . . Suburban kon-~etropolitan . . . . . . . . . . . . . . . . . . . . . .
Form of Government Mayor-Council . . . . . . . . . . . . . . . . . . . . . . . . Council-Manager . . . . . . . . . . . . . . . . . . . . . . Commission. . . . . . . . . . . . . . . . . . . . . . . . . . . Town Meeting ......................... Representative Town Meeting . . . . . . . . . .
Number Number of Cities of Cities
Reporting Use Percent Reporting (A) Agreements of (A) (B)
Use Percent Contracts of (B)

Table X X V l l
Cities Assuming Responsibility for a Function Classified by Transferring Unit and Population Change,
1960-1 970
822 Declining Municipalities . . . . . . . . . . . . . . . (0 to 100°10)
688 Slow Growth Municipalities
. . . . . . . . . . . . . . . . (0 to 10%) 693 Moderate Growth
Municipalities . . . . . . . . . . . . . . . (10 to 25%)
1,098 Rapid Growth Municipalities (25 to 1 0OO01o) . . . . . . . . . . . . .
Another Private Firm The County Municipality The State
Number Percent Number Percent Number Percent Number Percent
98 13 35 5 30 4 26 3
86 13 28 4 33 5 18 3
102 15 40 6 3 1 5 2 1 3
131 12 76 7 68 7 44 4
cent of the cities over 500,000 population. The smaller central cities obviously have less preference for pri- vate contracts than large central cities as reflected in the fact that only 40 percent of the central cities, compared to 42 percent of the suburban municipali- ties, expressed a preference for private contracts over the transfer of responsibility for functions. A signifi- cant regional difference in preference is to be noted with only one-fourth of the southern municipalities compared to nearly one-half of the western munici- palities expressing a preference for contracts with private firms over functional transfers. The difference in views of mayor-council and council-manager units is not significant, although the latter (39%) expressed a slightly greater preference for private contracts than the former (35%).
ASSUMPTION OF FUNCTIONAL RESPONSIBILITY
The data analyzed to this point clearly indicate that there has been a substantial number of transfers of functional responsibilities by municipalities to higher levels of government. We must point out that there are many individuals who argue that responsibility for numerous functions is overcentralized and that func- tions should be shifted to a lower governmental level in order to provide greater responsiveness to the needs of the citizenry and to improve the efficiency of service provisions.l A few, states have responded to
this argument by authorizing the devolution of re- sponsibility for a function or component of a func- tion.
The 1968 California Legislature enacted the Com- munity Mental Health Services Act, effective in 1969, transferring responsibility for mental health services to counties with a population in excess of 100,000 and providing state reimbursement of 90 percent of the net costs.2 The 1969 New York State Legislature, re- sponding to pressures from advocates of political decentralization of schools, decentralized the New York City school system by establishing a federated system with limited community control effective July 1, 1970, and the 1970 Michigan Legislature enacted a law establishing a similar federated school system in Detroit.3
To collect data on the assumption of responsibility for governmental functions by municipalities, each respondent was asked whether his or her municipality had assumed responsibility or had responsibility transferred to it for any function(s) or component(s) of a function (e.g., public transportation or rubbish collection) that previously was performed by a private firm, the county, another municipality, or the state.
Classifying the municipalities assuming responsi- bility for a function or component by population change, we discover that responsibility for functions was assumed as follows: 319 by rapid growth units, 194 by moderate growth units, 165 by slow growth units, and 189 by declining units (see Table XXVII) .
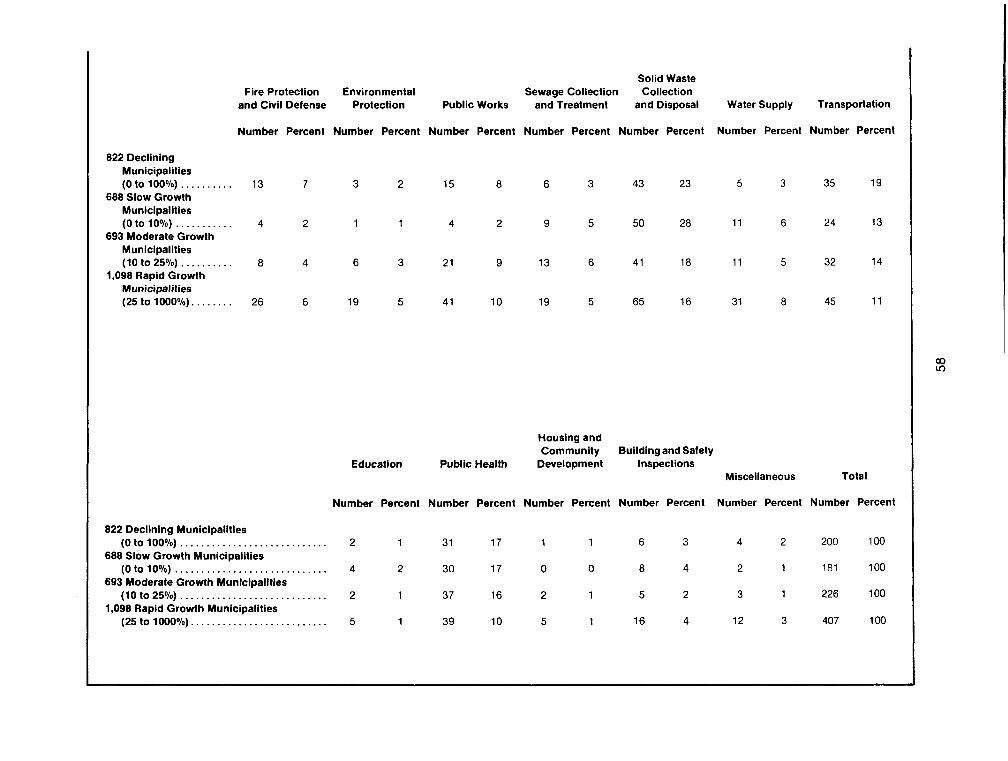
Solid Waste Fire Protection Environmental Sewage Collection Collection
and Civil Defense Protection Public Works and Treatment and Disposal Water Supply Transportation
Number Percent Number Percent Number Percent Number Percent Number Percent Number Percent Number Percent
822 Declining Municipalities (0 to 10O0/o) . . . . . . . . . . 13 7 3 2 15 8 6 3 43 23 5 3 35 19
688 Slow Growth Municipalities (0 to 10%) . . . . . . . . . . . 4 2 1 1 4 2 9 5 50 28 11 6 24 13
693 Moderate Growth Municipalities (10 to 25%) .. . . . . . . . . 8 4 6 3 2 1 9 13 6 41 18 11 5 32 14
1,098 Rapid Growth Municipalities (25 to 1000%). . . . . . . . 26 6 19 5 4 1 10 19 5 65 16 31 8 45 11
Housing and Community Building and Safety
Education Public Health Development Inspections Miscellaneous Total
Number Percent Number Percent Number Percent Number Percent Number Percent Number Percent
822 Declining Municipalities (0 to 100°/o) . . . . . . . . . . . . . . . . . . . . . . . . . . . . 2 1 31 17 1 1 6 3 4 2 200 100
688 Slow Growth Municipalities (0 to 10%) ............................. 4 2 30 17 0 0 8 4 2 1 181 100
693 Moderate Growth Municipalities (10 to 25%) . . . . . . . . . . . . . . . . . . . . . . . . . . . . 2 1 37 16 2 1 5 2 3 1 226 100
1,098 Rapid Growth Municipalities (25 to 1000%). . . . . ..................... 5 1 39 10 5 1 16 4 12 3 407 100

that most often has been assumed by municipalities in each of the four population change categories (see Table XXVIII ) . Interestingly, the second most com- monly assumed function by declining and rapid growth municipalities is transportation, whereas pub- lic health is the second most commonly assumed function by slow and moderate growth municipalities.
Table X X I X reveals that municipalities assumed responsibility for a total of 874 functions or compo- nents of functions during the period 1965-1975. Most new functions were ones that previously had been performed by private firms.
Private Firms
Thirteen percent of the functions previously had been performed by private firms, 6 percent had been performed by the county, 5 percent had been per- formed by another municipality, and 4 percent had been performed by the state government. The rela- tively high percentage of functions assumed from private firms reflects in part municipalities assuming responsibility for public transportation to preserve a service threatened by the bankruptcy or near bank- ruptcy of the local private transportation company. Several state governments have mandated that mu- nicipalities assume responsibility for a service - such as the operation of a sanitary landfill to dispose of rubbish - which previously had been provided by a private firm.
The assumption of responsibility for a service previously provided by a private firm is closely asso- ciated with population size. Whereas only 6 percent of the units in the 2,500 to 4,999 population category and 12 percent of the units in the 5,000 to 9,999 population category assumed responsibility for a service previously provided by a private firm, 59 percent of the units in the 250,000 to 500,000 popula- tion class and 64 percent of the cities over 500,000 population have assumed responsibility for a service provided in the past by a private firm(s).
A significant regional difference exists between the tendency for municipalities in the Northeast and municipalities in the other three regions to assume responsibility from private firms for a function(s). Only 8 percent of the units in the Northeast reported assuming responsibility for such functions compared to 14 percent of the units in the South and 16 percent of the units in the North Central and Western regions.
Relative to the two principal forms of municipal government, manager-council communities (17%) are more apt to assume responsibility for a function(s)

frdm a private firm than mayor-council communities (10%). Commission cities assumed responsibility for such functions with about the same degree of fre- quency ( I 5%) as manager-council municipalities.
In view of the.fact that large cities have a greater proclivity to assume responsibility for functions from private firms than smaller cities, it is not surprising that 42 percent of the central cities compared to 12 percent of the non-metropolitan units and 1 1 percent of the suburban units assumed responsibility for functions from private firms.
The County
Relative to functions transferred by counties to municipalities, a major divergence from the tendency of larger units to assume more functions from private firms is to be noted. Only 8 percent of the municipali- ties over 500,000 population reported accepting re- sponsibility for a function(s) from the county com- pared to 19 percent of the cities in the 250,000 to 500,000 population class and 18 percent of the cities in the 100,000 to 249,999 population class. This finding is not surprising when one considers the fact that large central cities generally are financially hard pressed and would experience difficulty in financing new functions.
In terms of regions of the nation, municipalities in the West (13%) are most apt and municipalities in the Northeast (2%) are least apt to accept responsibility for functions transferred by counties. The finding for the Northeastern municipalities was to be expected, since organized county governments do not exist in two of the New England states and the county govern- ments in the other four New England states have few functions to transfer.
Interestingly, manager-council municipalities (10%) are more than three times as apt to accept responsibility for a function from the county than mayor-council municipalities (3%). Table XXIX also reveals, as expected, that central cities (14%) have a much greater propensity to accept functional transfers from the county than suburban units (6%) and non- metropolitan units (5%).
Another Municipality
Other municipalities transferred 5 percent of the total number of functions assumed by reporting municipalities. Although there is a tendency for larger units to assume more functions from other municipal- ities, we note a major exception with respect to units in the 50,000 to 99,999 population class. Ten percent
of the units in this class reported assuming responsi- bility for a function from another municipality com- pared to only 6 percent of the municipalities in the 250,000 to 500,000 population class and 8 percent of the cities over 500,000 population.
There is relatively little difference in the tendency of municipalities in each of the four regions of the country to assume responsibility for functions trans- ferred by another municipality. A more important difference in the tendency is to be noted with respect to the two principal forms of municipal government. Eight percent of the manager-council municipalities reported assuming responsibility for a function from another municipality compared to three percent of the mayor-council municipalities. This finding may be the result gf the greater ability and willingness of the manager-council units to accept responsibility for functions.
Metropolitan location accounts for a relatively important difference in the tendency of municipalities to assume responsibility for functions from other municipalities. Ten percent of the central cities ac- cepted responsibility for such functions compared to only 4 percent of the non-metropolitan municipalities and 6 percent of the suburban municipalities.
The State Government
One-hundred-eleven municipalities reported that they have assumed responsibility for functions pre- viously performed by the state government. Larger cities have a greater tendency to accept responsibility for functions transferred by the state than smaller municipalities. Twenty-one percent of the cities over 500,000 population and 18 percent of the cities in the 250,000 to 500,000 population group took over re- sponsibility for functions or components of functions from the state, whereas only 2 percent of the units in the 2,500 to 4,999 population class and 3 percent of the units in the 5,000 to 9,999 population class assumed responsibility for functions from the state.
Regional differences in the rates of transfers of functional responsibility from the state to municipali- ties are not large - 3 percent in the North Central region and the South and 5 percent in the Northeast and the West.
Manager-council municipalities (5%) have a greater tendency to accept responsibility for func- tional transfers from the state than mayor-council municipalities (2%). Central cities (9%), as antici- pated, assumed responsibility more frequently for functions transferred by the state than suburban units (3%) and non-metropolitan units (3%).

Classification
......... Total. All Cities
Population Group Over 500. 000 ........ 250.000-500. 000 ..... 100.000-249. 999 ..... 50.000- 99. 999 ..... 25.000- 49. 999 ..... 10.00 0- 24. 999 ..... 5.00 0- 9. 999 ..... 2.50 0- 4. 999 .....
Geographic Region Northeast ........... North Central ........
............... South west ................
MetroICity Type .............. Central
Suburban ........... Non-Metropolitan ....
Form of Government Mayor-Council ...... Council-Manager .... Commission ......... Town Meeting ....... Representative
Town Meeting ....
Table X X l X
Cities Assuming Responsibility for a Function Classified by Transferring Unit
Private Firm
Number Number Reporting of Cities
Assuming
420
9 10 23 40 67
102 99 70
60 154 126 80
89 170 161
164 232
17 5
2
Percent of (A)
13
64 59 37 27 23 15 12 6
8 16 14 16
42 11 12
10 17 15 6
8
County
Number Number Reporting of Cities
Assuming
180
1 3
11 2 1 22 51 38 33
11 42 63 64
29 90 6 1
49 127
4 0
0
Percent of (6 )
6
8 19 18 14 8 8 5 3
2 4 7
13
14 6 5
3 10 4 0
0
Another Municipality
Number Number Reporting of Cities
Assuming
163
2 1 5
14 2 1 44 46 30
44 50 39 30
2 1 92 50
49 105
5 4
0
Percent of (C)
5
15 6 8
10 7 7 6 3
6 5 4 6
10 6 4
3 8 5 5
0
State
Number Number Reporting of Cities
Assuming
111
3 3 7 9
15 25 28 21
34 29 24 24
18 53 40
34 68
1 7
1
Percent of (Dl
4
21 18 11 6 5 4 3 2
5 3 3 5
9 3 3
2 5 1 9
4

Table X X X
Municipalities Required by the State to Perform a New Function
Required by State to
Number Assume of Cities Responsibility Report-
Classification
..... Total. All Cities
Population Group . . . . . . . . Over 500,000
..... 250,000-500,000
. . . . . 100,000-249,999 50,000- 99,999 ..... 25,000- 49,999 ..... 10,000- 24,999 ..... 5,000- 9,999 ..... 2,500- 4,999 .....
Geographic Region Northeast ...........
...... North Central.. South ............... West ................
MetroICity Type Central. .............
........... Suburban .... Non-Metropolitan
Form of Government ...... Mayor-Council
.... Council-Manager ........ Commission. ....... Town Meeting
Representative Town Meeting . . . . . . .
ing (A)
2,943
14 17 61
139 280 643 767
1,022
708 924 854 457
198 1,475 1,270
1,477 1,273
100 7 1
22
Number
691
6 8
21 44 61
163 169 219
163 205 174 149
60 327 304
284 361
16 19
11
Percent
State-Mandated Assumptions
Municipal respondents also were asked if their state government during the past ten years had re- quired the performance of a function or component of a function that their municipalities had never pre- viously performed. The Florida Local Government Comprehensive Planning Act of 1975, for example, requires all cities and counties to prepare and adopt comprehensive plans by July 1, 1979.4 In the event a city fails to adopt a plan, the county planning agency (if one exists) assumes responsibility for the prepara- tion and adoption of the plan. If a county defaults in
its responsibility, the plan is prepared by the Division of State Planning.
Twenty-three percent, or 691, of the responding municipalities reported that their state government had mandated the performance of a new function or component of a function (see Table X X X ) . States more often required large cities to perform a new function than small cities. Forty-three percent of the cities over 500,000 population stated that they were required by the state to perform a new function compared to 22 percent of the municipalities in the 5,000 to 9,999 population class and 21 percent of the municipalities in the 2,500 to 4,999 population class.
Western municipalities (33%) reported a much greater tendency for their state government to man- date the performance of a new function than munici- palities in the South (20961, North Central region (22%), and Northeast (23%). Central cities also re- ported a much greater tendency (30%) than suburban municipalities (22%) and non-metropolitan units (24%) for the state to mandate the performance of a new function.
FOOTNOTES
'For a description and analysis of the arguments in favor of the devolution of functional responsibilities, see Joseph F. Zimmer- man, The Federated City: Community Control in Large Cities (New York: St. Martin's Press, 1972). The existing fragmented local government system is justified by a group of political scientists and political economists who equate the system to a market system in which local governments provide different types and quality of goods and services. Individuals, according to the public choice theory, can vote by their feet and move to the local jurisdiction providing the mix of paods and services that will benefit the individuals the most. For further information, see Charles M. Tiebout. "A Pure Theory of Local Expenditures," Journal of Political Economy, October 1956, pp. 416-24; Vincent Ostrom, Charles M. Tiebout, and Robert Warren, "The Organization of Government in Metropolitan Areas: A Theoretical Inquiry," The American Political Science Review, December 1961, pp. 831-42; Robert Warren, Governments in Merropolitan Regions (Davis: Institute of Governmental Affairs of the University of California, 1966); Robert L. Bish and Vincent Ostrom, Understanding Urban Government: Metropolitan Re- form Reconsidered (Washington, D.C.: American Enterprise Institute for Public Policy Research, 1973); and Robert L. Bish, The Public Economy of Metropolitan Areas (Chicago: Rand McNally College Publishing Company, 1971).
2California Acrs of 1968, Chap. 989; California Welfare and Institutions Code, §§ 5600-64.
3New York Laws of 1969. Chap. 330; Michigan Public Acts of 1970, Public Act 48. For further details, see Joseph F. Zimmerman, The Federated City: Community Control in Large Cities (New York: St. Martin's Press 1972).
4Florida Laws of 1975, Chap. 75-257.

Chapter VI
A lthough the United States Constitution i'n 1788 assigned complete or partial responsibility for func-
Pragmatic tions to the national government or the states, vertical transfers of functional responsibilities between gov- ernments have been a prominent feature of the
Federalism American federal system as pragmatic officials have sought solutions for governmental problems. In addi- tion, horizontal transfers of functional responsibilities between local governments have been common as officials have sought to improve service delivery.
State legislatures have played a major role in changing the relationship between governmental units by either mandating and /o r facilitating functional transfers. Legislatures, however, have evidenced rela- tively little interest in the development of criteria for the transfer of functions and the systematic reassign- ment of functional responsibilities. Most legislatures have enacted transfer statutes on a function-by- function basis, and only ten states have adopted general constitutional and /o r legislative authoriza- tion for the voluntary transfer of functional responsi- bility. In five of these states, the voluntary shifting of functional responsibility is hindered by the require- ment for voter approval in a referendum.
SUMMARY OF SURVEY FINDINGS
Nearly one-third of the 3,319 municipalities re- sponding to our national survey have transferred responsibility, voluntarily or involuntarily, for a func- tion or a component of a function t o another govern- mental unit during the period 1965 t o 1975. The most commonly transferred functions, in order of fre- quency of transfer, were solid waste collection and disposal, law enforcement, public health, sewage collection and treatment, taxation and assessment of property, social services, building and safety inspec- tions, and planning. As was anticipated, the largest number of municipalities reporting functional transfers shifted responsibility for only one function, and the favorite recipients were the county and the special district. Responsibility for social services, however, was most often shifted to the state.
Survey data clearly indicate that the tendency to transfer functional responsibility is related directly to population size, with larger municipal units generally having a greater propensity to shift responsibility for

a function than smaller units. The difference between municipalities in the proclivity to transfer responsibil- ity for functions is even more noticeable when one examines the units shifting responsibility for five or more functions. More than one-third of the respond- ing municipalities over 500,000 population trans- ferred responsibility for five or more functions com- pared to 2 percent of the units in each of the three smallest population groupings. This finding is not surprising in view of the fact that financially hard- pressed central cities have been seeking to shift to higher level units of government responsibility for expensive facilities - hospitals, libraries, museums are examples - which service residents of the region.
The data reveal that there is little correlation between the transfer of functional responsibilities and the rate of population change of municipalities be- tween 1960 and 1970. Rapidly growing units did have a slightly greater tendency to shift responsibility for a function than units in the other population change categories. A breakdown of the functions transferred by municipalities in each of the four population change categories reveals that rapidly growing units had the greatest propensity to shift responsibility for sewage collection and treatment. This function ranked fourth or lower in terms of frequency of transfer by municipalities in the other three popula- tion groupings.
According to officials in municipalities which transferred responsibility for functions during the past ten years, the achievement of economies of scale, elimination of duplication, and lack of facilities and equipment were the three principal reasons for shift- ing responsibility for functions. "To achieve econo- mies of scale" was checked by nearly 70 percent of the manager-council municipalities compared to slightly over one-half of the mayor-council municipalities.
Although there is relatively little correlation be- tween rates of population change and the reasons for functional transfers, achievement of economies of scale was a significantly less important motivating reason for transfers to the state than for transfers to the other recipient units. The elimination of duplica- tion ranked considerably higher as a reason for functional transfers to the county than for transfers to the other recipient units.
Respondents indicated general satisfaction with the results of the transfers of functional responsibility. Over 40 percent checked higher quality service and lower unit costs in comparison with 21 percent who checked higher unit costs and 14 percent who checked poorer quality service. In general, manager-council municipalities were more satisfied with the results of
functional transfers than mayor-council units. The greatest satisfaction was expressed by central cities.
More than one-half of the survey respondents perceived more uniform service levels, but only 28 percent perceived higher quality service as results of the transfer of responsibility for public works. Percep- tions of better management of the function as a product of a transfer ranged from 30 percent of the respondents with respect to water supply to 58 percent with respect to recreation.
By classifying perceived results of transfers by recipient unit, we discovered that two-fifths of the respondents believe that more uniform service levels have resulted from transfers to the county compared to one-fourth of the respondents who believe a similar result is a product of a transfer to a council of governments. Transfers to the state are least often perceived as resulting in more efficient use of capital resources and higher quality service and are most often perceived as resulting in poorer quality service.
Declining units most often, and moderate growth units least often, perceived transfers as resulting in more uniform service levels and more efficient use of capital resources. Declining and rapid growth munici- palities most often reported that the shift of func- tional responsibilities has resulted in higher quality service.
Most respondents felt that functional transfers had no effect on the need for subcounty special districts, a multicounty regional service agency, and a council of governments or a regional planning commission. Forty-five percent, however, believed that the need for a modernized county government has been in- creased because of functional transfers by municipali- ties to the county.
Relative to plans for the transfer of functional responsibility during the next two years, one-eighth of the municipalities indicated plans for such transfers. Plans for shifting functional responsibilities correlate directly with the population size of the units - 43 percent of the cities over 500,000 population, but only 9 percent of the units in the 2,500 to 4,999 population class plan to transfer functional responsibility within the next two years.
The county is the favored recipient unit for planned functional transfers by municipalities, and solid waste collection and disposal, law enforcement, and public health are the three functions that munici- palities most often plan to shift to the county during the next two years. The special district is the favorite intended unit for the receipt of responsibility for transportation and sewage collection and treatment. An examination of the 1960-1970 rate of population

Table X X X I
Assumption and Transfer of Functional Responsibilities
I Did Not Assume Did Assume Number of Municipalities
I Number Percent Number Percent Number Percent
Did Not Transfer. . . 1,884 83 396 17 2,280 69 Did Transfer. . . . . . . 720 69 31 9 31 1,039 31 Total. . . . . . . . . . . . . . 2,604 79 71 5 21 3,319 100
change for municipalities planning functional transfers reveals that rapidly growing units are plan- ning the largest number of transfers.
Assumption of Functional Responsibility
Our national survey reveals that municipalities have assumed responsibility for functions, in addition to transferring responsibility for functions and com- ponents of functions to other governmental jurisdic- tions. Responsibility for a total of 870 functions and components has been assumed by responding munici- palities. Thirteen percent of the functions previously had been performed by private firms, 6 percent had been performed by counties, and 4 percent had been performed by state governments. The tendency to assume responsibility for a service previously pro- vided by a private firm is closely associated with the population size of the assuming municipalities, with a significantly larger percentage of large municipalities reporting the assumption of responsibility. Manager- council municipalities are much more likely to accept responsibility for a new function(s) than mayor- council municipalities. It is significant to note that 23 percent of the responding municipalities reported that their state government had mandated the perfor- mance of a new function.
Classifying municipalities by population change between 1960 and 1970 reveals that responsibility for functions was assumed as follows: 319 by rapid growth units, 194 by moderate growth units, 165 by slow growth units, and 189 by declining units. Solid waste collection and disposal is the function that most often has been assumed by units in each of the four population change categories.
Not surprisingly, our survey revealed that some municipalities reporting the transfer of responsibility for a function or a component of a function have
assumed responsibility for a new and different func- tion or component. Table X X X I contains a cross tabulation of municipalities transferring and assum- ing responsibilities for governmental functions. Eighty-three percent of the municipalities reporting no functional transfers did not assume responsibility for a new function. On the other hand, nearly one- third of the municipalities (31%) reporting the transfer of responsibility for a function(s) assumed responsibility for a new function(s).
WHO SHOULD PROVIDE THE SERVICES?
Our 1972 questionnaire to municipal officials seek- ing information on intergovernmental service agree- ments also requested the officials t o indicate the services which they believe should be provided by county governments, regional special districts, coun- cils of governments, the state government, or the Federal government. An examination of Table X X X I I leads directly to the conclusion that a significant number of mayors, managers, and other municipal officials are convinced that county governments should play a greater role in providing services. We must point out, however, that many municipal offi- cials advancing this view reside in states where coun- ties already provide a relatively wide range of services. Nevertheless, the survey data strongly suggest a wide- spread consensus among municipal officials that responsibility for certain specified functions should be shifted upwards to the county level in most of the states with organized county governments. A number of respondents qualified their answers by stipulating that responsibility for additional functions should not be transferred to county governments until the latter are modernized.
Municipal officials displayed the greatest willing- ness to assign the following services to the county: all

Table XXXll
Who Should Provide the Services?
Service
. . . . . . . . . . . . . . . . . . . . . . . . . . . . . . . . . Assessing . . . . . . . . . . . . . . . . . . . . . . . . . . . . . . . . . . . . Payroll
Tax Collection . . . . . . . . . . . . . . . . . . . . . . . . . . . . . Treasury Functions . . . . . . . . . . . . . . . . . . . . . . . . Utility Billing . . . . . . . . . . . . . . . . . . . . . . . . . . . . . . Election Administration . . . . . . . . . . . . . . . . . . . . Legal Services . . . . . . . . . . . . . . . . . . . . . . . . . . . . .
. . . . . . . . . . . . . . . . . . . . . . . . . . . . . . . . . Licensing Microfilm Services . . . . . . . . . . . . . . . . . . . . . . . . . Personnel Services . . . . . . . . . . . . . . . . . . . . . . . . Public Relations . . . . . . . . . . . . . . . . . . . . . . . . . . . Record Maintenance and Storage . . . . . . . . . . . Registration of Voters . . . . . . . . . . . . . . . . . . . . . . . All Public Health Services . . . . . . . . . . . . . . . . . . Air Pollution Abatement . . . . . . . . . . . . . . . . . . . .
. . . . . . . . . . . . . . . . . . . . Alcoholic Rehabilitation Ambulance Service . . . . . . . . . . . . . . . . . . . . . . . . Animal Control Services . . . . . . . . . . . . . . . . . . . .
. . . . . . . . . . . . . . . . . . . . . . . . . . . . . . . . Cemeteries . . . . . . . . . . . . . . . . . . . . . . . . . . . . . . . . . . Hospitals
. . . . . . . . . . . . . . . . . . . . . . . . . . . . . Mental Health Mosquito Control . . . . . . . . . . . . . . . . . . . . . . . . . .
. . . . . . . . . . . . . . . . . Noise Pollution Abatement Nursing Services . . . . . . . . . . . . . . . . . . . . . . . . . .
. . . . . . . . . . . . . . . . . Water Pollution Abatement . . . . . . . . . . . . . . . . . . . . . . . . . . . . . . . . . . . Welfare
. . . . . . . . . . . . . . . . . . . . . . . . . . . . . Flood Control . . . . . . . . . . . . . General Development Services
. . . . . . . . . . . . . . . . . . . . . . . . . . . . . . . . . . . Housing . . . . . . . . . . . . . . . . . . . . Industrial Development
. . . . . . . . . . . . . . . . . . . . . . . . . . . . . . . . . . Irrigation
. . . . . . . . . . . . . . . . . . . . . . . . . . . . . . . . . . Mapping
. . . . . . . . . . . . . . . . . . . . . . . . . . . . . . . . . . Planning . . . . . . . . . . . . . . . . . . . . . . . . . . Soil Conservation
. . . . . . . . . . . . . . . . . . . . . . . . . . . . Urban Renewal . . . . . . . . . . . . Zoning and Subdivision Control
Parks . . . . . . . . . . . . . . . . . . . . . . . . . . . . . . . . . . . . . Recreation Facilities ....................... All Police Services . . . . . . . . . . . . . . . . . . . . . . . . . Crime Laboratory . . . . . . . . . . . . . . . . . . . . . . . . . .
. . . . . . . . . . . . . . . . . . . . . Criminal Identification
Council County Regional of Govern- Special Govern-
men t District ments
Federal or State Govern-
ment

Table XXXII (Cont'd)
Service
. . . . . . . . . . . . . . . . . . . . . . . . . . . . Patrol Services . . . . . . . . . . . . . . . . . . . . Police Communications
. . . . . . . . . . . . . . . . . . . . . . . . . . . . Police Training School Crossing Guards . . . . . . . . . . . . . . . . . . . Traffic Control . . . . . . . . . . . . . . . . . . . . . . . . . . . . . Jails and Detention Homes . . . . . . . . . . . . . . . . . Juvenile Delinquency Programs . . . . . . . . . . . .
. . . . . . . . . . . . . . . . . . . . . . Probation and Parole Work Release Programs . . . . . . . . . . . . . . . . . . . . All Fire Services . . . . . . . . . . . . . . . . . . . . . . . . . . .
. . . . . . . . . . . . . . . . . . . . . . Fire Communications Fire Prevention . . . . . . . . . . . . . . . . . . . . . . . . . . . . Training of Firemen . . . . . . . . . . . . . . . . . . . . . . . . All Civil Defense Services . . . . . . . . . . . . . . . . . . Civil Defense Communications . . . . . . . . . . . . . Civil Defense Training . . . . . . . . . . . . . . . . . . . . . Bridge Construction and Maintenance ...... Building and Mechanical Inspection . . . . . . . . Electrical and Plumbing Inspection . . . . . . . . . Electricity Supply . . . . . . . . . . . . . . . . . . . . . . . . . . Engineering Services . . . . . . . . . . . . . . . . . . . . . .
. . . . . . . . . . . . . . . . . . . . . . . . . . Refuse Collection
.......................... Sewage Disposal Sewer Lines ............................... Snow Removal . . . . . . . . . . . . . . . . . . . . . . . . . . . . Solid Waste Disposal . . . . . . . . . . . . . . . . . . . . . . . Street Construction and Maintenance . . . . . . . Street Lighting ............................ Water Supply . . . . . . . . . . . . . . . . . . . . . . . . . . . . . . Water Distribution . . . . . . . . . . . . . . . . . . . . . . . . . Special Transportation Services . . . . . . . . . . . . Management Service for Publicly Owned
Transit System . . . . . . . . . . . . . . . . . . . . . . . . . Library Services . . . . . . . . . . . . . . . . . . . . . . . . . . . Museums . . . . . . . . . . . . . . . . . . . . . . . . . . . . . . . . . Schools . . . . . . . . . . . . . . . . . . . . . . . . . . . . . . . . . . .
Council Federal County Regional of or State Govern- Special Govern- Govern-
ment District ments ment
Source: Joseph F . Zimmerman. "Intergovernmental Service Agreements and Transfer of Functions" in Advisory Commission on Intergovernmental Relations. Substate Regionalism and the Federal System. Volume I I I ; Challenge of Local Government Reorganization (Washington. D.C.: U.S. Government Printing Office. 1974). pp . 183-84 .

public health services (692), jails and detention homes (680), tax assessing (608), tax collection (557), proba- tion and parole (554), juvenile delinquency programs (507), election administration (505), welfare (503), and all civil defense services (48 1).
They were most unwilling to assign counties the following functional responsibilities: utility billing (22), public relations (31), personnel services (33), street lighting (49, treasury functions (49, records storage and maintenance (60), water distribution (67), snow removal (70), legal services (72), water supply (79), recreational facilities (83), sewer lines (87), and irrigation (93). Four of these services - utility bil- ling, public relations, street lighting, and legal ser- vices - often are performed by private firms, and a fifth service - snow removal - in many municipali- ties is partially provided by private firms.
Regional special districts, according to the 1972 municipal respondents, should be responsible primar- ily for environmental and public protection ser- vices - air pollution abatement (392), flood control (359), water pollution abatement (356), crime labora- tory (322), police training (31 l), sewage disposal (291), solid waste disposal (282), civil defense com- munication (272), criminal identification (264), noise pollution abatement (261), and training of firemen (255).
In general, municipal officials were reluctant to assign responsibility to regional special districts for the same services they were reluctant to assign to counties - treasury functions (21), election adminis- tration (22), licensing (23), voter registration (29), public relations (31), records maintenance and storage (37), personnel services (42), street lighting (50), and recreational facilities (58). Municipal officials were more willing to assign responsibility for sewer lines (140) and water supply (224) to regional special districts than they were to counties.
AClR RECOMMENDATIONS
In 1974, the Commission recommended that there by a "jointly developed state-local assignment of functions policy and process."l To assist states and local governments in determining the best units to perform the various functions and components of functions, the Commission prepared the following assignment criteria:
1. Economic Efficiency. Functions should be assigned to jurisdictions (a) that are large enough to realize economies of scale and
small enough not to incur diseconomies of scale (economies of scale); (b) that are willing to provide alternative service offer- ings to their citizens and specific services within a price range and level of effective- ness acceptable to local citizenry (service competition); (c) that adopt pricing poli- cies for their functions whenever possible (public pricing).
2. Fiscal Equity. Appropriate functions should be assigned to jurisdictions (a) that are large enough to encompass the cost and benefits of a function or that are willing to compensate other jurisdictions for the service costs imposed or for bene- fits received by them (economic externali- ties); and (b) that have adequate fiscal capacity to finance their public service responsibilities and that are willing to implement measures that insure interper- sonal and interjurisdictional fiscal equity in the performance of a function (fiscal equalization).
3. Political Accountability. Functions should be assigned to jurisdictions (a) that are controllable by, accessible to, and accountable to their residents in the per- formance of their public service responsi- bilities (access and control); and (b) that maximize the conditions and opportuni- ties for active and productive citizen par- ticipation in the performance of a function (citizen participation).
4. Administrative Effectiveness. Functions should be assigned to jurisdictions (a) that are responsible for a wide variety of func- tions and that can balance competing functional interests (general-purpose char- acter); (b) that encompass a geographic area adequate for effective performance of a function (geographic adequacy); (c) that explicitly determine the goals of and means of discharging public service re- sponsibilities and that periodically reas- sess program goals in light of performance standards (management capability); (d) that are willing to pursue intergovern- mental policies for promoting interlocal functional cooperation and reducing inter- local functional conflict (intergovernmen-

talflexibility); and (e) that have adequate legal authority to perform a function and rely on it in administering the function (legal a d e q ~ a c y ) . ~
To assist state legislatures, the Commission drafted a model constitutional amendment and a bill to facilitate the transfer of functional re~ponsibility.~ The suggested constitutional amendment provides that "by law, ordinance, or resolution of the govern- ing bodies of each of the governments affected, any function or power of a county, municipality, or special district may be transferred to, or contracted to be performed by another county, municipality, or special district as provided by law."4
The Commission's State Legislative Program con- tains several model acts providing for the transfer of functional responsibilities. The "County Moderniza- tion Act" provides for the council-manager form and the council-elected executive form as alternatives to the traditional commission form of county govern- ment and also provides two alternative methods by which "a state may authorize its counties to perform any specific urban services in its unincorporated areas upon passage of a county ordinance."S The act also authorizes a county to "provide urban services to incorporated municipalities under the following cir- cumstances: (1) the particular urban service is being performed by a countywide special district; (2) a municipality requests the county to provide the ser- vice; or (3) the citizens vote to have the county supply the service."6 The Program also contains a suggested constitutional amendment removing barriers to the financing of county subordinate areas.'
Complete "state assumption of all assessment functions and costs associated therewith"8 is recom- mended by the Commission as well as "state assump- tion of primary responsibility for public elementary and secondary school financingW9 and state assump- tion of responsibility for financing courts.10
A "Regional Fair Share Housing Allocations" bill follows closely the provisions of the Massachusetts "anti-snob" zoning law." If a proposed low-income housing project is denied or approved with unreaon- able conditions rendering the project uneconomical, the bill would allow the applicant to appeal the local decision to a state agency. "The issues that may be appealed to the state are limited to: ( I ) whether the local government has satisfied, or provided for, the attainment of its regional fair share; and (2) whether conditions attached to the local approval would render the building or operation of the project uneco- nomic. After formal hearing, the state agency may
vacate the local denial or modify the conditions ap- propriately."12
Three additional model acts increase the state's responsibility in the area of housing and community development. The "State Building Code Act" pro- vides for the repeal of other state building regulations and all local building regulations.13 The local enforce- ment agency examines the plans and specifications of a builder and must issue a building permit if the proposed building complies with the state building code.
The "Manufactured Building Act"l4 provides for state regulation of manufactured buildings, and the "Mobile Home Act"1S provides for state regulation of mobile homes.
CONCLUSIONS
Pragmatic state and local government officials, in our judgment, will continue to question which level of government should be responsible for the perfor- mance of specific functions and components of func- tions, and initiate actions to devolve downward or shift upward partial or complete responsibility for functions and components of functions.
Acting under pressure generated by partial Federal preemption of responsibility for certain functions, state governments undoubtedly will continue to as- sume more responsibility for these functions. And available evidence suggests that municipalities will continue to assume responsibility for new functions and components of functions. These changes in func- tional assignments probably will be made on an incremental and a d hoe basis.
While we anticipate that there will continue to be a trend toward the devolution of responsibility for functions closest to the people, such as schools, police, and health services, the growing financial problems of large central cities housing an increasing percentage of low-income families will augment the pressure for the transfer of either complete or finan- cial responsibility for expensive functions, such as public education and public welfare, to the state and Federal governments.
In our considered judgment, the county in many urban states will become a significantly more impor- tant unit of local government during the next decade. One-eighth of the municipalities plan to shift respon- sibility for a function(s) during the next two years to the county, and nearly one-half of the municipal respondents believe the transfers of functions to the county have increased the need for modernization of the county government. The structural reorganization

and modernization of county governments will im- prove their capacity to provide services and thereby encourage municipalities to shift responsibility for functions and components of functions to the county.
Increasing metropolitan scale and development of megalopolises will generate additional pressure for the transfer of functional responsibilities to the state and Federal levels. State governments will play a much more important role in solving problems in multicounty areas by creating state-controlled public authorities and/or directing regular state agencies to solve the problems.
We must report that concern was expressed by several municipal respondents relative to state and Federal preemption - total and partial - of respon- sibility for functions. One municipal official wrote on the survey questionnaire that "completion of this report would seem to indicate that little has changed, here, in the past ten years. Not so. The State of Wisconsin is, and has been for the past number of years, encroaching more and more on duties and responsibilities of municipalities." He added that he has served in his position since 1952 and "while changes are to be expected in that length of time, I am alarmed at the recent rate of takeover by the state and Federal governments and the awesome costs of the agencies and bureaus involved."
"Ad Hocism" has been characteristic of functional reassignment to date. Hopefully, states will play a greater leadership role relative to functional reassign- ment in the future and adopt the Commission's recommendations to make the reassignment process more systematic.
FUNCTIONAL TRANSFERS AND THE FEDERAL SYSTEM
We have reported the perceptions of municipal officials relative to the effect of functional transfers on the uniformity of service levels, efficient use of capital resources and personnel, quality of management of the function or component, unit costs, and quality. of services. These perceptions are strictly subjective and are not based upon empirical studies.
In this conclusing. section, it is appropriate to raise several questions relative to the impact of transfers of functional responsibilities on the federal system and society in general that merit detailed study.
1. Do citizens have more or less access to the centers of decision making as the result of functional transfers? In other words, how open is the decision making process in the governmental units that have
assumed responsibility for a function or a component of a function?
2. Are the governing bodies of the units which assumed responsibility for functions more or less responsive to constituents than the units previously responsible for the functions?
3. Are citizens in general satisfied with the results of functional transfers? We also may ask whether the average citizen is aware of the transfer of responsibil- ity for a specific function or a component?
4. Are clientele groups satisfied with the results of functional transfers?
5. How have disadvantaged groups been affected by the shifts of functional responsibilities? Did these groups participate in the process by which decisions were made to transfer functional responsibilities?
6. Have certain upward functional transfers re- sulted in service equalization throughout metropoli- tan areas? In other words, are service levels more uniform?
7. Are services being financed by a more equitable revenue system as the result of functional transfers? These services can be financed by service charges or by a tax system that is proportional, regressive, progressive, or degressive in terms of the taxes paid relative to the income of the average taxpayer. The shift of responsibility for a function will not result in greater equity for taxpayers if the tax system of the recipient unit is more regressive than the tax system of the unit transferring responsibility for the function.
8. Are services being provided more efficiently and economically by the units which have assumed re- sponsibility for functions?
9. Are capital resources more efficiently and effec- tively employed?
10. Are personnel resources more efficiently and effectively employed?
11. To what extent, if any, have functional transfers been motivated by partisan politics?
12. To what extent, if any, has a major political party benefited from functional transfers?
Although this report has concentrated primarily

upon the transfer and assumption of functional re- sponsibilities by municipalities, we must not overlook the fact that the Federal government during the past 15 years has been exercising its powers of partial and total preemption with greater frequency, and state governments have been voluntarily turning over to the Federal government responsibility for certain functions. Consequently, there is a need for research relative to the impact of the assumption of functional responsibilities by the Federal government on the federal system. Three questions in particular merit in- depth investigation.
1. Can the Federal government directly solve major domestic problems in the most effective manner without placing reliance upon state and local governments? Writing in 1937, V. 0. Key, Jr. held that the Federal government should rely upon the grant-in-aid system rather than assume complete responsibility for a function.
The achievements of direct Federal admin- istration are not so striking as to make Federal assumption an inviting alternative to the grant system. The governance of a nation of continental proportions is a matter for which no simple blueprint and specifications are available. The grant system builds on and utilizes existing insti- tutions to cope with national problems. Under it the states are welded into national machinery of sorts and the establishment of costly, parallel, direct Federal services is made unnecessary. A virtue of no mean importance is that the administrators in
actual charge of operations remain amena- ble to local control. In that way the sup- posed formality, the regularity, and the cold-blooded efficiency of a national hierarchy are avoided.16
Was Key correct in his assessment? If he were alive today, would he hold the same position? The Federal grant-in-aid system has been subjected to strong criticism during the past decade and a half, and many state and local officials prefer general revenue sharing to grants-in-aid. One can argue that delivery systems should remain the responsibility of state and local governments, while the Federal government provides a larger share of the revenue needed to finance the services.
2. What is the political significance of partial and total Federal preemption of functional responsibilities in terms of interest group activities and effectiveness? Do interest groups have more or less success in influencing Federal policy than in influencing state and local government policy?
3. Has the political power of the professional bureaucrat and the specialist been increased by Fed- eral and state preemption of responsibility for certain functions? If the answer is yes, how desirable is this trend?
We conclude by emphasizing that functional as- signments in the American federal system clearly are in a stage of transition, and additional research is needed on the impact of functional transfers on the nature of the system.
FOOTNOTES (Washington, D.C.: U S . Government Printing Office, November 1975), pp. 29-40.
9Advisory Commission on Intergovernmental Relations, ACIR State Legislative Program, Vol. 8, Education (Washington, D.C.:
'Advisory Commission on Intergovernmental Relations, Substate U.S. Government Printing Office, November 1975), pp. 13-22. Regionalism and the Federal System, Volume IV, Governmenral Functions and Processes: Local and Areawide (Washington, D.C.: U.S. Government Printing Office, 1974), p. 20.
ZIbid., p. 7. 'Advisory Commission on Intergovernmental Relations, ACIR State Legislative Program, Vol. 2, Local Government Moderniza- tion (Washington, D.C.: U . S . Government Printing Office, No- vember 1975), pp. 97-107.
4Ibid., p. 98. 5Ibid., pp. 69-86. 6Ibid. 'Ibid., p. 87.
"JAdvisory Commission on Intergovernmental ~ela t ions , ACIR Stale Legislative Program, Vol. 10, Criminal Justice (Washing- ton, D.C.: U.S. Government Printing Office, November 1975), pp. 51-67.
IIAdvisory Commission on Intergovernmental Relations, ACIR State Legislative Program, Vol. 6, Housing and Communit.~ Development (Washington, D.C.: U.S. Government Printing Office, November 1975); pp. 137-44.
12Ibid., p. 138. IjIbid., pp. 14657. 141bid., pp. 158-70. '5Ibid., pp. 171-81.
8Advisory Commission on Intergovernmental Relations, ACIR I6V. 0. Key, Jr., The Administration of Federal Granis to Stares State Legislative Program, Vol. 5, State and Local Revenues (Chicago: Public Administration Service, 1937), p. 383.
71 W.S. GOVERNMENT PRINTING OFFICE: 1976 625-6691768 1 - 3


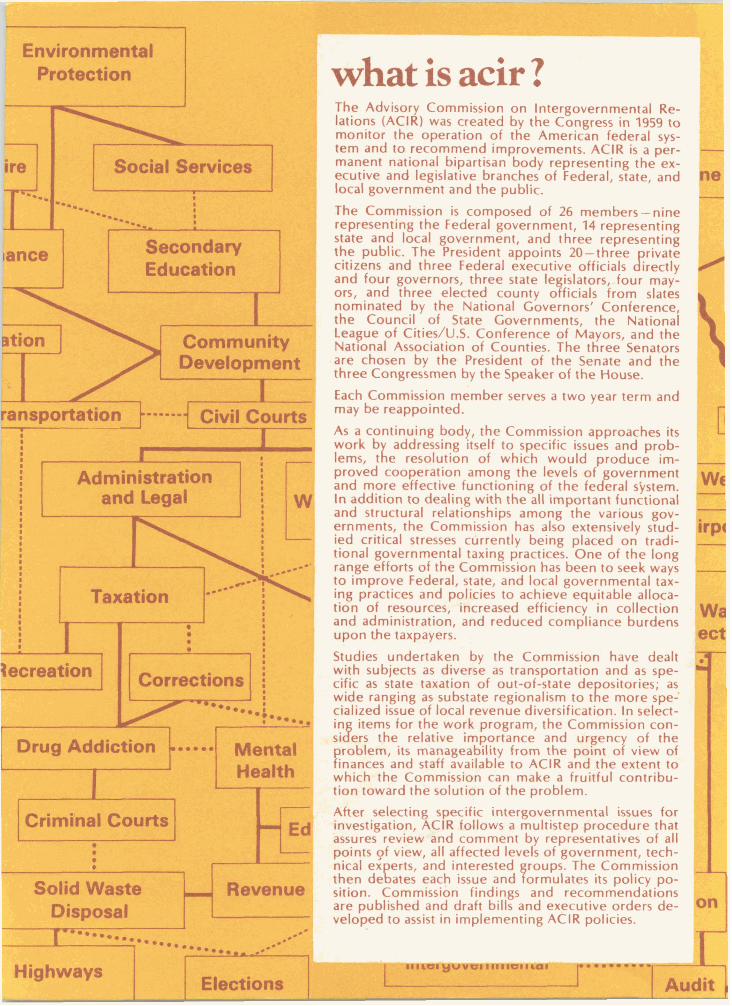
what is acir ? The Advisor Commission on Intergovernmental Re- I latians (Act ) was created by the Congress in 1959 to monitor the operation of the American federal sys- tem and to recommend improvements. AClR is a per- manent national bipartisan body re resenting the ex- ecutive and legislative branches of ederal, state, and local government and the public.
e The Commission is composed of 26 members-nine representing the Federal government, 14 representing state and local overnment, and three representing 'b the public. The resident appoints 20-three citizens and three Federal executive officials fr irectly ivate and four governors, three state le islators, four may- ors, and three elected county o 7 fickls from slates nominated by the National Governors' Conference, the Council of State Governments, the National League of Cities/U.S. Conference of Mayors, and the Nat~onal Association of Counties. The three Senators
,are chosen by the President of the Senate and the three Congressmen by the Speaker of the House.
Each Commission member serves a two year term and may be reappointed.
ied critical stresses tional governmental taxing practices. One of the long range efforts of the Commission has been to seek ways to improve Federal, state, and local governmental ,tax- ing practices and polisies to achieve equitable alloca- tion of resources, ihcreased efficiency in collection and administration, and reduced compliance burdens upon the taxpayers.
Studies undertaken by the Commission have dealt with subjects as diverse as tranqmrtation and as spe- cific as state taxation of out-of-state de, ositories; as wide ranging as substate regionalism to t 1 e more spe-' cialixed issue of local revenue diversification. In select- in items for the work program, the Commission con-
rLi d ers the relative importance and u en I 7 the roblem, its manageability from the po nt o vtew of
kwaces and staff available to AClR and the extent to whichdthe Commission can make a fruitful contribu- tisn toward the solution of the problem.
!
After selecting specific intergovernmental issues for investigation, AClR follows a multistep procedure that assures review and comment by representatives of al l points gf view, all affected levels of governm.ent, tech- nical ex rts, and interested roups. The Commission then de ge ares each issue and f ormulates its policy po- sition, Commission findings and recommendations are published and draft bills and executive orders de- veloped to assist in implementing AClR policies.

COMMISSION ME b BERS (MARCH 1976)
MEMBERS OF THE U.S. HOUSE
GOVERN Y
Daniel J. Evans, Richard F. E(arnip, Pbili W. Noel, R E Otir .Bowen,M
Harry E. Kinuejr, Albuq , .. , Jack D. hdaltarter, San C
J o b H. Paeh, St.
- ~ ~ b a ~ t P. k-la,
Charles F. Kurfem, Minority Leader,
ELECTED COUNTY ~ I C I A ~ John H. Brewer, Kent
William E. Duna, Commissione Conrad M. Pwler, Shelb