Embed Size (px)
Citation preview
U . S . D e p a r t m e n t o f E d u c a t i o n
December 2014
Tools
Practitioner Data Use in Schools: Workshop Toolkit
Candice Bocala Susan F. Henry Susan Mundry Claire Morgan
WestEd
Summary
This toolkit for the Practitioner Data Use in Schools
Workshop is designed to help teachers and
administrators use education data more systematically
and accurately. The workshop introduces teams of
practitioners to a data inquiry cycle and provides
them with a set of structured activities to identify and
investigate a specific question and make decisions
about instructional planning. Participants create a data
plan and a process they can use in their own schools
and districts. The workshop can be customized for
specific contexts where participants practice with their
own sources of data.
At Education Development Center, Inc.

REL 2015–043
The National Center for Education Evaluation and Regional Assistance (NCEE) conducts unbiased large-scale evaluations of education programs and practices supported by federal funds; provides research-based technical assistance to educators and policymakers; and supports the synthesis and the widespread dissemination of the results of research and evaluation throughout the United States.
December 2014
This report was prepared for the Institute of Education Sciences (IES) under contract number ED-IES-12-C-0009 by Regional Educational Laboratory Northeast & Islands administered by Education Development Center, Inc. (EDC). The content of the publication does not necessarily reflect the views or policies of IES or the U.S. Department of Education nor does mention of trade names, commercial products, or organizations imply endorsement by the U.S. Government.
This REL report is in the public domain. While permission to reprint this publication is not necessary, it should be cited as:
Bocala, C., Henry, S. F., Mundry, S., and Morgan, C. (2014). Practitioner Data Use in Schools: Workshop Toolkit (REL 2015–043). Washington, DC: U.S. Department of Education, Institute of Education Sciences, National Center for Education Evaluation and Regional Assistance, Regional Educational Laboratory, Northeast & Islands. Retrieved from http://ies.ed.gov/ncee/edlabs.
This report is available on the Regional Educational Laboratory website at http://ies.ed.gov/ ncee/edlabs.

Summary
This toolkit for the Practitioner Data Use in Schools Workshop consists of a facilitator guide and workshop handouts. The toolkit is intended for use by district leaders, school officials, teacher leaders, and coaches who want to conduct workshops on data inquiry and data use at the school level with school-based educators. The facilitator guide provides materials to engage educators in using data for inquiry and instructional planning. These materials include a step-by-step agenda for a full-day professional development session (or a series of shorter sessions), guiding ideas to scaffold participant learning, and suggestions for activities. The facilitator guide also suggests ways to facilitate the workshop and customize it for specific school and district contexts. The workshop handouts offer tools, protocols, and resources for each step of the data inquiry cycle.
The materials were created for workshops conducted by the Regional Educational Laboratory (REL) Northeast & Islands. Stakeholders in the REL Northeast & Islands Region were interested in building their school-based educators’ capacity to understand, interpret, and use education data to improve instruction.
i

Contents
Summary i
Introduction What is this workshop? Introduction-1
Purpose of the workshop Introduction-2 Selecting data for the workshop Introduction-2 Presentation format Introduction-3
How to use this guide Introduction-4 Symbols Introduction-4 Pre-reading assignment Introduction-5
Suggested workshop agenda Introduction-5
Practitioner Data Use in Schools Workshop: Facilitator guide Introductions and origins of workshop FG-1Workshop overview and learning goals FG-2Knowledge, skills, and abilities for data-driven action FG-4Research on collaborative data inquiry FG-6The inquiry cycle FG-8Inquiry cycle step 1: Seek information FG-10 Inquiry cycle step 2: Access and gather data FG-12Inquiry cycle step 3: Analyze and interpret data FG-14Inquiry cycle step 4: Act—student learning goals FG-19Inquiry cycle step 4: Act—root causes FG-20Inquiry cycle step 4: Act—generating solutions FG-22Inquiry cycle step 5: Evaluate FG-23Taking next steps FG-25Closing FG-26
Practitioner Data Use in Schools Workshop: Handouts Handout 1: Purpose of the workshop and pre-reading assignment HO-1Handout 2: Workshop agenda HO-2Handout 3: Knowledge, skills, and abilities for data-driven action HO-3Handout 4: Engaging in a data cycle HO-4Handout 5: Inquiry cycle sort cards HO-5Handout 6: Personal data plan template HO-6Handout 7: Drilling down—five levels of analysis HO-7Handout 8: Review the data’s focus and limitations HO-8Handout 9: Data-driven dialogue HO-9Handout 10: Fishbone diagram activity HO-10
Notes Notes-1
References and other resources Ref-1
Tables 1 Symbols used in the facilitator guide Introduction-4 2 Agenda for a one-day in-person Practitioner Data Use Workshop (six hours) Introduction-5 3 Agenda overview with slides and handouts Introduction-6
ii

Introduction
The Regional Educational Laboratory (REL) Northeast & Islands at Education Development Center is one of 10 RELs across the country charged with helping states and districts systematically use data and analysis to understand important issues of education policy and practice with the goal of improving student outcomes. The REL program carries out its work primarily in collaboration with new or existing partnerships, or research alliances of practitioners, policymakers, and others who share a specific education concern.
The Practitioner Data Use in Schools Workshop (or Practitioner Data Use Workshop) arose directly from the work of three REL Northeast & Islands research alliances. Research Agenda Setting Workshops conducted for the Urban Schools Improvement Alliance, the Northeast Rural Districts Research Alliance, and the Northeast Educator Effectiveness Alliance identified the need to build school-based educators’ capacity to understand, interpret, and use education data to improve instruction.1
What is this workshop?
The Practitioner Data Use Workshop is designed to help practitioners develop skills in collaborative, data-driven inquiry and instructional decisionmaking. It introduces the concept and process of the data inquiry cycle, allows participants to practice activities aligned with an inquiry cycle, and gives participants opportunities to apply concepts from the workshop to their own settings. Topics include developing data literacy, engaging in a data inquiry cycle, accessing and collaboratively analyzing data, identifying root causes for student performance, and using data to make action plans for instructional decisions.
The workshop does not address strategies for helping district and school leaders explore key characteristics needed for an effective culture of data use. REL Northeast & Islands offers a separate workshop toolkit on building a culture of data use in schools and districts for audiences focused on understanding a framework of five research-based elements to develop a culture of data use. It includes professional development materials to engage leaders in dialogue about building this culture in their own settings.
The Practitioner Data Use Workshop toolkit consists of a facilitator guide, workshop handouts, and an accompanying slide deck (available for download from the Tools & Resources section of the REL Northeast & Islands website, http://www.relnei.org/tools-resources. html). The toolkit provides tools, protocols, and resources for each step of the data inquiry cycle and describes the activities, materials, and key points of each segment of the workshop. It also suggests ways to facilitate the workshop and customize it for specific school and district contexts. The toolkit is intended for use by district leaders, school officials, teacher leaders, and coaches who want to conduct workshops with school-based educators on data inquiry and data use in education at the school level.
The Practitioner Data Use Workshop is designed to develop skills in collaborative, data-driven inquiry and instructional decisionmaking
Introduction-1

Purpose of the workshop
Participants will leave the workshop with a specific data plan and a process they can use when they return to their own schools. The learning goals for this workshop are to:
• Become familiar with an inquiry framework for interpreting data. • Be introduced to common first steps in data use, such as determining the ques
tions to be answered with data and building data literacy. • Engage in a protocol to analyze data and identify a student learning challenge. • Identify possible root causes that contribute to a student learning challenge and
possible related teacher actions. • Draft student learning goals and action plans. • Review how to monitor results.
It is strongly recommended that workshop participants attend in teams. Doing so builds a supportive network of practitioners engaged in data use to inform instruction. This workshop can be adapted to address the following configurations of teams:
• Teams from within a single school, in which participants are organized by grade-level or content-based teams.
• Teams from multiple schools within a district. These can be school leadership, grade-level, or content-based teams. For example, a school leadership team might include an administrator (such as the principal), a coach or specialist who works regularly with teachers, and one or two teachers.
• Teams from multiple schools across multiple districts. In this case the facilitator will need to work with leaders from the various districts to understand their contexts, data systems, and related data policies to ensure that the content will apply to all the districts or will need to differentiate as needed.
The workshop will be most effective if led by a facilitator with some prior knowledge of the data that each participating school is using, how the data are interpreted, and how teachers at the school use data in their work. For example, the school principal, a school or district data coach, or a team leader experienced in data analysis might serve as facilitator until other participants become comfortable using data. Suggestions for how the facilitator might prepare for the workshop are outlined below.
Selecting data for the workshop
Participants should engage with data relevant to their specific school or district during the workshop’s data analysis sessions. In preparing for the workshop, facilitators should work closely with district and school leaders to discuss what data participants might bring or be able to access during the workshop. If all the school-based teams are from the same district, the facilitators can work with the district to create handouts of a common dataset for all teams to use for practice. However, when possible, teams should be instructed to bring their own dataset that applies to their school, content, or grade level. Recommended forms of data include:
• Student performance on standardized assessments that are: • Separated by domain (for example, math, English language arts) and subskill
(for example, “reading for literature” and “reading for information” in English language arts).
• Aggregated at the school level and compared with state and district norms.
The workshop will be most effective if led by a facilitator with some prior knowledge of the data that each participating school is using, how the data are interpreted, and how teachers at the school use data in their work
Introduction-2
• Disaggregated by subgroup (for example, race/ethnicity, English language learner status, disability).
• Showing changes over time (for example, school-level performance over the past three years).
• Interim or benchmark results (for example, a common writing prompt given at the start of the school year or a science baseline assessment). Benchmark assessments are “assessments administered periodically throughout the school year, at specified times during a curriculum sequence, to evaluate students’ knowledge and skills relative to an explicit set of longer-term learning goals” (Herman, Osmundson, & Dietel, 2010, p. 1).
• Classroom sets of student work (for example, end-of-unit tests, student portfolios).
In addition to datasets, participants benefit from seeing real-world examples of the data inquiry cycle. Facilitators can work with the district or school to compile examples of templates, scenarios, datasets, student goals, and action plans that other practitioners have created. These examples can be shown during the workshop and distributed as handouts to illustrate key concepts.
Presentation format
These materials are designed for a single-session workshop. Although participants can learn the material in a single session, the planning team should consider holding follow-up meetings to discuss how educators are using the tools and processes presented, address challenges or questions that arise, and provide additional support for data use. The materials can also be adapted for presentation in webinar format to a virtual audience.
In-person workshop supplies and preparation. If the workshop is conducted in person, the following supplies and materials are needed:
• Newsprint/chart paper and easels for group note-taking. • Large sticky notes. • Markers. • Copies of all handouts. • Copies of the PowerPoint slides. • Copies of the inquiry cycle sort cards (cut apart).
Virtual workshop considerations. If the workshop is conducted virtually as a webinar, efforts should be made to engage participants frequently to maintain the “hands-on” nature of the session. The following are a few suggestions for how to do this:
• During activities, require that participants respond by chat or whiteboard. Participants can enter their responses into the chat function on the online platform or write into a text box on the online whiteboard. During the webinar the facilitator can comment on the responses in the chat as they appear.
• Have participants “raise their hands” or indicate in some way that they would like to speak using the online platform. The facilitator can then call on participants whose hands are raised, and participants can speak using their microphones.
• If the online platform can sort participants into “breakout rooms,” in which participants enter a virtual space with only a few other participants and one facilitator, the facilitators can move participants directly into and out of breakout rooms using the online webinar platform. When in breakout rooms, participants can converse
Participants benefit from seeing real-world examples of the data inquiry cycle
Introduction-3

in small groups using the chat function or their microphone. Participants might use this time to consider ways to apply workshop lessons in their own settings.
Other suggestions for adapting the material for webinar or virtual format are noted throughout the facilitator guide with a computer symbol (see below).
How to use this guide
This toolkit consists of two parts: the facilitator guide and the workshop handouts. There is also an accompanying slide deck (available for download from the Tools & Resources section of the REL Northeast & Islands website, http://www.relnei.org/tools-resources.html, or by emailing [email protected]). The facilitator guide contains notes and guiding information for each segment of the workshop and should be used in conjunction with the workshop handouts and the slide deck. The tools and templates in the workshop handouts and the slides are examples; facilitators are encouraged to replace or supplement these examples with scenarios and datasets that are familiar to participants to make the work relevant to their specific contexts. The workshop materials can be customized to participant needs.
Symbols
Table 1 identifies symbols used throughout the facilitator guide to highlight key aspects of the material.
Each section of the facilitator guide also contains: • Information on the duration of the session, related slide numbers, and handouts. • A facilitator explanation, which suggests language that the facilitator can use to
begin the section. • A discussion prompt to stimulate discussion among participants during the session. • An activity for participants to apply relevant skills learned in each section.
Table 1. Symbols used in the facilitator guide
The facilitator guide contains notes and guiding information for each segment of the workshop and should be used in conjunction with the workshop handouts and the slide deck
Symbol Meaning
Important facilitation process notes
Suggestions for adapting the material for webinar or virtual format
KEY POINT An essential idea: if this foundational idea is missed, it may compromise learning in later activities
Introduction-4
Pre-reading assignment
To prepare for the workshop, participants should read background materials before attending the session. Suggested readings are as follows:
• National Forum on Education Statistics. (2012). Forum guide to taking action with education data. (NFES 2013–801). U.S. Department of Education. Washington, DC: National Center for Education Statistics. Retrieved from http://nces.ed.gov/pubs2013/2013801.pd
f [Note: Read the “Overview,” pages 1–14 only.]
• Kekahio, W., & Baker, M. (2013). Five steps for structuring data-informed conversations and action in education (REL 2013–001). Washington, DC: U.S. Department of Education, Institute of Education Sciences, National Center for Education Evaluation and Regional Assistance, Regional Educational Laboratory Pacific. Retrieved from http://ies.ed.gov/ncee/edlabs/regions/pacific/pdf/REL_2013001.pdf
It is strongly suggested that facilitators send participants a paper or electronic copy of handout 1 (Purpose of the workshop and pre-reading assignment) before the workshop. The handout contains a summary of the workshop and the directions for the pre-reading assignment.
Suggested workshop agenda
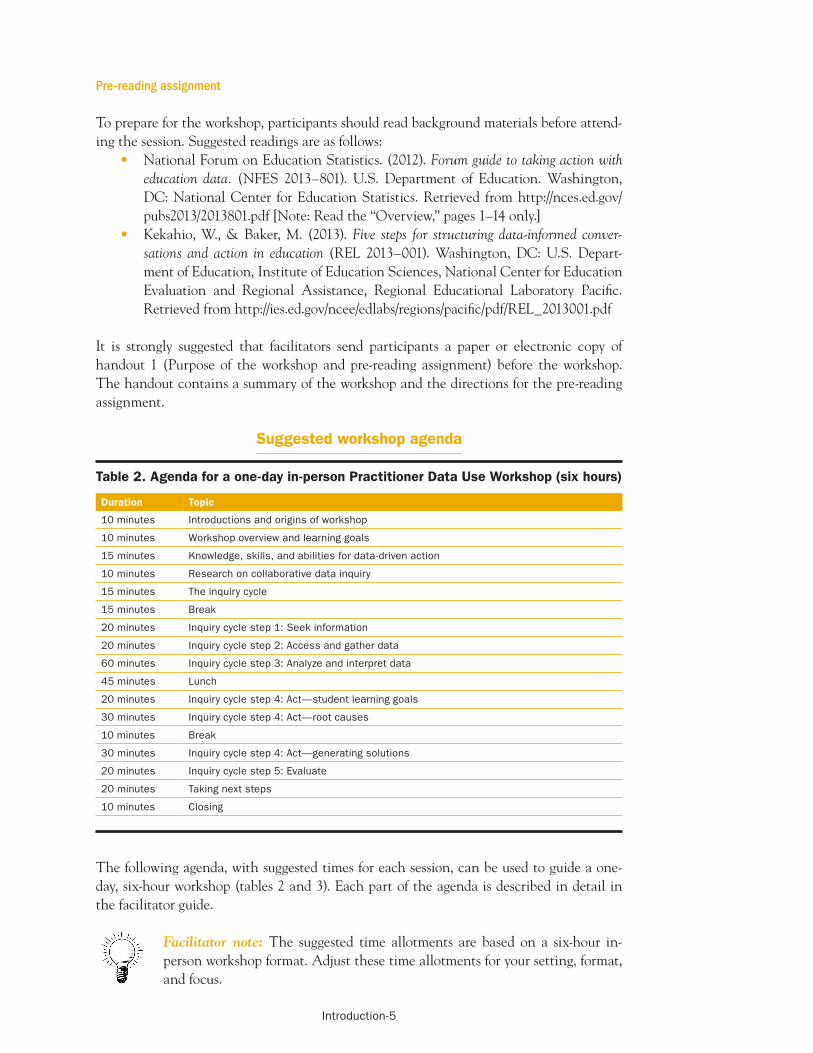
Table 2. Agenda for a one-day in-person Practitioner Data Use Workshop (six hours)
Duration Topic
10 minutes Introductions and origins of workshop
10 minutes
15 minutes
Workshop overview and learning goals
Knowledge, skills, and abilities for dat
10 minutes Research on collaborative data inquiry
15 minutes The inquiry cycle
15 minutes Break
20 minutes Inquiry cycle step 1: Seek information
a-driven action
20 minutes Inquiry cycle step 2: Access and gather data
60 minutes Inquiry cycle step 3: Analyze and interpret data
45 minutes Lunch
20 minutes Inquiry cycle step 4: Act—student learning goals
30 minutes Inquiry cycle step 4: Act—root causes
10 minutes Break
30 minutes Inquiry cycle step 4: Act—generating solutions
20 minutes Inquiry cycle step 5: Evaluate
20 minutes Taking next steps
10 minutes Closing
The following agenda, with suggested times for each session, can be used to guide a one-day, six-hour workshop (tables 2 and 3). Each part of the agenda is described in detail in the facilitator guide.
Facilitator note: The suggested time allotments are based on a six-hour in-person workshop format. Adjust these time allotments for your setting, format, and focus.
Introduction-5

Table 3. Agenda overview with slides and handouts
Duration Topic Key activities Slides Handouts
10 minutes Introductions and origins of Introductions 1–2 Handout 1: Purpose of the workshop workshop and pre-reading
assignment (if not distributed in advance)
10 minutes Workshop overview and learning Review learning goals and agenda 3–5 Handout 2: Workshop agenda goals
15 minutes Knowledge, skills, and abilities for Explore how practitioners use data 6–8 Handout 3: Knowledge, skills, and data-driven action abilities for data-driven action
10 minutes
15 minutes
15 minutes
20 minutes
Research on collaborative inquiry
The inquiry cycle
Break
Inquiry cycle step 1: Seek information
data Understand the research on data inquiry
Introduce the inquiry cycle
Choose a focus area for inquiry
9–12
13
14–18
None
Handout 4: Engaging in a data cycle
Handout 5: Inquiry cycle sort cards
Handout 6: Personal data plan template
20 minutes Inquiry cycle step 2: Acces gather data
s and Select data and triangulate multiple sources of data
19–22 Handout 7: Drilling down—five levels of analysis
Handout 8: Review the data’s focus and limitations
60 minutes Inquiry cycle step 3: Analyze and Present and discuss findings from 23–28 Handout 9: Data-driven dialogue interpret data data displays
45 minutes Lunch
20 minutes Inquiry cycle step 4: Act—student learning goals
Write goals for student learning 29–30 None
30 minutes
10 minutes
30 minutes
Inquiry cycle step 4: Act—root causes
Break
Inquiry cycle step 4: Act— generating solutions
Brainstorm root causes
Brainstorm instructional solutions
31–32
33–34
Handout 10: Fishbone diagram activity
Handout 10: Fishbone diagram activity (continued from last activity)
20 minutes Inquiry cycle step 5: Evaluate Check on progress related to 35–37 None action steps
20 minutes Taking next steps Summarize key takeaways and 38 None applications
10 minutes Closing Address remaining questions 39–41 None
Introduction-6

Practitioner Data Use in Schools Workshop:
Facilitator guide

Introductions and origins of workshop
• Duration: 10 minutes. • Slides 1–2. • Handout 1: Purpose of the workshop and pre-reading assignment (if not distribut
ed in advance).
Slide 1:
Introductions • Introduce presenters. • Introduce participants.
Facilitator explanation
Slide 2:
These materials were developed by the Regional Educational Laboratory (REL) Northeast & Islands at EDC, one of 10 RELs across the country charged with helping states and districts systematically use data and analysis to answer important issues of education policy and practice with the goal of improving student outcomes. The REL program is funded by the Institute of Education Sciences at the U.S. Department of Education. The REL program carries out its work primarily in collaboration with new or existing partnerships, or research alliances of practitioners, policymakers, and others who share a specific education concern.
FG-1

The Practitioner Data Use Workshop arose directly from the work of three REL Northeast & Islands research alliances, which identified the need for school-based practitioners— including administrators and teachers—to receive instruction in using data. Specifically, stakeholders were interested in building their school-based educators’ capacity to understand, interpret, and use education data to improve instruction. To address these concerns, REL Northeast & Islands staff reviewed research, tools, and other practitioner resources related to data inquiry in education to create this toolkit.
Facilitator note: In addition to, or instead of, the REL Northeast & Islands overview, consider providing a context-specific overview of why the participants were invited to the workshop, which stakeholders were involved in bringing the workshop together, and acknowledging the help of anyone involved in the workshop preparation.
Workshop overview and learning goals
• Duration: 10 minutes. • Slides 3–5. • Handout 2: Workshop agenda.
Facilitator explanation
The Practitioner Data Use Workshop was designed to help practitioners develop skills in collaborative, data-driven inquiry and instructional decisionmaking. It introduces the concept and process of the data inquiry cycle, allows participants to practice activities aligned with an inquiry cycle, and gives participants opportunities to apply concepts from the workshop to their own settings. The topics covered include developing data literacy, engaging in a data inquiry cycle, accessing and collaboratively analyzing data, identifying root causes for student performance, and using data to make action plans for instructional decisions.
Slide 3:
The learning goals for this workshop are to: • Become familiar with an inquiry framework for interpreting data. • Be introduced to common first steps in data use, such as determining the ques
tions to be answered with data and building data literacy. • Engage in a protocol to analyze data and identify a student learning challenge.
FG-2

• Hypothesize possible root causes that contribute to a student learning challenge and possible related teacher actions.
• Draft student learning goals and action plans. • Review how to monitor results.
This workshop does not address strategies for helping district and school leaders explore key characteristics needed for an effective culture of data use. REL Northeast & Islands offers a separate workshop on building a culture of data use in schools and districts for audiences focused on understanding a framework of five research-based elements to develop a culture of data use.
This is the agenda for today. (Facilitator walks through the agenda.)
Slide 4:
Slide 5:
FG-3
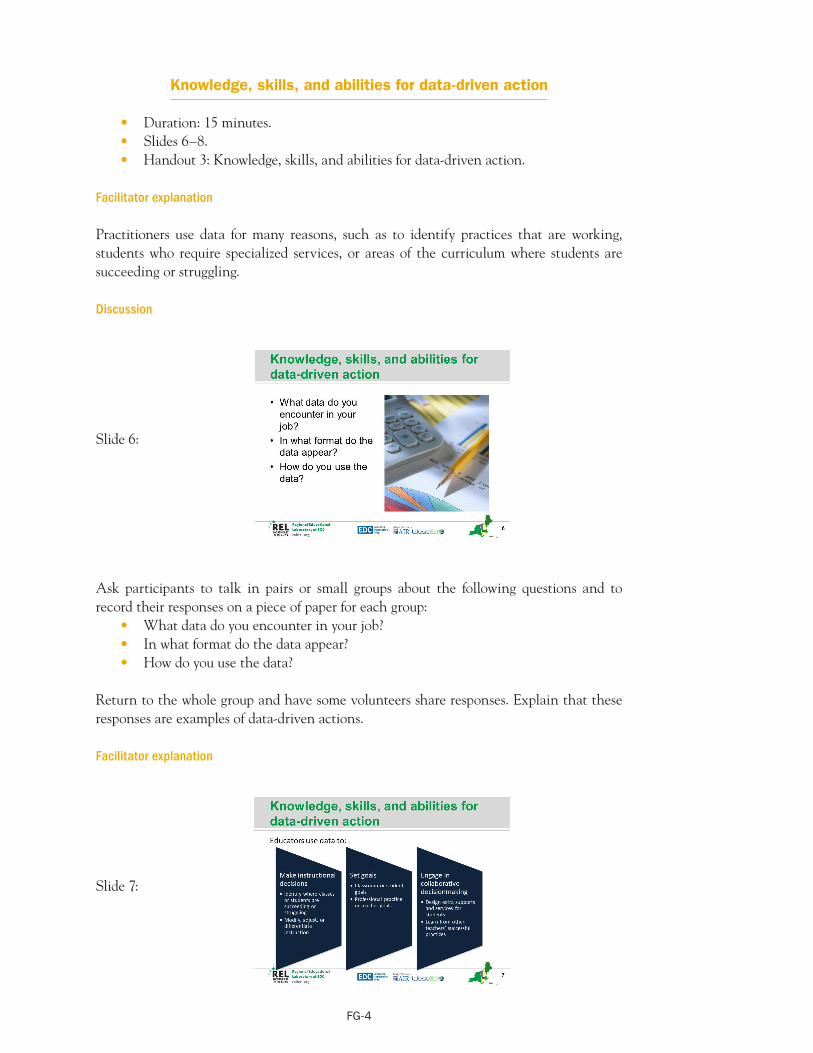
Knowledge, skills, and abilities for data-driven action
• Duration: 15 minutes. • Slides 6–8. • Handout 3: Knowledge, skills, and abilities for data-driven action.
Facilitator explanation
Practitioners use data for many reasons, such as to identify practices that are working, students who require specialized services, or areas of the curriculum where students are succeeding or struggling.
Discussion
Slide 6:
Ask participants to talk in pairs or small groups about the following questions and to record their responses on a piece of paper for each group:
• What data do you encounter in your job? • In what format do the data appear? • How do you use the data?
Return to the whole group and have some volunteers share responses. Explain that these responses are examples of data-driven actions.
Facilitator explanation
Slide 7:
FG-4
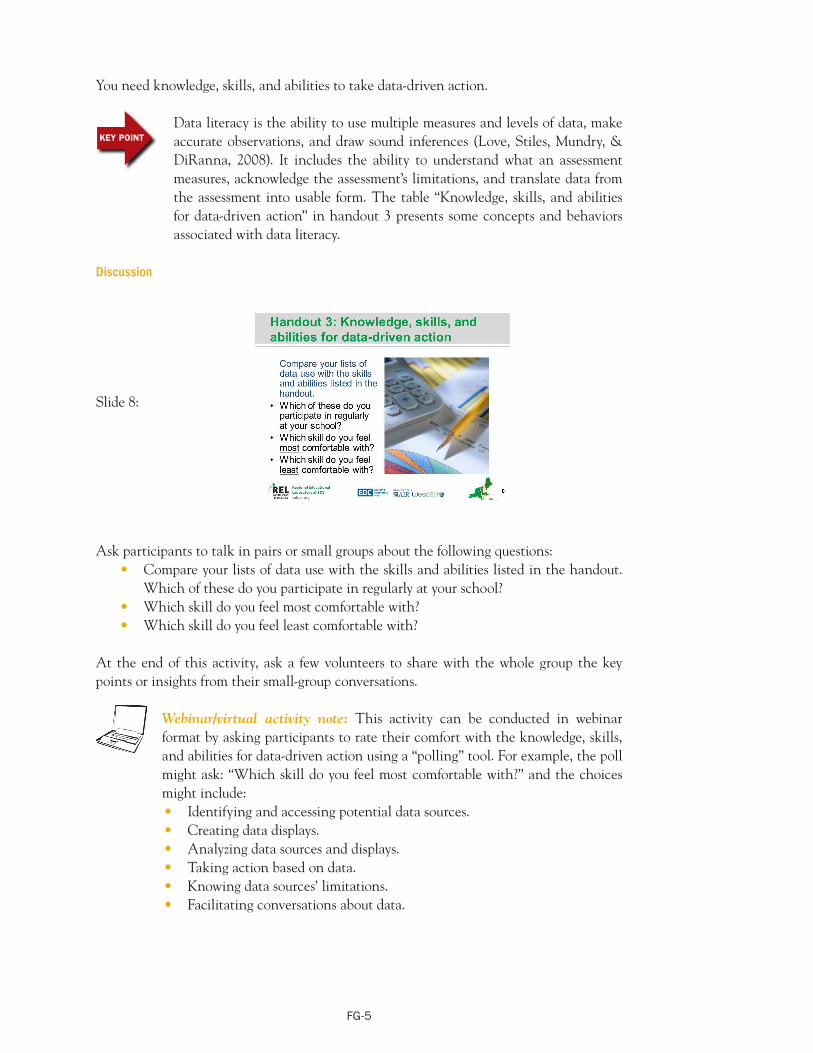
You need knowledge, skills, and abilities to take data-driven action.
Data literacy is the ability to use multiple measures and levels of data, make KEY POINT accurate observations, and draw sound inferences (Love, Stiles, Mundry, &
DiRanna, 2008). It includes the ability to understand what an assessment measures, acknowledge the assessment’s limitations, and translate data from the assessment into usable form. The table “Knowledge, skills, and abilities for data-driven action” in handout 3 presents some concepts and behaviors associated with data literacy.
Discussion
Slide 8:
Ask participants to talk in pairs or small groups about the following questions: • Compare your lists of data use with the skills and abilities listed in the handout.
Which of these do you participate in regularly at your school? • Which skill do you feel most comfortable with? • Which skill do you feel least comfortable with?
At the end of this activity, ask a few volunteers to share with the whole group the key points or insights from their small-group conversations.
Webinar/virtual activity note: This activity can be conducted in webinar format by asking participants to rate their comfort with the knowledge, skills, and abilities for data-driven action using a “polling” tool. For example, the poll might ask: “Which skill do you feel most comfortable with?” and the choices might include: • Identifying and accessing potential data sources. • Creating data displays. • Analyzing data sources and displays. • Taking action based on data. • Knowing data sources’ limitations. • Facilitating conversations about data.
FG-5
Research on collaborative data inquiry
• Duration: 10 minutes. • Slides 9–12.
Facilitator explanation
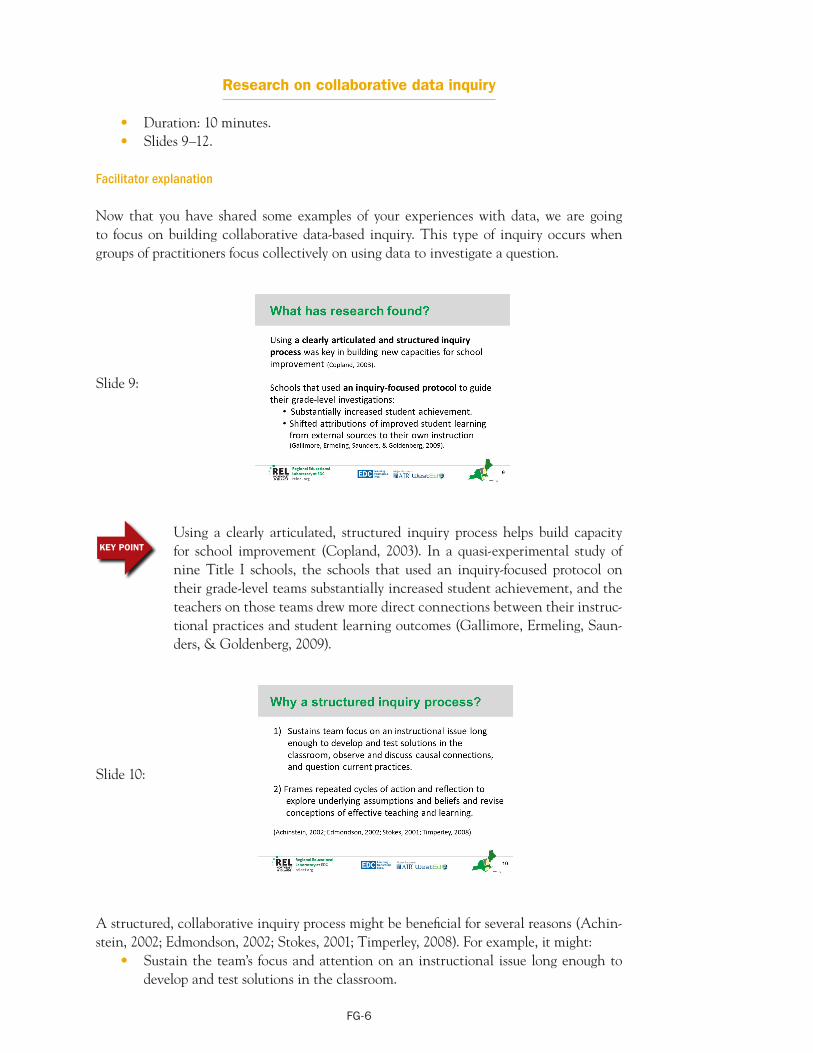
Now that you have shared some examples of your experiences with data, we are going to focus on building collaborative data-based inquiry. This type of inquiry occurs when groups of practitioners focus collectively on using data to investigate a question.
Slide 9:
KEY POINT Using a clearly articulated, structured inquiry process helps build capacity for school improvement (Copland, 2003). In a quasi-experimental study of nine Title I schools, the schools that used an inquiry-focused protocol on their grade-level teams substantially increased student achievement, and the teachers on those teams drew more direct connections between their instructional practices and student learning outcomes (Gallimore, Ermeling, Saunders, & Goldenberg, 2009).
Slide 10:
A structured, collaborative inquiry process might be beneficial for several reasons (Achinstein, 2002; Edmondson, 2002; Stokes, 2001; Timperley, 2008). For example, it might:
• Sustain the team’s focus and attention on an instructional issue long enough to develop and test solutions in the classroom.
FG-6

• Encourage teacher reflection on current actions, assumptions, and beliefs. • Provide structure for repeated cycles of action and reflection that contribute to
individual and team learning.
Slide 11:
Researchers have categorized observable stances toward student learning data, or beliefs that shape people’s dispositions and actions on data (Charalambous & Silver, 2008; McLaughlin & Zarrow, 2001; Nelson, Slavit, & Deuel, 2012). One stance uses data for “proving,” or showing specific gains or losses in student learning reflected in numeric scores or aggregated rankings. This stance is helpful for weighing the effectiveness of a particular strategy or action. Another stance uses data for “improving,” or better understanding students’ ideas and comprehension. This stance is helpful for generating new instruction, asking new questions, or learning more about how students are approaching a particular task. Educators move between the two stances depending on their purpose for examining the data.
Discussion
Slide 12:
Ask participants to talk in pairs or small groups about the following questions: • What is your reaction to the research on collaborative inquiry and data use? What
sounds familiar? Surprising? • Why do you think there is more focus on collaborative, data-based inquiry in
schools today?
FG-7

At the end of this activity, ask a few volunteers to share with the whole group the key points or insights from their small-group conversations.
Webinar/virtual activity note: This activity can be conducted in webinar format by asking participants to respond to these questions in the chat box or to raise their hands so that the facilitator can call on them to respond verbally.
The inquiry cycle
• Duration: 15 minutes. • Slides 13–14. • Materials: Large pieces of chart paper, markers, tape, sticky notes. • Handout 4: Engaging in a data cycle. • Handout 5: Inquiry cycle sort cards (one copy of the inquiry cycle sort cards per
team or table, printed out on paper and cut on the dotted lines).
Facilitator explanation
Slide 13:
You will be building your understanding of collaborative, data-based inquiry by going through an inquiry cycle. The inquiry cycle is a framework that gives educators a systematic process to follow as they examine data and make improvements (Hamilton et al., 2009). You will have an opportunity to use what you already know about data and inquiry in schools to make sense of the inquiry cycle steps. Using the sort cards on your table, you will organize the steps on the cards in a logical sequence that you believe reflects what would occur in a data inquiry cycle, tape the cards to the chart paper, and use the markers to label the steps. If you decide that an action is missing or needs to be repeated, you can write it on a sticky note and include it in your diagram.
Activity
Direct participants to work at their tables and place the sort cards into their version of an inquiry cycle. Encourage them to talk to one another to define terms, explain their thinking about the sequence, and move the cards around as needed.
Webinar/virtual activity note: This activity can be conducted in webinar format by listing the sort card activities in random order on a PowerPoint slide and then asking participants to sketch out a possible order on a blank piece of paper.
FG-8

Slide 14:
Facilitator note: This inquiry cycle, from the National Forum on Education Statistics (2012) Forum Guide to Taking Action with Education Data, includes five primary phases or activities: 1. Seek information. 2. Access/gather data. 3. Analyze/interpret data. 4. Act. 5. Evaluate.
The data inquiry cycle from Kekahio and Baker (2013) can also be used for the workshop.2
It includes the following activities: 1. Set the stage. 2. Examine the data. 3. Understand the findings. 4. Develop an action plan. 5. Monitor progress and measure success.
Facilitator note: At the end of this activity have participants hang their completed charts on the wall near their tables or place them nearby for reference. Encourage them to adjust their charts as their understanding of the inquiry cycle progresses.
Facilitator note: There is a 15-minute break after this section of the workshop.
FG-9

Inquiry cycle step 1: Seek information
• Duration: 20 minutes. • Slides 15–18. • Handout 6: Personal data plan template.
Facilitator explanation
Today you will be working with the inquiry cycle in the Forum Guide to Taking Action with Education Data, from the National Forum on Education Statistics (2012). The National Center for Education Statistics, within the U.S. Department of Education, established the forum to improve the collection, reporting, and use of elementary and secondary school education data.
KEY POINT The Forum Guide recommends a question-driven approach to data use. Asking questions can help you gather and analyze relevant data and determine next steps.
Slide 15:
In your handouts you have a “Personal data plan” template based on the Forum Guide, which you will use throughout the workshop to guide the data inquiry process.
Slide 16:
FG-10

KEY POINT In step 1 you ask: • What is our focus area? • What questions about student learning can we answer with data related
to this focus area?
You begin data inquiry by asking questions that lead you to search for data to address those questions. The Forum Guide describes “information seeking” as including activities such as “defining a meaningful and achievable scope of concern/unit of analysis” and “clearly articulating the issue at hand as a critical question” (p. 4).
Slide 17:
Well-defined, consequential questions make data use more effective. To choose an inquiry focus, keep in mind what is most important for your students to learn, what are your district’s or school’s high-priority goals, and what factors your school has immediate control over. An inquiry focus should be phrased as a question. For example, educators might ask:
• How are our students performing on early literacy assessments? • How well do our students understand algebraic concepts and procedures? • How well do our students write analytically?
A question about student preparation for math instruction from a prior grade is helpfully phrased as: “How did our students perform on assessments at the end of the prior year?” This kind of question leads to specific data observations rather than speculation. Next, you will use your own school and classroom contexts to choose an inquiry focus.
Activity
Slide 18:
FG-11

FG-12
Direct participants to the “Personal data plan” template and ask them to talk about which inquiry focus question they will pick and to fill out the questions in step 1 on the template. Participants attending in school-based teams should discuss and achieve consensus within their teams. Participants attending alone can partner with each other or another team during the group activities.
Facilitator note: Depending on the amount of time available for the workshop, consider choosing a focus with the school teams in advance. For example, many schools might already have a focus or instructional priority determined by their district’s strategic goals—for example, the district might want all schools to focus on improving students’ written responses to open-ended math questions. If that is the case, you might use this session to have schools work with their district-level focus and have the participants discuss what they are doing at their schools to address this focus.
Inquiry cycle step 2: Access and gather data
• Duration: 20 minutes. • Slides 19–22. • Handout 7: Drilling down—five levels of analysis. • Handout 8: Review the data’s focus and limitations
Facilitator explanation
Slide 19:
KEY POINT Responsible data analysis requires using multiple data sources to answer the inquiry focus questions that you identified. In step 2 you will ask: • What data do we have, and what data can we get? • What data are available at different levels (for example, classroom,
school, district, and state)? • What do our data sources show, and what are their limitations?

FG-13
KEY POINT Using multiple forms of data to provide evidence for conclusions is called triangulation. Consider how you will access relevant data at multiple levels of analysis—for example, school-level standardized test data, grade-level data, and student-level data. The Forum Guide describes several sources of data that schools typically collect, including annual summative assessments; interim and formative assessments; and information about student demographics, attendance, discipline, program participation, and work (National Forum on Education Statistics, 2012).
Slide 20:
Having all these data sources enables you to “drill down” to derive the greatest possible amount of information. The drill-down moves through sequential layers of analysis from the aggregated to the disaggregated, strand, item,3 and student work levels, as displayed in the table in the handout (“Drilling down—five levels of analysis”).
The Data Coach’s Guide to Improving Learning for all Students notes that “each level of data lends itself to answering specific questions about student learning and can contribute to your understanding of how well students are learning, which students are learning, and what content students are learning in your school” (Love et al., 2008, p. 131). When drilling down, you can start with statements about all students (for example, “Sixth-grade students do not do well in math”), then examine questions about specific groups of students (for example, “How are our Latino/a students performing on the sixth-grade math standards?”) or about a domain of knowledge or set of skills (for example, “How are our sixth-grade students performing on geometry and measurement skills?”). It is helpful to have data at the strand and item levels, as well as student work disaggregated by subgroups of interest (for example, race/ethnicity, language, and economic status).
For each data source, you will need to understand what the data show and what they do not show—in other words you will need to know the data’s focus (for example, “Which groups are included? What is being assessed?”) and limitations. We recommend that for each data source you access, you consider the questions on the “Review the data’s focus and limitations” template.

Activity
Slide 21:
Slide 22:
Direct participants to talk about which data they already have and which they might need to collect, based on the “Drilling down” chart in the handout. Have them fill out the questions in step 2 on the “Personal data plan” template and the “Review the data’s focus and limitations” template for several possible sources of data. Team participants should discuss and achieve consensus within their teams.
Inquiry cycle step 3: Analyze and interpret data
• Duration: 60 minutes. • Slides 23–28. • Materials: Chart paper and markers, one set per school team. • Handout 9: Data-driven dialogue.
Facilitator note: In this section of the workshop, participants should examine the data they brought with them to practice the protocol. Participants who do not have their own school-level data can practice with data that the facilitator has prepared with the assistance of the district as an example.
Webinar/virtual activity note: This activity can be conducted in webinar format by providing participants with an example dataset ahead of time or as a download during the webinar.
FG-14

FG-15
Facilitator explanation
Slide 23:
KEY POINT In step 3 you will ask: • What do we observe in the data? What patterns do we notice? • What can we infer about our students’ strengths and challenges? • Which challenge shall we address?
KEY POINT Once you have data from multiple sources in a form you can use, you will analyze and interpret the data to take appropriate action. At this point you will have to make data observations and recognize the data’s limitations (for example, the data might show only one year of student performance, rather than a series of years that support a trend). This step requires format-ting the data into a usable form, determining the data source’s purpose and constraints, and drawing conclusions that can be defended with the data (National Forum on Education Statistics, 2012).
Slide 24:
Although many states and districts include visual data displays such as graphs and charts in their reports to schools, sometimes they do not, and educators have to translate data tables into user-friendly visuals. Data Wise suggests several ways to create effective visual data displays (Boudett, City, & Murnane, 2013).
FG-16
The first step is to decide on the story or message you want to highlight with the data. Remember that your focus question from step 1 should help you select which data to display. Once you have selected the data, consider the following tips:
• Always make sure the chart is clearly labeled with a title, axes, and a key if needed. • Select a chart format that is easy to read and uses space and color well. • Add numeric cues to help the viewer—for example, make sure that the scales are
consistent if you are comparing displays of similar type, and add the number for the data value if it helps to be more specific (Boudett et al., 2013).
Facilitator note: It would be helpful to show an example of a visual that was created from numeric or tabular data as a way of highlighting how data displays can guide analysis and promote discussion. Facilitators can do this by working with the district or school to select common data tables and then create examples of the data in histograms, pie charts, or line graphs.
Facilitator explanation
Slide 25:
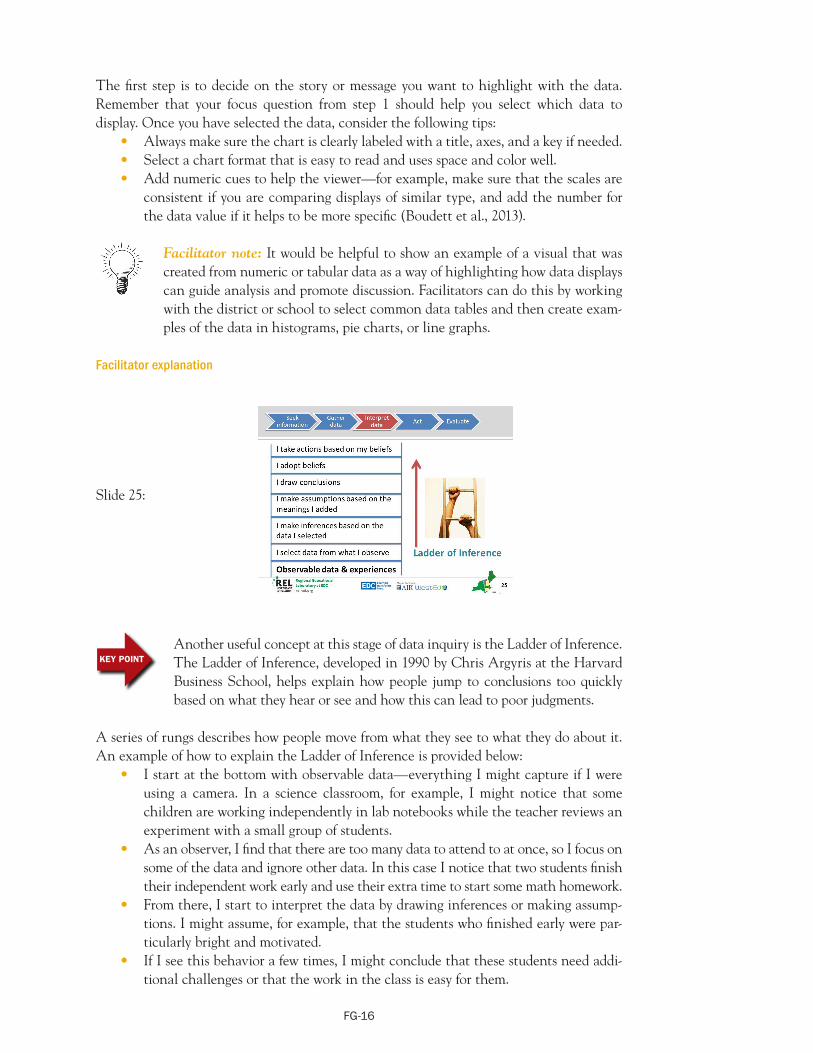
KEY POINT Another useful concept at this stage of data inquiry is the Ladder of Inference. The Ladder of Inference, developed in 1990 by Chris Argyris at the Harvard Business School, helps explain how people jump to conclusions too quickly based on what they hear or see and how this can lead to poor judgments.
A series of rungs describes how people move from what they see to what they do about it. An example of how to explain the Ladder of Inference is provided below:
• I start at the bottom with observable data—everything I might capture if I were using a camera. In a science classroom, for example, I might notice that some children are working independently in lab notebooks while the teacher reviews an experiment with a small group of students.
• As an observer, I find that there are too many data to attend to at once, so I focus on some of the data and ignore other data. In this case I notice that two students finish their independent work early and use their extra time to start some math homework.
• From there, I start to interpret the data by drawing inferences or making assumptions. I might assume, for example, that the students who finished early were particularly bright and motivated.
• If I see this behavior a few times, I might conclude that these students need additional challenges or that the work in the class is easy for them.
FG-17
• My beliefs then influence the actions I take. For example, I might believe that these two students are more capable than their peers, and I might advise the school counselor to guide these students into advanced classes or programs.
There are several problems with jumping up the Ladder of Inference like this. First, a too rapid move from brief observations to interpretations may lead to beliefs that promote unequal opportunities. Second, it is likely that the observer will continue to self-select observable data that confirm these beliefs—as we all do—and ignore other disconfirming data. Third, the actions taken are likely to reinforce the noticed behaviors, thus shaping subsequent observable data—sometimes to students’ detriment.
KEY POINT For these reasons, it is important to develop habits that help you move down the Ladder of Inference. For example, in your inquiry teams you can establish routines or norms that encourage people to ask for evidence, identify assumptions, and question conclusions. Climbing back down the Ladder of Inference from the top rung is hard to do, so we recommend that a team leader or facilitator learn to use protocols that encourage people to stay close to the evidence, low on the ladder of inference, from the start.
Slide 26:
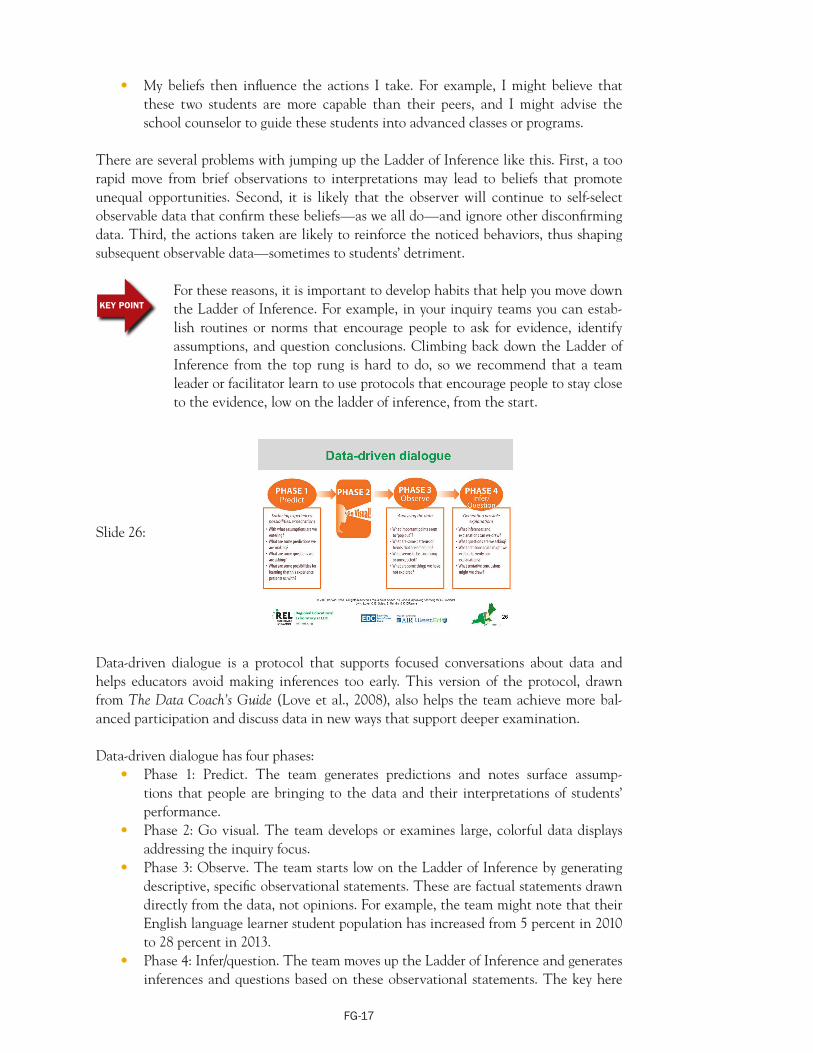
Data-driven dialogue is a protocol that supports focused conversations about data and helps educators avoid making inferences too early. This version of the protocol, drawn from The Data Coach’s Guide (Love et al., 2008), also helps the team achieve more balanced participation and discuss data in new ways that support deeper examination.
Data-driven dialogue has four phases: • Phase 1: Predict. The team generates predictions and notes surface assump
tions that people are bringing to the data and their interpretations of students’ performance.
• Phase 2: Go visual. The team develops or examines large, colorful data displays addressing the inquiry focus.
• Phase 3: Observe. The team starts low on the Ladder of Inference by generating descriptive, specific observational statements. These are factual statements drawn directly from the data, not opinions. For example, the team might note that their English language learner student population has increased from 5 percent in 2010 to 28 percent in 2013.
• Phase 4: Infer/question. The team moves up the Ladder of Inference and generates inferences and questions based on these observational statements. The key here

is to encourage and stay open to multiple data interpretations. Remember, this is a protocol to encourage exploring the data, not drawing conclusions prematurely.
Activity
Direct participants to use their own data to follow the data-driven dialogue handout as they progress through the phases.
• Keep time for participants and remind them when to transition to the next phase, or suggest that each school team or pair choose a timekeeper.
• Provide the participants with chart paper or larger pieces of paper and markers so they can create visual data displays.
Facilitator note: In the handout the suggested time allotment for data-driven dialogue is 40 minutes, but the length can be modified as needed. It might be helpful to keep phase 2 as the longest phase, as practitioners often need time to decide on or create helpful visual displays.
Facilitator explanation
Slide 27:
Once you have completed the data dialogue process, you can use your conclusions to identify the specific student challenges that emerge from your data analysis. It is important to choose a high-priority issue that you can address in the classroom. When you write your student learning challenge, include the data that led you to identify this challenge. This will be the basis for developing a student learning goal in the next step of the inquiry cycle.
Activity
Slide 28:
FG-18

FG-19
Direct participants to examples of student learning challenges written on the PowerPoint slides. After participants have finished the protocol, have them fill out the questions in step 3 on the “Personal data plan” template. Team participants should discuss and achieve consensus within their teams.
Facilitator note: If conducting the workshop in person, a 45-minute lunch break follows this activity.
Inquiry cycle step 4: Act—student learning goals
• Duration: 20 minutes. • Slides 29–30. • Materials: Index cards, post-it notes, or blank pieces of paper.
Facilitator explanation
Slide 29:
KEY POINT In step 4 you will ask: • What are our students’ learning goals? • What root causes might have led to the patterns seen in student
performance? • What changes or action steps will address the goals we set for our stu
dents’ learning?
When taking action based on the data, you will need to apply your professional expertise in analyzing and interpreting the data. In step 3 your data analysis led you to identify patterns in student learning, including common strengths and challenges. In this step you will engage in conversations with colleagues to formulate hypotheses about the reasons for these patterns. Based on your hypotheses, you might decide to change or supplement your curriculum, try new instructional strategies, or seek alternative resources to better support student learning.
Using the conclusions generated from the data analysis, you will identify student learning goals—what students should be able to achieve to address their greatest challenges. Remember that the student learning goals should relate to your original inquiry focus question and arise from your data analysis.

Slide 30:
Well-written student learning goals fit the criteria for SMART goals (adapted from Doran, 1981):
• Specific. • Measurable. • Achievable. • Realistic. • Timely.
Activity
On index cards, sticky notes, or a small piece of paper, ask participants to draft a proposed SMART goal that addresses the student challenges they identified during the data-driven dialogue. Team participants should discuss and achieve consensus within their teams.
Have each participant trade goals with another participant. Direct participants to use the SMART criteria to assess whether the goal meets the criteria. If it does not, ask them to write feedback or suggestions on the card and return the card to the other participant.
• Give participants 5 minutes to read and revise their SMART goals after receiving feedback.
Webinar/virtual activity note: This activity can be conducted in webinar format by asking participants to share their SMART student learning goals in the chat box or to raise their hands for the facilitator to call on them to respond verbally. The facilitator can either provide feedback on all the SMART goals or ask participants to provide feedback to one another through chat.
Inquiry cycle step 4: Act—root causes
• Duration: 30 minutes. • Slides 31–32. • Materials: chart paper and markers. • Handout 10: Fishbone diagram activity.
FG-20
Facilitator explanation
Slide 31:
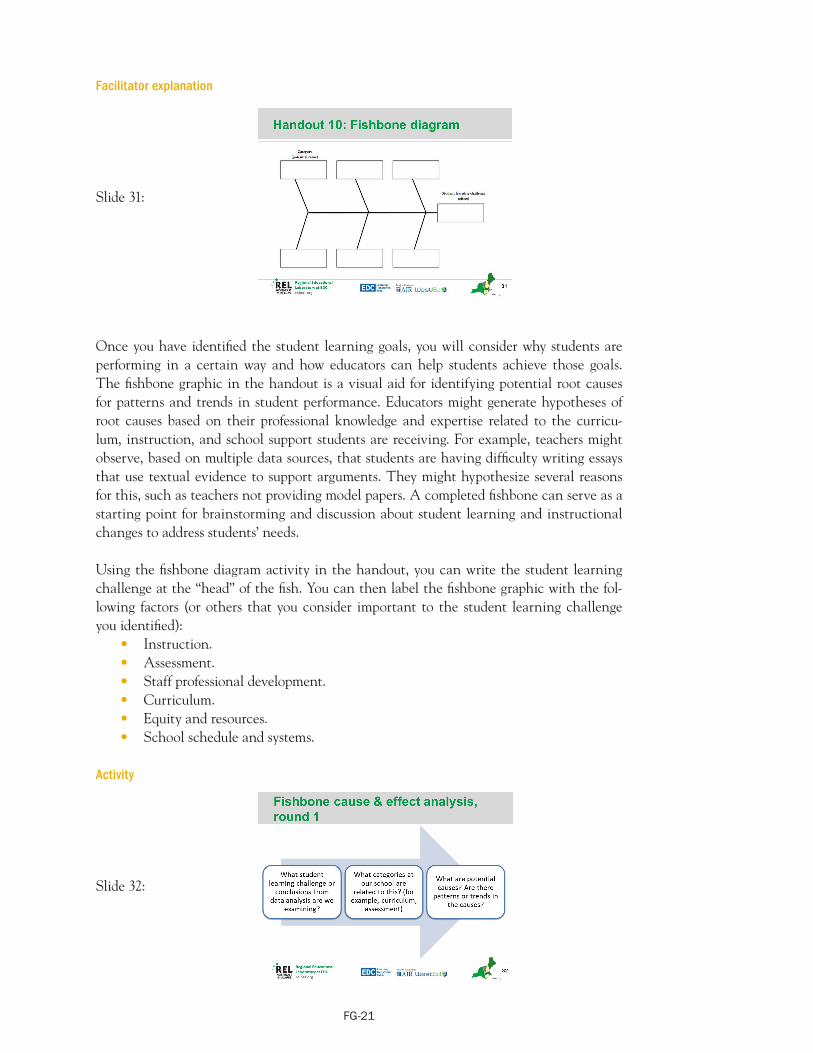
Once you have identified the student learning goals, you will consider why students are performing in a certain way and how educators can help students achieve those goals. The fishbone graphic in the handout is a visual aid for identifying potential root causes for patterns and trends in student performance. Educators might generate hypotheses of root causes based on their professional knowledge and expertise related to the curriculum, instruction, and school support students are receiving. For example, teachers might observe, based on multiple data sources, that students are having difficulty writing essays that use textual evidence to support arguments. They might hypothesize several reasons for this, such as teachers not providing model papers. A completed fishbone can serve as a starting point for brainstorming and discussion about student learning and instructional changes to address students’ needs.
Using the fishbone diagram activity in the handout, you can write the student learning challenge at the “head” of the fish. You can then label the fishbone graphic with the following factors (or others that you consider important to the student learning challenge you identified):
• Instruction. • Assessment. • Staff professional development. • Curriculum. • Equity and resources. • School schedule and systems.
Activity
Slide 32:
FG-21

Ask participants to consider each factor in the fishbone graphic individually. • Brainstorm some corresponding causes that fit each factor in the fishbone and
that might have led to the student learning challenge that the team identified in data analysis.
• Write those causes down on the left side of the chart paper, leaving room on the right for more text.
Webinar/virtual activity note: This activity can be conducted in webinar format by asking participants to share their ideas and action steps in the chat box or to raise their hands for the facilitator to call on them to respond verbally. If possible, the facilitator should “write” on the screen or take notes so that participants can see where their ideas fit in the fishbone diagram categories. For example, if a teacher writes: “We should include more time for students to complete work in pairs or small groups,” the facilitator can write that suggestion under “instruction” in the fishbone.
Facilitator note: There is a 10-minute break after this section of the workshop.
Inquiry cycle step 4: Act—generating solutions
• Duration: 30 minutes. • Slides 33–34. • Handout 10: Fishbone diagram activity (continued from last activity).
Discussion
Slide 33:
Using the fishbone graphic as a reference, ask participants to talk in pairs or within their school teams about the following questions:
• Which causes are within your control to change? • Which causes have the greatest impact on student learning? • Which causes are you most eager to investigate or research? • Which causes do you have the time and resources to address?
FG-22

Slide 34:
Recommend that the team identify the most important causes to address to affect student learning. Ask them to brainstorm some potential action steps to address those causes.
• Teams can write their causes and action steps using the fishbone diagram as a reference, or simply list causes and action steps on chart paper.
Ask participants to select action steps from those listed on the chart paper and fill out step 4 on their “Personal data plan” templates. Team participants should discuss and achieve consensus within their teams.
Facilitator note: If team participants are having difficulty agreeing on the top action steps, encourage them to vote. Have participants review each action step and list its advantages and disadvantages, then have participants vote raising their hands, writing on a piece of paper, or putting check-marks on the chart paper. Tally up the votes and determine which action steps had the most votes. To prevent overload and to target only high-priority steps, recommend that the team focus on no more than five action steps.
Inquiry cycle step 5: Evaluate
• Duration: 20 minutes. • Slides 35–37.
Facilitator explanation
Slide 35:
FG-23

KEY POINT In step 5 you will ask: • How effectively has the initial issue been resolved? • What new concerns have arisen? • Should we continue with our action plan or choose a new focus?
Slide 36:
This step provides closure for the inquiry cycle, as you will need to assess whether your actions have succeeded in addressing the original issue. In this step you might ask: “Which factors are understood sufficiently and which warrant additional investigation? Have new data gaps (needs) been identified?” (National Forum on Education Statistics, 2012, p. 22). The results of your initial actions will inform whether you need to spend more time addressing the original issue or if you have met your goals and can begin asking a new inquiry question. At the end of this step the inquiry cycle repeats, as you again ask what high-priority questions you would like to address and what data will help you address it.
Discussion
Slide 37:
Ask participants to talk in pairs or small groups about how they will monitor and evaluate the success of their action plan. Have them fill out only the first question in step 5, “How will I measure my progress toward this objective?” on the “Personal data plan” template. Team participants should discuss and achieve consensus within their teams.
FG-24
Explain that after the workshop, they can implement their action plans and record what effects the actions had and any next steps under the remainder of step 5 on the “Personal data plan” template.
Have participants share with the whole group how they will monitor and evaluate the success of their action plans. Offer the following suggestions if they do not come up in discussion:
• Kekahio and Baker (2013) recommend: “When assessing the effectiveness of an action plan, the data team should collect the same type of data from the same data source used to identify the challenge or success” (p. 14). For example, teachers examining the results of a classwide writing prompt could administer another writing prompt after they enact their action steps.
• Check the progress of any action steps at the start of every meeting. • Add reminders to follow up on action steps directly to team meeting agendas. • Designate a person to remind other team members to complete action steps. • Create a team checklist with action steps and update it at every team meeting.
Facilitator note: Make clear to participants that the inquiry cycle begins again after step 5—that the results of the action plan raise new questions or possible areas for further inquiry. At that point participants return to step 1 to decide which focus areas to continue or which new focus areas to pursue, and step 2 to determine which data to use to address this focus area.
Taking next steps
• Duration: 20 minutes. • Slide 38.
Discussion
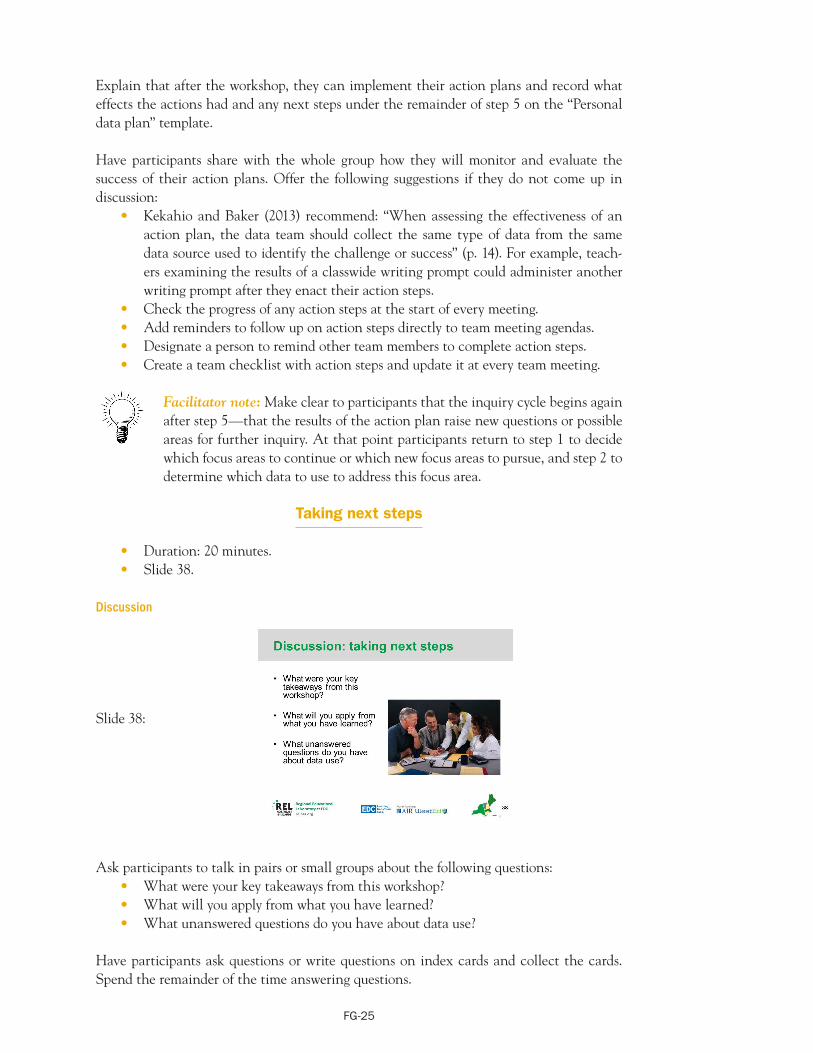
Slide 38:
Ask participants to talk in pairs or small groups about the following questions: • What were your key takeaways from this workshop? • What will you apply from what you have learned? • What unanswered questions do you have about data use?
Have participants ask questions or write questions on index cards and collect the cards. Spend the remainder of the time answering questions.
FG-25
Webinar/virtual activity note: This activity can be conducted in webinar format by asking participants to share ideas and questions in the chat box or to raise their hands for the facilitator to call on them to respond verbally.
Closing
• Duration: 10 minutes. • Slides 39–41.
Facilitator explanation
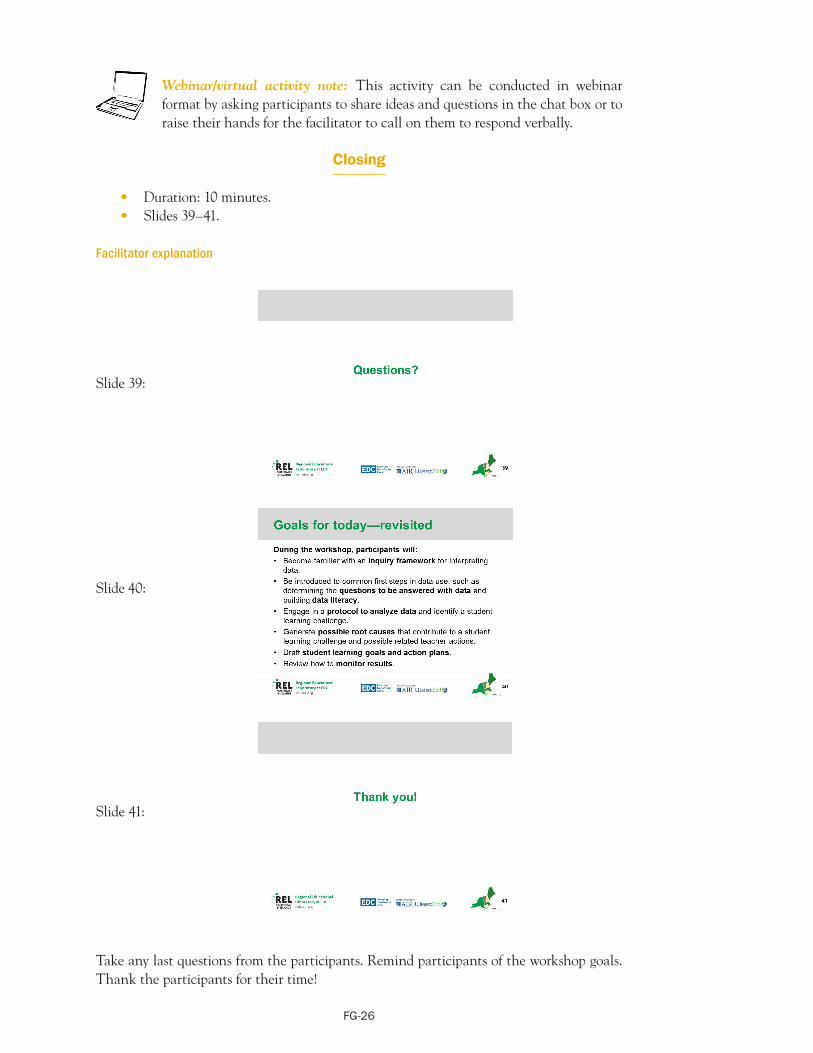
Slide 39:
Slide 40:
Slide 41:
Take any last questions from the participants. Remind participants of the workshop goals. Thank the participants for their time!
FG-26

Optional assignment
One of the main takeaways from this workshop is the “Personal data plan” template, which
provides a step-by-step approach to the data inquiry cycle. We have walked through the five
stages of the data cycle together, and now you will identify your own questions and data to
collect.
Use the “Personal data plan” template you started during the workshop or develop a new
one, with a different inquiry focus, with a team back at your schools:
• Gather several data sources about your inquiry question, and work collaboratively with
others at your school to engage in the data-driven dialogue.
• Identify a student learning challenge from the data analysis and a SMART goal to address
the issue.
• Brainstorm and list possible root causes and action steps for the student learning goal
using the fishbone activity.
• Discuss with others at your school what you will do to monitor and evaluate the effects of
your action steps.
FG-27

Practitioner Data Use in Schools Workshop:
Handouts

Handout 1: Purpose of the workshop and pre-reading assignment
The Practitioner Data Use Workshop shows school-level practitioners—including administrators and teachers—how to use a data inquiry cycle to investigate a question and make instructional decisions. In this workshop you will explore approaches to using data systematically and accurately to inform teaching practice. Topics covered in the sessions include developing data literacy, engaging in a data inquiry cycle, accessing and analyzing available data, identifying and creating student goals, and using data to formulate action plans for instructional decisions. You will practice using data for your own district, school, and classroom. It is strongly recommended that participants attend the workshop in teams to help build a supportive network of practitioners engaged in data use to inform instruction. You will leave the workshop with a specific data plan and a process that you can use to create student goals and action plans.
During the workshop you will: • Become familiar with an inquiry framework for interpreting data. • Be introduced to common first steps in data use, such as determining the ques
tions to be answered with data and building data literacy. • Engage in a protocol to analyze data and identify a student learning challenge. • Identify possible root causes that contribute to a student learning challenge and
possible related teacher actions. • Draft student learning goals and action plans. • Review how to monitor results.
Pre-reading assignment
It is strongly suggested that you read the following materials before attending the session: • National Forum on Education Statistics. (2012). Forum guide to taking action with
education data (NFES 2013–801). U.S. Department of Education. Washington, DC: National Center for Education Statistics. Retrieved from http://nces.ed.gov/pubs2013/2013801.pd
f [Note: Read the “Overview,” pages 1–14 only.]
• Kekahio, W., & Baker, M. (2013). Five steps for structuring data-informed conversations and action in education (REL 2013–001). Washington, DC: U.S. Department of Education, Institute of Education Sciences, National Center for Education Evaluation and Regional Assistance, Regional Educational Laboratory Pacific. Retrieved from http://ies.ed.gov/ncee/edlabs/regions/pacific/pdf/REL_2013001.pdf
HO-1

Handout 2: Workshop agenda
Agenda for a one-day in-person Practitioner Data Use Workshop (six hours)
Duration Topic
10 minutes Introductions and origins of workshop
10 minutes
15 minutes
Workshop overview and learning goals
Knowledge, skills, and abilities for dat
10 minutes Research on collaborative data inquiry
15 minutes The inquiry cycle
15 minutes Break
20 minutes Inquiry cycle step 1: Seek information
a-driven action
20 minutes Inquiry cycle step 2: Access and gather data
60 minutes Inquiry cycle step 3: Analyze and interpret data
45 minutes Lunch
20 minutes Inquiry cycle step 4: Act—student learning goals
30 minutes Inquiry cycle step 4: Act—root causes
10 minutes Break
30 minutes Inquiry cycle step 4: Act—generating solutions
20 minutes Inquiry cycle step 5: Evaluate
20 minutes Taking next steps
10 minutes Closing
HO-2
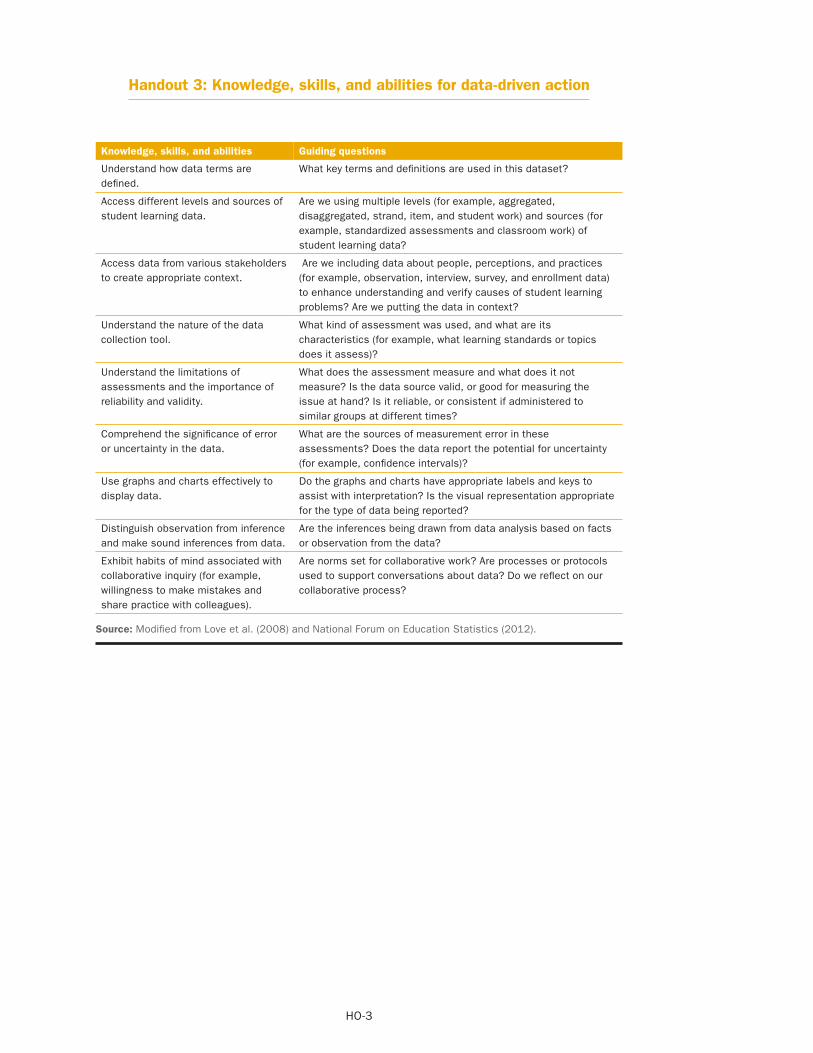
Handout 3: Knowledge, skills, and abilities for data-driven action
Knowledge, skills, and abilities Guiding questions
Understand how data terms are What key terms and definitions are used in this dataset? defined.
Access different levels and sources of Are we using multiple levels (for example, aggregated, student learning data. disaggregated, strand, item, and student work) and sources (for
example, standardized assessments and classroom work) of student learning data?
Access data from various stakeholders Are we including data about people, perceptions, and practices to create appropriate context. (for example, observation, interview, survey, and enrollment data)
to enhance understanding and verify causes of student learning problems? Are we putting the data in context?
Understand the nature of the data collection tool.
What kind of assessment was used, and what are its characteristics (for example, what learning standards or topics does it assess)?
Understand the limitations of assessments and the importance of reliability and validity.
What does the assessment measure and what does it not measure? Is the data source valid, or good for measuring the issue at hand? Is it reliable, or consistent if administered to similar groups at different times?
Comprehend the significance of error or uncertainty in the data.
What are the sources of measurement error in these assessments? Does the data report the potential for uncertainty (for example, confidence intervals)?
Use graphs and charts effectively to display data.
Do the graphs and charts have appropriate labels and keys to assist with interpretation? Is the visual representation appropriate for the type of data being reported?
Distinguish observation from inference Are the inferences being drawn from data analysis based on facts and make sound inferences from data. or observation from the data?
Exhibit habits of mind associated with Are norms set for collaborative work? Are processes or protocols collaborative inquiry (for example, used to support conversations about data? Do we reflect on our willingness to make mistakes and collaborative process? share practice with colleagues).
Source: Modified from Love et al. (2008) and National Forum on Education Statistics (2012).
HO-3

Handout 4: Engaging in a data cycle
2. Access1. Seek and gatherinformation data
3. Analyze 5. Evaluate and interpret
data
4. Act
Source: National Forum on Education Statistics, 2012, p. 3.
HO-4

HO-5
Handout 5: Inquiry cycle sort cards
Identify an inquiry question Identify which data are needed to answer the question
Gather multiple data sources Describe the data sources and their limitations
Create data displays (charts or graphs) Make data observations that are specific, factual, and related to the question
Identify patterns in the data Identify students’ strengths and challenges from the data
Choose one student learning challenge Brainstorm possible reasons for the student learning challenge
Set student learning goals Develop an action plan
Develop ways to monitor progress Adjust instruction
Monitor progress and measure success Determine next steps for teachers and students

Handout 6: Personal data plan template
Data use cycle Question Application
Step 1: Seek information Which standards or content areas do we want to focus on?
Why are these standards or content areas important to focus on?
Related to these standards or content areas, what questions about student learning can be answered by looking at data?
Step 2: Access and gather data What student learning data do we already have access to?
What other data sources do we need to collect?
Step 3: Analyze and interpret data What patterns do we notice in the data?
What strengths do we notice in our students’ performance?
What areas of need do we notice in our students’ performance?
What student learning challenge should we focus on?
Step 4: Act on the data What goals do we have for student learning?
What action steps will we try?
What is our rationale for selecting these action steps?
What is our timeline for implementation?
Step 5: Evaluate How will we measure progress toward this objective?
What effects did our actions have? What were the actual outcomes?
What are our next steps?
Source: Based on the Forum Guide for Taking Action with Education Data (2012), p. 34.
HO-6

Handout 7: Drilling down—five levels of analysis
Level Definition Example
Aggregated data Student learning data results compiled All grade 6 students’ performance in at the largest level science
Disaggregated data Student learning data results separated Grade 6 African American, White, Latino, into groups of datasets by race/ Native American, and Asian students’ ethnicity, language, economic level, and performance in science education status
Strand data Student learning data results separated into groups of datasets by areas within the content
All grade 6 students’ performance in physical science, life science, and the nature of science
Item-level data Student learning data results reported by students’ performance on individual test items
All grade 6 students’ performance on all test items in each strand area in science
Student work Artifacts that show evidence of student thinking
Written responses from grade 6 students to a question or prompt focused on a physical science concept
Source: Love et al., 2008, p. 133.
HO-7

Handout 8: Review the data’s focus and limitations
Data source (What this data source describes)
Types of data included (What this data source conveys)
Types of data not included (What this data source does not convey)
Example: This data source shows the proficiency levels that the school’s grade 6 students achieved on the state’s annual reading test compared with grade 6 students across the state for the past three years (spring of 2011, 2012, and 2013).
Example: Shows four proficiency levels. Shows the total number of grade 6 students who took the test in 2011, 2012, and 2013. Notes revisions in the reading test between the 2010 and 2011 administrations. Shows scores aggregated for all reading topics and for all grade 6 students in the school.
Example: Does not show subgroups (for example, gender, English language learner status, and disability status). Does not show range of scores within each proficiency level. Does not show proficiency within reading topics (for example, literary texts, informational texts). Does not show proficiency by class/teacher.
Source: Authors.
HO-8

Handout 9: Data-driven dialogue
Phase Notes
(5 minutes) Phase I: Predict
What do we expect to see in these data? What questions are we asking?
(15 minutes) Phase 2: Go visual
What visual displays can we make or select to examine the data?
(10 minutes) Phase 3: Observe
What do we notice? What are some emerging patterns in the data?
(10 minutes) Phase 4: Infer/question
What inferences and explanations can we draw? What tentative hypotheses might we make? What new questions are we asking about student learning?
Source: Love et al., 2008.
HO-9

Handout 10: Fishbone diagram activity
Category (potential cause)
Student learning challenge (effect)
Source: Authors.
HO-10

Notes
1. Research Agenda Setting Workshops are a highly collaborative process for guiding practitioners and policymakers with varying backgrounds to settle on a set of questions with the potential to influence policy and practice. Through the process, researchers and practitioners work together to establish a common research focus by identifying and agreeing on the central questions that will guide research projects. Resources for this workshop are available for download from the Tools & Resources section of the REL Northeast & Islands website, http://www.relnei.org/tools-resources.html, or by emailing [email protected].
2. The data inquiry cycle in Kekahio and Baker (2013) also contains several protocols and templates that can substitute for activities in this workshop.
3. Item-level data are typically not made available for large-scale standardized tests, due to privacy protections for students. If teachers want to obtain item-level data from these tests, they should be aware of the legal and ethical guidelines and data privacy regulations related to that assessment. However, teachers might have access to item-level data about students through benchmark or progress-monitoring assessments that are administered more frequently at the school level.
Notes-1

References and other resources
Achinstein, B. (2002). Conflict amid community: The micropolitics of teacher collaboration. Teachers College Record, 104(3), 421–455. http://eric.ed.gov/?id=EJ649782.
Boudett, K. P., City, E. A., & Murnane, R. J. (Eds.) (2013). Data wise: A step-by-step guide to using assessment results to improve teaching and learning, revised and expanded edition. Cambridge, MA: Harvard Education Press.
Charalambous, C., & Silver, E. A. (2008, January). Shifting from proving to improving: Using assessment as an integral part of instruction. Paper presented at the annual meeting of the Association of Mathematics Teacher Educators, Tulsa, OK.
Copland, M. A. (2003). Leadership of inquiry: Building and sustaining capacity for school improvement. Educational Evaluation and Policy Analysis, 25(4), 375–395. http://eric.ed.gov/?id=EJ782423
Doran, G. T. (1981). There’s a S.M.A.R.T. way to write management’s goals and objectives. Management Review, 70(11), 35–36.
Edmondson, A. (2002). The local and variegated nature of learning in organizations: A group- level perspective. Organization Science, 13(2), 128–146.
Gallimore, R., Ermeling, B., Saunders, W., & Goldenberg, C. (2009). Moving the learning of teaching closer to practice: Teacher education implications of school-based inquiry teams. The Elementary School Journal, 109(5), 537–553. http://eric.ed.gov/?id=EJ844058
Hamilton, L., Halverson, R., Jackson, S., Mandinach, E., Supovitz, J., & Wayman, J. (2009). Using student achievement data to support instructional decision making (NCEE 2009–4067). Washington, DC: National Center for Education Evaluation and Regional Assistance, Institute of Education Sciences, U.S. Department of Education. http://eric.ed.gov/?id=ED506645
Herman, J. L., Osmundson, E., & Dietel, R. (2010). Benchmark assessment for improved learning (AACC Report). Los Angeles, CA: University of California. Retrieved November 29, 2014, from https://www.cse.ucla.edu/products/policy/R2_benchmark_ report_Herman.pdf
Kekahio, W., & Baker, M. (2013). Five steps for structuring data-informed conversations and action in education (REL 2013–001). Washington, DC: U.S. Department of Education, Institute of Education Sciences, National Center for Education Evaluation and Regional Assistance, Regional Educational Laboratory Pacific. http://eric.ed.gov/?id=ED544201
Love, N., Stiles, K. E., Mundry, S., and DiRanna, K. (2008). The data coach’s guide to improving learning for all students: Unleashing the power of collaborative inquiry. Thousand Oaks, CA: Corwin Press.
Ref-1

McLaughlin, M. W., & Zarrow, J. (2001). Teachers engaged in evidence-based reform: Trajectories of teachers’ inquiry, analysis, and action. In A. Lieberman & L. Miller (Eds.), Teachers caught in the action: Professional development that matters (pp. 79–101). New York: Teachers College Press.
National Forum on Education Statistics. (2012). Forum guide to taking action with education data (NFES 2013–801). U.S. Department of Education. Washington, DC: National Center for Education Statistics. Retrieved June 10, 2013, from http://nces.ed.gov/pubs2013/2013801.pdf
Nelson, T. H., Slavit, D., & Deuel, A. (2012). Two dimensions of an inquiry stance toward student-learning data. Teachers College Record 114(8), 1–42. http://eric.ed.gov/?id=EJ1001974
Stokes, L. (2001). Lessons from an inquiring school: Forms of inquiry and conditions for teacher learning. In A. Lieberman & L. Miller (Eds.), Teachers caught in the action: Professional development that matters (pp. 141–158). New York: Teachers College Press.
Timperley, H. (2008). Evidence-informed conversations: Making a difference to student achievement. In L. M. Earl & H. Timperley (Eds.), Professional learning conversations: Challenges in using evidence for improvement (Vol. 1, pp. 69–79). Dordrecht, Netherlands: Springer.
Ref-2

The Regional Educational Laboratory Program produces 7 types of reports
Making Connections Studies of correlational relationships
Making an Impact Studies of cause and effect
What’s Happening Descriptions of policies, programs, implementation status, or data trends
What’s Known Summaries of previous research
Stated Briefly Summaries of research findings for specific audiences
Applied Research Methods Research methods for educational settings
Tools Help for planning, gathering, analyzing, or reporting data or research


![Scholar or Practitioner? - Typepad · 2016] SCHOLAR OR PRACTITIONER? 509 practice experience.6 Although lawyer groups7 and judges8 complain that law schools are doing a poor job of](https://img.dokumen.tips/doc/110x75/5f0ccf067e708231d4373c40/scholar-or-practitioner-typepad-2016-scholar-or-practitioner-509-practice-experience6.jpg)