Embed Size (px)
Citation preview

SYSTEMATIC REVIEW
©2016 U
Practice nurse involvement in the management ofadults with type 2 diabetes mellitus attending ageneral practice: results from a systematic review
Deborah Parker,1,2,4 Diane Maresco-Pennisi,1,2 Karen Clifton,1,2 Ridhwan Shams3 and Jacqui Young1
1School of Nursing, Midwifery and Social Work, The University of Queensland, 2Australian Centre for Evidence Based Community Care:
A Collaborating Centre of the Joanna Briggs Institute, The University of Queensland, 3School of Medicine, University of Queensland, St Lucia,
and 4Centre for Applied Nursing Research, Western Sydney University and the Ingham Applied Medical Research Institute, Liverpool, Australia
AB S T R AC T
Aim: Using themethodology of the Joanna Briggs Institute, a systematic review of current research was performed todetermine if the addition of management by nurses had been more effective in improving clinical outcomes ofpatients with type 2 diabetes attending a general practice compared with standard care.
Methods: A three-step literature search was conducted for suitable English studies with quantitative clinicaloutcomes that had been published from January 1990 to May 2014. Randomised controlled trials (RCTs) wereparticularly sought after; however, other research designs were considered. Articles were assessed by twoindependent reviewers for methodological validity, prior to inclusion in the review, using standardised criticalappraisal instruments from the Joanna Briggs Institute. When possible, quantitative data were pooled in statisticalmeta-analysis.
Results: Seven studies were of suitable quality and relevance for the review: these included three randomisedcontrol trials; two cluster- RCTs; a cluster, nonrandomised, controlled before-after study; and a cluster observationalcohort study. These studies yield evidence that nurse management in addition to standard general practitioner careleads to modest improvements in blood pressure and total cholesterol levels in adults with type 2 diabetes attendinga general practice.
Conclusion: Meta-analysis identified modest, significant improvements amongst participants in nurse manage-ment interventions (NMIs) in the following clinical outcomes: mean SBP, mean DBP and mean total cholesterol. Themajority of outcomes studied did not show any advantage to adding NMIs to general practitioner care. Two studiesreported significant improvements of participants with poor control in mean haemoglobin A1c. An RCT thatinvestigates the effect of NMIs on patients, with poor control in regard to clinical outcomes and cost effectiveness,is recommended.
Key words: diabetes mellitus type 2, general practice, meta-analysis, nurse management, practice nurse
Int J Evid Based Healthc 2016; 14:41–52.
Background
I n the year 1996, diabetes was first listed as an Aus-
tralian national health priority.1 Now 5% of Australian
city-dwellers livewith this disease, and in remoteareas, it is
estimated that one out of every 11 people has diabetes.2
Correspondence: Deborah Parker, Centre for Applied Nursing
Research, Locked bag 7103, Liverpool BC. NSW 1871, Australia.
E-mail: [email protected]
DOI: 10.1097/XEB.0000000000000080
International Journal of Evidence-Based Healthcare � 2016 University
niversity of Adelaide, Joanna Briggs Institute. U
Type 2diabetes accounts for 85–90%of all diabetes cases,
and eachweek in Australia approximately 1160 new cases
of type 2 diabetes are identified.1,3
The increase rate in type 2 diabetes occurrences has
been a worrying trend, as it often leads to debilitating
symptoms and an early death. It is associated with
circulatory complications, chronic kidney disease, eye
complications and a significant reduction in quality of
life.4 In 2010, 5.4% (7750/143 519) of Australian deaths
were the result of diabetes or causes related to diabetes.2
of Adelaide, Joanna Briggs Institute 41
nauthorized reproduction of this article is prohibited.

D Parker et al.
©2016 U
In 2008–2009, almost $1507 million was spent on
diabetes in Australia. Of this, 43% was on hospital-
admitted patients, 24% on out-of-hospital medical serv-
ices and 33% on blood glucose lowering medicines.5
Diabetes management is a drain on one’s personal
finances as well. On average, the direct individual
medical costs of someone with diabetes are two to three
times above the average.3
As with other chronic diseases, the management of
diabetes is complex, time consuming and challenging.
Studies have shown that approximately 50% of patients
with chronic diseases do not receive suitable manage-
ment.6,7 Such findings have led to calls for a paradigm
shift in how healthcare is delivered to patients who have
a chronic disease. Ongoing research continues to search
for methods to manage chronic disease that are cost-
effective, accessible and widely available.8
Evidence has identified nurses to be well suited to
deliver education on health and illness prevention to
patients with chronic diseases. Nurses employed in
general practice (i.e. practice nurses) are particularly well
placed to implement behaviour change strategies and to
monitor patient compliance. Data from international
studies confirm that nurses working in general practice
effectively manage the complex needs of patients with
chronic diseases.9 A systematic review by Laurant et al.9
concluded that interventions that replaced doctors in
primary care with properly trained nurses resulted in
comparable processes of care, utilisation of resources,
costs and patient health outcomes.
In the United Kingdom, nurses have long partici-
pated in the management of chronic diseases.10 In
Australia, a recent national survey of Australian practice
nurses with a response rate of 32% (n¼ 701/2161)
verifies that the growing role of the Australian practice
nurse includes chronic disease management.11 The
proportions of practice nurses that reported that they
undertook education, assessment and management on
a weekly or daily basis for specific chronic diseases were
as follows: asthma (46%), arthritis (29%), cardiovascular
disease (76%), diabetes (59%) and wound management
(93%).11 Approximately half (52%) reported that they
frequently prepared chronic disease management
plans.11 It has been suggested by Jolly12 that up to
70% of work performed by doctors in Australian general
practice could actually be performedwell by nurses. The
number of Australian practices employing a nurse has
been climbing over the last decade; in 2007, 58% of
general practitioners (GPs) employed a nurse and in
2012, this figure rose to 63%.11 In 2012, there were
10 693 nurses employed at a GP; nearly 3000 more than
those employed in GPs in 2007.11
42 International Journal of Evidence-Based
niversity of Adelaide, Joanna Briggs Institute. U
Some believe that adults with type 2 diabetes would
benefit by having nurses involved with their manage-
ment, and several studies have shown that nurses work-
ing with doctors in general practice significantly
improved outcomes in patients with type 2 diabe-
tes.13–17 Although improvements in the patients’ glycae-
mic control have been reported, Renders et al.18 have
called for researchers to focus more broadly on the
clinical outcomes in interventions to improve the man-
agement of diabetes in general practice, outpatient and
community settings.
AimsThe aim of this systematic review was to determine if the
additional management by nonspecialist nurses was
more effective in improving clinical outcomes of patients
with type 2 diabetes in general practice than standard
GP care alone. This review is an update of a 2012
review.19 Studies with interventions performed by a
nurse practitioner, a diabetic nurse educator or a study
nurse were excluded from the review to retain focus on
nonspecialist nurses, often referred to as practice nurses,
employed in general practice.
Search strategyA search strategy was designed to identify peer-
reviewed scientific articles as well as other types of
research publications, for example, doctoral theses or
government reports. The search was limited to publi-
cations written in English and was undertaken in three
steps. First, an initial limited search of Medline and
CINAHL involved an analysis of the title, abstract and
index terms of relevant articles to identify relevant
search terms. Next, identified search terms were used
to search relevant databases, and, lastly, the reference
lists of all identified articles were manually searched for
additional studies.
The search strategy was designed to identify both
published and unpublished literature. The first published
search was limited to English language articles published
from January 1990 to December 2011. After publication
of the source report, the search was rerun in July 2014, to
update the review for this article, using the same search
strategy. This 2014 search resulted in two new articles,
published after 2012, being included in the review.
Therefore, the final search for this article was performed
in 2014, and, in total, the literature for this article was
searched from 1990–2014.
Initial keywords used were as follows: diabetes, dia-
betes mellitus, type 2 diabetes, nurse-led, nurse-directed,
practice nurse, primary care, primary healthcare, general
practice, family practice and GP.
Healthcare � 2016 University of Adelaide, Joanna Briggs Institute
nauthorized reproduction of this article is prohibited.
SYSTEMATIC REVIEW
©2016 U
Twenty-four databases for published literature were
searched; these included but were not limited
to CINAHL, EMBASE, Medline, PubMed and Scirus.
Fourteen databases containing unpublished literature
were searched that included but were not limited to the
following: American Nurses Association, Australian
Digital Theses Program, Google Scholar System for
Information on Grey Literature in Europe. A full list of
the databases used in the search can be found in the
source report.19
The following specific search strategy was applied:
nurse-led OR nurse-run OR nurse-directed OR ‘nurse
managed’ OR ‘nurse care manage�’ OR ‘nurse coordi-
nated’ OR ‘shared care’ AND ‘general practice’ OR ‘family
practice’ OR ‘primary care’ OR ‘primary healthcare’ AND
‘diabet�’ AND ‘rct’ OR ‘random allocation’ OR ‘random-
ised control trial’ OR ‘comparative stud�’ OR ‘interrupted
time series’ OR ‘clinical trial’ OR ‘prospective stud�’ OR‘study design’ OR ‘evaluation research’ OR ‘controlled
stud�’ OR ‘cohort’ OR ‘case control’ OR ‘interrupted time
series’ OR ‘experimental stud�’.
Inclusion criteriaStudies of nurse management interventions (NMIs)
involving adult participants (aged above 18 years) diag-
nosed with diabetes type 2, attending a general/family
practice, were reviewed. Only studies that involved a
nurse who was both employed by the practice and
played a lead role in the intervention care were included.
Studies using a randomised controlled trial (RCT) or a
cluster RCT (cRCT) design were particularly sought after;
however, other research designs (i.e. controlled clinical
trials, interrupted time series, controlled before and after
designs and observational studies) were considered as
well. Studies were selected that reported on changes in
one ormore clinical outcomes for example, SBP, DBP, BMI,
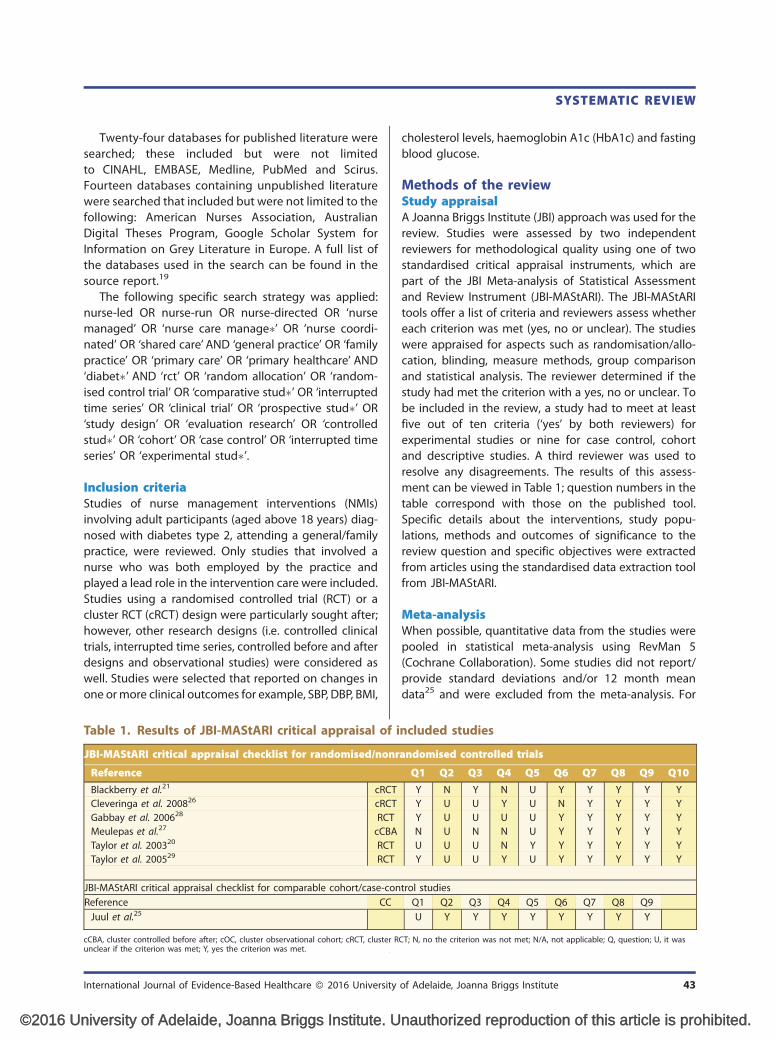
Table 1. Results of JBI-MAStARI critical appraisal of i
JBI-MAStARI critical appraisal checklist for randomised/nonr
Reference
Blackberry et al.21 cRCT
Cleveringa et al. 200826 cRCT
Gabbay et al. 200628 RCT
Meulepas et al.27 cCBA
Taylor et al. 200320 RCT
Taylor et al. 200529 RCT
JBI-MAStARI critical appraisal checklist for comparable cohort/case-con
Reference CC
Juul et al.25
cCBA, cluster controlled before after; cOC, cluster observational cohort; cRCT, cluster Runclear if the criterion was met; Y, yes the criterion was met.
International Journal of Evidence-Based Healthcare � 2016 University
niversity of Adelaide, Joanna Briggs Institute. U
cholesterol levels, haemoglobin A1c (HbA1c) and fasting
blood glucose.
Methods of the reviewStudy appraisalA Joanna Briggs Institute (JBI) approach was used for the
review. Studies were assessed by two independent
reviewers for methodological quality using one of two
standardised critical appraisal instruments, which are
part of the JBI Meta-analysis of Statistical Assessment
and Review Instrument (JBI-MAStARI). The JBI-MAStARI
tools offer a list of criteria and reviewers assess whether
each criterion was met (yes, no or unclear). The studies
were appraised for aspects such as randomisation/allo-
cation, blinding, measure methods, group comparison
and statistical analysis. The reviewer determined if the
study had met the criterion with a yes, no or unclear. To
be included in the review, a study had to meet at least
five out of ten criteria (‘yes’ by both reviewers) for
experimental studies or nine for case control, cohort
and descriptive studies. A third reviewer was used to
resolve any disagreements. The results of this assess-
ment can be viewed in Table 1; question numbers in the
table correspond with those on the published tool.
Specific details about the interventions, study popu-
lations, methods and outcomes of significance to the
review question and specific objectives were extracted
from articles using the standardised data extraction tool
from JBI-MAStARI.
Meta-analysisWhen possible, quantitative data from the studies were
pooled in statistical meta-analysis using RevMan 5
(Cochrane Collaboration). Some studies did not report/
provide standard deviations and/or 12 month mean
data25 and were excluded from the meta-analysis. For
ncluded studies
andomised controlled trials
Q1 Q2 Q3 Q4 Q5 Q6 Q7 Q8 Q9 Q10
Y N Y N U Y Y Y Y Y
Y U U Y U N Y Y Y Y
Y U U U U Y Y Y Y Y
N U N N U Y Y Y Y Y
U U U N Y Y Y Y Y Y
Y U U Y U Y Y Y Y Y
trol studies
Q1 Q2 Q3 Q4 Q5 Q6 Q7 Q8 Q9
U Y Y Y Y Y Y Y Y
CT; N, no the criterion was not met; N/A, not applicable; Q, question; U, it was
of Adelaide, Joanna Briggs Institute 43
nauthorized reproduction of this article is prohibited.

D Parker et al.
©2016 U
each forest plot, experimental condition was used to
denote the NMI group and control to denote the usual
care/GP intervention group. RevMan 5 (Cochrane Col-
laboration) was used to create forest plots of the meta-
analysis results. All quantitative data were entered twice.
Wherever appropriate, relative risks and/or odds ratios
and their associated 95% confidence interval were cal-
culated for analysis of categorical data. For continuous
data that had been collected using the same scale,
weighted mean differences and standard deviations
were calculated; for data collected using different scales,
standardised mean differences were calculated. Signifi-
cant heterogeneity was assumed at P< 0.1 using the chi-
square test for homogeneity. As the interventions were
complex and varied, heterogeneity was anticipated in
the meta-analysis, and a random effects meta-analysis
was utilised.
Four studies used a cluster design in which groups of
individuals are organised to receive either intervention
or control treatment rather than individuals being organ-
ised to receive either intervention or control treatment.
In all four included cluster studies, the GP clinic was the
unit of allocation. For the Blackberry et al.21 and Clever-
inga et al.26 studies, the research team randomised the
GP clinics to receive either intervention or control,
whereas the Meulepas et al.27 and Juul et al.25 studies
collected data from GP clinics that were providing inter-
vention or control treatment for their patients for non-
random reasons independent of the research study.
There are advantages to using a cluster designs, and it
is a valid approach; it is also acceptable to combine cRCTs
with RCTs in ameta-analysis,22 as long as the effect of the
intervention on a cluster design and individual design
are considered comparable,23 as they are in this case.
However, as participants within a cluster have a
tendency to be more alike than they are to participants
in other clusters, this design requires special treatment.
We adhered to recommendations to adjust data from
included cluster studies, when needed, to avoid unit-of-
Table 2. Assessment of bias in included cluster studi
Recruitedpatients beforeclusters random-
isedBaseline wabalanced
Blackberry et al.21 cRCT Y Y
Cleveringaet al. 200826
cRCT U Y
Meulepaset al.27
cCBA N Y
Juul et al.25 cOC N/A N/A
cCBA, cluster controlled before after; cOC, cluster observational cohort; cRCT, cluster R
44 International Journal of Evidence-Based
niversity of Adelaide, Joanna Briggs Institute. U
analysis errors;22 and to assess cluster studies for cluster-
specific bias,23 as shown in Table 2.
Blackberry et al.21 and Meulepas et al.27 each adjusted
for clustering errors in their analysis as well as reporting
raw data. Cleveringa et al.26 mention adjusting for clus-
tering in the power analysis; however, it was unclear if
they adjusted for clustering when calculating their
results. Blackberry et al.21 reported an intracluster cor-
relation coefficient (ICC) value, a measure of the amount
of clustering in a sample, for each outcome. Meulepas
et al.27 adjusted for clustering using a published ICC
(0.05) that was appropriate for use in studies where the
allocation unit is a GP clinic.24 We used this same
published ICC (0.05) to adjust the Cleveringa et al.26 data
for clustering or to adjust the raw dichotomous data
from Blackberry et al.21 or Meulepas et al.27 We adjusted
the data for clustering, using amethod recommended by
Cochrane, that for continuous variables involved using
the ICC to reduce the sample size resulting in the
calculation of effective sample size and for dichotomous
variables using the ICC to reduce both the number of
events and sample size.22 Juul et al.25 report that they
adjusted for clustering in the analysis of their data; they
had estimated differences in mean proportions by
binomial regressions with identity link, systematic
effect of type of practices and random difference
between practices.
ResultsThe updated search led to the inclusion of two more
articles, which brought our total yield to seven peer-
reviewed research articles that were methodically
assessed for inclusion (Fig. 1), resulting in seven final
articles that originated from Australia, the United States,
Canada, the Netherlands and Denmark. The main reason
for related studies to be excluded was that the nurse was
a diabetes educator, an advanced practice nurse or nurse
practitioner or that the nurse had an unclear or minor
contribution within a multidisciplinary intervention.
es
sData was col-lected from all
clusters
Analysisadjusted
for cluster-ing
Comparablewith individ-ual trials
Y Y Y
Y Y Y
N Y Y
N Y Y
CT.
Healthcare � 2016 University of Adelaide, Joanna Briggs Institute
nauthorized reproduction of this article is prohibited.

Records identified throughdatabase searching
(n = 804)
Records after duplicates removed(n = 805)
Records screened(n = 806)
Full-text articles assessedfor eligibility
(n = 49)
Studies included inquantitative synthesis
(meta-analysis)(n = 7)
Full-text articles excluded,with reasons
(n = 42)
Records excluded(n = 757)
Additional records identifiedthrough other sources
(n = 2)
Iden
tifi
cati
onS
cree
ning
Elig
ibili
tyIn
clud
ed
Figure 1. Study selection process.
SYSTEMATIC REVIEW
©2016 U
Individual reasons for exclusion are reported in the
source review.19
The interventionsNMIs were varied and included both individual and
group education for participants on lifestyle, medication
adjustment and treatment decisions based on algor-
ithms (Table 3). In Blackberry et al.21, this education
occurred over the telephone. In the Taylor et al. study,20
practice nurses titrated medications for diabetes, cho-
lesterol and hypertension following algorithms based on
national guidelines. Two studies used a computer
decision support system.26,27 Outcomes reported in
the seven reviewed studies included one or more of
the following: HbA1c, fasting blood glucose, lipids [total
cholesterol (TC), LDL], BMI, SBP or DBP (Table 3).
Main clinical outcomesGlycated haemoglobin A1cAll seven included studies assessed HbA1c. Meta-
analysis performed on the final mean HbA1c values of
four of these studies21,26–28 did not identify any
advantage to participants who had received the NMIs
International Journal of Evidence-Based Healthcare � 2016 University
niversity of Adelaide, Joanna Briggs Institute. U
as compared with standard GP care (Fig. 2). The results of
Taylor et al.29, which were not included in the meta-
analysis because the standard deviation data were not
reported, described an advantage to participants receiv-
ing the NMI at 4 months that approached significance
(P¼ 0.10). The cluster observational cohort study per-
formed by Juul et al.25 found comparable mean HbA1c
values when comparing practices with well-imple-
mented nurse-led diabetes consultations to practices
that did not have a nurse. The study of Taylor et al.20
was excluded from the meta-analysis as it was limited to
participants with long-standing diabetes, one or more
major medical comorbid conditions and an HbA1c
greater than 10% at baseline. However, they did observe
a significant decrease in HbA1c mean in the participants
receiving NMI as compared with controls at 1 year
(P¼ 0.01, effect size 0.37).20
Several studies assessed the number of participants
who reached an HbA1c target. Meta-analysis combining
data from two such studies, one using an HbA1c target of
less than 7%26 and the other a target of less than 7.5%,27
showed that NMIs did not impact the proportion
of participants that had reached the HbA1c target at
of Adelaide, Joanna Briggs Institute 45
nauthorized reproduction of this article is prohibited.

Table 3. Included studies
Studies Method/length Participants Interventions Usual care
Blackberry et al.21
Victoria,Australia
Cluster RCT;follow-up: 18months
Sites¼ 59 GP clinics; partici-pants had diabetes type 2attending a GP; interventionn¼ 236 control n¼ 237
Practice nurses fromintervention prac-tices received 2 daysof training in a tele-phone coachingprogramme, whichaimed to deliver 8telephone and oneface-to-face coachingepisodes per patient
Usual care by their GP,which may haveincluded referral to dia-betes educators, dieti-tians and diabetessocialists as part of thestandard diabetes careof that practice
Cleveringaet al.26 theNetherlands
Cluster RCT;follow-up: 1 year
Sites¼ 55 GP clinics participantshad diabetes type 2 attend-ing a GP; interventionn¼ 1699 control n¼ 1692
A 1 hr consultationwith nurse who useda computeriseddecision support sys-tem (CDSS) withdiagnostic and treat-ment algorithms anda recall system
Usual care was providedby the GP or a nurseunder direction of theGP
Gabbay et al.28
Hershey, Penn-sylvania, USA
RCT; follow-up: 1year
Sites¼ 2 GP clinics participantshad diabetes (95% had type2) attending a GP clinic; inter-vention n¼ 150 controln¼ 182
Nurse implementedalgorithms undersupervision of GP.Also included werebehavioural goal set-ting, individualisedcare plans, self-man-agement education,follow-up phonecalls and referrals
Usual care by their GP,which might includereferrals to other prac-titioners
Juul et al.25
DenmarkCluster observa-
tional cohortstudy; follow-up:cholesterol: 450days; HbA1c: 180days
Sites¼ 193 GP clinics; partici-pants had diabetes type 2attending a GP; n¼ 13 117
Practices with wellimplemented nurse-led type 2 diabetesconsultations
Practices with either nonurse employed or noimplemented nurse-ledconsultations
Taylor et al.20
USARCT; follow-up: 1
yearSites¼ 1 GP clinic; participants
had long-standing diabetes(type 2¼ 97% usual care,93% intervention) with oneor more major medicalcomorbid conditions and anHbA1c greater than 10% atbaseline attending a GP;intervention n¼ 61 controln¼ 66
Individual consultationwith nurse to reviewmedical, lifestyle andpsychosocial statusand develop self-management plan.Group classes eachweek for 4 weeksusing a workbookand discussion for-mat. Telephone fol-low-up to reviewpatient goals, medi-cation use, symp-toms, glucosemonitoring, BPmonitoring and self-management activi-ties. Nurses followedalgorithms based onnational guidelinesto titrate medi-cations for diabetes,cholesterol and hy-pertension
Usual care with GP includ-ing diabetes pamphlets,Medic Alert pamphletand instructions tomaintain contact withGP and attend generaldiabetes classes at alocal medical centre.Participants told after 1year they would receivea workbook and meetwith nurse care man-ager or attend a group
D Parker et al.
46 International Journal of Evidence-Based Healthcare � 2016 University of Adelaide, Joanna Briggs Institute
©2016 University of Adelaide, Joanna Briggs Institute. Unauthorized reproduction of this article is prohibited.

Table 3. (Continued)
Studies Method/length Participants Interventions Usual care
Taylor et al.29
CanadaRCT; follow-up: 4
monthsSites¼ 1 GP clinic participants
had type 2 diabetes attend-ing a GP; intervention n¼ 20control n¼ 19
Four or five visits bynurse at home, 1visit from a dietician(nurse present) and1 visit from exercisephysiologist. Initialvisit including assess-ment of knowledgeand education pro-vided based on thisassessment. Focus ofsubsequent meetingswas self-manage-ment. Case confer-ences with usualphysician for medi-cation adjustmentand advice
Usual care by GP,included one quarterlyscheduled visit
Meulepas et al.27
the NetherlandsCluster controlled
before-afterstudy/1 year
GP clinics¼ 51; patients withtype 2 diabetes attending aprimary care clinic; interven-tion n¼ 431 control n¼ 469
Nurse provided infor-mation on lifestylemanagement for riskfactors and adjustedmedication at quar-terly visits. Also usedthe diabetes supportservice (DSS), apatient recall regis-ter. The before meandata were compar-able for HbA1c(intervention, 7.3; SD1.2 and control, 7.2;SD 1.1); for SBP(intervention, 149;SD 22.9 and control,150; SD 23.3); forDBP (intervention,84;SD 12.1 and con-trol, 84; SD 12.5); fortotal cholesterol(intervention, 5.0; SD1.0 and control, 5.1;SD 0.9). The inter-vention and controlgroups each had82% smokers, amean BMI of 29 kg/m2, a mean HDLratio of 4.3 and com-parable mean trigly-cerides (intervention,1.8; SD 1.2 and con-trol, 1.9; SD 1.2)
Care by GP and DSS
cCBA, cluster controlled before after; cOC, cluster observational cohort; cRCT, cluster RCT; GP, general practice; HbA1c, glycated haemoglobin.
SYSTEMATIC REVIEW
©2016 U
12 months (P¼ 0.19). At the commencement of the
Taylor et al.20 study, 43% of participants in the NMI
group had reached an HbA1c target of less than 7.5
as compared with just 25% in the control group; this
difference was significant (P< 0.03). When assessing the
International Journal of Evidence-Based Healthcare � 2016 University of Adelaide, Joanna Briggs Institute 47
niversity of Adelaide, Joanna Briggs Institute. Unauthorized reproduction of this article is pr
reduction of participants with high HbA1c, the Meulepas
et al.27 study found that the NMI group had a significant
improvement in reducing the proportion of participants
with high HbA1c (�8.5%) over the standard care group
(OR of 0.5; 95% CI 0.3 to 0.9). In their cluster observational
ohibited.

HbA1c, mean
SBP Mean
DBP Mean
Total Cholesterol Mean
Study or Subgroup
Blackberry 2013
Cleveringa 2008
Gabbay 2006
Meulepas 2008
Total (95% CI)
Heterogeneity: Tau2 = 4.27; Chi2 = 7.25, df = 3 (P = 0.06); I2 = 59%
Test for overall effect: Z = 3.24 (P = 0.001)
Mean
133
143
129
153
SD
14
20
18
22.5
Total
189
421
150
233
993
Mean
136
147
138
155
SD
16
20.8
19
24.3
Total
186
419
182
253
1040
Weight
27.6%
29.5%
21.9%
21.0%
100.0%
IV, Random, 95% CI
-3.00 [-6.04, 0.04]
-4.00 [-6.76, -1.24]
-9.00 [-12.99, -5.01]
-2.00 [-6.16, 2.16]
-4.40 [-7.06, -1.74]
Experimental Control Mean Difference Mean Difference
IV, Random, 95% CI
-100 -50 0 50 100
Favours [experimental] Favours [control]
Study or Subgroup
Blackberry 2013
Cleveringa 2008
Gabbay 2006
Meulepas 2008
Total (95% CI)
Heterogeneity: Tau2 = 3.23; Chi2 = 13.58, df = 3 (P = 0.004); I2 = 78%
Test for overall effect: Z = 2.90 (P = 0.004)
Mean
76
80
72
83
SD
9
11
9
11.1
Total
188
421
150
233
992
Mean
77
82
78
86
SD
11
10.6
10
12.1
Total
186
419
182
253
1040
Weight
24.2%
27.6%
24.2%
24.1%
100.0%
IV, Random, 95% CI
-1.00 [-3.04, 1.04]
-2.00 [-3.46, -0.54]
-6.00 [-8.05, -3.95]
-3.00 [-5.06, -0.94]
-2.96 [-4.97, -0.96]
Experimental Control Mean Difference Mean Difference
IV, Random, 95% CI
-100 -50 0 50 100
Favours [experimental] Favours [control]
Study or Subgroup
Blackberry 2013
Cleveringa 2008
Meulepas 2008
Total (95% CI)
Heterogeneity: Tau2 = 0.00; Chi2 = 1.29, df = 2 (P = 0.52); I2 = 0%
Test for overall effect: Z = 2.98 (P = 0.003)
Mean
4.2
4.6
4.7
SD
0.95
0.9
0.9
Total
200
421
233
854
Mean
4.28
4.8
4.8
SD
1.05
1.1
1.1
Total
200
419
253
872
Weight
23.3%
48.5%
28.2%
100.0%
IV, Random, 95% CI
-0.08 [-0.28, 0.12]
-0.20 [-0.34, -0.06]
-0.10 [-0.28, 0.08]
-0.14 [-0.24, -0.05]
Experimental Control Mean Difference Mean Difference
IV, Random, 95% CI
-2 -1 0 1 2
Favours [experimental] Favours [control]
Study or Subgroup
Blackberry 2013
Cleveringa 2008
Gabbay 2006
Meulepas 2008
Total (95% CI)
Heterogeneity: Tau2 = 0.00; Chi2 = 3.21, df = 3 (P = 0.36); I2 = 7%
Test for overall effect: Z = 1.17 (P = 0.24)
Mean
7.85
6.9
7.45
7.1
SD
1.24
1.1
1.4
0.9
Total
221
421
150
233
1025
Mean
7.91
6.9
7.4
7.3
SD
1.42
1
1.8
1.2
Total
219
419
182
253
1073
Weight
16.6%
46.3%
8.9%
28.2%
100.0%
IV, Random, 95% CI
-0.06 [-0.31, 0.19]
0.00 [-0.14, 0.14]
0.05 [-0.29, 0.39]
-0.20 [-0.39, -0.01]
-0.06 [-0.17, 0.04]
Experimental Control Mean Difference Mean Difference
IV, Random, 95% CI
-2 -1 0 1 2Favours [experimental] Favours [control]
(a)
(b)
(c)
(d)
Figure 2. When compared to usual care, nurse-led interventions did not improve HbA1c but were more effective at 1 year inreducing mean SBP, DBP and total cholesterol.
D Parker et al.
48 International Journal of Evidence-Based Healthcare � 2016 University of Adelaide, Joanna Briggs Institute
©2016 University of Adelaide, Joanna Briggs Institute. Unauthorized reproduction of this article is prohibited.

SYSTEMATIC REVIEW
©2016 U
cohort study, Juul et al.25 found that compared with
practices with no nurses, the mean proportion of
patients with an HbA1c at least 8.0% for practices with
a nurse employed was lower; this held true both in
practices where nurse consultations for diabetes patients
were well implemented (3.7% reduction in HbA1c; 95%
CI �6.7 to �0.6) and in practices where there were
nurses but no organised nurse consultations (3.2%
reduction; 95% CI �7.5; 1.0), but this result was compli-
cated by the fact that statistically more patients in the
nurse-employed group had undergone HbA1c testing.
Systolic blood pressureSix of the included studies assessed participant SBP. The
data of four studies that had reported mean SBP data on
a total of 4983 participants21,26–28 were combined in
meta-analysis and a modest, significant decrease in final
mean SBP was identified in the NMI group as compared
with the GP standard care group [MD¼�4.40 (95% CI
�7.06, �1.74), Z¼ 3.24, P¼ 0.001] (Fig. 2). Taylor et al.29
found nomean SBP difference between intervention and
control at 4 months (P¼ 0.17). Taylor et al.20, who looked
at the effect of NMIs on participants with poor HbA1c
control at baseline, reported deterioration of SBP in both
groups with the intervention group deteriorating less
than GP standard care at 1 year (effect size of 0.28). The
data of two studies that assessed the portion of partici-
pants meeting an SBP target of 140 or 150mmHg26,27
were combined for meta-analysis; resulting in an insig-
nificant result of OR¼ 0.75 (95% CI 0.51, 1.09), P¼ 0.13.
Taylor et al.20 observed that more participants in the NMI
group, as compared with the standard care group, had
met a SBP target of 130mmHg or less, yielding a P value
approaching significance (P¼ 0.06).
Diastolic blood pressureSix studies assessed participant DBP with most reporting
a modest advantage to participants that had received an
NMI. The mean DBP data of four studies and a total of
4982 participants21,26–28 were combined in meta-
analysis, and a significant decrease in mean DBP in
the NMI group as compared with usual GP care was
observed [MD¼�2.96 (95% CI –4.97, –0.96), Z¼ 2.90,
P¼ 0.004] (Fig. 2). Taylor et al.29 also reported a signifi-
cantly greater reduction of mean DBP at 4 months in the
NMI group as compared with controls (P¼ 0.04). When
studying the effect of NMIs on participants with poorly
controlled HbA1c at baseline, Taylor et al.20 found no
advantage to being allocated to the NMI for either mean
DBP or the proportion reaching a DBP target of
85mmHg or less. Meulepas et al.27, in contrast, observed
that a significantly, slightly larger portion of participants
International Journal of Evidence-Based Healthcare � 2016 University
niversity of Adelaide, Joanna Briggs Institute. U
achieved a DBP target of less than 85mmHg in the NMI
group than the control group, OR of 1.4 (1.0–2.1).
Total cholesterolTC was assessed in all of the included studies with the
exception of the Gabbay study.28 Meta-analysis was
performed combining the data of 4676 participants from
three studies,21,26,27 and a statistically significant, modest
improvement in mean TC was observed in participants
receiving NMIs as compared with those receiving stand-
ard care [MD¼�0.14 (95% CI �0.24, �0.05), Z¼ 2.98,
P� 0.003] (Fig. 2). Taylor et al.29 did not observe a
difference between intervention and control at 4 months
for mean TC (P¼ 0.97). When studying participants with
poor HbA1c control at baseline, however, Taylor et al.20
observed a significantly greater improvement of mean
TC amongst participants allocated to NMIs as compared
with those in the control group (P¼ 0.01, effect size of
0.18). The Juul et al.25 cluster observational cohort study
did not find a difference in the mean TC values of
participants originating from practices with well-imple-
mented nurse-led diabetes consultations as compared
with practices that either did not employ a nurse or
employed a nurse but did not have organised nurse
consultations for diabetes patients.
Four studies reported on the portion of participants
who met a TC target at the commencement of the
study.20,26,21,25 A meta-analysis was performed combin-
ing the data of two studies26,21 and 4276 participants
that measured the participants’ ability to meet a TC
target of 4.5mmol/l or less,26 or less than 5mmol/l27
(Fig. 2). The proportion of participants that reached the
target at 12 months amongst those receiving NMIs were
not significantly larger than those who had received
standard care OR¼ 0.87 [(95% CI 0.70, 1.09) Z¼ 1.21,
P¼ 0.22]. Taylor et al.20 found no significant difference
between NMI and standard GP care in participants with
poor HbA1c control at baseline using a TC goal of less
than 5.17mmol/l. Likewise, the Juul et al.25 cluster obser-
vational cohort study did not find a significant difference
comparing practices with or without a well-implemented
nurse plan in regards to participants reaching a TC goal
of at least 5mmol/l.
Low density lipoproteinFive of the included studies assessed the effect of NMIs
on LDL. One RCT24 and two cRCTs21,26,28 that had
reported the mean final LDL cholesterol levels of 4123
participants were suitable for meta-analysis (Fig. 2).
When combined, LDL cholesterol levels in the interven-
tion group were comparable to those of controls
[MD¼�0.07 (95% CI �0.16, 0.02), Z¼ 1.55, P¼ 0.12]
of Adelaide, Joanna Briggs Institute 49
nauthorized reproduction of this article is prohibited.

D Parker et al.
©2016 U
(Fig. 2). Taylor et al.29 did not observe a difference
between intervention and control in mean LDL at 4
months (P¼ 0.98). The study by Taylor et al.20, looking
at patients with poor HbA1c control at baseline,
observed a significantly greater improvement in mean
LDL (P¼ 0.02, effect size 0.330) amongst those receiving
NMIs as compared with controls but no difference was
observed between NMI and control groups, when
measuring the proportion of participants reaching a
target LDL.
HDL cholesterol, triglycerides, fasting bloodglucose, BMI, weight, smokersNo advantage was observed for the participants receiv-
ing NMIs over GP standard care for the following out-
comes: BMI, HDL cholesterol, smoking, triglycerides,
mean weight. Meta-analysis was performed, when
possible, which resulted in nonsignificant outcomes
(Table 4). Taylor et al.20 found no significant difference
between NMI and standard GP care in participants with
poor HbA1c control at baseline with regards to HDL
cholesterol, LDL cholesterol, triglycerides or BMI. For
fasting blood glucose, however, there was greater
improvement in the NMI group than in the standard
care group that approached significance (P¼ 0.07).20
Combined outcomeOf note, the study by Cleveringa et al.26 calculated the
mean 10-year-UKPDS coronary heart disease (CHD) risk
(%) of participants in NMI and control groups and found
that those who had received NMIs had significantly
slightly less CHD risk; OR of 1.4, 95% CI (0.3–2.6)
P� 0.05. The following participant data had been used
to calculate this odds ratio: date of onset, age, duration of
diabetes, sex, ethinicity, smoking, A1C, SBP, TC and HDL
cholesterol. Cleveringa also measured the proportion of
participants in control and NMI groups that met four
treatment targets (A1C, systolic, TC and LDL cholesterol
targets) yielding a result which significantly favoured the
Table 4. Medical outcomes that did not improve wit
Outcome Studies
Mean LDL cholesterol Blackberry et al.21; Cleveringa et
Mean triglycerides Blackberry et al.21; Meulepas et a
Mean weight Blackberry et al.21; Gabbay et al.2
BMI target Blackberry et al.21; Meulepas et a
HbA1c target Cleveringa et al.26; Meulepas et a
SBP target Cleveringa et al.26; Meulepas et a
Smoking target Blackberry et al.21; Meulepas et a
Total cholesterol target Cleveringa et al.26; Meulepas et a
Smoking target Blackberry et al.21; Meulepas et a
HbA1c, glycated haemoglobin.
50 International Journal of Evidence-Based
niversity of Adelaide, Joanna Briggs Institute. U
NMI group with an OR of 1.6 (95% CI, 1.3–2.1).26 It is
unclear if the authors accounted for the effect of cluster-
ing in these analyses.
DiscussionMeta-analysis identified modest, significant improve-
ments amongst participants in NMIs in the following
clinical outcomes: mean SBP, DBP and TC. When looking
specifically at participants with poor control, two studies
reported improvements in mean HbA1c that were sub-
stantial.20,27 Meta-analysis performed on the majority of
outcomes showed no difference between control and
NMI groups, namely, mean HbA1c, mean triglycerides,
mean weight, mean HDL cholesterol, mean LDL choles-
terol, or the proportion of participants reaching a goal/
target for HbA1c, SBP, DBP, TC, BMI or smoking.
HbA1cThe clinical outcome HbA1c is of particular importance
because of the strong, well-documented correlation
between HbA1c and type 2 diabetes complications.30
The HbA1c analysis, however, did not show a significant
advantage for participants who had received NMIs.
Cleveringa et al.26 rationalised that their negative HbA1c
result had occurred ‘because mean A1C at baseline was
almost at the treatment target, there was little room for
improvement’. The mean HbA1c target for Cleveringa
was 7% and participants’ HbA1c at baseline was certainly
nearly at this target (intervention 7.1%, control 7.0%).26
In contrast, the Taylor et al.20 study, by design,
involved participants with poor HbA1c control at base-
line (intervention mean HbA1c, 9.5%; control mean
HbA1c, 9.5%), and significant results were achieved. In
the study’s conclusion, a significant difference was
observed when comparing the 1.14 mean reduction in
mean HbA1c of the intervention group to the 0.35 mean
reduction of those receiving standard care.20 For the
cluster, controlled, before–after nonrandomised study
by Meulepas et al.27, the authors found that ‘the patient-
h NMIs
Z Value P Value
al.26; Meulepas et al.27 1.55 0.12
l.27 1.46 0.148 0.02 0.98
l.27 1.12 0.26
l.27 1.32 0.19
l.27 1.51 0.13
l.27 1.39 0.22
l.27 1.21 0.16
l.27 1.39 0.98
Healthcare � 2016 University of Adelaide, Joanna Briggs Institute
nauthorized reproduction of this article is prohibited.

SYSTEMATIC REVIEW
©2016 U
oriented interventions seem to especially have an
effect on poorly controlled patients’. Subanalysis of
participants exhibiting poor control at baseline (an
HbA1c greater than 8.5%), in this study, revealed that
in the study’s conclusion at 1 year, the number of
participants with an HbA1c greater than 8.5% had halved
from 13 to 6 in the intervention group, a significant
difference to the reduction observed in the control
group (16 to 14).27
LimitationsThere were notable limitations to the review. Our meta-
analysis combined studies with a mixture of interven-
tion designs, which affected the outcome. The Taylor
et al.20 study had a small sample size (intervention
n¼ 61, control n¼ 66), and the study by Taylor et al.29
was hampered by both a very small sample size (inter-
vention, n¼ 20; control, n¼ 19) as well as a very short
intervention period (4 months). The authors of Taylor
et al.29 acknowledged that, in all likeliness, their study
had lacked the power to reach significance. Two weak-
nesses of the Meulepas et al.27 study need to be con-
sidered.27 Because of funding constraints, not all
practices could start the intervention treatment at the
same time; the first cohort formed the intervention
group, and the practices on the waiting list formed
the control group.27 This nonrandom allocation of
participants is very likely to introduce bias. In addition,
all participating practices of the Meulepas et al.27 study
had already participated in Phase 1 of the study in which
participants in the intervention arm received 12months
of logistic call support given the name, the diabetes
support service (DSS).27 Phase 2 incorporated an NMI in
half of the practices and used DSS in both intervention
and control, leaving the influence of the NMI in isolation
unclear.27 In Phase 1, DSS had not significantly improved
HbA1c control over standard care whereas in Phase 2,
significant improvements were observed with DSS
together with NMI compared with DSS alone.27 It is
recommended that controlled before–after studies
should only be included in a systematic review if they
have at least two intervention sites and two control sites,
the timing period for the control and intervention
groups were the same, and the intervention and control
groups were comparable on key characteristics;23 the
Meulepas et al.27 study meets all of these criteria. We
performed a sensitivity analysis that involved running
the meta-analyses without the Meulepas et al.27 data.
The results of running the meta-analyses without the
Meulepas et al.27 data did not differ in any substantial
way to the meta-analyses that had included the
Meulepas et al.27 data (data not shown).
International Journal of Evidence-Based Healthcare � 2016 University
niversity of Adelaide, Joanna Briggs Institute. U
Nurse management correlates with moremanagementTwo studies reported on several management outcomes
of interest. The practice nurse of the Gabbay et al.28 study
was given authority to refer participants receiving the
intervention to a dietician and/or a diabetes educator.
Compared with the GP, significantly more referrals were
made by the nurse who referred 70% of participants in
the NMI group to a certified diabetes educator and 53%
to a dietician; during this same time, the GP had referred
3% to a certified diabetes educator and 3% to a dieti-
cian.28 Gabbay et al.28 also found that participants who
had received NMIs had experienced significantly better
process measures/screening for the following: ophthal-
mological exam, foot exam, microalbuminuria screening,
pneumonia vaccination, dietician visit, diabetes nurse
educator visit and smoking cessation counselling. In the
cluster observational cohort study by Juul et al.25, partici-
pants in general practices with well-implemented nurse-
led type 2 diabetes consultations were more likely (mean
difference of 6%, 95% CI 1.5–11.4) to have had their
HbA1c measured during the 180 days of observation
than participants from practices that did not have a
nurse employed.
ConclusionAs practice nurses are often afforded more time in their
consultations, they may be suitable to collaborate in the
care of diabetes patients, especially in remote areas of
Australia where there are shortages of GPs and diabetes
specialists required for treatment and management of
diabetes.2 A review of the literature and subsequent
meta-analysis indicates that practice nurses employed
in a GP, participating in the management of adults with
diabetes type 2, yielded only modest improvements in a
minority of clinical outcomes. In an RCT specifically for
diabetes patients with poor control at baseline, however,
Taylor et al.20 observed significantly more robust
reduction of mean HbA1c, SBP and DBP with an inter-
vention that allowed nurses to titrate diabetes medi-
cations. Also of note, Gabbay et al.28 identified a
correlation between nurse management and signifi-
cantly improved diabetes-related screening such as
increased foot exams. Well-designed RCTs are needed,
which measure practice nurse management of diabetes
type 2 patients with poor control on clinical outcomes
that include HbA1c, SBP, DBP, TC as well as outcomes
related to screenings, such as foot ulcers.
AcknowledgementsMr. Ridhwan Shams was supported by a University of
Queensland Summer Research Scholarship.
of Adelaide, Joanna Briggs Institute 51
nauthorized reproduction of this article is prohibited.

D Parker et al.
©2016 U
Conflicts of interestThere are no conflicts of interest.
References1. National Health Priority Action, Council. National service
improvement framework for diabetes. Canberra: Australian
Government Department of Health and Ageing; 2006.
2. Alliance NRH. Diabetes in rural Australia: fact sheet 21
Canberra: Diabetes Australia; 2011.
3. Diabetes Australia. Diabetes Australia’s plan for a better life
for people with diabetes. Canberra: Diabetes Australia; 2004.4. Australian Institute of Health and Welfare. Australia’s health
2014. Canberra: Australian Institute of Health and Welfare;
2014; 141-143.
5. Australian Institute of Health and Welfare. Diabetes expen-
diture in Australia 2008–09. Canberra: Australian Institute
of Health and Welfare; 2013.
6. NSW Chronic Care Program. Strengthening general prac-
titioner involvement in chronic care: review and recom-
mendations Sydney: NSW Department of Health; 2005.
7. Oldroyd J, Proudfoot J, Infante FA, et al. Providing health-
care for people with chronic illness: the views of Australian
GPs. Med J Aust 2003; 179: 30–3.
8. Wagner EH. Chronic disease management: what will it take
to improve care for chronic illness? Eff Clin Pract 1998; 1:
2–4.
9. Laurant M, Reeves D, Hermens R, Braspenning J, Grol R,
Sibbald B. Substitution of doctors by nurses in primary care.
Cochrane Database Syst Rev 2005; 2: CD001271.
10. Zwar N, Harris M, Griffiths R, et al. A systematic review of
chronic disease management. Sydney: Research Centre for
Primary Healthcare and Equity, School of Public Health and
Community Medicine, UNSW; 2006.
11. Alliance AML. 2012 General practice nurse National Survey
Report.Australian Medicare Local Alliance; 2012.
12. Jolly R. Practice nursing in Australia. Report No.: 10, 2007–
08.Parliament of Australia, Department of Parliamentary
Services; 2007.
13. Davidson MB. Effect of nurse-directed diabetes care in a
minority population. Diabetes Care 2003; 26: 2281–7.
14. Harris DI, Cracknell P. Improving diabetes care in general
practice using a nurse-led, GP supported clinic: a cohort
study. Pract Diabetes Int 2005; 22: 295–301.
15. Vrijhoef HJM, Diederiks JPM, Spreeuwenberg C, Wolffen-
buttel BHR. Substitution model with central role for nurse
specialist is justified in the care for stable type 2 diabetic
outpatients. J Adv Nurs 2001; 36: 546–55.
16. Woodward A, Wallymahmed M, Wilding J, Gill G. Improved
glycaemic control an unintended benefit of a nurse-led
cardiovascular risk reduction clinic. Diabetic Med 2005; 22:
1272–4.
17. Woodward V. Commentary on Halcomb E.J., Patterson E. &
Davidson P.M. (2006) Evolution of practice nursing in
Australia. Journal of Advanced Nursing 55(3), 376–390.
J Adv Nurs 2006; 55: 388–90.
52 International Journal of Evidence-Based
niversity of Adelaide, Joanna Briggs Institute. U
18. Renders CM, Valk GD, Griffin SJ, Wagner EH, van Eijk JT,
Assendelft WJJ. Interventions to improve the management
of diabetes in primary care, outpatient, and community
settings: a systematic review. Diabetes Care 2001; 24:
1821–33.
19. Parker D, Clifton K, Shams R, Young J. The effectiveness of
nurse-led care in general practice on clinical outcomes
in adults with type 2 diabetes. JBI Lib Syst Rev 2012; 10:
2514–58.
20. Taylor C, Miller N, Reilly K, et al. Evaluation of a nurse-
care management system to improve outcomes in
patients with complicated diabetes. Diabetes Care 2003;
26: 1058–63.
21. Blackberry ID, Furler JS, Best JD, et al. Effectiveness of
general practice based, practice nurse led telephone
coaching on glycaemic control of type 2 diabetes: The
Patient Engagement and Coaching for Health (PEACH)
pragmatic cluster randomised controlled trial. BMJ 2013;
347: f5272.
22. McKenzie J, Ryan R, Di Tanna GL. Cochrane Consumers and
Communication Review Group: Cluster randomised con-
trolled trials 2014; http://cccrg.cochrane.org (March 2014;
accessed May 2015).
23. Higgins JPT, Green SE (Eds): Cochrane handbook for system-
atic reviews of interventions. Version 5.1.0. The Cochrane
Collaboration; 2011. (Updated March 2011). www.cochrane-
handbook.org.
24. Campbell MK, Mollison J, Grimshaw JM. Cluster trials in
implementation research: estimation of intracluster corre-
lation coefficients and sample size. Stat Med 2001; 20:
391–9.
25. Juul L, Maindal HT, Frydenberg M, Kristensen JK, Sandbaek
A. Quality of type 2 diabetes management in general
practice is associated with involvement of general practice
nurses. Prim Care Diabetes 2012; 6: 221–8.
26. Cleveringa FGW, Gorter KJ, van den Donk M, Rutten GEHM.
Combined task delegation, computerized decision support,
and feedback improve cardiovascular risk for type 2 dia-
betic patients: a cluster randomized trial in primary care.
Diabetes Care 2008; 31: 2273–5.
27. Meulepas MA, Braspenning JCC, de Grauw WJ, Lucas AEM,
Wijkel D, Grol R. Patient-oriented intervention in addition to
centrally organised checkups improves diabetic patient
outcome in primary care. Qual Saf Healthcare 2008; 17:
324–8.
28. Gabbay RA, Lendel I, Saleem TM, et al. Nurse case manage-
ment improves blood pressure, emotional distress and
diabetes complication screening. Diabetes Res Clin Pract
2006; 71: 28–35.
29. Taylor KI, Oberle KM, Crutcher RA, Norton PG. Promoting
health in type 2 diabetes: nurse–physician collaboration in
primary care. Biol Res Nurs 2005; 6: 207–15.
30. Leal J, Gray AM, Clarke PM. Development of life-expectancy
tables for people with type 2 diabetes. Eur Heart J 2009; 30:
834–9.
Healthcare � 2016 University of Adelaide, Joanna Briggs Institute
nauthorized reproduction of this article is prohibited.


![MAKING IT HAPPEN: STUDENT NURSE AND PPG LINKS Kim Young Patient Involvement Lead Adult Nursing Field Lead (Feb Cohorts): BSc [Hons] Nursing Programme,](https://img.dokumen.tips/doc/110x75/56649ef65503460f94c0960c/making-it-happen-student-nurse-and-ppg-links-kim-young-patient-involvement.jpg)


