Embed Size (px)
Citation preview

(An Autonomous Institute under Rashtrasant TukadojiMaharaj Nagpur University, Nagpur)
Practical ManualSession: 2015-2016

(An Autonomous Institute under Rashtrasant Tukadoji Maharaj Nagpur University,Nagpur)
Practical Manual Index Page
ExperimentNo.
Aim Page No.
Group – I1 To find out type of alkalinity and estimate alkalinity present in
the given water sample.01
2 Estimation of temporary, permanent and total hardness presentin supplied hard water sample by complexometric method.
07
3 Estimation of copper present in an alloy by iodometry. 174 Estimation of Ferrous, Ferric and total iron content present in an
ore by Redox titrimetry.22
Group – II5 Determination of relative and kinematic viscosities of a given
lubricating oil at different temperatures using RedwoodViscometer No. 1 or No. 2.
26
6 Determination of flash point of a combustible liquid by Able’sclosed cup flash point apparatus.
35
7 Determination of flash point of a combustible liquid by Pensky-Martan’s closed cup flash point apparatus.
40
8 Determination of flash point of a combustible liquid byCleveland’s open cup flash point apparatus.
45

Applied Chemistry Practical Manual
Shri Ramdeobaba College of Engineering and Management, Nagpur Page 1
EXPERIMENT NO. 1
Aim: To find out type of alkalinity and estimate alkalinity presentin the given water sample.
Chemicals: Std. Na2CO3 solution, Unknown water sample A and C, HCl solution
(sample B) as an intermediate solution, phenolphthalein indicator and methyl
orange/red indicator.
Principle:
The alkalinity of a water sample is due to carbonates (CO32-), bicarbonates (HCO3-)
and hydroxide (OH-) ions. Thus in a given water sample the possible combination of
ions causing alkalinity are as follows.
(i) OH - alone
(ii) CO3 2 - alone
(iii) HCO3 - alone
(iv) OH- and CO32 – together
(v) CO32-and HCO3- together
The possibility of OH- and HCO3-ions together in the same solution is ruled out as
they react as-
HCO3 - + OH - CO3 2 -- + H2O
In the same way, possibility of co -existence of all the three OH- , CO32-and HCO3- is
ruled out.
The determination of alkalinity involves following reactions.
OH- + H+ H2 O ----------------(1)
CO3 2-+ H+ HCO3- ---------------- (2)
Applied Chemistry Practical Manual
Shri Ramdeobaba College of Engineering and Management, Nagpur Page 2
HCO3- + H+ H2CO3 H2O + CO2 ----------------(3)
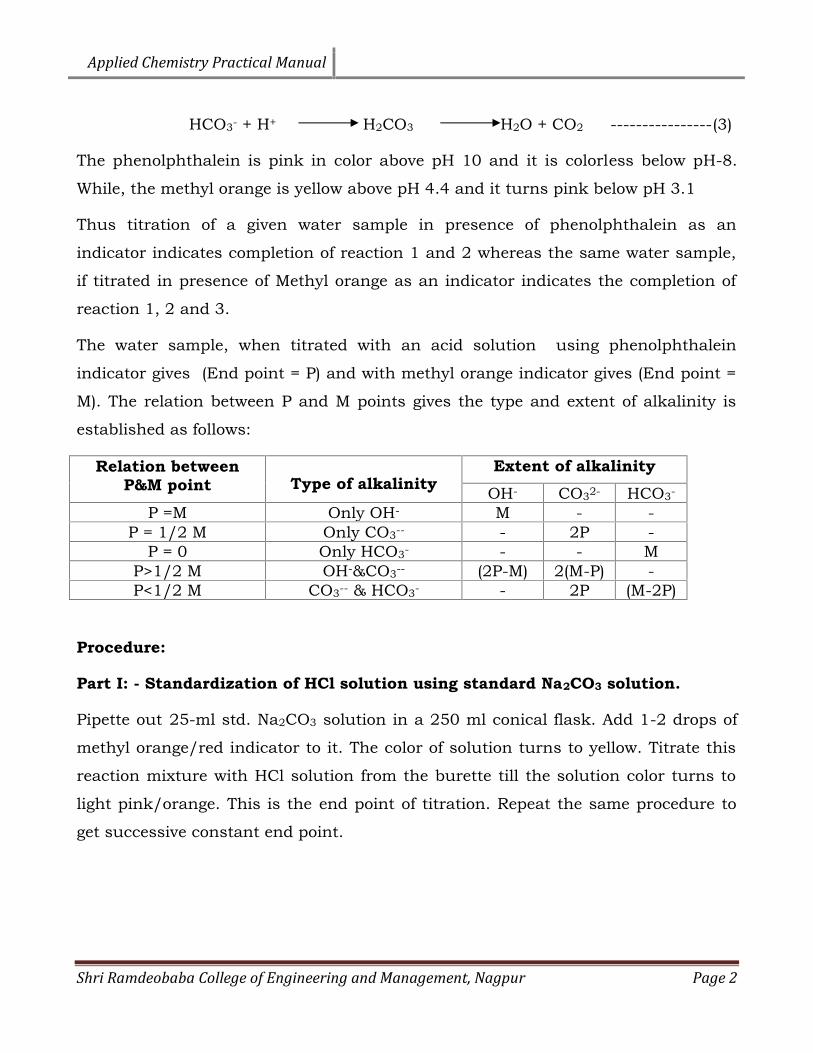
The phenolphthalein is pink in color above pH 10 and it is colorless below pH-8.
While, the methyl orange is yellow above pH 4.4 and it turns pink below pH 3.1
Thus titration of a given water sample in presence of phenolphthalein as an
indicator indicates completion of reaction 1 and 2 whereas the same water sample,
if titrated in presence of Methyl orange as an indicator indicates the completion of
reaction 1, 2 and 3.
The water sample, when titrated with an acid solution using phenolphthalein
indicator gives (End point = P) and with methyl orange indicator gives (End point =
M). The relation between P and M points gives the type and extent of alkalinity is
established as follows:
Relation betweenP&M point Type of alkalinity
Extent of alkalinityOH- CO32- HCO3-
P =M Only OH- M - -P = 1/2 M Only CO3-- - 2P -
P = 0 Only HCO3- - - MP>1/2 M OH-&CO3-- (2P-M) 2(M-P) -P<1/2 M CO3-- & HCO3- - 2P (M-2P)
Procedure:
Part I: - Standardization of HCl solution using standard Na2CO3 solution.
Pipette out 25-ml std. Na2CO3 solution in a 250 ml conical flask. Add 1-2 drops of
methyl orange/red indicator to it. The color of solution turns to yellow. Titrate this
reaction mixture with HCl solution from the burette till the solution color turns to
light pink/orange. This is the end point of titration. Repeat the same procedure to
get successive constant end point.

Applied Chemistry Practical Manual
Shri Ramdeobaba College of Engineering and Management, Nagpur Page 3
Part II:- Estimation of type and extent of alkalinity present in sample A.
Pipette out 25-ml water sample A in a 250 ml conical flask. Add 1-2 drops of
phenolphthalein as an indicator. The solution becomes pink. Titrate this solution
with acid solution from the burette. At the end point the pink color of the solution
changes to colorless. Note this end point as P point. Now At this point, add 2 drops
of methyl orange indicator to the same solution. Solution becomes yellow. Continue
the titration without refilling the burette the solution till the color of solution turns
to orange / pink. Note this end point as M point of the titration. Repeat the same
procedure to get successive constant readings of P and M point.
The relationship between P point and M point denotes the type and extent of
alkalinity present in the given water samples as shown in earlier table.
Part III:- Estimation of type and extent of alkalinity present in sample C.
Pipette out 25-ml water sample C in a 250 ml conical flask and follow the same
procedure as given in part II.
Observation table:
Part I: - Standardization of HCl solution using standard Na2CO3 solution.
Standard Na2CO3 solution Vs HCl solution
Control reading: to ml
S. NoVol. of Na2CO3
solution (V1 ml)
Volume of HCl
solution (ml)Constant
Reading (V2 ml).IBR FBR

Applied Chemistry Practical Manual
Shri Ramdeobaba College of Engineering and Management, Nagpur Page 4
Part II:- Estimation of type and extent of alkalinity present in sample A.
Given water sample A Vs HCl solution
Control reading: P point: to ml
M Point: : to ml
S. No.Vol. given water sample
A (V2 ml)
Volume of HCl solution (ml) End Point
(ml)IBR P point M point
P point=
M point=
Part II:- Estimation of type and extent of alkalinity present in sample C.
Given water sample C Vs HCl solution
Control reading: P point: to ml
M Point: : to ml
S. No.Vol. given water
sample C (V3 ml)
Volume of HCl solution (ml) End Point
(ml)IBR P point M point
P point=
M point=
Applied Chemistry Practical Manual
Shri Ramdeobaba College of Engineering and Management, Nagpur Page 5
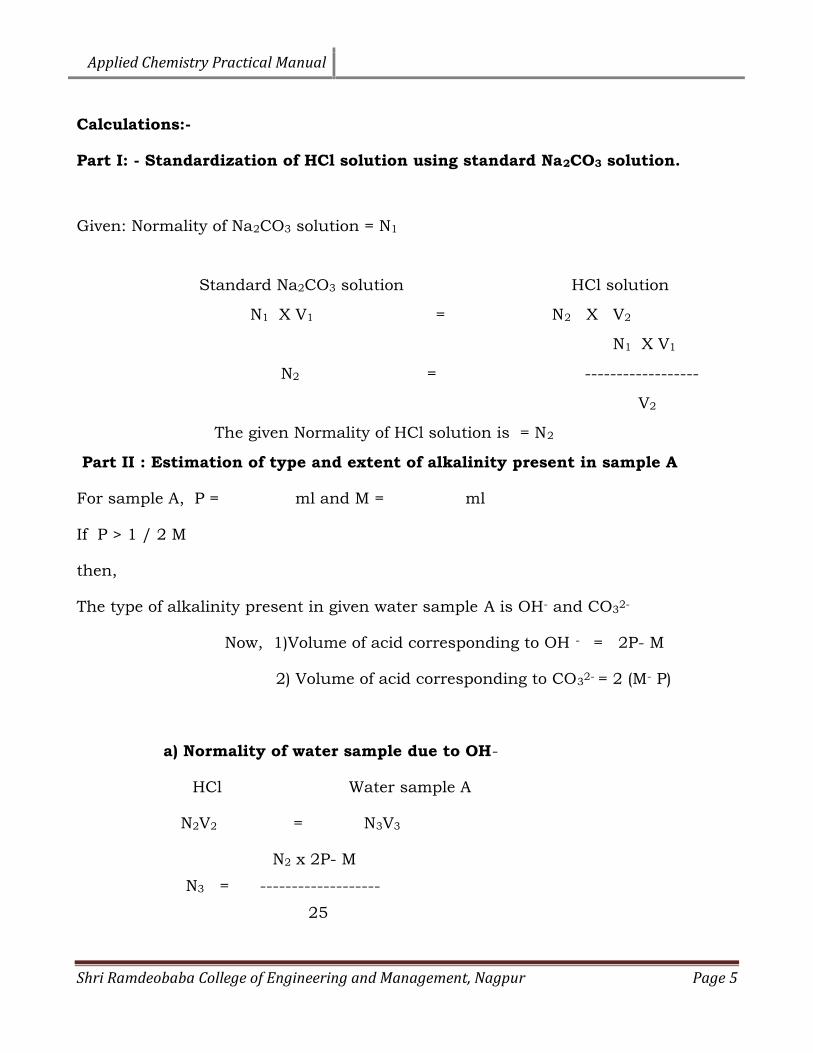
Calculations:-
Part I: - Standardization of HCl solution using standard Na2CO3 solution.
Given: Normality of Na2CO3 solution = N1
Standard Na2CO3 solution HCl solution
N1 X V1 = N2 X V2
N1 X V1
N2 = ------------------
V2
The given Normality of HCl solution is = N2
Part II : Estimation of type and extent of alkalinity present in sample A
For sample A, P = ml and M = ml
If P > 1 / 2 M
then,
The type of alkalinity present in given water sample A is OH- and CO32-
Now, 1)Volume of acid corresponding to OH - = 2P- M
2) Volume of acid corresponding to CO32- = 2 (M- P)
a) Normality of water sample due to OH-
HCl Water sample A
N2V2 = N3V3
N2 x 2P- M
N3 = -------------------
25

Applied Chemistry Practical Manual
Shri Ramdeobaba College of Engineering and Management, Nagpur Page 6
Wt/ lt for OH- = Normality x Eq. Wt.of CaCO3
= N3 x 50
= g/l
= x 1000 mg/l
= ppm
b) Normality of water sample due to CO3 2-.
HCl Water sample A
N2V2 = N4V4
N2 X 2 (M- P)
N4 = ------ --------------------
25
Wt./ lt for CO3 2-. = Normality x Eq.. Wt. of CaCO3
= N4 x 50 g/l
= x 1000 mg/l
= ppm
Same calculations has to be carried out for Water sample C
Result: -
The given water sample A contains:-
OH – Alkalinity = ------------ ppm CaCO3 equivalent.
CO3 2– Alkalinity = ------------- ppm CaCO3 equivalent.
Total Alkalinity = ------------- ppm CaCO3 equivalent.
The given water sample C contains:-
HCO3 – Alkalinity = ------------ ppm CaCO3 equivalent.
CO3 2– Alkalinity = ------------- ppm CaCO3 equivalent.
Total Alkalinity = ------------- ppm CaCO3 equivalent.

Applied Chemistry Practical Manual
Shri Ramdeobaba College of Engineering and Management, Nagpur Page 7
EXPERIMENT NO. 2Aim : Estimation of temporary, permanent and total hardnesspresent in supplied hard water sample by complexometric method.
Chemicals Required: Standard hard water (sample A), given water sample (Sample
C), ethylene diamine tetra-acetic acid solution as an Intermediate solution (Sample B),
Buffer solution (NH4Cl + NH4OH having pH = 10), Eriochrome Black-T indicator
solution.
Principle: Hard water contains the dissolved salts of calcium, magnesium and iron
ions which are called hardening ions. In low concentrations these ions are not
considered harmful for domestic use, but at higher concentrations of these ions
interfere with the cleansing action of soaps and accelerate the corrosion of steel
pipes, especially those carrying hot water.
Hardening ions, such as Ca2+ and Mg2+, form insoluble compounds with soaps.
Soaps, which are sodium salts of fatty acids such as sodium stearate, C17H35CO2Na,
are very effective cleansing agents so long as they remain soluble; the presence of
the hardening ions however causes the formation of a gray, insoluble soap scum
such as (C17H35CO2)2Ca.
Groundwater becomes hard as it flows through underground limestone (CaCO3)
deposits; generally, the water from deep wells has a higher hardness than that from
shallow wells because of a longer contact time with the limestone. Surface water
similarly accumulates hardening ions as a result of flowing over limestone deposits.
In either case the CO2 dissolved in rainwater solubilizes limestone deposits.

Applied Chemistry Practical Manual
Shri Ramdeobaba College of Engineering and Management, Nagpur Page 8
Hard water is also responsible for the appearance and undesirable formation of
"boiler scale". The boiler scale is a poor conductor of heat and thus reduces the
efficiency of transferring heat.
Complexometry involves the interaction of an organic compound with a complexable
metal ion and results in the formation of compounds known as Werner’s complexes.
The organic compound is an anion or a Lewi’s base and is known as Ligand. Several
factors, such as pH, basicity of ligand, type of ring formed etc. govern the successful
formation of a complex. Thus:
X L + M n + --------- (L) x M
Ligand Metal ion Complex
In this experiment a titration technique is used to measure the combined Ca2+ and
Mg2+ concentrations in a water sample. The titrant or the intermediate solution is
the disodium salt of ethylene diamine tetraacetic acid (abbreviated Na2H2Y or
EDTA). Its structure is as below:
NaOOC-H2C CH2-COOH
\ /
N-CH2-CH2-N
/ \
HOOC-H2C CH2COONa
Disodium salt of EDTA
In aqueous solution Na2H2Y dissociates into Na+ and H2Y-2 ions. The H2Y-2 ion
reacts with the hardening ions, Ca2+ and Mg2+, to form very stable complex ions,
especially in a solution buffered at a pH of about 10. As Ca2+ and Mg2+ is present in
the hard water and EDTA solution are adding from the burette, it complexes with
the "free" Ca2+ and Mg2+ of the water sample to form the respective complex ions:

Applied Chemistry Practical Manual
Shri Ramdeobaba College of Engineering and Management, Nagpur Page 9
From the balanced equations, once the molar concentration of the Na2H2Y solution
is known, the moles of hardening ions in a water sample can be calculated from a
1:1 stoichiometric ratio. Thus it is evident that 1 mole of the complex forming H2 Y2
- reacts in with one mole of the metal ion and, two moles of hydrogen ions are
generated. It is apparent from the equation above that the dissociation of the
complex will be governed by the pH of the solution. Lowering of the pH will decrease
the stability of the metal EDTA complex. Thus, pH should be maintained constant
by the addition of basic buffer in the reaction mixture.
The structure of EDTA-metal complex is as follows:
Calcium-EDTA Complex
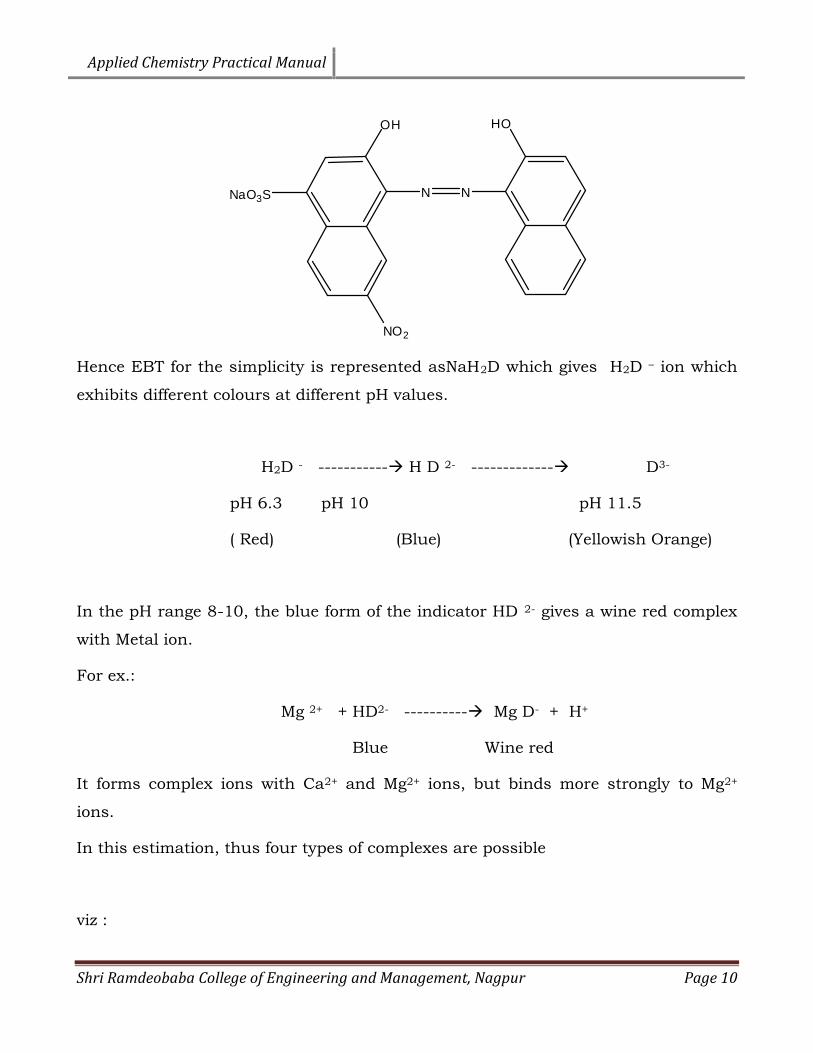
An indicator is used to detect the endpoint in the titration, Eriochrome Black T
(EBT). Eriochrome black-T is sodium 1 – (1-hydroxy, 2- napthyl azo ) 6-nitro – 2
napthol-4, sulphonate.
Applied Chemistry Practical Manual
Shri Ramdeobaba College of Engineering and Management, Nagpur Page 10
Hence EBT for the simplicity is represented asNaH2D which gives H2D – ion which
exhibits different colours at different pH values.
H2D - ----------- H D 2- ------------- D3-
pH 6.3 pH 10 pH 11.5
( Red) (Blue) (Yellowish Orange)
In the pH range 8-10, the blue form of the indicator HD 2- gives a wine red complex
with Metal ion.
For ex.:
Mg 2+ + HD2- ---------- Mg D- + H+
Blue Wine red
It forms complex ions with Ca2+ and Mg2+ ions, but binds more strongly to Mg2+
ions.
In this estimation, thus four types of complexes are possible
viz :
N N
OH HO
NaO3S
NO2
Applied Chemistry Practical Manual
Shri Ramdeobaba College of Engineering and Management, Nagpur Page 11
a) EBT – Mg2+ complex (Wine red)
b) EBT - Ca2+ complex (Wine red)
c) EDTA- Mg2+ complex (colourless)
d) EDTA- Ca2+ complex (colourless)
Their order of stability and consequently, their preference of formation are:
EDTA- Ca2+ > EDTA- Mg2+ > EBT – Mg2+ > EBT – Ca 2+
Because only a small amount of EBT is added, only a small quantity of Mg2+ is
complexed; no Ca2+ ion complexes to EBT — therefore, most of the hardening ions
remain "free" in solution. The EBT indicator is sky-blue in solution but forms a
wine-red complex ion, [Mg-EBT] 2+.
pH
EBT + Mg2+ -------- EBT-Mg2+ Complex
8-10 (Wine red colour obtained)
Before any EDTA solution is added for the analysis, the reaction mixture is wine-red
because of the [Mg-EBT]2+ complex ion. Once the EDTA complexes all of the "free"
Ca2+ and Mg2+ from the water sample, it then removes the trace amount of Mg2+
from the wine-red [Mg-EBT] 2+ complex ion. The solution changes from wine-red
back to the sky-blue color of the EBT indicator, and the endpoint is reached — all of
the hardening ions have been complexed with EDTA. The reaction is given as
follows:
pH
EDTA + Ca2+ -------- EDTA-Ca2+ complex (Colourless)
8-10
pH
EDTA + Mg2+ -------- EDTA- Mg2+ complex (Colourless)
8-10
Applied Chemistry Practical Manual
Shri Ramdeobaba College of Engineering and Management, Nagpur Page 12
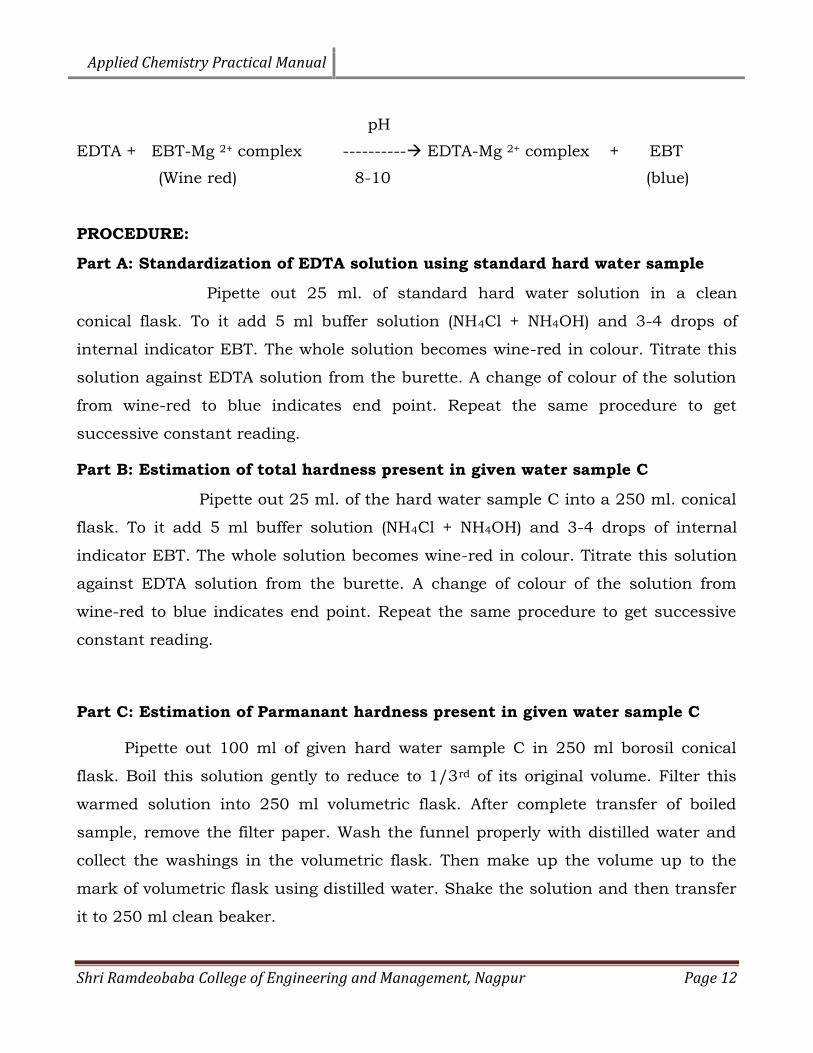
pH
EDTA + EBT-Mg 2+ complex ---------- EDTA-Mg 2+ complex + EBT
(Wine red) 8-10 (blue)
PROCEDURE:
Part A: Standardization of EDTA solution using standard hard water sample
Pipette out 25 ml. of standard hard water solution in a clean
conical flask. To it add 5 ml buffer solution (NH4Cl + NH4OH) and 3-4 drops of
internal indicator EBT. The whole solution becomes wine-red in colour. Titrate this
solution against EDTA solution from the burette. A change of colour of the solution
from wine-red to blue indicates end point. Repeat the same procedure to get
successive constant reading.
Part B: Estimation of total hardness present in given water sample C
Pipette out 25 ml. of the hard water sample C into a 250 ml. conical
flask. To it add 5 ml buffer solution (NH4Cl + NH4OH) and 3-4 drops of internal
indicator EBT. The whole solution becomes wine-red in colour. Titrate this solution
against EDTA solution from the burette. A change of colour of the solution from
wine-red to blue indicates end point. Repeat the same procedure to get successive
constant reading.
Part C: Estimation of Parmanant hardness present in given water sample C
Pipette out 100 ml of given hard water sample C in 250 ml borosil conical
flask. Boil this solution gently to reduce to 1/3rd of its original volume. Filter this
warmed solution into 250 ml volumetric flask. After complete transfer of boiled
sample, remove the filter paper. Wash the funnel properly with distilled water and
collect the washings in the volumetric flask. Then make up the volume up to the
mark of volumetric flask using distilled water. Shake the solution and then transfer
it to 250 ml clean beaker.

Applied Chemistry Practical Manual
Shri Ramdeobaba College of Engineering and Management, Nagpur Page 13
Now pipette out 25 ml of diluted hard water sample C and add 5 ml
buffer solution (NH4Cl + NH4OH) and 3-4 drops of internal indicator EBT to it.
Titrate this reaction mixture with EDTA solution from the burrete until the wine red
colour changes into blue. Repeat the same procedure to get successive constant
reading.
Observation Table:
Part 1: Standardization of EDTA solution using standard hard water sample
Standard Hard Water Sample Vs EDTA solution
Control reading: to ml
S. No.Vol. of std. Hard
water (V1 ml)
Volume of EDTA
solution (ml) Constant
Reading (V2 ml).IBR FBR

Applied Chemistry Practical Manual
Shri Ramdeobaba College of Engineering and Management, Nagpur Page 14
Part 2: Estimation of Total Hardness present in given water sample C.
Water Sample C Vs EDTA solution
Control reading: to ml
S. No.Vol. of given Hard water
sample C (V3 ml)
Volume of EDTA
solution (ml) Volume of EDTA
solutionIBR IBR
Part C: Estimation of Parmanant hardness present in given water sample C
Diluted Water Sample C Vs EDTA solution
Control reading: to ml
S.NoVol. of Diluted Hard
water sample C (V3 ml)
Volume of EDTA
solution (ml) Volume of EDTA
solutionIBR IBR
Applied Chemistry Practical Manual
Shri Ramdeobaba College of Engineering and Management, Nagpur Page 15
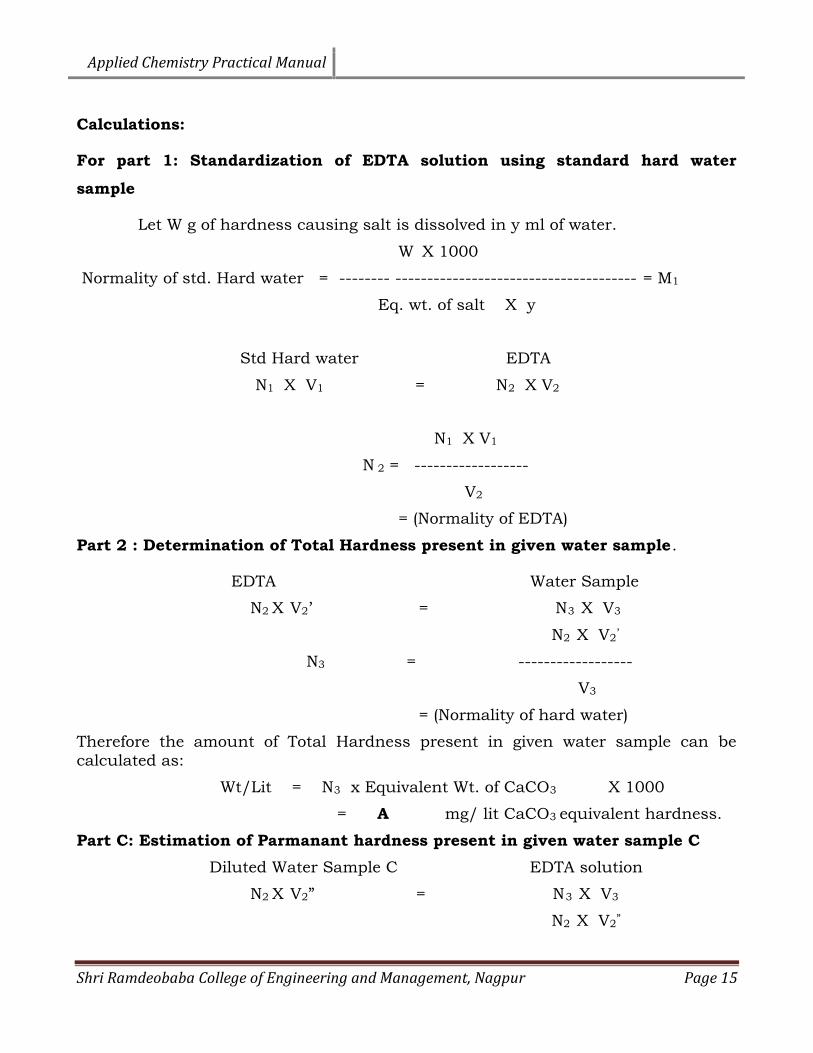
Calculations:
For part 1: Standardization of EDTA solution using standard hard watersample
Let W g of hardness causing salt is dissolved in y ml of water.
W X 1000
Normality of std. Hard water = -------- -------------------------------------- = M1
Eq. wt. of salt X y
Std Hard water EDTA
N1 X V1 = N2 X V2
N1 X V1
N 2 = ------------------
V2
= (Normality of EDTA)
Part 2 : Determination of Total Hardness present in given water sample.
EDTA Water Sample
N2 X V2’ = N3 X V3
N2 X V2’
N3 = ------------------
V3
= (Normality of hard water)
Therefore the amount of Total Hardness present in given water sample can becalculated as:
Wt/Lit = N3 x Equivalent Wt. of CaCO3 X 1000
= A mg/ lit CaCO3 equivalent hardness.
Part C: Estimation of Parmanant hardness present in given water sample CDiluted Water Sample C EDTA solution
N2 X V2” = N3 X V3
N2 X V2”

Applied Chemistry Practical Manual
Shri Ramdeobaba College of Engineering and Management, Nagpur Page 16
N3 = ------------------
V3
= (Normality of diluted hard water)
Therefore the amount of Permanent Hardness present in diluted water sample canbe calculated as:
Wt/Lit = N3 x Equivalent Wt. of CaCO3 X 1000
= B mg/ lit CaCO3 equivalent hardness.
This much amount of hardness is present in diluted water sample C.
But, 250 ml diluted water sample C is prepared from 100 ml water sample C i.e. 2.5
times diluted.
Hence, permanent hardness in water sample C = B X 2.5 mg/ lit CaCO3 equivalent
hardness.
Therefore, Temporary hardness present in given water sample C
= (A-B) mg/ lit CaCO3 equivalent hardness
Result: The amount of hardness present in given sample C is as follows:
Permanent Hardness = mg/ lit CaCO3 equivalent hardness
Temporary Hardness = mg/ lit CaCO3 equivalent hardness
Total Hardness = mg/ lit CaCO3 equivalent hardness

Applied Chemistry Practical Manual
Shri Ramdeobaba College of Engineering and Management, Nagpur Page 17
EXPERIMENT NO. 3
AIM: Estimation of copper present in an alloy by iodometry.
THEORY: -
The Iodometric method of volumetric analysis is based on oxidation -reduction
process (Redox) and involves interconversion of elemental Iodine into Iodide ions
and vice-versa as-
Iodometry
2 I --------------- ---------- I2 + 2e-
Iodimetry
There are two types of Iodometric titrations
a) Indirect Iodometric titrations (Iodometry) : It involves titration of liberated
iodine from potassium iodide (KI) in a chemical reaction.
b) Direct Iodometric titrations (Iodimetry) : It involves titration with Standard
solution of Iodine.
PRINCIPLE:-
In this Experiment, an oxidizing agent such as K2Cr2O7 or CuSO4 is
treated in acid solution (dil. H2SO4) with an excess of iodide ion produced by KI. The
oxidizing agent oxidizes the iodide ions into Iodine, which is then titrated with the
standardised solution of reducing agent such as sodium thiosulphate solution.
(Hypo)
PART A: Standardization of Sodium thiosulphate solution.
1) K2Cr2O7 + 6KI + 7H2SO4 3I2 + Cr2(SO4)3 + 4K2SO4 + 7H2O
In ionic form, the same reaction can be written as

Applied Chemistry Practical Manual
Shri Ramdeobaba College of Engineering and Management, Nagpur Page 18
Cr2O72- + 6I- + 14H+ 3I2 + 2Cr3+ + 7H2O
Thus the amount of Iodine liberated depends only upon the quantity of K2Cr2O7 act
as limiting reagent.
2) 2 Na 2S2O3 + I2 2Na I + Na 2 S4 O6
Sodium thiosulphate Sodium tetrathionate
In ionic form, the same reaction can be written as
2S2O32- + I2 2I- + S4O62-
PART B: Estimation of copper ions:
2CuSO4 + 4KI Cu2I2 + I2 +2 K2SO4
In ionic form, the same reaction can be written as
2Cu2+ + 4 I- 2CuI2 Cu2I2 + I2
The amount of iodine thus generated depends upon the concentration of Cu2+ ions
which can be estimated by titrating it against sodium thiosulphate solution using
starch as an indicator.
Since the solubility of Iodine in water is low, a considerable excess of KI must be
used in iodometric determination of oxidizing agent. The iodine liberated by the
reaction then dissolves by forming the complex K (I3)
KI + I2 K (I3) OR I-+ I2 (I3)-
Formation of this compound (I3)- does not interfere with in the titration of iodine
with Sodium thiosulphate because, as the free iodine reacts with thiosulphate, the
equilibrium between I2 and (I3)- is disturbed and more I2 is produced by the
backward reaction.
After addition of KI and /or acid the flask is kept in dark place for about 5 minutes
as rate of the reaction between oxidizing agent and I- is too low.. Secondly, light
accelerates side reaction of photo-oxidation as,

Applied Chemistry Practical Manual
Shri Ramdeobaba College of Engineering and Management, Nagpur Page 19
4I-+ 4H+ + O2 2I2 + 2H2O
Here, I- are oxidized to I2 by atmospheric oxygen and analytical results may go
wrong. It is for this purpose ,before adding KI to the acidic solution of the
oxidizing agent, a pinch of Na2CO3 is added so as to generate a CO2 atmosphere
which would prevent access of the O2 to the solution.
Indicator:
Most commonly used indicator in iodometric titration is STARCH. It forms deep
blue complex with iodine (but not with iodide). Starch is a polymer, consisting of
two components Amylose and Amylopectine. The active fraction amylose is a
polymer of the sugar α –D- glucose. It has a shape of coiled helix into which I2
combined with I- can fit, thus reacting slowly with thiosulphate. Due to this
reason the starch solution must be added at the very end of the titration (when
iodine conc. is very less).
Starch solution is not very stable solution because various microorganisms are
degrading it and one of the degradation products, glucose, is a reducing agent.
Thus an old starch solution containing some glucose can cause an appreciable
titration error. Hence always fresh starch solution is used.
PROCEDURE: -
Part A: -Standardization of sodium thiosulphate solution.
Pipette out 25ml. std. K2Cr2O7 solution in a conical flask. Add 10 ml.dil. sulphuric
acid, followed by a pinch of sodium bicarbonate /sodium carbonate and finally 10
ml KI (10%). Keep the flask covered for 5-6 minutes in dark. Appearance of dark
brown color indicates the formation of I2.
Now, titrate it against Na2S2O3 from burette until dark brown colour becomes faint
brown. At this stage, add 2 ml. starch solution, colour of the solution becomes

Applied Chemistry Practical Manual
Shri Ramdeobaba College of Engineering and Management, Nagpur Page 20
intense blue. Continue titration drop wise till blue color disappears. Note this point
as an end point.
Part B: -Estimation of Cu2+ ions.
Pipette out 25 ml. given CuSO4 solution in a conical flask. Add few
drops of dil. Na2CO3 solution until a faint permanent precipitate remains. Add acetic
acid solution dropwise till the solution becomes clear. Now add 10 ml. KI (10%).
Appearance of dark brown colour indicates formation of I2. Titrate the liberated
iodine with Na2S2O3 solution from burette till brown colour of iodine fades, then add
2ml. of starch solution, and continue the addition of the Na2S2O3 solution until the
blue color commences to fade. Then add about 5-6ml of ammonium thiocyanate
solution into the flask due to which blue color become more intense. Continue the
titration till blue color disappears (there is formation of flesh coloured ppt in the
flask). Note this point as an end point.
Calculations:-
Given Normality of std. K2Cr2O7 is N1
Part A: -Standardization of Sodium thiosulphate solution.(Hypo.)
Std. K2Cr2O7 v/s Hypo
N1V1 = N2V2
N1x 25 = N2 X V2
N1x 25
N2 = -----------------
V2
N2 = X (Normality of hypo solution)
Applied Chemistry Practical Manual
Shri Ramdeobaba College of Engineering and Management, Nagpur Page 21
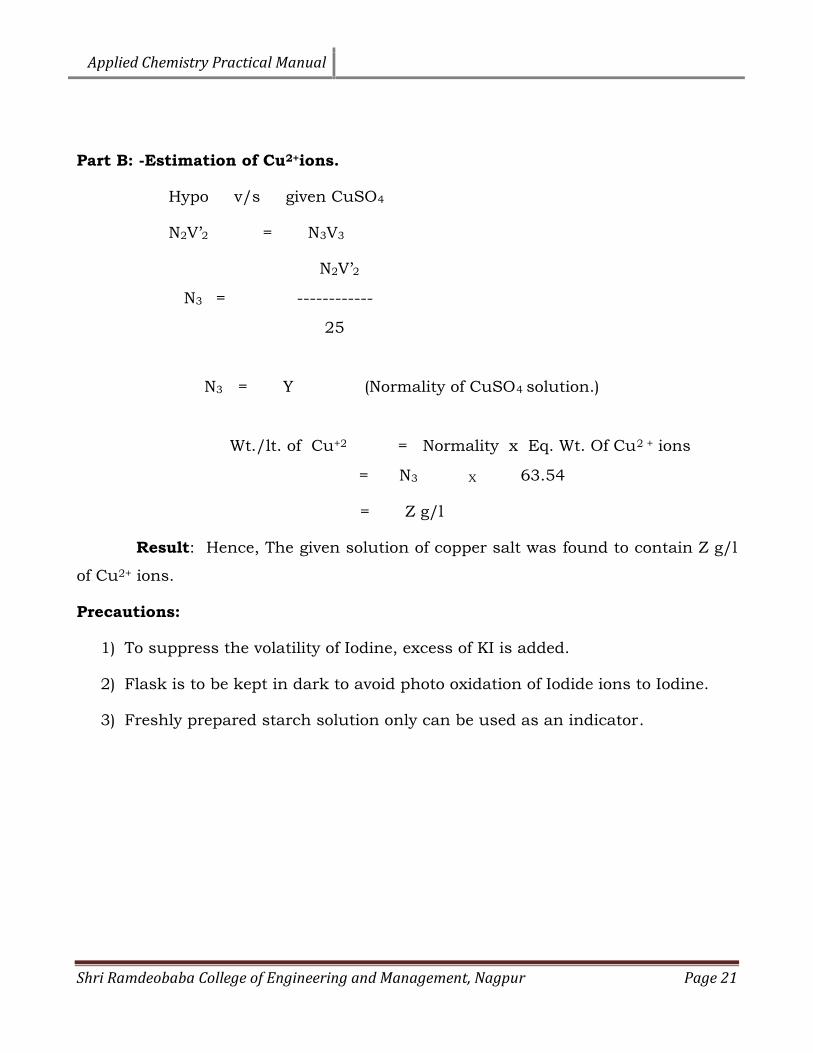
Part B: -Estimation of Cu2+ions.
Hypo v/s given CuSO4
N2V’2 = N3V3
N2V’2
N3 = ------------
25
N3 = Y (Normality of CuSO4 solution.)
Wt./lt. of Cu+2 = Normality x Eq. Wt. Of Cu2 + ions
= N3 X 63.54
= Z g/l
Result: Hence, The given solution of copper salt was found to contain Z g/l
of Cu2+ ions.
Precautions:
1) To suppress the volatility of Iodine, excess of KI is added.
2) Flask is to be kept in dark to avoid photo oxidation of Iodide ions to Iodine.
3) Freshly prepared starch solution only can be used as an indicator.

Applied Chemistry Practical Manual
Shri Ramdeobaba College of Engineering and Management, Nagpur Page 22
EXPERIMENT N0. 4
Aim: - Estimation of Ferrous, Ferric and total iron content present in an ore byRedox titrimetry.
Principle:
The principle involved in this titration is that only Ferrous ions gets oxidized to
ferric ions and the ferric ions in the solution remains as it is.
The amount of ferrous ions present in the given solution containing ferrous and
ferric salt is determined by titrating the solution, and then the total iron (present
now in the ferrous state only) is titrated with potassium dichromate.
1) Cr2O72- + 6Fe2+ +14H+ 2Cr3+ + 6Fe3+ + 7H2O
2) 2Fe3+ + Sn 2+ 2Fe 2+ + Sn 4+
In acid solution reduction of potassium dichromate may be represented as:
Cr2O7 2- + 14H + + 6e- 2Cr3 + + 7H2O
Ferric salts are not oxidized either by dichromate or permanganate. They can be
determined in solution only after reduction of Fe3+ to Fe2+ ions. This reduction can
be carried out by reducing agents such as SnCl2. Ferric salt e.g. FeCl3 is reduced by
the action of SnCl2 in presence of hydrochloric acid.
Fe2 (SO4) 3 + 6HCl 6FeCl3 + 3H2SO4
FeCl3 + SnCl2 2FeCl2 + SnCl4
The excess SnCl2 must be removed completely, as K2Cr2O7 oxidizes it. This is done
by adding mercuric chloride, which reacts with SnCl2 as follows:
SnCl2 + 2HgCl2 SnCl4 + Hg2Cl2
(Excess added) (Silky white ppt.)
Applied Chemistry Practical Manual
Shri Ramdeobaba College of Engineering and Management, Nagpur Page 23
Mecurous chloride (calomel Hg2Cl2) is deposited in the form of silky white
precipitate. This is not filtered off and the solution is directly titrated with K2Cr2O7,
Following reaction takes place: -
6FeCl2 + K2Cr2O7 + 14HCl 6FeCl3 + 2KCl + 2CrCl3 + 7H2O
The following points must be taken into consideration in this analysis. The
precipitated Hg2Cl2 can also oxidize by dichromate. However, if only a small excess
SnCl2 is used in the previous stage, the amount of HgCl2 precipitated is small, it
reacts with the dichromate slowly and no appreciable error is introduced into the
result. On the other hand, if a large excess of Hg2Cl2 is precipitated and, in
particular, if it has a gray or dark colour as a result of further reduction to metallic
mercury by the reaction
Hg2Cl2 + SnCl2 2Hg + SnCl4
Then it is oxidized so rapidly in the titration that the result is quite erroneous.
It follows, therefore, that a basic condition for accuracy in this method is the use of
a very slight excess of SnCl2. Stannous chloride is added drop by drop until the
reddish yellow/ yellow colour of FeCl3 has completely disappeared, after which one
or two more drops are added.
PROCEDURE:
Part-I : Estimation of Ferrous ions present in given mixture:
Pipette out 25 ml.of the given Ferrous & Ferric salt solution mixture in a conical
flask, add about 10 ml. of sulphuric acid and 5-6 drops of N-Phenyl anthranilic acid
as an indicator. Titrate slowly with constant shaking of the flask against K2Cr2O7
solution till the brick red colour, which marks the end point. This titre value
corresponds to the ferrous ions present in the solution.
Applied Chemistry Practical Manual
Shri Ramdeobaba College of Engineering and Management, Nagpur Page 24
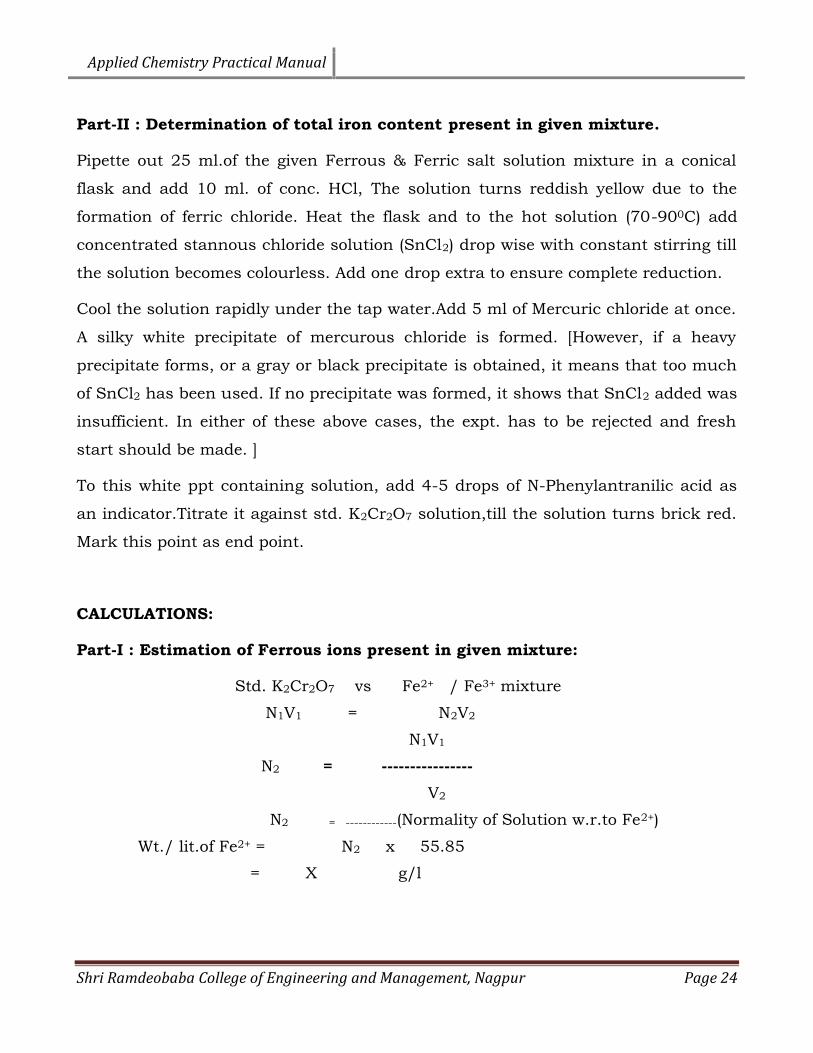
Part-II : Determination of total iron content present in given mixture.
Pipette out 25 ml.of the given Ferrous & Ferric salt solution mixture in a conical
flask and add 10 ml. of conc. HCl, The solution turns reddish yellow due to the
formation of ferric chloride. Heat the flask and to the hot solution (70-900C) add
concentrated stannous chloride solution (SnCl2) drop wise with constant stirring till
the solution becomes colourless. Add one drop extra to ensure complete reduction.
Cool the solution rapidly under the tap water.Add 5 ml of Mercuric chloride at once.
A silky white precipitate of mercurous chloride is formed. [However, if a heavy
precipitate forms, or a gray or black precipitate is obtained, it means that too much
of SnCl2 has been used. If no precipitate was formed, it shows that SnCl2 added was
insufficient. In either of these above cases, the expt. has to be rejected and fresh
start should be made. ]
To this white ppt containing solution, add 4-5 drops of N-Phenylantranilic acid as
an indicator.Titrate it against std. K2Cr2O7 solution,till the solution turns brick red.
Mark this point as end point.
CALCULATIONS:
Part-I : Estimation of Ferrous ions present in given mixture:
Std. K2Cr2O7 vs Fe2+ / Fe3+ mixture
N1V1 = N2V2
N1V1
N2 = ----------------V2
N2 = ------------(Normality of Solution w.r.to Fe2+)
Wt./ lit.of Fe2+ = N2 x 55.85
= X g/l

Applied Chemistry Practical Manual
Shri Ramdeobaba College of Engineering and Management, Nagpur Page 25
Part-II : Determination of total iron content present in given mixture.
Std. K2Cr2O7 vs Fe2+ / Fe3+ mixture
N1V1 = N3V3
N1V1
N3 = ---------------
V3
N3 = ----- g/l (Normality w.r.to Total iron content)
Wt./ lit.of = N3 x 55.85
= Y g/l
So, The amount of Fe3+ ions present in the mixture = (Y – X) g/l .
Result: The amount of Fe2+, Fe3+ and total iron content present in given mixture wasfound to be respectively.

Applied Chemistry Practical Manual
Shri Ramdeobaba College of Engineering and Management, Nagpur Page 26
EXPERIMENT NO. 5
Aim: Determination of relative and kinematic viscosities of a given lubricatingoil at different temperatures using Redwood Viscometer No. 1 or No. 2.Apparatus: Redwood viscometer (1 / 2), thermometer, etc.
THEORY AND GENERAL DISCUSSION:
Viscosity is one of the most important properties of a lubricating oil. Viscosity is a
measure of the internal resistance to the motion of a fluid and is mainly due to the
forces of cohesion between the fluid molecules. The formation of a fluid film of a
lubricant between the moving friction surface and the generation of the frictional
heat under the particular condition of load, bearing speed and lubricant supply is
mainly depends upon the viscosity of the lubricant and to some extent on its
oiliness. If the viscosity of the oil is too low, the fluid lubricant film cannot be
maintained between the moving surfaces as a result of which excessive wear may
take place. On the other hand, if the viscosity of the oil is too high, excessive friction
due to the shearing of oil itself would result. Hence in hydrodynamic lubrication, the
lubricant should posses the proper viscosity. So, it is of vital importance to have
knowledge of the viscosity of the lubricating oil. Viscosity of the fluid may be
measured in several ways, one of which is determining time required for a definite
amount of the liquid to flow through a capillary. Such method includes the use of
Saybolt, Engler and Redwood Viscometers.
Viscosity may be expressed as dynamic (or absolute) viscosity, kinematic viscosity or
the viscosity called after the name of the apparatus used for its determination.
DYNAMIC OR ABSOLUTE VISCOSITY:
Dynamic or absolute viscosity (often denoted by ‘n’) is the tangential force per unit
area required to maintain unit velocity gradient between two parallel planes, in the
Applied Chemistry Practical Manual
Shri Ramdeobaba College of Engineering and Management, Nagpur Page 27
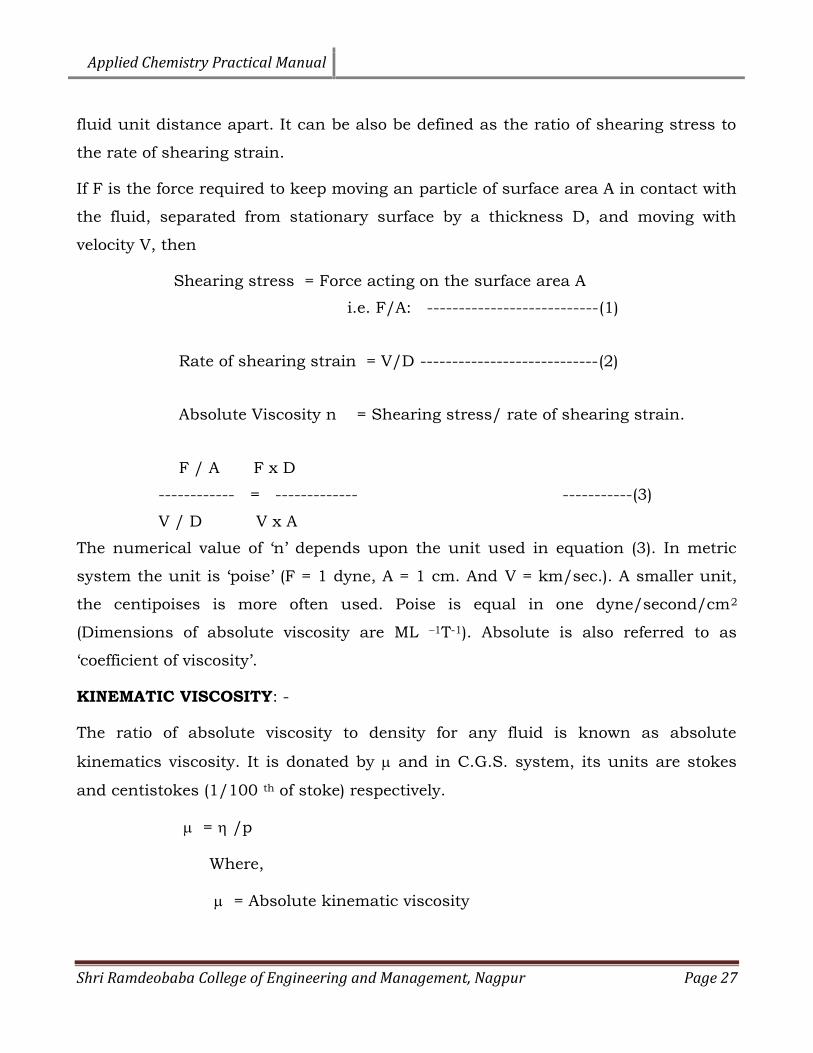
fluid unit distance apart. It can be also be defined as the ratio of shearing stress to
the rate of shearing strain.
If F is the force required to keep moving an particle of surface area A in contact with
the fluid, separated from stationary surface by a thickness D, and moving with
velocity V, then
Shearing stress = Force acting on the surface area A
i.e. F/A: ---------------------------(1)
Rate of shearing strain = V/D ----------------------------(2)
Absolute Viscosity n = Shearing stress/ rate of shearing strain.
F / A F x D
------------ = ------------- -----------(3)
V / D V x A
The numerical value of ‘n’ depends upon the unit used in equation (3). In metric
system the unit is ‘poise’ (F = 1 dyne, A = 1 cm. And V = km/sec.). A smaller unit,
the centipoises is more often used. Poise is equal in one dyne/second/cm2
(Dimensions of absolute viscosity are ML –1T-1). Absolute is also referred to as
‘coefficient of viscosity’.
KINEMATIC VISCOSITY: -
The ratio of absolute viscosity to density for any fluid is known as absolute
kinematics viscosity. It is donated by and in C.G.S. system, its units are stokes
and centistokes (1/100 th of stoke) respectively.
= /p
Where,
= Absolute kinematic viscosity

Applied Chemistry Practical Manual
Shri Ramdeobaba College of Engineering and Management, Nagpur Page 28
ŋ = absolute dynamic viscosity
ρ = density of fluid.
Dimension of are L2 T1
Since the rate, at which a fluid will flow through an apparatus increases as the
internal friction of the fluid decreases, the rate of flow through an orifice or short
tube may be used as a means for measuring viscosity. This is the principle involved
in the Redwood viscometer, which is an English standard whereas Saybolt’s
Viscometer is used in U.S.A. and Engler’s Viscometer in Europe. In these
commercial Viscometers a fixed volume of the liquid is allowed to flow (in case of
Redwood it is 50 ml. at 270C Engler-60 ml. and Saybolt –200 ml.) through a
capillary tube of specified dimension under given set of conditions and the time of
flow is measured at a particular temperature. The result is usually expressed in
terms of the time in seconds taken by oil to flow through the standard orifice of the
particular standard apparatus used.
e.g.: Viscosity of oil is 250, Redwood ( no. ½) seconds at 270C. This Viscosity so
determined is sometimes called as Relative Viscosity.
Absolute and kinematic Viscosities can also be determined from the relative
Viscosity (i.e. Redwood values) from the equations:
= Ct ----------------(5) (for Fluids)
Whose Kinematic Viscosity is more than 10 centistokes
and m = Ct – β / t ----------------(6) (for fluids Kinematics Viscosities less than or
Equal to 10 centistokes)
Where,
= kinematic viscosity in centistokes
t = time of flow in seconds

Applied Chemistry Practical Manual
Shri Ramdeobaba College of Engineering and Management, Nagpur Page 29
C = viscometer constant
ρ = coefficient of kinetic energy which may be determined
experimentally or eliminated by choosing long flow-times
Test Viscometer may be calibrated constant C determined by solutions of
known Viscosity. The primary standard used is freshly distilled water, whose
kinematics viscosity is 1.0008 centistokes. Other standards usually employed
are-
40% sucrose solution
= 4.390 cs at 25 0C p = 1.1739
60% sucrose solution.
= 33.66 cs. At 250C p = 1.28335
For Redwood viscometer No.1, the values for the constants are as below:
Time of flow, t β C
40 to 85 seconds 190 0.264
85 to 2000 seconds 65 0.247
For Redwood viscometer No.2, the values for the constants are β =1120, C=2.720
Redwood viscometer No. 2 is used for very viscous liquids and gives 1/10 th the
value of Redwood No.1 viscometer. Replace the ball value in position to seal the cap
to prevent overflow of the oil.

Applied Chemistry Practical Manual
Shri Ramdeobaba College of Engineering and Management, Nagpur Page 30
Diagram:
PROCEDURE:
1) Level the instrument by leveling screws ensuring that it is horizontal with the
help of spirit level.
2) Put the valve rod at its position (i.e. in the concavity at the bottom of the cup) to
close the passage of orifice.
3) Keep clean dry Kohlrausch’s flask centrally below the jet.
4) The test sample is poured into the oil cup and adjust the level of oil, with that of
the pointer. Later indicates the level to which oil is to be filled.

Applied Chemistry Practical Manual
Shri Ramdeobaba College of Engineering and Management, Nagpur Page 31
5) Fill up the water bath with water and adjust the level of water with that of the
pointer in the oil cup.
6) Cover the oil cup with the lid and insert thermocouple / thermometer of desired
range into the oil cup from the thermometer bracket. Care should be taken that
it dose not touch the bottom of the cup.
7) Also insert the thermometer into the water bath from the shield.
8) Let the oil in the cup as well as water of the water bath attain the room
temperature. Once the temperature of oil and water bath become steady for a
period of 2-3 minutes record the temperatures separately. (Quite likely that there
may be a difference of 1-20C between the temperature of oil and the temperature
of water in the water bath.
9) Lift up the value rod and suspend it from the thermometer bracket and start the
stop watch simultaneously.
10)Receiving flask is so located that oil strikes the flared mouth and does not drop
directly into the opening, which would cause foaming.
11)When the level of the oil reaches 50 ml. mark in the neck of the flask, stop the
stop-watch.
12)At the same time close the passage of the orifice by keeping the valve rod at its
original position to prevent any overflow of oil.
13)The time elapsed in seconds is the relative viscosity of oil at room temperature.
14)Switch on the water bath adjust the knob of the regulator in such a way that the
temperature of the water bath is a few degree above temperature i.e. 850C
15)Again, pour oil into the cup and adjust oil level as described earlier.
16)Stir the contents of the bath and dup regularly.

Applied Chemistry Practical Manual
Shri Ramdeobaba College of Engineering and Management, Nagpur Page 32
17)When the temperature of sample has become quite steady at the desired value
i.e. at 850C lift the valve rod and suspend it from the thermometer bracket and
start the stopwatch simultaneously.
18) When the level of the oil touches the 50 ml. mark on the neck of the flask stop
the watch. The time elapsed in seconds in the relative viscosity of oil at 850C.
19)Now take out some hot water from the water bath and add equal amount of cold
water to bring the temperature of the bath slightly above that of test temperature
i.e. 750C.
20) Pour oil into the cup and adjust oil level as described earlier.
21)Stir the contents of the bath and cup regularly.
22)When the temperature of sample has become quite steady at the desired
temperature i.e. 750C find out the relative viscosity of test sample at this
temperature as described earlier.
23)Repeat the procedure to find out relative viscosities of oil at 650C, 550C, 450C,
respectively.
24)Record all the results in the tabular form.
25)Construct graph co-relation (a) Viscosity and temperature, (b) Log of viscosity
and temperature and (c) Kinematic viscosity and temperature (d) Log of
Kinematic viscosity and temperature, (e) Find rate of change of relative viscosity
w. r. t. Temperature of the given oil.

Applied Chemistry Practical Manual
Shri Ramdeobaba College of Engineering and Management, Nagpur Page 33
Observation table: Redwood viscometer no.:
Sr.
No.
Temperature
(T) in 0C
Time in
second
Relative
Viscosity
( r )
Kinematic
Viscosity
in
centistroke
Log ( r
)
Log
1 Room Temp.:
2 85
3 75
4 65
5 55
6 45
7 35
8
Calculation:
Graphs were plotted between
1. Relative viscosity ( r ) against the temperature of sample (T)
2. Log of relative viscosity ( r ) against the temperature of sample (T)
3. Kinematic viscosity against the temperature of sample (T)
4. Log of kinematic viscosity against the temperature of sample (T)

Applied Chemistry Practical Manual
Shri Ramdeobaba College of Engineering and Management, Nagpur Page 34
And determine the slope of the graph 1 from the plot and calculate it using the least
square method.
Result:- The rate of change of relative viscosity with respect to temperature was
found to be equal to

Applied Chemistry Practical Manual
Shri Ramdeobaba College of Engineering and Management, Nagpur Page 35
EXPERIMENT NO. 6
Aim: Determination of flash point of a combustible liquid by Able’s closed cupflash point apparatus.
Theory:-
The Flash Point of oil may be defined as the minimum temperature to which it must
be heated to give off sufficient vapour to ignite momentarily or less than 5 seconds
when a flame of standard dimensions (Aprrox. 4 mm) is brought near the surface of
the sample for a prescribed rate in an apparatus of specified dimensions. This is
detected by the appearance of momentary flash upon the application of small flame
over the surface of oil. The Flash Point is defined as closed cup or open cup flash
point accordingly as the apparatus for the determination of flash point of sample is
provided with a cover to cover the sample cup or not.
Whereas the Fire Point of oil may be defined as the minimum temperature to which
it must be heated to give off sufficient vapour to ignite for more than 5 seconds
when a flame of standard dimensions (Aprrox. 4 mm) is brought near the surface of
the sample for a prescribed rate in an apparatus of specified dimensions.
The mechanism of the appearance of the flash can be explained in the following
manner. Every flammable liquid has a vapour pressure, which is a function of the
liquid’s temperature. As the temperature increase, the vapour pressure increases,
as the vapour pressure increases, the concentration of evaporated flammable liquid
in the air increases. Hence, temperature determines the concentration of its vapour
in the air to sustain combustion. The flash point of a flammable liquid is the lowest
temperature at which there can be enough flammable vapour to ignite, when an
ignition source is applied. Oil containing minute quantities of volatile organic
substances is liable to flash below the true flash point of the oil. Although a small
flash may be observed in such cases, it should not be confused with the true flash
Applied Chemistry Practical Manual
Shri Ramdeobaba College of Engineering and Management, Nagpur Page 36
point, since its intensity does not increase with increase in temperature, as
occurred when the true flash point is reached.
Importance of flash point from view of lubricants:
Good lubricating oil should not volatilize under the working temperatures. Even if
some volatilization takes place, the vapour formed should not form inflammable
mixture with air under the condition of lubrication. From this point of view, the
flash point of lubricating oil is of vital importance.
Lubricating oil selected for the job should have a flash point which is reasonably
above its working temperature. This insures the safety against the fire hazards
during the storage, transport and use of the lubricating oil. This test is immense
importance for illuminating and lubricating Oils. This helps in detecting the highly
volatile constituents of the oils. If they are highly volatile at ordinary temperature,
the issuing vapors may cause fire hazards. So to ensure safety, certain minimum
temperatures are laid down for fuels and Lubricating Oils below which they should
not give off adequate vapors to make them burn.
Outline of the method:
The sample is placed in the oil cup of apparatus and heated at a slow uniform rate
about 2 0C. A small test is directed into the cup at regular intervals, and the lowest
temperature at which application of the test flame causes the vapor to ignite
momentary, with a distinct flash inside the cup, is recorded as Abel’s Flash Point.
Description of the apparatus:
The Abel’s apparatus consists of the following essential parts: -
SAMPLE CUP: This is a cylindrical vessel with a lid. Within the cup, near the top;
there is a sample level mark.
COVER: The cup is provided with a close fitting cover. The cover is provided with a
thermometer socket, to support an oil test lamp, a movable metal bead. The top of
the cover has three rectangular holes which are covered or uncovered by moving the
Applied Chemistry Practical Manual
Shri Ramdeobaba College of Engineering and Management, Nagpur Page 37
slide which has two perforations to allow air to enter the oil up and bring contact
between vapors of the oils and flame of the test-lamp when in open position.
A metal bead, the dimension (4mm) of which represents the size of test flame, is
mounted in the cover. The apparatus is also provided with a stirrer.
HEATING VESSEL: -
The heating vessel consists of copper vessels and placed coaxially, one inside the
other. The space between the two vessels is used as a water jacket. When the oil cup
is placed into the hole at the top of the vessel, it fits into it and leaves an air gap
between itself and outer copper water vessel.
The water can be heated electrically or with a burner or spirit lamp. Thermometer is
provided with the apparatus for the measuring the temperature of the oil sample.
PROCEDURE:
Fill the given sample in such a way that the sample level is exactly up to the mark
in the cup. Fix the cup in to the apparatus and cover with lid. Insert thermometer in
the thermometer holder given in the cup in such a manner that it will not directly
touch the lower bottom of the cup and the paddle stirrer inside the cup. Fill the
water bath with the cold water. Close the sliding shutter and light the standard
flame. Adjust the size of flame (4mm diameter) with respect to the metal bead. Stir
the oil using paddle stirrer. Introduce the flame by opening the shutter and check
the appearance of the flash. Now heat the apparatus and set the rate of temperature
increase at the rate of 1 to 2 0C per minute. Check the flash point of given sample at
the interval of 3 0C rise in the temperature. Discontinue the stirring the sample
during the introduction of the test flame. On observing a flash, stop the heating
process and allow the temperature to decrease. Check the occurrence of a flash at
every 1 0C drop in temperature at which the flash is observed as the flash point of
the sample.

Applied Chemistry Practical Manual
Shri Ramdeobaba College of Engineering and Management, Nagpur Page 38
Diagram:

Applied Chemistry Practical Manual
Shri Ramdeobaba College of Engineering and Management, Nagpur Page 39
OBSERVATION: Sample No.:-
Table 1
S. No. Increasing
Temperature (0C)
Inference
(No flash or Flash observed)
1
2
3
4
5
6
Table 2
S. No. Decreasing
Temperature (0C)
Inference
(No flash or Flash observed)
1
2
3
4
5
6
Result: The Flash Point of given Sample oil No. by Able’ Flash Point
apparatus is found to be ------0C.

Applied Chemistry Practical Manual
Shri Ramdeobaba College of Engineering and Management, Nagpur Page 40
EXPERIMENT NO. 7
Aim: - Determination of flash point of a combustible liquid by Pensky-Martan’sclosed cup flash point apparatus.
Theory:-
The Flash Point of oil may be defined as the minimum temperature to which it must
be heated to give off sufficient vapour to ignite momentarily or less than 5 seconds
when a flame of standard dimensions (Aprrox. 4 mm) is brought near the surface of
the sample for a prescribed rate in an apparatus of specified dimensions. This is
detected by the appearance of momentary flash upon the application of small flame
over the surface of oil. The Flash Point is defined as closed cup or open cup flash
point accordingly as the apparatus for the determination of flash point of sample is
provided with a cover to cover the sample cup or not.
Whereas the Fire Point of oil may be defined as the minimum temperature to which
it must be heated to give off sufficient vapour to ignite for more than 5 seconds
when a flame of standard dimensions (Aprrox. 4 mm) is brought near the surface of
the sample for a prescribed rate in an apparatus of specified dimensions.
The mechanism of the appearance of the flash can be explained in the following
manner. Every flammable liquid has a vapour pressure, which is a function of the
liquid’s temperature. As the temperature increase, the vapour pressure increases,
as the vapour pressure increases, the concentration of evaporated flammable liquid
in the air increases. Hence, temperature determines the concentration of its vapour
in the air to sustain combustion. The flash point of a flammable liquid is the lowest
temperature at which there can be enough flammable vapour to ignite, when an
ignition source is applied. Oil containing minute quantities of volatile organic
substances is liable to flash below the true flash point of the oil. Although a small

Applied Chemistry Practical Manual
Shri Ramdeobaba College of Engineering and Management, Nagpur Page 41
flash may be observed in such cases, it should not be confused with the true flash
point, since its intensity does not increase with increase in temperature, as
occurred when the true flash point is reached.
Importance of flash point from view of lubricants:
Good lubricating oil should not volatilize under the working temperatures. Even if
some volatilization takes place, the vapour formed should not form inflammable
mixture with air under the condition of lubrication. From this point of view, the
flash point of lubricating oil is of vital importance.
Lubricating oil selected for the job should have a flash point which is reasonably
above its working temperature. This insures the safety against the fire hazards
during the storage, transport and use of the lubricating oil. This test is immense
importance for illuminating and lubricating Oils. This helps in detecting the highly
volatile constituents of the oils. If they are highly volatile at ordinary temperature,
the issuing vapors may cause fire hazards. So to ensure safety, certain minimum
temperatures are laid down for fuels and Lubricating Oils below which they should
not give off adequate vapors to make them burn.
DESCRIPTION OF THE APPARATUS
A Pensky Martin apparatus consists of the following parts:
SAMPLE CUP: Sample cup is a cylindrical vessel, made of brass with a filling mark
grooved inside near the top. It is provided with a lid.
LID: The lid is equipped with the following parts:
Stirrer: The stirring device consists of a vertical steel shaft mounted in the center of
the cup and carrying two-bladed brass propellers.
Cover: It has four opening, one for thermometer and the rest for the oxygen entry
and exposure of vapors to test flame.

Applied Chemistry Practical Manual
Shri Ramdeobaba College of Engineering and Management, Nagpur Page 42
Shutter: The lid is equipped with a brass shutter operating on the plane of the
upper surface of the cover. The shutter is so shaped and mounted on the lid that
when in one position, the holes are completely closed and when in the other, these
orifices are completely opened.
The flame exposure device: The lid is equipped with a pilot lamp with such a
mechanism that its flame operates simultaneously with the shutter. When the
shutter is in the ‘open’ position, the tip is lowered down in the center of the central
orifice.
Heater: The cup is heated by means of burner or it is electrically heated. The air
bath has cylindrical interior about 4 cm. deep and can be heated by a direct flame
or an electric resistance element. The top-plate is also made of metal and mounted
with an air gap between it and the air bath.
Digram:

Applied Chemistry Practical Manual
Shri Ramdeobaba College of Engineering and Management, Nagpur Page 43
PROCEDURE:
The cup and its accessories are well cleaned and dried before the test is started.
Now the cup is filled with the oil to be tested up to the level indicated by the filling
mark and covered with the lid. The stirring device, the thermometer and flame
exposure device is fixed on the top of the cover. The cup is now set in the apparatus
properly and the thermometer inserted. The test flame is lighted and adjusted until
it is the size of a bead (4mm in diameter). The apparatus is heated so that the
heating rate is maintained, with the help of a rheostat, at 5-6 0C per minute and
stirring rate at 1 to 2 rps.
Once the heating started, the test flames is applied after each 2 0C rise of
temperature nearer to the sample in the cup by opening the shutter and check the
appearance of the flash.
On observing a flash, stop the heating process and allow the temperature to
decrease. Check the occurrence of a flash at every 1 0C drop in temperature. Record
the lowest temperature at which the flash is observed as the flash point of the
sample.
OBSERVATION:
Table 1
S. No. IncreasingTemperature (0C)
Inference(No flash or Flash observed)
123456

Applied Chemistry Practical Manual
Shri Ramdeobaba College of Engineering and Management, Nagpur Page 44
Table 2
S. No. Decreasing
Temperature (0C)
Inference
(No flash or Flash observed)
1
2
3
4
5
6
RESULT: The Flash Point of given sample determined by Pensky Marten’s FlashPoint apparatus is found to be -------------0C.

Applied Chemistry Practical Manual
Shri Ramdeobaba College of Engineering and Management, Nagpur Page 45
EXPERIMENT NO. 8Aim: Determination of flash point of a combustible liquid by Cleveland’s opencup flash point apparatus.
DEFINITIONS:
Theory:-
The Flash Point of oil may be defined as the minimum temperature to which it must
be heated to give off sufficient vapour to ignite momentarily or less than 5 seconds
when a flame of standard dimensions (Aprrox. 4 mm) is brought near the surface of
the sample for a prescribed rate in an apparatus of specified dimensions. This is
detected by the appearance of momentary flash upon the application of small flame
over the surface of oil. The Flash Point is defined as closed cup or open cup flash
point accordingly as the apparatus for the determination of flash point of sample is
provided with a cover to cover the sample cup or not.
Whereas the Fire Point of oil may be defined as the minimum temperature to which
it must be heated to give off sufficient vapour to ignite for more than 5 seconds
when a flame of standard dimensions (Aprrox. 4 mm) is brought near the surface of
the sample for a prescribed rate in an apparatus of specified dimensions.
The mechanism of the appearance of the flash can be explained in the following
manner. Every flammable liquid has a vapour pressure, which is a function of the
liquid’s temperature. As the temperature increase, the vapour pressure increases,
as the vapour pressure increases, the concentration of evaporated flammable liquid
in the air increases. Hence, temperature determines the concentration of its vapour
in the air to sustain combustion. The flash point of a flammable liquid is the lowest
temperature at which there can be enough flammable vapour to ignite, when an
ignition source is applied. Oil containing minute quantities of volatile organic
substances is liable to flash below the true flash point of the oil. Although a small
flash may be observed in such cases, it should not be confused with the true flash

Applied Chemistry Practical Manual
Shri Ramdeobaba College of Engineering and Management, Nagpur Page 46
point, since its intensity does not increase with increase in temperature, as
occurred when the true flash point is reached.
Importance of flash point from view of lubricants:
Good lubricating oil should not volatilize under the working temperatures. Even if
some volatilization takes place, the vapour formed should not form inflammable
mixture with air under the condition of lubrication. From this point of view, the
flash point of lubricating oil is of vital importance.
Lubricating oil selected for the job should have a flash point which is reasonably
above its working temperature. This insures the safety against the fire hazards
during the storage, transport and use of the lubricating oil. This test is immense
importance for illuminating and lubricating Oils. This helps in detecting the highly
volatile constituents of the oils. If they are highly volatile at ordinary temperature,
the issuing vapors may cause fire hazards. So to ensure safety, certain minimum
temperatures are laid down for fuels and Lubricating Oils below which they should
not give off adequate vapors to make them burn.
DESCRIPTION OF APPARATUS:
The apparatus consists of a test cup made of without any lid and is equipped with a
handle. The cup is supported by a metal plate known as heating plate. The cup may
be heated by an electric heater mounted below the cup in the apparatus itself
The metal plate has an extension for mounting the test flame and the thermometer
support. The test flame is mounted in such a manner as to permit automatic
duplication of the sweep of the test flame over the sample cup. The size of the flame
can be adjusted with respect to the dimension of metal bead (4 mm).

Applied Chemistry Practical Manual
Shri Ramdeobaba College of Engineering and Management, Nagpur Page 47
Digram:
PROCEDURE:
The apparatus is thoroughly cleaned and the thermometer is suspended in such a
way so that the bottom of the thermometer bulb just above the bottom of sample
cup.
The cup is now filled with sample up to the filling mark grooved on the inner side of
the cup taking care that the surface of the sample is free from bubbles and there is
no oil above the filling mark. The test flame is adjusted to have a flame diameter of
about 4 mm. Now move the test flame over the sample cup and check the
appearance of flash over the sample inside the cup.
If no flash observed, increase the temperature of the sample taken and take a flame
over the cup after every 2 0C increases. On observing a flash, stop the heating
Applied Chemistry Practical Manual
Shri Ramdeobaba College of Engineering and Management, Nagpur Page 48
process and allow the temperature to decrease. Check the occurrence of a flash at
every 1 0C drop in temperature. Record the lowest temperature at which the flash is
observed as the flash point of the sample.
OBSERVATION TABLE:
Table 1
S. No. Increasing
Temperature (0C)
Inference
(No flash or Flash observed)
1
2
3
4
5
6
Table 2
S. No. Decreasing
Temperature (0C)
Inference
(No flash or Flashobserved)
1
2
3
4
5
6

Applied Chemistry Practical Manual
Shri Ramdeobaba College of Engineering and Management, Nagpur Page 49
Result:
The Flash Point of given sample determined by Cleveland’s apparatus is found to be
----0C.


![Shri Ramdeobaba College of Engineering and Management ... · 25 2 A Aditi Agrawal IND - [INDUSTRIAL ENGINEERING] CET314-2 [Green Building & Vastu Concepts] ... Shri Ramdeobaba College](https://img.dokumen.tips/doc/110x75/5e270ca634544a4e5c67199f/shri-ramdeobaba-college-of-engineering-and-management-25-2-a-aditi-agrawal-ind.jpg)