Embed Size (px)
Citation preview
Copyright 2002 Global Insight, Inc.
Practical Goal-Setting: Benchmarking and Practical Goal-Setting: Benchmarking and Forecasting your Industry End Markets Forecasting your Industry End Markets
Presented at the Economic, Industry and Consumer Outlook SeminarPresented at the Economic, Industry and Consumer Outlook Seminar
April 29, 2003April 29, 2003
Atlanta, GeorgiaAtlanta, Georgia
Allen GutheimAllen Gutheim
Principal, Advisory Services GroupPrincipal, Advisory Services Group

Copyright 2002 Global Insight, Inc.
What We Will Talk About TodayWhat We Will Talk About Today
• The forecast process:The forecast process:• What would we like to achieve?
• What’s realistic?
• Forecasting methodology:Forecasting methodology:• B2B “Sales Benchmarking” at Global Insight.
• Elements of our techniques that can work for you.
• Tricks of the trade.
• Achieving forecast user buy-in.Achieving forecast user buy-in.• Senior planning executives.
• Senior operational executives.
Copyright 2002 Global Insight, Inc.
Forecasting Occurs in a Difficult Forecasting Occurs in a Difficult Environment Environment
• Many participants.Many participants.
• Conflicting motivations.Conflicting motivations.
• Imperfect knowledge.Imperfect knowledge.
• Cumbersome process.Cumbersome process.
• Time-killer.Time-killer.
$$$

Copyright 2002 Global Insight, Inc.
Forecasting at Many OrganizationsForecasting at Many Organizations
• Start with last year’s Start with last year’s sales results.sales results.
• Assume a reasonable Assume a reasonable increase for the increase for the budget period.budget period.
• Bend into a “hockey Bend into a “hockey stick.” stick.”
• Review with boss.Review with boss.
• BIGBIG difference between difference between your number and your your number and your boss’ number.boss’ number.
• Go back to beginning for Go back to beginning for another round. another round.
The CEO has a number in mind, but may not share it.

Copyright 2002 Global Insight, Inc.
Organizational Dynamics Weigh Organizational Dynamics Weigh Against the Forecast ProcessAgainst the Forecast Process
• Forecasts are mistrusted.Forecasts are mistrusted.• They are often wrong.
• The process is highly political.• Careers hinge on achieving results against plan.
• Forecasts must serve multiple goals or ends.Forecasts must serve multiple goals or ends.• The forecasting methodology varies across the organization.The forecasting methodology varies across the organization.
• Underlying forecast assumptions.
• Future outlooks or forecasts.
• Individual biases affect forecasts and quotas.Individual biases affect forecasts and quotas.• The process seems illogical.The process seems illogical.
• No well-established and accepted foundation.
• Difficult to analyze and discuss, and to manage to.• Things change as the year goes on.
Copyright 2002 Global Insight, Inc.
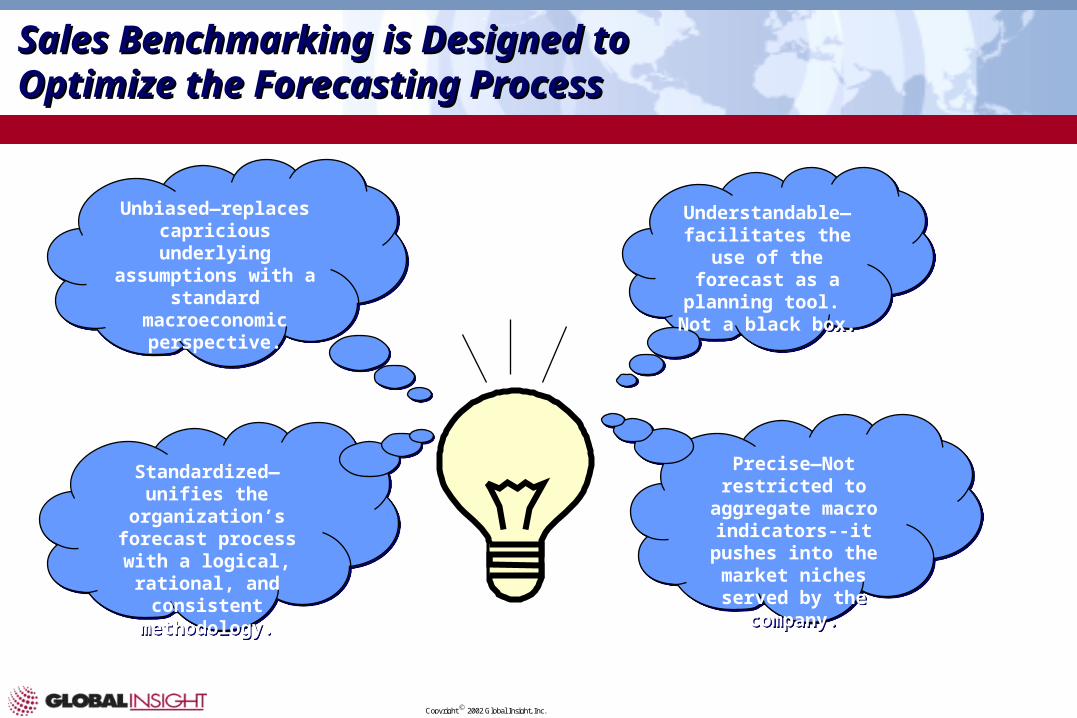
Sales Benchmarking is Designed to Sales Benchmarking is Designed to Optimize the Forecasting Process Optimize the Forecasting Process
Unbiased—replaces capricious underlying
assumptions with a standard
macroeconomic perspective.
Unbiased—replaces capricious underlying
assumptions with a standard
macroeconomic perspective.
Standardized—unifies the organization’s
forecast process with a logical, rational, and
consistent methodology.
Standardized—unifies the organization’s
forecast process with a logical, rational, and
consistent methodology.
Understandable—facilitates the use of
the forecast as a planning tool. Not a
black box.
Understandable—facilitates the use of
the forecast as a planning tool. Not a
black box.
Precise—Not restricted to aggregate macro
indicators--it pushes into the market niches
served by the company.
Precise—Not restricted to aggregate macro
indicators--it pushes into the market niches
served by the company.

Copyright 2002 Global Insight, Inc.
A Sales Benchmarking PerspectiveA Sales Benchmarking Perspective
Business activity in its end markets
Shifts in market share
Special events
Strong market activity provides a growing demand for a company’s products.Strong market activity provides a growing demand for a company’s products.
Successful responses to competitive challenges contribute to additional growth.Successful responses to competitive challenges contribute to additional growth.
A variety of events (often one-time) can significantly affect revenue growth.A variety of events (often one-time) can significantly affect revenue growth.
Ultimately, only three elements determine a company’s sales growth:
Copyright 2002 Global Insight, Inc.
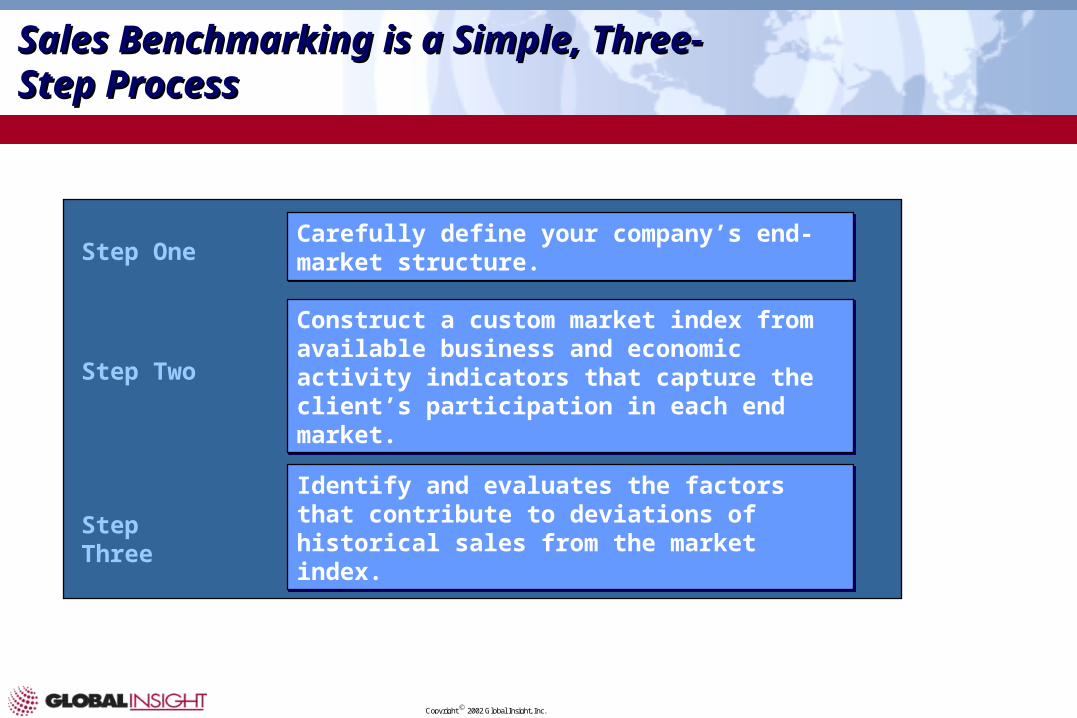
Sales Benchmarking is a Simple, Sales Benchmarking is a Simple, Three-Step ProcessThree-Step Process
Step Two
Step Three
Carefully define your company’s end-market structure. Carefully define your company’s end-market structure.
Construct a custom market index from available business and economic activity indicators that capture the client’s participation in each end market.
Construct a custom market index from available business and economic activity indicators that capture the client’s participation in each end market.
Identify and evaluates the factors that contribute to deviations of historical sales from the market index.
Identify and evaluates the factors that contribute to deviations of historical sales from the market index.
Step One

Copyright 2002 Global Insight, Inc.
Sales Forecasts that are Logical, Easily Sales Forecasts that are Logical, Easily Understood and CommunicatedUnderstood and Communicated
Custom Market Index:• Captures the business
basis for growing demand for the company’s products.
Custom Market Index:• Captures the business
basis for growing demand for the company’s products.
Additional factors:• Market penetration trends .• Price changes.• New product
introductions.• Sales channel innovations.• Government regulations.• Weather.
Additional factors:• Market penetration trends .• Price changes.• New product
introductions.• Sales channel innovations.• Government regulations.• Weather.
Sales ForecastSales Forecast

Copyright 2002 Global Insight, Inc.
Constructing a Custom Market IndexConstructing a Custom Market Index
• Company SalesCompany Sales• Total company
• By group
• By division
• By product line or product groups
The market index links company sales with measures of business activity in its key markets:
Business Activity MeasuresBusiness Activity Measures• Industrial production.
• Employment
• Business equipment investment
• Construction investment
Key MarketsKey Markets• By country.
• By region.
• By industry.
• By sales territory.

Copyright 2002 Global Insight, Inc.
Market Index 1: Well-Defined Market Market Index 1: Well-Defined Market Information AvailableInformation Available
Market Segment
1998 Sales Distribution
Driver Variable
Automotive 54.9% Unit Auto Production
Office Equipment 7.7% IP-Office Machines/Computers
Distribution 6.2%
Other Transportation 5.5% IP-Trucks/Tractor Trailers
Electrical Equipment 4.5% IP-Electrical Machinery
Power Equipment 4.3% IP-Nonelectrical Machinery
Construction 4.3% Real Construction Investment
Appliance 4.2% IP-Household Appliances
Fabricated Metal Products 3.3% IP-Fabricated Metal Products
Non-Auto Engines & Components 1.2% IP-Engines & Turbines
Miscellaneous 3.9%

Copyright 2002 Global Insight, Inc.
Market Index 1: AlgebraMarket Index 1: Algebra
MI1(real) = 0.549*(unit auto prod.)/(unit auto prod. in 1998) + 0.077*(IP-office machines)/(office machines in 1998) + 0.055*(IP-trucks/trailers)/(IP-trucks/trailers in 1998) + 0.045*(IP-elect. Mach.)/(IP-elect. mach. in 1998) + 0.043*(IP-nonelect. mach.)/(IP-nonelect. Mach. in 1998) + 0.043*(Real const. inv.)/(Real const. inv. in 1998) + 0.042*(IP-appliances)/(IP-appliances in 1998) + 0.033*(IP-fab. metal prod.)/(IP-fab. metal prod. in 1998) + 0.012*(IP-eng. & turb.)/(IP-eng. & turb.)
MI1(nominal) = MI1(real)*(PPI-fasteners)

Copyright 2002 Global Insight, Inc.
Market Index 1 vs. Historical SalesMarket Index 1 vs. Historical Sales
0
0.5
1
1.5
2
2.5
3
3.51
98
7
19
88
19
89
19
90
19
91
19
92
19
93
19
94
19
95
19
96
19
97
19
98
Ind
ex
19
87
= 1
.0
Penetration GainClient SalesClient Market Index
Actual sales growth exceeded that of the market index.
Three periods of interest: •1988-89.•1992-93.•1995-98.

Copyright 2002 Global Insight, Inc.
What We’ve Learned—Market Index 1What We’ve Learned—Market Index 1
• When markets are well-defined, the market index usually can be also.When markets are well-defined, the market index usually can be also.
• Building the market index should be a consensus-building effort. Building the market index should be a consensus-building effort. • This is a great way to encourage model buy-in by key executives.
• IP Index levels work well in defining a market index for products that are IP Index levels work well in defining a market index for products that are materials and supplies to the production process.materials and supplies to the production process.
• It is often not necessary to worry about undefined end markets (distributor It is often not necessary to worry about undefined end markets (distributor sales or “miscellaneous” sales). sales or “miscellaneous” sales). • Often, these have an end-market distribution similar to the known end-
markets.
• However, acquisitions need to be taken into account.However, acquisitions need to be taken into account.
• Be sure to match nominal sales with a nominal-valued market index; ditto Be sure to match nominal sales with a nominal-valued market index; ditto for unit sales and a constant-$ valued index. for unit sales and a constant-$ valued index.
• Confirm deviations between company sales and the market index.Confirm deviations between company sales and the market index.• Be sure the market index is not misspecified.
• Become comfortable with the rationale for the deviations.
• This process also contributes to model buy-in.

Copyright 2002 Global Insight, Inc.
Market Index 2 (Dupont)—Imprecise Market Index 2 (Dupont)—Imprecise Sales Distribution Data Sales Distribution Data
Vehicles Chems. Textiles Life Sci. Paper Etc
AN .1 .15 .3 0 .1 AR .15 .11 .26 .02 .03 BZ .15 .11 .26 .02 .03 CA .1 .05 .21 .05 .05 CH .1 .25 .1 .3 .05 EE .15 .09 .23 .09 .16 FR .15 .09 .23 .09 .16 GF .15 .09 .23 .09 .16 HK .1 .25 .1 .3 .05 ID .1 .15 .15 .25 .05 IN .2 .2 .1 .25 .05 IT .15 .09 .23 .09 .16 JA .15 .1 .12 .25 .05 KO .2 .25 .05 .28 .02 Etc.
• A global market index requires many more A global market index requires many more terms.terms.
• Global Insight’s World Industry Service, Global Insight’s World Industry Service, which tracks industrial activity across which tracks industrial activity across country, provided the drivers for this market country, provided the drivers for this market index. index.
• The index weights for this index were The index weights for this index were representational, based on management’s representational, based on management’s judgment. judgment. • Experienced, senior management often
have a good feel for the proper weightings.
• Alternative weighting schemes can be tested by constructing a sales-market index chart like that for Market Index 1.
Copyright 2002 Global Insight, Inc.
Market Index 2 vs. Historical and Market Index 2 vs. Historical and Future SalesFuture Sales
020100999897969594939291908988878685848382
12
10
8
6
4
2
0
-2
-4
-6
-8
-10
-12
%
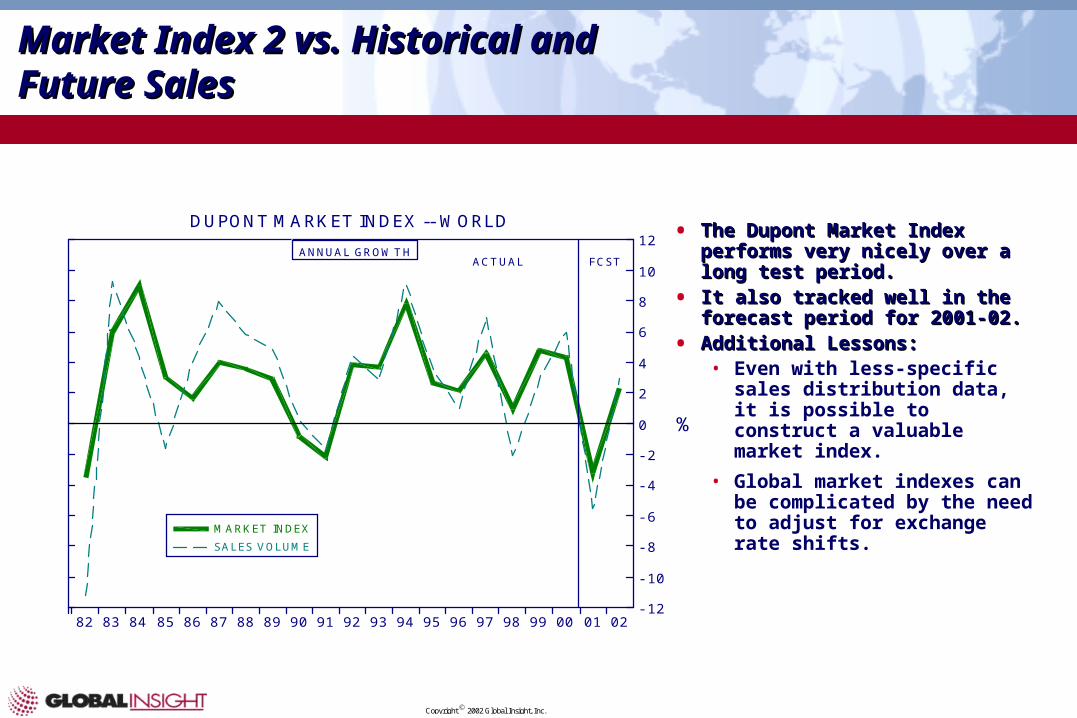
DUPONT MARKET INDEX -- WORLD
ANNUAL GROWTHACTUAL FCST
MARKET INDEXSALES VOLUME
• The Dupont Market Index The Dupont Market Index performs very nicely over a performs very nicely over a long test period.long test period.
• It also tracked well in the It also tracked well in the forecast period for 2001-02. forecast period for 2001-02.
• Additional Lessons:Additional Lessons:• Even with less-specific
sales distribution data, it is possible to construct a valuable market index.
• Global market indexes can be complicated by the need to adjust for exchange rate shifts.
Copyright 2002 Global Insight, Inc.
Market Index 3—Capital Equipment Market Index 3—Capital Equipment
• Capital equipment often present a special challenge in constructing a Capital equipment often present a special challenge in constructing a market index.market index.• Volatility is a hallmark of capital goods sales.
• Sales of capital goods tend to be “lumpy.”
• Market Index 3 is inspired by work we did for a manufacturer of Market Index 3 is inspired by work we did for a manufacturer of industrial air compressor equipment. industrial air compressor equipment. • We examined a variety of potential market indexes, but ultimately
found that manufacturing industrial production worked very well.
• Aggregate industrial production is itself a weighted market index.
• But, industry sales of air compressor equipment was far more volatile than manufacturing-sector industrial production.
• Economic theory suggests that capital equipment sales are more closely linked to the change in the market drivers, and we used this approach to refine the market index.

Copyright 2002 Global Insight, Inc.
Market Index 3-Level vs. Historical Market Index 3-Level vs. Historical SalesSales
0.6
0.8
1.0
1.2
1.4
1.6
1.8
1988 1990 1992 1994 1996 1998 2000 2002
Index of Real Air Compressor Equipment SalesManufacturing Industrial Prod Index
• As anticipated, manufacturing-As anticipated, manufacturing-sector industrial production is sector industrial production is “sorta” correlated with sales of “sorta” correlated with sales of industry air compressor industry air compressor equipment. equipment.
• But industry sales are much But industry sales are much more volatile than industrial more volatile than industrial production, both on the upside production, both on the upside and the downside. and the downside.
Copyright 2002 Global Insight, Inc.
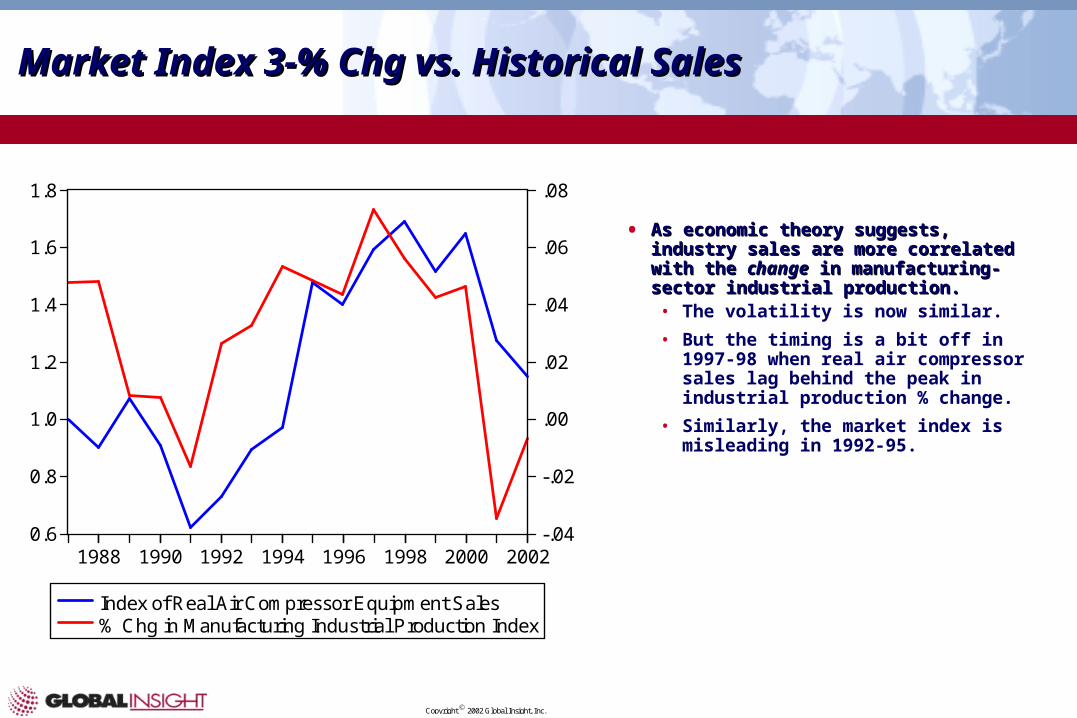
Market Index 3-% Chg vs. Historical SalesMarket Index 3-% Chg vs. Historical Sales
• As economic theory suggests, As economic theory suggests, industry sales are more correlated industry sales are more correlated with the with the changechange in manufacturing- in manufacturing-sector industrial production. sector industrial production. • The volatility is now similar.
• But the timing is a bit off in 1997-98 when real air compressor sales lag behind the peak in industrial production % change.
• Similarly, the market index is misleading in 1992-95.
0.6
0.8
1.0
1.2
1.4
1.6
1.8
-.04
-.02
.00
.02
.04
.06
.08
1988 1990 1992 1994 1996 1998 2000 2002
Index of Real Air Compressor Equipment Sales% Chg in Manufacturing Industrial Production Index

Copyright 2002 Global Insight, Inc.
Market Index 3-% Chg vs. Historical Market Index 3-% Chg vs. Historical SalesSales
• Smoothing the market index by first Smoothing the market index by first constructing a 3-year moving average constructing a 3-year moving average of it, then taking the % change of it, then taking the % change enhances its correlation with real air enhances its correlation with real air compressor sales.compressor sales.• Over 90% of the variation in real air
compressor sales is explained by this version of the market index.
• The index misleads in only three The index misleads in only three years, and the client already years, and the client already understood the reason for 1996.understood the reason for 1996.
0.6
0.8
1.0
1.2
1.4
1.6
1.8
2.0
-.01
.00
.01
.02
.03
.04
.05
.06
1988 1990 1992 1994 1996 1998 2000 2002
Index of Real Air Compressor Equipment Sales% Chg in 3-Year Movav of Mfg IP

Copyright 2002 Global Insight, Inc.
Data Sources for Building Market IndexesData Sources for Building Market Indexes
• Global Insight.Global Insight.
• Bureau of the Census (wholesale and retail trade, housing, Bureau of the Census (wholesale and retail trade, housing, population, trade).population, trade).
• Bureau of Economic Analysis (GDP, income, profits, Bureau of Economic Analysis (GDP, income, profits, government expenditures, compensation, inventories).government expenditures, compensation, inventories).
• Bureau of Labor Statistics (employment, wages, prices).Bureau of Labor Statistics (employment, wages, prices).
• Federal Reserve (industrial production) .Federal Reserve (industrial production) .
Today, all the federal government data is readily available through the web, Global Insight, or other private data
vendors.