Embed Size (px)
Citation preview

Practical approaches to
the analyses for pesticide
residues in essential oils
A report for the Rural Industries
Research and Development Corporation
by Sandra M. Garland
Prof. Robert C. Menary NW Davies
and Garth S. Oliver
July 2004
RIRDC Publication No 04/109 RIRDC Project No UT-36A

© 2004 Rural Industries Research and Development Corporation. All rights reserved. ISBN 1 74151 018 X ISSN 1440-6845 Practical approaches to the analyses for pesticide residues in essential oils Publication No. 04/109 Project No. UT-36A The views expressed and the conclusions reached in this publication are those of the author and not necessarily those of persons consulted. RIRDC shall not be responsible in any way whatsoever to any person who relies in whole or in part on the contents of this report. This publication is copyright. However, RIRDC encourages wide dissemination of its research, providing the Corporation is clearly acknowledged. For any other enquiries concerning reproduction, contact the Publications Manager on phone 02 6272 3186. Researcher Contact Details Prof. R. C. Menary Tasmanian Institute of Agricultural Research (TIAR) University of Tasmania GPO Box 252-54 HOBART Tas 7001 Phone: (03) 6226 2723 Fax:( (03) 6226 7609 Email: [email protected] In submitting this report, the researcher has agreed to RIRDC publishing this material in its edited form. RIRDC Contact Details Rural Industries Research and Development Corporation Level 1, AMA House 42 Macquarie Street BARTON ACT 2600 PO Box 4776 KINGSTON ACT 2604 Phone: 02 6272 4539 Fax: 02 6272 5877 Email: [email protected] Website: http://www.rirdc.gov.au Published in July 2004 Printed on environmentally friendly paper by Canprint
ii

Contents Acknowledgments...................................................................................................................... iv
Introduction....................................................................................................................... 1 Pesticides commonly used in the essential oil industry. ............................................................. 2 Abbreviations .............................................................................................................................. 3 Chemical Properties of Essential Oils......................................................................................... 4 Practical considerations for laboratory procedures in pesticide analyses ................................... 7
Categorisation of Pesticides ............................................................................................. 8 Chlorinated chemicals................................................................................................................. 8 Experiments undertaken for equipment assessment.................................................................. 10 Organophosphates ..................................................................................................................... 11 Urea Chemicals ......................................................................................................................... 14 Carbamate Derivatives .............................................................................................................. 16 Dithiocarbamates ...................................................................................................................... 17 Pesticides with Acidic Moieties ................................................................................................ 20 Quaternary Nitrogen Herbicides ............................................................................................... 22
Analytical Equipment..................................................................................................... 25 Gas Chromatography ................................................................................................................ 25 Liquid Chromatography ............................................................................................................ 57 Assessment of the application of ICP OES to the screening of essential oils........................... 84
Preliminary clean-up methodology ............................................................................... 87 Liquid / liquid extraction of pesticides from solvent extracted oils .......................................... 87 Preliminary Development of Solid Phase Extraction of Pesticides from Essential Oils........... 88 The application of ion exchange chromatography to the clean-up of acidic pesticides with detection by GC ECD................................................................................................................ 95
Literature Cited ............................................................................................................ 100
Appendix........................................................................................................................ 103
iii

Acknowledgments Our appreciation is extended to Dr Ashley Townsend whose expertise in ICP OES was instrumental in developing the methodology for the screening of essential oils for mancozeb contamination.
iv

Introduction
Many papers have been published detailing methods for the analysis of pesticide residues in
matrices such as water and vegetables. The detection of analytes in essential oils, however, has
specific problems associated. The chemical properties of the active ingredients of many
pesticides, such as polarity and retention behaviour in chromatography media, are often very
similar to those observed for components of essential oils.
Clean-up, or rather the limited applicability of standard pre-concentration steps, presents as the
greatest limitation. The greater majority of commercially produced, solid phase extraction
columns are designed to trap low levels of pesticide residues from large quantities of water. Even
in the analysis of vegetables, an aqueous phase is the predominant matrix from which pesticides
are absorbed. Essential oils are usually a complex mixture of medium polarity and non-polar
extracts of plant material concentrated to as little as 5% of the source material. Development of
an analytical methodology for any one contaminant can be achieved, but the pre-concentration of
a number of pesticide residues within one screen is problematic.
For the great majority of pesticides, the structure and chemical properties of the active ingredient
confer physical properties, such as polarity, solubility and elution characteristics which can be
used as a predictive indicator for their behaviour in clean-up methodology involving
chromatography. The components which present as the most likely to co-extract with essential
oils are, by the nature of their extractability, the most difficult to separate from the matrix and the
most likely to interfere with the analysis, having similar behaviour in liquid partition and
chromatographic methodologies. This manual is designed to provide an overview of the
applicability of the analytical technology generally available, to the detection of analytes.
Methodologies are designed based on the chemical type of the active ingredient.
The Manual can be read in conjunction with reports on four RIRDC projects detailing the
development of analytical techniques for the determination of pesticide minimum residue limits
in essential oils: UT-8A, UT-13A Publication No 98/123, UT23A Publication No 04/023 and UT-
36A Publication No 04/104.
1

Pesticides commonly used in the essential oil industry. Active ingredient Commercial Function
preparation acephate Orthene I asulam Asulox H bromacil & diuron Krovar H carbaryl Carbaryl I carbendazim Bavistan F chloropropham Allicide H chlorpyrifos Lorsban I clopyralid Lontrel H dicamba Dicamba H difenoconazole Score F dimethenamid Frontier H dimethoate Rogor I diuron Diuron H ethofumesate Tramat H fluazifop Fusilade H fluroxypyr Starane H glyphosate Roundup H haloxyfop Verdict H isoxaben Flexidor H linuron Linuron H mancozeb Dithane F MCPA MCPA H mecoprop mecoprop H monocrotophos Nuvacron I norflurazon Solicam H oryzalin Snapshot H oxyflurofen Goal H paraquat & diquat Gramoxone H pendimethalin Stomp H pirimicarb Pirimor I procymidone Sumisclex F prometryn Geasaguard H propazine Gesamil H propiconazole Tilt F sethoxydim Sertin H simazine Gesatop H sulfosulfuron Maverick H tebuconazole Folicur F terbacil Sinbar H trichlopyr Garlon H
Key : I - insecticide H - herbicide F - fungicide
2

Abbreviations ai active ingredient amu Atomic Mass Units APCI Atmospheric pressure chemical ionisation BAP Best Agricultural Practices C.E. collision energy DCM Dichloromethane DETA Diethylene triamine DMED Dimethyl ethylenebis(dithiocarbamate) ECD Electron Capture Detector ESI Electrospray ionisation ESP Electrospray FID Flame Ionisation Detector FPD Flame Photometric Detector GC Gas Chromatography HPLC High Pressure Liquid Chromatography HR High Resolution ICP OES Inductively Coupled Plasma Optical Emission Spectrophotometer LC Liquid chromatography MRL Maximum Residue Limit MS Mass Spectrometry MSD Mass Selective Detector MSDs Material Safety Data sheets MSMS Daughter Mass Spectra Generated by Fragmentation of a Parent Ion PDA. Photo Diode Array Detector R.P. Reverse Phase r.s.d. Relative Standard Deviation RVE. Rotary Vacuum Evaporation SIM Single Ion Monitoring SPE Solid Phase Extraction SPI Septum Equipped Programmable Injector TBAS Tetrabutylammonium hydrogen sulfate TIC Total Ion Chromatogram TLC Thin Layer Chromatography TSP Thermospray
3

Chemical Properties of Essential Oils Two of the most widely used methods for the production of essential oils include
solvent extraction and steam distillation. Concretes are produced by the steeping of raw plant
material in organic solvents such as petroleum ether, ethanol or acetone, with or without
maceration and agitation. The solvents are normally removed from the extracts by rotary vacuum
evaporation (RVE) at low temperatures (usually below 60°C). Absolutes are prepared by cold
filtration of chilled ethanol solutions of concretes, whereby waxes and other high molecular
weight, non-polar components are removed to produce a less viscous, more concentrated product.
Steam distilled oils, or essential oils, are those obtained by steam distillation. The distillation is
conducted at atmospheric pressure or at elevated pressures for products such as sandalwood oil,
patchouli oil, vetiver oil and several other oils composed mainly of sesquiterpenoid alcohols,
ketones and diterpenoids. All methods of essential oil production have implications for the
likelihood of pesticide residue contamination and confer associated chemical characteristics to be
considered when clean-up and analytical techniques are applied.
Whatever the method of essential oil production, one aspect is common for all pesticide
residues which do co-extract. The level of pesticide residues present in plant material is extracted
into a significantly smaller volume of oil, such that essential oil production, can in effect,
concentrate pesticide residues. With essential oil yields from plant material often in the vicinity
of 3 to 5% by weight, contamination of, for example, 1 mgkg-1 in harvested crops has the
potential to result in 20 a to 33 mgkg-1 level of contamination in the oil, assuming 100% recovery
of the residues.
Solvent extracts Concretes
Many concretes are produced by the extraction of flowers, leaves or buds using low
polarity organic solvents such as hexane and petroleum ether. Although the plant components
targeted by this production method are usually aromatic volatile chemicals, high amount of waxes
and non-volatiles are co-extracted. In addition, the co-extraction of any pesticide contaminant
present in the plant material is also more likely occur in the production of concretes, as opposed
to steam distilled oils.
In most of the concretes produced in Australia, fresh or frozen material is used. Water
content is often quite high, as much as 50% of the weight of plant material. For highly polar
pesticides this increases the likelihood that much of residues present will remain in the vegetative
4

material. Highly water soluble pesticides, such as the quaternary ammonium salts, should not co-
extract with the oil components. However, a great number of commonly used pesticides are
readily soluble in organic solvents, having similar polarities and solubilities to many of the
desirable essential oil components such as hydrocarbons and oxygenated hydrocarbons.
Concretes are also the most chemically complex of the oils produced using the various
production methods. As such, clean-up techniques are almost essential, as solvent extracts often
contain non-volatile components not amenable to gas chromatography (GC) or liquid
chromatography (LC).
Absolutes
Many of the considerations presented for concretes also apply to absolutes. However, the
cold ethanol extraction process usually removes many of the waxes and lipids common to
concretes which would otherwise present difficulties for volatilisation in GC or contaminate
columns in liquid chromatography. However, the likelihood of co-extraction of moderately polar
pesticide residue remains. The removal of contaminants which precipitate out with the waxy
components during the production of absolutes, is only relevant to lipophilic chemicals.
Distilled Oils Distilled oils, by the nature of their production, have few contaminants that are non-volatile.
This has implications, not only for the degree of clean-up required, but also implies that non-
volatile residues should not be present in the oil. However, even non-volatile contaminants may
be carried over in the distillation process when water droplets or particulate matter, splashed to
the head of the distillation vessel, are washed through to the distillate. Whatever the process,
pesticide residues are commonly detected in distilled oil. (Gould, 1960; Starr et al., 1963; Ballee
et al., 1970, Garland et al., 1999). With sufficiently low detector sensitivity and specificity,
analysis by GC may be conducted with no clean-up and little risk of accelerated GC column
deterioration. Similarly, contamination of reverse phase LC columns presents as a minor
consideration.
For water soluble pesticides, however, steam distillation may present almost as a process for
contaminant removal. The steam generated in the distillation process condenses to liquid and is
recycled through a boiler in a closed system. Water is continuously washing through the oil
collected, extracting much of any water soluble, co-distilled contaminants.
In all, however, contamination of distilled oils with volatile, moderately polar pesticide
residues is a common occurrence.
5

Table 1 lists some of the chemicals that are found in some of the major essential oils in
Australian production.
Parsley (distilled)
Fennel (distilled)
Peppermint (distilled)
Boronia (solvent extract)
α-pinene α-pinene α-pinene α-pinene
β-pinene myrcene β-pinene camphene
sabinene α-phellandrene sabinene β-pinene
myrcene limonene myrcene sabinene
α-phellandrene β-phellandrene limonene δ-3-carene
limonene 1,8-cineole 1,8-cineole limonene
β-phellandrene cis-β-ocimene cis-β-ocimene β-phellandrene
p-cymene fenchone γ-terpinene terpinolene
α-terpinolene estragole 3-octanol ethyl octanoate
p-menthatriene trans-anethole sabinene hydrate 2,6-dimethyl- 3,7 –octadiene-2,6- diol
α,p-dimethylstyrene menthone dihydro β-ionone
carotol menthofuran dodecanol tetramethoxy allyl benzene isomenthone β-ionone
elemicin β-bourbonene sesquicineole myristcin linalool dodecyl acetate apiole menthyl acetate methyl jasmonate
neomenthol methyl epi jasmonate caryophyllene heptadec-8-ene terpinen-4-ol menthol pulegone isomenthol germacrene D piperitone
Table 1. Chemical composition of essential oils
6

Practical considerations for laboratory procedures in pesticide analyses A simple guide to beginners to the field of pesticides analysis is listed. It is not intended to
be a comprehensive guide to all sources of information and suggestions for specific procedures
are to be instigated in addition to standard protocols common to good laboratory practices.
• Collect as much information concerning the chemical nature of the pesticides and reagents to
be used in all procedures. This information provides a starting point from which to assess the
methodologies most suited to the chemical type and creates an awareness of significant safety
issues including toxicity and potentially hazardous materials. Sources of information include:
Merck index;
pesticide handbooks;
material safety data sheets;
- available in coordinated databases marketed in comprehensive CD forms
- provided by chemical companies such as Sigma Aldrich
- available through several web sites, including
http://ace.orst.edu/info/extoxnet/
standard literature data base search engines
• Internationally standardised analytical methods usually specify detection limits to at least 1
mgkg-1 and can extend to the µgkg-1 level. In the preparation of samples and standards, the
potential for contamination is very high. Procedures within an analytical laboratory must
adhere to strict guidelines to prevent contamination and achieve reproducibility. Listed
below are a few recommended precautions:
All glassware should be washed with appropriate cleansers such as alkaline Extran® with
neutralising washes of Galley® then repeated washing with distilled water. Heating
glassware at 440° is also an option though vessels may become brittle.
Solvents should be commercially sourced and designated pesticide-grade or redistilled in
decontaminated glass stills.
At the commencement of each day of analysis, all surfaces should be wiped clean before
chemicals and standard solutions from storage areas are introduced into the working area.
Disposable bench liners are useful for reducing contamination risk. Be aware of the
surface which have come into contact with pesticides and pesticide solutions. When
7

syringes are used to dispense standard solutions, place on a dedicated tissue between
applications and discard the tissue at the end of each procedure.
Prepare all samples to be screened for pesticide residues prior to any procedures which
involve pesticide standard solutions such as those used to spike samples to establish
standard curves and estimate recoveries. If practicable, complete the sample preparation
and seal the vials from which the final aliquot is to be sub-sampled prior to the
introduction of standard solutions to the working area.
Dedicate syringes to preparations of standard curves and the spiking of samples with
pesticide solutions. Have a separate set for the work-up of samples to be screened.
Fortification of solvents and samples should proceed from the more dilute to the highest
concentration, to minimise risk of contamination.
Operators should observe all safety guidelines to comply with material safety data
sheets (MSDs) protocols.
Categorisation of Pesticides In the development of any pesticide, a particular mode of action, such as cholinesterase
inhibition, inhibition of cell division or excessive stimulation of weed growth, is usually
conferred by the inclusion of functional groups into the structure of the chemical. Distinct classes
of pesticides are formed based on the chemical nature of these functional moieties. The chemical
type of a pesticide also has implications in terms of their potential to contaminate essential oils.
The functional groups unique to each class of pesticides, then, may confer the properties which
affect:
• translocation through plants and soils, important in terms of incorporation into plant material
and potential for root uptake by current and sequential crops;
• stability and residual time, which relates to their potential to still be present at harvest;
• extractability, related to the solubilities and volatility during essential oil production.
In addition, the chemical properties of pesticides have implications in the design of analytical
methodology specific to their separation and detection.
Chlorinated chemicals The organochlorine pesticides are an extensive groups of chemicals which include
chlorotriazoles, which function as systemic fungicides, and chlorotriazines, which are broad-
spectrum residual herbicides, used for pre and post emergence weed control. Within the essential
8

oil industry these chemicals are at the highest risk of presenting as contaminants in products due
to their systemic nature and the similarity of their chemical properties, such as polarity and
volatility, to those of sesquiterpenes and oxygenated sesquiterpenes common to many essential
oils. The aromatic qualities of the sesquiterpenes and oxygenated sesquiterpenes have ensured
that industrial extraction protocols are designed to maximise their yield, with the concomitant
effective extraction of many organochlorines.
Many organochlorines are very stable, which in addition with their translocation and
absorption properties, are prone to bioaccumulation. None the less, many organochlorines used
within the essential oil industry have high efficacy with little to no residue at harvest time.
In terms of analytical methodology the organochlorines are often amenable to GC and
LC. However, as many have polarities similar to essential oil components, they are often the
most difficult to pre-concentrate or separate from the matrix. The halogenation does, however,
provide for the specificity germane to detection by Electron Capture Detectors (ECD) and
distinctive isotope patterns in mass spectral analysis (MS).
Clean-up - The effectiveness of standard clean-up methodology is limited for the reasons already
outlined. With sufficient dedicated resources, however, modern solid phase extraction (SPE)
products may allow for the development of an effective pre-concentration step for any particular
organochlorine residue in essential oils. The similarity in properties of many of these types of
pesticides to the components within essential oils, makes the development of a cost-effective
multi-residue screen using standard SPE techniques difficult. Liquid / liquid partition can remove
many of the waxes and non-polar components of concretes, and to a lesser extent, distilled oils.
The inclusion of such as preliminary clean-up can significantly reduce the loading in to GC
injectors. For LC systems, particularly those employing columns with non-polar phases such as
C18, the life of the guard column and columns can be significantly extended and the need for
washing of the columns with extended runs can be reduced. However the simple liquid / liquid
partition step described on page 91 is only a clean-up step with no corresponding pre-
concentration of target analyte. Preliminary development of an SPE methodology is described on
page 92, which despite some poor recoveries, provides for a pre-concentration of target analytes
and allows for the introduction of larger sample volumes into instrumentation.
Analysis - The majority of organochlorines are sufficiently volatile and thermally stable to be
amenable to gas chromatography. The interaction with the liquid phase of the capillary columns
is often specific to the analyte, such that many of the triazines elute with excellent
9

chromatographic characteristics, presenting sharp, well-defined peaks. The triazoles, on the other
hand, may present with poor peak shape and significant tailing, especially as the column ages -
trial and error of each, will quickly distinguish which analytes have poor chromatographic
properties and some experimentation with different liquid phases should be investigated. In
general, however, the standard phenyl substituted silicones are effective in the separation of many
organochlorines.
As with gas chromatography, organochlorines are, in general, amenable to reverse phase
high pressure liquid chromatography (RP HLPC) with elution profiles and chromatographic
properties specific to each analyte determined by trial and error.
Experiments undertaken for equipment assessment
GC ECD Detection limits established 0.1 to 5 mgkg-1 page 45
(retention time insufficient for unequivocal peak identification)
GC HRMS Detection limits established 0.01 to 1 mgkg-1 page 56
(highly specific and quantitative, specialised equipment required)
LC MSMS Detection limits established 0.01 to 1 mgkg-1 pages 72, 74
(ionisation and response specific for each pesticide)
Properties typical of a commonly used organochlorine as exemplified by simazine
Simazine is a selective triazine herbicide used to control broad-leaved weeds and annual grasses.
It acts to inhibit photosynthesis (Kidd et al., 1991, Weed Sci. Soc. Am., 1994). It is moderately
persistent with an average field half-life of 60 days (Wauchope et al. 1992). In high pH soils,
residual activity may remain for a year after application (2 to 4 kgha-1). Its low water solubility,
however, makes it less mobile, limiting its leaching potential (Weed Sci. Soc. Am., 1994). Plants
absorb simazine mainly through the roots, with little or no foliar penetration. From the roots, it is
translocated upward to the stems, leaves, and growing shoots of the plant (Kidd et al. 1991, Weed
Sci. Soc. Am., 1994).
10

Physical Properties:
Chemical Name: 6-chloro-N2,N4-diethyl-1,3,5-triazine-2,4-diamine
N N
NC2H5NH Cl
NHC2H5simazine
6-chloro-N,N-diethyl-1,3,5-triazine-2,4-diamine Molecular Weight: 201.70
Solubility: water - 5 mgL-1 @ 20°C, soluble in methanol, chloroform, and diethyl ether
Melting Point: 225-227°C (Kidd et al. 1991)
Vapour Pressure: 0.000810 mPa @ 20°C
Partition Coefficient: 1.9600
Adsorption Coefficient: 130 (Wauchope et al. 1992)
Organophosphates The organophosphate pesticides used predominantly in the essential oil industry are low
molecular weight chemicals (< 350) often with low ratios of carbon to oxygen and sometimes
chlorine atoms, which confers a degree of polarity as evidenced by their high solubility in water
and polar organic solvents such as acetone. This group of pesticides which act as potent
cholinesterase inhibitors, generally have lower persistence and bioaccumulation compared with
organochlorines, but are regarded as highly toxic. Examples dealt with specifically in this study
are monocrotophos, acephate and chlorpyrifos. All are soluble in water and the organic solvents
used in essential oil production.
The polarities of many of the organophosphates, as for the organochlorines, are similar to
those of the oxygenated monoterpenes and sesquiterpenes. The presence of a phosphorus atom is
the singular feature which delineates them from the greater body of pesticides. Specifically then,
delineating organophosphates into a distinct class is useful only in the context of their chemical
stability ie. likelihood of residual time, extractability in normal operations of essential oil
production and lability in analytical processes. As a functional moiety able to be exploited for
analytical methodology, the phosphorus atom only confers the specificity compatible with flame
photometric detection (FPD) in the phosphorus mode or a nitrogen, phosphorous detector (NPD).
In most other respects the suitability of GC, LC and the related methods of detection, has the
same potential and disadvantages as any other of the pesticide classes. Toxicity, ionisation
11

potential and polarity specific for each organophosphate must be assessed, with considerations
given to their increased propensity to degradation. Analytical methodology should be adopted on
the basis of, range of application, expense and robustness.
Clean-up - The effectiveness of standard clean-up methodology is limited as the polarities of
organophosphates are similar to those of essential oil components. Although modern SPE
products may allow for the development of an effective pre-concentration step for any particular
organophosphates, the co-elution of these pesticides with essential oil components makes the
development of a cost-effective clean-up technique for multiple pesticides in a single screen
difficult. In addition, the total number of organophosphates used widely in the essential oil
industry is insufficient to warrant a separate, dedicated screen for the class. However a simple
liquid /liquid partition step is described for a range of pesticides in solvent extracted concretes,
including some organophosphates, on page 91. The method described results in a dilution of the
pesticides and oil components into a larger volume of solvent but reduces the loading of non-
polar components into GC injectors and onto LC columns in subsequent analysis. Page 92 details
a preliminary work-up for a clean-up and pre-concentration step using SPE.
Analysis - The majority of organophosphates are sufficiently volatile to be amenable to gas
chromatography. However, when applied to the most widely used methyl silicone, non-polar
liquid phases used in capillary GC, many of these analytes have poor chromatographic properties,
with peak tailing especially pronounced as the column ages. Trial and error will quickly
distinguish which analytes have poor chromatographic properties and some experimentation with
different liquid phases should be investigated.
Organophosphates have been found to be amenable to RP HPLC with elution profiles and
chromatographic properties specific to each analyte determined by trial and error. Some
organophosphates, such as monocrotophos, are degraded in low molecular weight alcohols and
this susceptibility should be taken into account in the design of analytical methodology.
12

Experiments undertaken for equipment assessment
GC ECD (organophosphates which are also halogenated) Detection limits established 0.1
to 5 mgkg-1 page 45
(retention time insufficient for unequivocal peak identification)
GC NPD Preliminary assessment page 47
GC HRMS Detection limits established 0.01 to 1 mgkg-1 page 56
(highly specific and quantitative, specialised equipment required)
LC MSMS Detection limits established 0.01 to 1 mgkg-1 page 70, 74
Properties typical of commonly used organophosphates as exemplified by acephate and
monocrotophos.
Acephate is an organophosphate foliar spray insecticide used for control of a wide range of biting
and sucking insects. The residual systemic activity is around 10-15 days at the recommended
application rate (Thomson, 1992).
Physical Properties:
PCH3CNH
OCH3
SCH3
O O
acephateacetylphosphoroamidothioic acid O,S-dimethyl ester
Appearance: Colourless to white solid (Montgomery, 1993), Molecular Weight: 183.17
Solubility: water 650, acetone 151, ethanol < 50, ethyl acetate 35, benzene 16, hexane 0.1 (all in
g/100 ml at 20°C) (Worthing, 1987)
Melting Point: 93 °C (Kidd et al., 1991)
Sufficiently volatile for GC
Monocrotophos is a systemic insecticide and acaricide which has a low environmental
persistence. It has a half-life of 1.3 to 3.4 days on plant foliage (Chambers et al., 1992).
Physical Properties:
H
CONHCH3
O(CH3O)2P
CH3
O
monocrotophos
Dimethyl 1-methyl-3-(methylamino)-3-oxo-1-propenyl phosphate
Monocrotophos is a reddish brown crystalline solid with a mild odour. M. W.: 223.2
13
Water Solubility: Soluble in water, acetone and alcohol (Meister, 1992)
Melting Point: 54-55 °C
Partition Coefficient: -0.22
Urea Chemicals Phenyl-substituted ureas are used extensively in agriculture as selective herbicides,
mainly for pre-and post- emergence and they act by inhibiting photosynthesis. Commonly used
substituted ureas are linuron and diuron, which have low residual action and persistence. Both
are soluble in the organic solvents used in the essential oil industry and sufficiently labile to co-
distil with oils in steam distillation.
Clean-up - The solubility of the substituted ureas in water is a parameter which may be exploited
in clean-up methodologies. The polarities and chemical distinction of the ureas are also features
which may be exploited using SPE and other chromatographic products. The total number of this
class of pesticide used in the essential oil industry is limited, however, such that the development
of a specific extraction protocol would not be cost effective. However, the inclusion of the urea
based chemicals in a protocol which may effectively pre-concentrate other water soluble
pesticides, such as the herbicides with acidic moieties including dicamba and fluazifop acid, may
be cost effective. Several experiments have been conducted for the acidic moiety pesticides
(page 77) and may have direct application to the substituted ureas.
Analysis - The application of GC to phenylurea pesticides is difficult because these compounds
are thermally unstable and rapidly degrade to isocyanates and amines (Buchert et al. 1975,
Deleu, R. et al. 1979, Mattern, G. C. et al. 1989). Thermal reactions in the detector and on the
columns result in a lack of reproducibility and incomplete thermal degradation preclude the
monitoring of the degradation products for a quantitative screen. However, the breakdown
products have been monitored by GC ECD and high resolution mass spectrometry (HRMS) and
residues have been detected in oils produced from field trials using this technology. Linuron and
diuron degrade to the same thermal breakdown product and so are indistinguishable using this
analysis method. Derivatisation to compounds which are more thermally stable would provide
for a more reliable screen.
The application of RP HPLC is also problematic. Under the LC conditions trialed using
acetonitrile/phosphate buffer, both urea herbicides were degraded. Detection by ion trap MS/MS
was also limited. Linuron was ionised by atmospheric pressure chemical ionisation (APCI), but
14

the response was poor. Trials are continuing to optimise the mobile phase, specifically the pH, as
urea derivatives are sensitive to slight variations in this parameter.
Experiments undertaken for equipment assessment
GC ECD Preliminary experimentation page 45
GC HRMS Detection limits established 1 mgkg-1 page 56
(not specific as ion produced is identical for linuron and diuron)
LC MSMS Detection limits not established page 67
(poor chromatographic properties & poor ionisation in +ive mode APCI)
Properties typical of commonly used, urea based herbicide as exemplified by linuron
Linuron is a substituted urea, pre- and post-emergence herbicide used to control annual and
perennial broadleaf and grassy weeds. It works by inhibiting photosynthesis in target weed
plants. Linuron is slightly to moderately soluble in water, and is not readily broken down in
water (U.S. Nat. Lib. Med., 1995). It is more readily absorbed by roots from soil application,
than by leaves from foliar application (Weed Sci. Soc. Am. 1994). The rate at which it is
absorbed, translocated, and subsequently broken down (or metabolised) differs with various plant
species (Weed Sci. Soc. Am. 1994).
Physical Properties:
Cl
Cl
NHCONCH 3
OCH3
linuron3-(3',4'-dichlorophenyl)-1-methoxy-1-methylurea)
Appearance: Linuron is an odourless, white crystalline solid (Kidd et al, 1991).
Chemical Name: 3-(3,4-dichlorophenyl)-1-methoxy-1-methylurea
Molecular Weight: 249.11
15

Water Solubility: 81 mgL-1 @ 25°C, slightly soluble. Soluble in aliphatic hydrocarbons and
acetone and moderately soluble in ethanol (Kidd et al, 1991)
Melting Point: 93-94°C (Kidd et al, 1991)
Vapour Pressure: 2 mPa @ 24°C
Partition Coefficient: 3.0043 (Kidd et al, 1991)
Adsorption Coefficient: 400 (Wauchope et al. 1992)
Carbamate Derivatives The carbamates are N-substituted esters of carbamic acid and act as cholinesterase
inhibitors that confer insecticidal activity. Their effects are generally less intense than the
organophosphates and they have low persistence in the environment.
Solubilities of the carbamates can vary quite dramatically. Although the likelihood of the
co-extraction of different carbamates will vary with varying representatives of this chemical
class, the potential to co-extract with concretes and absolutes is high. This is particularly true for
the carbamate pesticides commonly encountered in the Australian industry, carbendazim and
carbaryl.
Clean-up - The solubilities of carbamates are quite varied, such that it is difficult to develop one
clean-up procedure which is equally effective for all types. The carbamates used in the essential
oil industry include carbendazim and carbaryl which are of intermediate polarity such that it is
again difficult to remove co-extracting essential oil components in analytical methodologies.
Analysis - The majority of N-substituted carbamates are thermally unstable and therefore not
amenable to GC. The breakdown product of carbaryl, naphthalene, has been monitored, but low
levels of this latter chemical may be found to be endogenous to essential oils. Derivatisation to
thermally stable products presents as the only option if GC is the preferred analytical
methodology. LC is more suited to the analysis of this chemical type.
Experiments undertaken for equipment assessment
LC MSMS reverse phasae HPLC and with ionisation in +ive APCI page 69
16

Properties typical of commonly used carbamate as exemplified by carbaryl.
N
O
H
carbaryl1-naphthyl-N-methylcarbamate
CH3
Carbaryl is a wide-spectrum carbamate insecticide and an acaricide. Degradation of carbaryl in
crops occurs by hydrolysis within the plants. It has a short residual life of less than 2 weeks.
Physical Properties:
Carbaryl is stable to heat, light, and acids. It is not stable under alkaline conditions.
Chemical Name: 1-naphthyl-N-methylcarbamate
CAS Number: 63-25-2
Molecular Weight: 199.25
Water Solubility: 40 mgL-1 @ 30°C. Soluble in dimethylformamide, acetone, cyclohexanone.
(U.S. Environ. Prot. Agency, 1988)
Melting Point: 142°C
Vapour Pressure: <5.3 mPa @ 25°C
Partition Coefficient: Not Available
Adsorption Coefficient: 300 (U.S. Environ. Prot. Agency,1988)
Dithiocarbamates Dithiocarbamates are broad spectrum pesticides used widely in the essential oil industry
to control fungal diseases such as rust. They are non-systemic, contact fungicides which remain
on the surface of the plants until degraded or washed off with rain or abrasion. Dithiocarbamates
are heat labile and degrade to a number of products including ethylenethiourea (ETU), which is
soluble in water and readily absorbed and metabolised in plants. ETU is suspected to have
goitrogenic, carcinogenic, mutagenic and tetragenic properties (Graham, 1973, 1972).
The dithiocarbamate fungicide most commonly used in the essential oil industry is
Dithane, whose active ingredient is mancozeb. As a polymeric salt of ethylenebisdithiocarbamic
acid, containing 20% manganese and 2.5% zinc, it is insoluble in most organic solvents and
water, is non-volatile and labile. It would seem unlikely that residues would contaminate
17

essential oil, whether solvent extracted or distilled. This, of course, does not preclude the
possibility of ETU contamination and neither does it remove the need to confirm the absence of
residues of the parent dithiocarbamate, considering the high and frequent applications
implemented in commercial crops.
Clean-up - The lack of solubility of mancozeb and related dithiocarbamates in water and organic
solvents, in addition to precluding their co-extraction in the production of essential oil, also
presents as a chemical property which may be exploited in potential clean-up techniques. The
standard method of analysis is the headspace analysis of carbon disulfide produced by digestion
of residues in acidified stannous chloride, with analysis by GC and detection by FPD (Cullen,
1964; Keppel, 1969). It could be assumed that this methodology would remove the bulk of the
components of essential oils. However, sulfur chemicals are endogenous to many essential oils,
such as 4-methoxy-2-methyl-2-mercaptobutane in blackcurrant oil (Rigaud et al., 1986). Many of
these components are associated with quality oils and extraction protocols are adapted to
maximise yields. Levels of sulfur compounds in blackcurrants are as high as 50 mgkg-1 in some
clonal material (Garland et al., 2002). Headspace analysis of the acidified stannous chloride
digest of peppermint oil, known to be free of dithiocarbamate pesticides, found background levels
of carbon disulfide of the order of 5 mgkg-1 (page 86).
Research, instead, has focussed on the extraction of residues of thiocarbamates with
EDTA, which acts as a chelating agent to solubilise the metal complexes into partly neutralised
sodium hydroxide solutions (pages 87, 89). In the analysis of essential oils this presents as an
excellent clean-up protocol, assuming the interface of the oil and aqueous extraction solution is
sufficient to effect reproducible recoveries.
Ethylenethiourea, as for many of the organochlorines and organophosphates, is soluble in
the solvents used to produce essential oils and many of the problems associated with these
chemicals also apply to the clean-up of ETU from essential oils.
Analysis - The most widely used method of carbon disulfide production using acidified stannous
chloride is not sufficiently specific for the detection of residues of thiocarbamates and
background levels of endogenous sulfur compounds preclude this method for qualitative and
quantitative analysis. Detection of ethylene diamine, a side product of this reaction was not
successful (page 86). Research has been conducted whereby EDTA / NaOH solutions are used to
extract residues of the metal complexes of the fungicides which form sodium salts of the N, N-
ethylenebis(dithiocarbamate). Two methods for the quantification of these salts include
18

derivatisation using methyl iodide and analysed by LC MSMS, which had limited success (page
87), and the application of Inductively Coupled Plasma Optical Emission Spectrophotometer
(ICP-OES). ICP OES was successfully applied to measure the manganese from mancozeb, which
had been chelated in partly neutralised NaOH / EDTA solution (page 89).
Experiments undertaken for equipment assessment
GC FPD Carbon disulfide produced by acidified stannous chloride page 46
(not specific)
LC MSMS Preliminary investigation of EDTA extraction and methyl iodide derivatisation of
N, N-ethylenebis(dithiocarbamate) page 107
ICP OES Elevated levels of manganese used as a marker for mancozeb contamination
Page 111
Properties typical of commonly used dithiocarbamate as exemplified by mancozeb
Mancozeb is used to protect many fruit, vegetable, nut and field crops against a wide spectrum of
fungal diseases and is used in the essential oil industry to control rust. Mancozeb is of low soil
persistence, with a reported field half-life of 1 to 7 days (Wauchope, et al., 1992). Mancozeb
rapidly and spontaneously degrades to ETU in the presence of water and oxygen (U.S. Environ.
Prot. Agency, 1988). ETU may persist for longer, on the order of 5 to 10 weeks (Wauchope, et
al., 1992).
Physical Properties:
-Mn-
x:y 10:1
yx
ZnHH
S
SCNCH2CH2NCS
S2-
2+
Chemical Name: manganese ethylenebis(dithiocarbamate) (polymeric)
Molecular Weight: 266.31
Water Solubility: 6 mgL-1 -Practically insoluble in most organic solvents (Kidd et al. 1991)
Melting Point: Decomposes without melting @ 192 ˚C
Vapour Pressure: Negligible @ 20 ˚C
Adsorption Coefficient: >2000
19

Pesticides with Acidic Moieties This class of broad leaf weed killers include a large range of carboxylic acid herbicides.
Some of the pesticides are applied in chemical formulations as esters, which decompose to the
acidic form under alkaline or acidic conditions. Translocation of the acidic pesticides then takes
place in the roots of treated plants. The breakdown of most alkanoic acids is rapid.
The acid forms are highly water soluble and less likely to be extracted during the
production of essential oils than the parent esters, which are soluble in organic solvents.
Clean-up - Relevant aspects of the analysis of the ester forms of many of these chlorinated
herbicides are similar to those already discussed. The polarity and solubility characteristics
closely mimic those of the oxygenated monoterpenes and sesquiterpenes which constitute many
essential oils, making separation from such matrices difficult. The excellent retention
characteristics under GC and LC, combined with the specificity afforded by ECD of the
chlorinated moieties of this chemical class, and by high resolution MS and ion trap MS, are often
sufficient to allow for the analysis of oils without residue pre-concentration.
The acidic forms of this class of pesticide, however, are water soluble, which confers a
physical parameter on which clean-up protocols may be designed. Aqueous extractions of
essential oils for the pre-concentration and removal of interfering matrix components present as
the most promising approach (page 75). In an alkaline solution, the carboxylic acid moiety of the
herbicides is de-protonated, such that the polarity of resultant ion moderates any non-polar
characteristics of the remaining organic molecular framework of the residues. This facilitates
extraction across the interface between an organic oil phase and an aqueous solution. Ion
exchange chromatography also presents as a promising method of pre-concentration of aqueous
extracts of essential oils (page 100).
Analysis - The parent esters of pesticides with acidic moieties follow the same considerations as
previously discussed for the organochlorines. They are directly amenable to GC and elute in the
same time frame as many of the oxygenated sesquiterpenes. Acidic moieties are not amenable to
GC. However, many derivatisation steps, such as methylation or trimethylsilylation can convert
acidic pesticides to esters compatible with GC. Phenoxy based herbicides are detected in
essential oils using HRMS without clean-up (page 58) and preliminary experiments with GC
ECD of the ester derivatives will allow for detection to 1 mgkg-1 (page 45 and page 99).
However, the exploitation of the water solubility of acidic moieties to clean-up oil residues from
oil matrices will not be compatible with many of these derivatisation processes, unless the
20

residues are re-extracted from the aqueous phase. Anion exchange discs were used to trap de-
protonated acid based pesticides. The discs were dried then the acids derivatised and eluted with
methyl iodide (page 99). Alternatively, a re-protonation of the acidic herbicide residues, by
acidifying the alkaline extracting solution, would facilitate the re-extraction of the herbicides
back into an organic solvent such as dichloromethane. Limited success in terms of recovery has
been achieved in preliminary experiments investigating such an extraction protocol.
The most promising line of research, however, is the extraction of acidic herbicides into
an aqueous solution with analysis by LC interfaced with APCI in the negative mode and detection
using ion trap MSMS (page 77)
Experiments undertaken for equipment assessment
GC ECD Detection limits established for parent esters - 5 mgkg-1 page 45
(not sufficiently specific)
Preliminary method development using ion exchange discs page 99
GC HRMS Detection limits established for parent esters - 0.1 - 1 mgkg-1
(acidic moieties require derivatisation) ; page 58
LC MSMS Excellent chromatography good ionisation in -ive APCI page 78
Properties typical of commonly used acidic herbicide as exemplified by dicamba
Dicamba is a benzoic acid herbicide. It can be applied to the leaves or to the soil to control
annual and perennial broadleaf weeds. It is moderately persistent in soil having a typical half-life
of 1 to 4 weeks (Wauchope et al., 1992). The rate of biodegradation increases with temperature
and increasing soil moisture, and tends to be faster when soil is slightly acidic. Dicamba is
rapidly taken up by the leaves and roots of plants, and it is readily translocated to other plant
parts. It some plant species, dicamba accumulates in the tips of mature leaves (Weed Sci. Soc.
Am., 1994)
21

Physical properties
Cl
Cl
COOH
OCH3
dicamba(3.6-dichloro-2-methoxybenzoic acid)
Chemical Name: 3,6-dichloro-2-methoxybenzoic acid
Molecular Weight: 221.04
Water Solubility: 6500 mg/L @ 25°C. Soluble in acetone, dichloromethane, ethanol, toluene and
Xylene. (Kidd et al., 1991)
Melting Point: 114-116°C
Vapour Pressure: 4.5 mPa @ 25°C
Partition Coefficient: -0.5376
Adsorption Coefficient: 2 (salt)
Quaternary Nitrogen Herbicides The pesticides of this class used most frequently in Australia are paraquat and diquat.
They are used for broadleaf weed control. They are quick acting, non-selective, contact poisons
which are also translocated through the plant. Paraquat and diquat degrade slowly when exposed
to sunlight but are otherwise quite resistant to microbial degradation and can persist indefinitely
when bound to soil particles. The dichloride salts are stable to heat in acidic or neutral solutions
but are hydrolysed by alkaline solutions.
Paraquat and diquat are very soluble in water, have very low solubility in the lower
alcohols and are insoluble in hydrocarbons. The likelihood of residues in solvent extracted
essential oils is therefore very low. The processes associated with the production of steam
distilled oils, where the oil is collected from a stream of condensed water and volatiles, would act
to continuously extract water soluble chemicals. As for all potential contaminants, however, it is
necessary to conclusively certify that no detectable pesticide residues are present in oils.
Clean-up - As with most of the pesticides which are unlikely to contaminate essential oils, the
chemical properties which preclude their extraction in oil production are also properties which
may be used to extract them from essential oils should contamination occur. Very few essential
22

oil components extract into water, whereas, providing there is a sufficient area of phase interface,
paraquat and diquat should easily move into an aqueous solution from an organic phase.
Analysis - The quaternary ammonium herbicides are not amenable to GC. LC is limited usually
requiring the inclusion of ion-pair reagents or the analytes must be derivatised. This presents
limitations as to compatible detectors, as ion pair reagents preclude the use of some ionisation
sources in LC MS interfaces. A highly sensitive and specific methodology using direct injection
of water extracted samples into an electrospray ionisation (ESI) module configerated with an MS
ion trap has been developed.
Experiments undertaken for equipment assessment
LC MSMS Not compatible to LC owing to high absorption on surfaces
(detection limit to 0.01 mgkg-1 ) ; page 85
Properties typical of commonly used quaternary nitrogen pesticide as exemplified by paraquat
Paraquat is a quaternary nitrogen herbicide widely used for broadleaf weed control. It is a
quick-acting, non-selective compound, that destroys green plant tissue on contact (and by
translocation within the plant). It is a highly toxic compound and is highly persistent in the soil
environment, with a reported field half-life of greater than 1000 days (Wauchope et al., 1992).
The reported half-life for paraquat in one study ranged from 16 months (aerobic laboratory
conditions) to 13 years (field study) (Rao et al., 1980). Ultraviolet light, sunlight, and soil
microorganisms can degrade paraquat to products which are less toxic than the parent compound.
Physical Properties:
N N
paraquat
CH3H3C
2+
2Cl-
Chemical Name: 1,1'-dimethyl-4,4'-bipyridinium dichloride (Kidd et al., 1991)
Molecular Weight: 257.20
Water Solubility: 700 gL-1 @ 20°C. The dichloride salt is sparingly soluble in lower alcohols
(Kidd at al, 1991)
Melting Point: Decomposes @ 300°C
Vapour Pressure: Negligible @ room temperature (paraquat dichloride)
23

Partition Coefficient: 4.4683
Adsorption Coefficient: 1,000,000 (estimated) (Wauchope et al., 1992)
24

Analytical Equipment
Gas Chromatography The separation of volatile oil components using temperature and pressure gradients
through capillary columns in gas chromatography has become one of the widely applied
technologies in analytical chemistry. The relatively low cost, amenability to automation and
robustness has ensured the adoption of this technology by most analytical laboratories.
The volatile fraction of solvent extracted concretes or absolutes can be 20 to 80% of the
total extract whilst steam distilled oils are almost 100% volatile. This would imply that many oils
could be loaded directly onto a GC column without clean-up, providing the detector has sufficient
sensitivity and specificity. The loading limit on capillary columns depends on the stationary
phase and its thickness. The loading capacity for a standard dimethyl polysiloxane (methyl
silicone), non-polar phase GC column is in the vicinity 20 µg of oil in a 1 µL split injection (0.6
µg in a 30:1 split). Assuming a pesticide residue contamination level of 1 mgkg-1, as little as 0.02
ng of the target analyte will be present in that same 1 µL injection. Most non-specific detectors
such as flame ionisation detection (FID) cannot detect much below 0.1 ng of any one component.
In samples which have not been subject to clean-up procedures, then, GC must be coupled to
sensitive and specific detectors.
25
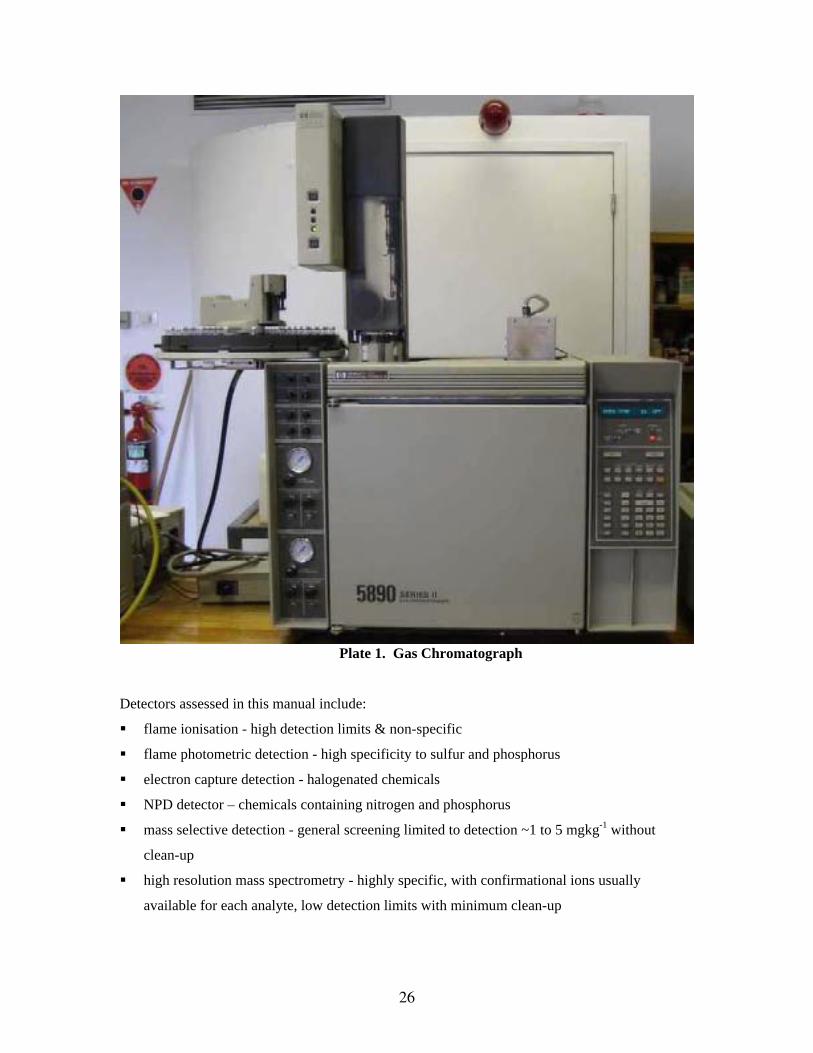
Plate 1. Gas Chromatograph
Detectors assessed in this manual include:
flame ionisation - high detection limits & non-specific
flame photometric detection - high specificity to sulfur and phosphorus
electron capture detection - halogenated chemicals
NPD detector – chemicals containing nitrogen and phosphorus
mass selective detection - general screening limited to detection ~1 to 5 mgkg-1 without
clean-up
high resolution mass spectrometry - highly specific, with confirmational ions usually
available for each analyte, low detection limits with minimum clean-up
26

The limitations of gas chromatography in the analysis of essential oils which have not
undergone clean-up and pre-concentration relates to the need to load large amounts of oil
components into the systems to detect low levels of pesticide residues. For solvent extracted
concretes or absolutes (such as boronia and blackcurrant) large amounts of non-volatile
components, including waxes and tannins, may not volatilise in the GC injection chamber or may
not elute from the column. Many non-volatile components are condensed onto the silanised glass
wool within the injector liner of the GC and this can be removed after a number of injections,
replaced or cleaned and re-silanised before re-use. However, the loading of excessive amounts of
essential oil components can lead to column damage, resulting in poor resolution, peak tailing
and low recovery of analytes. There are many types of GC injectors that afford a measure of
control to reduce the loading of components onto the column, such as septum equipped,
programmable injectors (SPI). Pre-columns can also prolong the viability of GC columns and
periodical baking of the column through a slow temperature gradient, with a long hold at the
maximum, can rejuvenate poor performing columns which have been subject to excessive
loading. A section of the column can also be removed to improve performance. However, if
matrix components co-elute with the target analyte and saturate the detector signal, the
parameters which can be optimised are limited to temperature gradients and pressure.
Alternatively separation may be achieved using GC columns with different immobile phases or
the target analyte may be amenable to derivatisation.
Retention characteristics of target analytes under standardised GC conditions are often
insufficient for an unequivocal identification as these can vary with column conditions. Standard
curves, confirming retention times, should be run immediately before and after a sample is tested
for pesticide contamination. The sample may also be re-chromatographed, after being fortified
with the target compound. This will show an enhanced peak for retention time confirmation.
Retention times can be expressed as values relative to retention time of a standard reference
compound. Selection of a chemical with similar structural and physical properties to the target
analyte will ensure that slight changes in experimental conditions will change the retention
characteristics of the reference compound to the same degree as those effected on the target
analyte.
27

Despite reproducible and standardised methods the retention characteristics are often
insufficient for unequivocal peak assignment. Methods for confirming peak identity include;
- application of clean-up techniques to remove interfering peaks;
- reference to mass spectral data, comparing relative retention times on capillary
columns having different liquid phases;
- adjustment of experimental conditions to improve peak resolution;
- derivatisation and application of different detectors specific to different functional
groups on the target compound, such as halogenation.
The following sections detail the experiments undertaken in the assessment of a range of
GC compatible detectors, including ECD, NPD, FPD, benchtop MSMS and HR MS.
Assessment of GC ECD in the Analysis of Pesticide Residues in Essential Oils. Electron Capture Detectors (ECD) are specific to halogenated chemicals. Both essential
oils and solvent extracts are predominantly hydrocarbons and oxygenated hydrocarbons. The
bulk of the matrix of an essential oil, contaminated with halogenated pesticide residues, should
not register by ECD. As discussed previously, however, any one component of an essential oil
can constitute in excess of 10% of the oil, compared to pesticide contamination levels which are
often around 0.0001%. Obviously, co-elution of a major oil component would mask the
specificity of the ECD through saturation of the detector with a component 105 times more
concentrated than the halogenated pesticide. The retention characteristics of the target analyte
relative to the major components of essential oils are therefore of critical relevance.
When considering the suitability of GC ECD to the analysis of a new target analyte, the
determination of the retention characteristics relative to essential oil components can provide an
indication as to whether the analyte response will be masked by co-eluting extractives. Gas
chromatographic retention indices (Kováts' indices) relate the retention time of a particular
analyte to the retention time of a series of CnH(2n+2) hydrocarbons. It is useful to pre-determine the
retention indices of the components of the relevant essential oils. The introduction of a new
pesticide into a GC screen can then be easily assessed by first determining the retention indices
for the new analyte and relating them to the established indices for the essential oil components.
This will allow an assessment as to whether the pesticide residue will elute in a time window
separated from other major essential oil components.
28

To assess the application of GC ECD to the detection of pesticide residues in the matrix
of essential oils, Kovát's indices were established for the major components of essential oils and
for the halogenated pesticides commonly used in the industry. In the experiments detailed in the
following pages, it was shown that the majority of the components of distilled oils have Kovát's
indices below 1500, whilst the majority of pesticides have Kovát's indices above this figure. This
indicated that co-elutions of essential oil peaks with the target analyte would be minimal. Despite
the high degree of specificity of the GC ECD, and the adequate retention and response properties
of some of the halogenated pesticides tested, it was evident that the retention times alone were
insufficient to unequivocally identify peaks. GC ECD can only be used as a screen to determine
that no gross contamination of essential oils has occurred. The high number of components of
boronia extract with retention indices greater than 1500 effected the masking of pesticide residue
peaks. None the less, method validations were conducted for eight halogenated pesticides in
fennel, parsley and peppermint distilled oils and boronia extracts.
Experiments Undertaken in the Process of Method Development Example 1. Retention Indices of Components of Essential Oils
Aim : To establish the Kovát's indices of essential oils on a HP 5MS column under the GC
conditions to be used in standard GC ECD pesticide analysis using GC FID
Experimental : GC FID has the capacity to detect a 1µL split injection of a 1 mgmL-1 solution. A
1 mgmL-1 solution of a range of CnH(2n+2) hydrocarbons was prepared and analysed in the same
column, and under identical conditions of pressure and temperature, as those to be used in the
proposed GC ECD analysis.
Analytical parameters Instrumentation Hewlett Plackard 5890 gas chromatograph Hewlett Plackard Flame Ionisation Detector Processing Software - HP Chem Injection: 1 µL, split automatic injections Column: 30 m HP 5MS, 0.22 mm id, 0.25 µm film thickness Carrier gas: Instrument grade nitrogen Head Press.: 10 psi Oven Temp: 1 min. at 60°C, then programmed at 20°C/min to 290°C for 10
min. Injection Temp: 260°C Detector: FID 280°C
29

Results: Figure 1, 2, 3 and 4 are the GC FID chromatograms for injection of 20 mgkg-1 solutions
of parsley, fennel and peppermint oils and boronia oils.
Figure 1 - GC FID of distilled parsley oil
Figure 2. - GC FID of distilled fennel oil
30

Figure 3 - GC FID of distilled peppermint oil.
Figure 4 - GC FID of solvent extracted boronia oil
31

Table 2 records the retention times of mixed 1 mgmL-1 solutions of hydrocarbon standards
ranging from C8H18 to C36H74. The Kovát's indices are calculated using the formula
t'R(A) - t'R(N) I ab = 100N + 100n -------------------- t'R(N+n) - t'R(N) Where I is the retention index on phase a at temperature b and t'R(N) and t'R(N + n) are the
adjusted retention times of n - paraffin hydrocarbons of carbon numbers N and (N+ n) that are
respectively smaller and larger than the adjusted retention times of the unknown, t'R(A) (ref 1.)
Standard Ret. Time Kovát's Peak (mins) indices
nC15H32 14.804 1500
nC16H34 16.126 1600
nC17H36 17.381 1700
nC18H38 18.582 1800
nC20H42 20.794 2000
nC21H44 21.834 2100
nC22H46 22.817 2200
nC24H50 24.682 2400
nC28H58 28.697 2800
nC34H70 35.435 3400
Table 2. Retention times of CnHn+2 hydrocarbons The retention times of the major components and the calculated Kováts' indices are listed in
Table 3.
32

Parsley oil ret. Kovát’s Fennel oil ret. Kovát’s
time indices time indices
α-pinene 6.40 674 α-pinene 6.33 667
β-pinene 7.13 743 α-phellandrene 7.45 773
myrcene 7.50 778 limonene 7.86 812
β-phellandrene 8.03 827 β-phellandrene 7.86 812
α-terpinolene 8.94 913 fenchone 9.07 925
menthatriene 9.47 962 estragole 10.71 1079 tetramethoxy- trans-anethole 12.52 1249
allyl benzene 15.57 1535 myristicin 16.53 1626 apiole 21.17 2061 Peppermint ret. Kovát’s Boronia extract ret. Kovát’s oil time indices time indices
1,8-cineole 7.96 821 α-pinene 6.30 665
menthone 10.21 1032 β-pinene 7.02 733
menthol 10.71 1079 terpinolene 7.83 808 pulegone 11.49 1152 β-ionone 15.07 1488
isomenthol 12.22 1221 dodecyl acetate 15.40 1520 germacrene D 14.26 1412 methyl epijasmonate 16.41 1614 piperitone 15.11 1492 heptadec-8-ene 17.37 1704
waxes & high M.W. chem. 23 - 34 2233-3266
Table 3. Kováts indices for major components of essential oils and extracts.
Figures 5 to 8 record the GC ECD traces of injection of 20 mgkg-1 solutions of essential oils.
Figure 5. GC ECD of distilled parsley oil
33

Figure 6. GC ECD of distilled peppermint oil
Figure 7. GC ECD of distilled fennel oil
34

Figure 8. GC ECD of solvent extracted boronia oil
Conclusion: Evident in Figures 5 to 7 is that the components of the distilled essential oils which
effect an ECD response, have Kovát's Indices less than 1500. The solvent extracted boronia
extract shown in Figure 8, however, has interfering components eluting through to 35 minutes.
Experiments Undertaken in the Process of Method Development Example 2.
Retention Indices of Pesticides in Essential Oils
Aim: To establish the Kovát's indices for pesticides on a HP 5MS capillary column
Experimental: An acceptable limit of detection for a basic screen would approach 1 mgkg-1. The
loading capacity of standard non-polar capillary columns such as HP1 or HP5MS, is in the
vicinity of a 1 µL split injection of a 20 mgmL-1 solution of an essential oil. A sample containing
0.02 µg of an active ingredient of a pesticide, in 20 mg of oil constitutes a 1 mgkg-1 solution.
Without clean-up techniques, GC ECD would need to be able to detect 0.02 ng of analyte in a 1
µL injection. For each halogenated pesticide a concentration of ~2 µg of analyte in 1 mL of
solution is equivalent to 100 mgkg-1 in a 20 mg sample of oil. This concentration should be
sufficiently high for easy detection so as to determine the retention time of each analyte and
provide some indication as to the likely response under GC ECD conditions.
35

Table 4 lists the pesticides commonly used in the essential oil industry which contain at
least one halogen in their molecular structure.
Halogenated, GC amenable pesticides
tebuconazole procymidone glyphosate - derivatised propiconazole difenoconazole mecoprop - derivatised linuron ethofumesate MCPA - derivatised diuron dimethenamid Dicamba - derivatised simazine chlorpyrifos trichlopyr - derivatised oxyflurofen norflurazon clopyralid - derivatised chloroprofam haloxyfop esters fluroxypyr - derivatised bromacil fluazifop esters terbacil
Table 4. Halogenated pesticides used within the essential oil industry
Acetone solutions (2 µgmL-1) of each halogenated, GC amenable pesticide were injected in a gas
chromatograph with detection by ECD under the following conditions.
Analytical parameters
Instrumentation Hewlett Packard 5890 gas chromatograph Hewlett Packard Electron Capture Detector Processing Software - HP Chem Injection: 1 µL, split automatic injections Column: 30 m HP 5MS, 0.22 mm id, 0.25 µm film thickness Carrier Gas: Instrument grade nitrogen Head Press.: 10 psi Oven Temp: 1 min. at 60°C, then programmed at 20°C/min to 290°C for 10
min. Injection Temp: 260°C Detector: ECD 260°C The effects of the matrix on the detection of halogenated pesticides were then assessed.
Distilled oils (20 - 30 mg) were weighed into GC vials. Boronia extracts were warmed and mixed
thoroughly to ensure an even distribution of all oil components. Sub-samples (20 - 30 mg) were
weighed into 2 mL GC vials. Vials were spiked with 10 µL of an acetone solution containing a
0.2 mgmL-1 mix of each pesticide standard.
Results: ECD was found to be successful in the detection of terbacil, bromacil, haloxyfop ester,
propiconazole, tebuconazole and difenaconazole. Figure 9 shows the chromatograms obtained by
GC ECD.
36

Figure 9. GC ECD traces of 2 µgmL-1 solutions of halogenated pesticides
pesticide ret. Kovát's
time indices
linuron 20.652 2013 ethofumesate 20.596 2007 simazine 18.099 1773 terbacil 19.147 1871 fluazifop ester 23.388 2270 fluroxypyr ester 24.951 2416 procymidone 22.146 2153 propiconazole 24.563 2380 tebuconazole 25.00 2421 difenaconazole 32.620 3136
Table 5. Kováts indices calculated for the pesticides shown in Figure 9.
Figures 10 to 13 shows the GC ECD chromatograms for spiked parsley, peppermint, and fennel
oils and boronia extract.
37

Figure 10. GC ECD chromatogram of parsley oil fortified with 100 mgkg-1 mixed pesticide standard
Figure 11. GC ECD chromatogram of peppermint oil fortified with 100 mgkg-1
mixed pesticide standard
38

Figure 12. GC ECD chromatogram of fennel oil fortified with 100 mgkg-1 mixed pesticide standard
Figure 13. GC ECD chromatogram of boronia extract fortified with 100 mgkg-1 mixed
pesticide standard
39

Discussion: The application of GC ECD to the detection of halogenated pesticides in essential
oils, without clean-up techniques, is limited. Detection limits are unlikely to be less than 0.1
mgkg-1. The large number of interfering peaks from co-eluting extract components makes the
unequivocal identification of unknown peaks impossible. Method validation has been undertaken
for the peaks which showed good response and chromatographic properties.
Experiments Undertaken in the Process of Method Development Example 3.
Method Validation for Detection of Pesticides by GC ECD in Parsley, Peppermint and
Fennel Oils and Boronia Extracts.
Aim: From the results presented in Figures 10 to13, a preliminary method validation experiment
was designed to include simazine, terbacil, bromacil, haloxyfop and fluazifop esters,
propiconazole, tebuconazole and difenaconazole.
Experimental: Four 20 mg aliquots of each oil were spiked with standard solution mixes to
produce a range of concentrations of 0.01 to 10 mgkg-1. Samples were analysed using the same
parameters as listed on page 40. Repeat injections at each concentration of fortified oil were
analysed to determine repeatability.
Results: The detection limits, linearity as expressed by the r2 value of a linear regression, and the
repeatability as expressed by the r.s.d.s are listed in Table 6.
40

Pesticide ret. std. curve coefficients curve fit
detection limits
time x2 x r2 solvent fennel pep.mint parsley bor. r.s.d.
µgmL-1 %
simazine 18.02 1 - terbacil 18.92 2.29E-09 5.50E-05 1.000 0.02 1 0.5 1 5 12.2 bromacil 20.55 9.56E-10 8.39E-06 1.000 0.01 0.5 0.5 1 1 4.3 haloxyfop ester 22.05 6.34E-05 0.995 0.02 1 0.5 50 5 7.7 fluazifop ester 23.31 1 - - - - propiconazole 26.00 9.19E-09 1.85E-05 0.999 0.02 5 5 5 - 22.3 tebuconazole 21.92 5.12E-11 2.26E-06 0.997 0.01 0.5 0.5 1 5 2.2 difenaconazole 32.70 -2.92E-09 5.15E-05 0.998 0.02 1 1 1 1 13.7
Table 6. Detection limits and repeatability for the analysis of halogenated pesticides in
essential oils and extracts by GC ECD
Discussion: Analysis of pesticide residues in essential oils and extracts by application of GC
ECD are not specific enough to allow for an unequivocal identification of any contaminant. As a
screen, ECD will be effective to establish that no gross contamination is present in oils or extracts
in the absence of a co-eluting peak. In the situation where a peak is recorded with the correct
elution characteristics, and which is enhanced when the sample is fortified with the target analyte,
a second means of contaminant identification would be required, such as high resolution mass
spectrometry. ECD is a screen for contamination and will not provide a positive identification for
any pesticide contaminant.
Assessment of GC FPD GC FPD was not found to be particularly suitable for the analysis of pesticide residues in
essential oils and extracts without considerable clean-up procedures. Tests were undertaken with
acephate, methedimos and monocrotophos. Poor chromatography, due to thermal degradation
and poor interaction with the liquid phase of the GC columns, precludes this detection method in
specific screens for the analysis of residues in essential oils.
Digestion of dithiocarbamate pesticides with acidified stannous chloride produces carbon
disulfide. The gaseous product can undergo head-space sampling with analysis by GC FPD in the
sulfur mode. This well established technique for the detection of dithiocarbamate residues was
applied to the analysis of essential oils, though with several adaptations to the sampling method
for the gaseous end product. The detection of mancozeb in peppermint oil using acidified
stannous chloride digestion, with partitioning of carbon disulfide into n-octane was trialed
(adapted from methodology published by Woodrow 1995). Recoveries were as low as 10%, with
41

detection limits of around 10 mgkg-1. Many essential oils have endogenous sulfur components
and analysis of carbon disulfide by acid digestion of samples, not previously treated with
dithiocarbamate chemicals, gave background levels as high as 5 mgkg-1.
A by-product of acidified stannous chloride digestion of dithiocarbamates is
ethylenediamine. The quantification of the amount of ethylenediamine produced was trialed.
Derivatisation of ethylenediamine with BSTFA to convert the product to a GC amenable analyte
was successful. However, detection of ethylenediamine produced from the digestion of
mancozeb standard was unsuccessful. Residual stannous chloride or hydrochloric acid may have
promoted the depletion of the derivatising agent.
Detection of the carbon disulfide using headspace analysis with detection by FPD has
been trialed. Mancozeb was digested in the matrix of peppermint leaves and oils and compared
to solvent only digestions. Detection of mancozeb at concentration levels equivalent to 20 mgkg-
1 gave a r.s.d. of 10.6%. However, peppermint oil samples that had not been treated with
mancozeb gave positive results for the production of carbon disulphide using the digestion
methods described. The presence of endogenous sulfur chemicals precludes this methodology for
the analysis of mancozeb in most essential oils. Nonetheless, the methodology for the analysis of
peppermint leaves is included in the appendix 1. The response for carbon disulfide by GC FPD
was non-linear and less sensitive than that recorded for phosphorus compounds using the 524 µm
filter.
Assessment of GC NPD in the Analysis of Pesticide Residues in Essential Oils. The NPD is based on the ionisation of nitrogen and phosphorus in a thermionic source
within a jet flow of hydrogen and air. The NPD collector contains a small alumina cylinder
coated with a rubidium salt (active element) which is heated electrically. The ionised organic
molecules are collected and the resulting current is measured. The specificity afforded by the
efficient ionisation of organic molecules containing nitrogen or phosphorus may allow for the
NPD to selectively respond to nitrogen and phosphorous containing pesticides, preferentially
detecting them from amongst the C H and O containing components of essential oils. Much of
the points noted under the assessment of GC ECD apply for GC NPD with the probability of
excessive amounts of the components quenching the signal. None the less experiments were
undertaken to determine the potential of GC NPD to detect pesticides in essential oils.
42

Experiments Undertaken in the Process of Method Development Example 4.
The Detection of Pesticides by GC NPD in Peppermint Oil.
Aim: To undertaken an assessment of the response of GC NPD to pesticides in the matrix of
peppermint oil.
Experimental: The pesticides included in this experiment were monocrotophos, simazine,
propazine, cyanazine, propiconazole, tebuconazole and difenaconazole. The retention times of
the proposed analytes were established by injecting 1 mgkg-1 solutions of each pesticide into a
GC with detection by FID. The column and GC parameters used to establish the retention times
were replicated when transferring analysis to the GC NPD.
An injection (1 µL) of a 20 µgmL-1 mixed solution of monocrotophos, simazine,
propazine, cyanazine, propiconazole, tebuconazole and difenaconazole was analysed by GC NPD
using the conditions listed. Retention times were used to identify peaks. Solutions of 200, 20
and 2 ngmL-1 in acetone were prepared for direct comparison to equivalent solutions but also
containing 20 µLmL-1 of peppermint oil. This translated to 20, 10 and 1 mgkg-1 pesticides
concentrations in peppermint oil.
Analytical parameters: Instrumentation: Varian 3300 gas chromatograph. Varian NPD. Processing Software – Varian Starr Workstation. Injection: 1 µL, splitless manual injections Column: 30 m HP5MS, 0.22 mm id, 0.25 µm film thickness Carrier gas: Instrument grade helium Head Press: 10 psi Oven Temp: 60°C (1 min.) -10°C/min-280°C (15 min.) Injection Temp: 260°C Detector: NPD 300°C Filament voltage 3.1 mV Voltage offset -4.0 mV Results: Figure 14 show the chromatogram of a 10 µgmL-1 acetone solution of monocrotophos, simazine, propazine, cyanazine, propiconazole, tebuconazole and difenaconazole. Figures 15 and 16 show the GC NPD traces of pesticide fortification levels of 1 mgkg-1 in solvent only and in peppermint oil respectively.
43

Figure 14. Pesticides (10 µgmL-1) in acetone analysed by GC NPD.
Figure 15. Pesticides (1 mgkg-1) in solvent analysed by GC NPD.
44

Figure 16. Pesticides (1 mgkg-1) in peppermint oil analysed by GC NPD The areas obtained for each fortification levels of pesticides in acetone are compared to the response of equivalent concentrations of each pesticide in peppermint oil in Table 7. The relative response of pesticides in oil compared to pesticides in solvent expressed as a percentage is also listed. The oil has limited effect on the retention time but suppresses the response of the NPD by over 80 % for all the pesticides. The earlier eluting isomer of propiconazole is suppressed by 99%. However, despite the quenching of the response, the selectivity of the NPD is encouraging and the analyte peaks stand well above the background signal.
ret. solvent ret. peppermint % response time only time oil pepp.oil to mins mins solvent only
simazine 18.445 8505 18.429 1186 14 propazine 18.645 12091 18.630 2139 18 cyanazine 21.344 3444 21.327 729 21 propiconazole 25.335 13760 25.319 190 1 propiconazole 25.506 2238 25.487 344 15 tebuconazole 25.883 2335 25.864 436 19
Table 7. Relative response of nitrogen and phosphorous containing pesticides fortified at a level equivalent to 1 mgkg-1 relative to oil in solvent and peppermint oil.
45

Assessment of Benchtop GC MSMS Despite the high expectations based on the sensitivity and selectivity of the application of
benchtop gas chromatography daughter / daughter mass spectrometry, severe limitations relating
to the configuration of the system, precluded its application in the analysis of pesticide residues in
essential oils without considerable clean-up techniques. The equipment accessed by this project
was a Varian Starr 3400 CX GC coupled to a Varian Saturn 4D MS/MS. Unlike other mass
spectrometry systems, the effluent from the gas chromatograph elutes into ion trap before
ionisation. In some mass spectrometers, only ions enter directly into the ion trap. The
introduction of a 1 µL split injection may contain as much as 20 µg of essential oil components.
With a split ratio of 1 : 50 the injector will deliver 0.4 µg onto the column. The entire eluant
then enters the trap such that the isolation of specific target parent ions is difficult. The Saturn
MS/MS, under the control of the 'Autogain', collects a specific number of ions. Ionised
components of the background matrix are often in sufficient abundance to fill the ion trap prior to
the ionisation of the target analyte. In addition essential oil components would quickly
accumulate within the ion trap. The mass spectrometer is required to be shut down for several
days for the trap to be cleaned. Although several of the pesticides relevant to the essential oil
industry were trialed in solvent solutions, with encouraging results, it was not considered
practical to continue method development within the matrix of essential oils without
comprehensive clean-up methodologies.
46

Plate 2. Benchtop GC MSMS
Assessment of GCHRMS in the Analysis of Pesticide Residues in Essential Oils. HRMS has the capacity to measure the m/z ratio to such an accuracy as to be able to
determine the molecular mass of fragments to 4 and 5 decimal places. This provides a high
degree of specificity and when used in the selected ion monitoring mode (SIM) can detect target
analytes even when they are in a much lower abundance amongst co-eluting matrix components.
Very few analytical laboratories have access to this sophisticated and expensive equipment. In
addition, a high level of expertise is required to maintain and operate such an instrument.
However, with the difficulties inherent in the analysis of pesticide residues within essential oils
GC HRMS affords a capacity for specific and sensitive detection for all GC amenable analytes
irrespective of the presence or absence of halogens, thiols, amines or phosphates.
47

Plate 3. Gas Chromatograph, High Resolution Mass Spectrometer
The Application of GC HRMS in the Analysis of GC Amenable Pesticides. The MS and retention characteristics of the active ingredient of each pesticide are first
assessed. Each analyte is run by GC MS in full scan mode. The retention time is recorded and
the ions most suitable for monitoring are selected on the basis of their abundance and diagnostic
potential. Ions with masses similar to those originating from co-eluting components of essential
oils can be selected, as the degree of mass discrimination afforded by high resolution allows
distinction of the ions separated by as little as 10 ppm in mass or 0.05 atomic mass units (amu) at
m/z 500. If the relative retention and basic MS of analytes are known, then the first full scan run
can include a range of pesticides for the determination of retention time and ions suitable for
monitoring. Figure 17 shows a sample run of acephate, simazine, dichlorpyrifos, dimethanamid,
sethoxydim, oryzalin, bromacil, norflurazon and diuron by GC TIC. As a case example, Figure
18 shows the MS of sethoxydim, which elutes at 10:53 minutes on the GC temperature ramp
used. The ions selected for monitoring were 191 and 219, corresponding to the fragmentation
48

ions C11H13NO2 and C13H17NO2. The masses for the ions to be monitored by high resolution SIM
were calculated to be 191.0946 and 219.1259.
Figure 17. TIC of pesticides by GC HRMS
Figure 18. MS of sethoxydim
49

Having determined the retention times and suitable mass fragments for monitoring, the
mass spectroscopist establishes an instrument run whereby the HRMS is programmed to switch
between ions to be monitored within time windows spanning the retention time relevant to each
particular analyte included in the screen.
In HRMS the response of ions monitored will change with instrument tuning which must
be optimised each day of use. An internal standard is necessary. In early method development
octadecane was selected and the ion monitored was 254.2973. However, the solubility of this
hydrocarbon presented some limitations. When samples were prepared in polar solvents, as a
result of extraction protocols etc., octadecane was observed to separate, preventing quantitative
determination. Endosulfan was selected as an internal standard as the chemical structure and
properties are similar to that of other pesticides. It chromatographs well on capillary GC and it is
not commonly used in the essential oil industry. Should this analyte be present in oils, the high
level at which the standard is spiked should overwhelm any background contamination and not
significantly affect quantification. The ion selected for monitoring of the internals standard was
194.9534. Figure 18 shows a typical GC HRMS run established to monitor diuron,
dimethenamid, simazine, acephate, norflurazon, bromacil, chlorpyrifos and sethoxydim.
Method development has been undertaken for 19 pesticides that can be directly analysed
by GC HRMS. Table 8 lists the analytes, the ions monitored and general comments with regard
to their chromatographic behaviour. The pesticides are listed in order of elution under the
conditions trialed. The actual retention times are omitted as this parameter is subject to variations
depending on column type, temperature and pressure gradients etc.
50

Figure 18. GC HRMS chromatogram of 9 pesticides
51

Active Trade Ion Confirmation Chrom. Det. limit Det. limit ingredient name mass ion properties peppermint boronia
mgkg-1 mgkg-1
linuron Linuron 188.9555 186.9584 degrad. prod. 1 0.1 diuron Krovar 188.9555 186.9584 degrad. prod. 1 1 acephate Orthene 136.0164 poor 1 1 monocrotophos Nuvacron 127.0160 97.0527 poor 0.1 1 terbacil Sinbar 161.0117 good 0.1 0.1 chloropropham Allicide 213.0557 good 0.05 0.05 int. std. octadecane 254.2973 good - - prometryn Gesaguard 241.1361 226.1126 good 0.05 0.05 simazine Gesatop 201.0781 186.0546 med. 0.1 0.1 ethofumesate Tramat 286.0875 good 0.02 0.02 int. std. endosulfan 194.9534 good - - dimethenamid Frontier 230.0406 232.0377 good 0.05 0.05 pendimethalin Stomp 252.0984 281.1376 good 0.05 0.05 bromacil Krovar 204.9613 good 0.05 0.05 chlorpyrifos Lorsban 196.9202 198.9172 good 0.05 0.05 oxyflurofen Goal 252.0398 300.0035 good 0.01 0.02 fluroxypyr Fusilade 282.0742 393.1344 good 0.05 0.05 propiconazole Tilt 259.0291 261.0262 diastereomers 0.02 0.02 tebuconazole Folicur 250.0743 252.0714 some tailing 0.1 0.5 norflurazon Solicam 303.0386 good 0.05 0.05 sethoxydim Sertin 219.1259 191.0946 some tailing 1 1
Table 8. Analysis of 19 pesticides by GC HRMS - ions monitored and chromatographic
characteristics
Experiments Undertaken in the Process of Method Development Example 5. Method Validation of the Analysis of Tebuconazole, Propiconazole, Simazine, Terbacil, Bromacil and Oxyflurofen in Boronia Extract by GCHRMS
Aim: To validate the methods developed for the detection of 6 pesticides in the matrix of boronia
extract using GC HRMS.
Experimental: Standards were purchased from Sigma Aldrich and approximately 25 mg of each
were weighed into 25 mL volumetric flasks and made up to volume with acetone. Solutions of
10µgmL-1 and 1 µgmL-1 were prepared by diluting 250 µL and 25 µL of the 1 mgmL-1 solutions,
respectively, into 25 mL of acetone. Standard curves were prepared by weighing 22 x ~20 mg of
boronia concrete into GC vials. Vials were fortified with the standard solutions as listed in Table
52

9, to allow for 6 replicate samples at 3 concentrations to establish repeatability. Endosulfan (5
µg) was added to each vial as an internal standard. Hexane (200 µL) was added to each, the lids
were placed firmly on top, without sealing, and the mixtures gently swirled to dissolve the
concrete. The bases of the vials were gently warmed by briefly placing them on the base of an
oven where required.
Concentrations (mgmL-
1) no. 10µgmL-1 1µgmL-1 0.1µgmL-1 endosulfan
20 1 40 5 10 6 20 5 1 6 20 5 0.1 1 20 5 0.05 6 10 5 0.02 1 4 5 0 1 0 5
Table 9. Spiking protocol for the establishment of standard curves and repeatability
experiments
Methanol (0.8 mL) was added to each vial, which were then sealed and shaken
vigorously to ensure complete mixing. After a settling period of ~ 5 minutes the lids were
removed and 4 drops of distilled water were added to each vial. The lower layer was filtered
through cotton wool into 200 µL glass GC vial inserts for analysis.
Recoveries were determined by establishing a standard curve in boronia solutions which
had been subject to the same partition clean-up step described above, but spiked after that process
and using the same fortification levels as listed in Table 9. In addition a standard curve was
prepared by fortifying methanol / water solutions with standard pesticide solutions to
concentrations equivalent to 0.05, 1, and 10 mgkg-1 in oils. Endosulfan (5 µg) was added and the
vials sealed for analysis.
Analytical parameters: Samples were analysed on a HP 5890 Gas Chromatograph directly
coupled to a Kratos Concept ISQ Mass Spectrometer. The GC was equipped with a BPX5 fused
silica capillary column (25 m, 0.22 mm i.d., 0.25 µm film thickness). Splitless injections of 1µL
of sample were analysed using a carrier gas flow program of 30 psimin-1 from 25 to 40 psi., held
for 0.1 min, then at 30 psi. min.-1 to 25 psi, then at 1 psi. min.-1 to 35 psi. The GC injection
temperature was 260°C and the oven temperature programmed from 60°C to 290°C at 20°C
min.-1. Ion monitored for terbacil was 161.0117 between 5:00 and 7:50 mins. Ion 194.9534 was
monitored for internal standard, endosulfan, between 7:50 and 8:12 minutes. For oxyflurofen, ion
252.0398, monitored between 8:12 to 9:00 minutes, tebuconazole, ion 250.0743, propiconazole,
53

ion 259.0210, bromacil, ion 204.9613 and simazine, ion 201.0871. A dwell time of 300ms/ion
and 50 ppm voltage sweep were employed for all ions. Resolution of 10,000 (10% valley
definition) and the ion m/z 242.9856 from perfluorokerosene was used as the lock mass for all
analytes and the internal standard. Electron ionisation was undertaken at a source temperature of
210°C and an electron energy of 70 eV, with an accelerating voltage of 5.3 kV.
Results: Table 10 records the detection limits and the relevant statistical data for the detection of
the 6 analytes by GC HRMS. analyte det. limit x coefficient r2 r.s.d. recovery
(mgkg-1) (at 1 mgkg-1) (at 1 mgkg-1)
tebuconazole 0.5 0.043 0.998 17 95 propiconazole 0.05 0.054 0.995 9 85 oxyflurofen 0.1 0.146 0.999 13 72 bromacil 0.05 0.046 1.000 12 82 terbacil 0.05 0.050 0.995 14 107 simazine 0.1 0.445 0.899 9 90
Table 10. Detection limits, recoveries and r.s.d.s for pesticides analysed by GC HRMS.
Discussion: The chromatographic properties presented the primary limitation to low detection
levels. The poor peak shape of tebuconazole, for example, resulted in the interference from
background noise at low levels such that the detection limit was 10 fold higher than that obtained
for propiconazole. R.S.D.s increased as the concentration at which they were obtained decreased.
The Application of GC HRMS in the Analysis of Pesticide Residues with Acidic
Moieties.
The commercially produced formulations available for growers usually contain the ester
form of the carboxylic acid specific to this group of pesticides. When the esters come in contact
with the soil the ester is cleaved to form the acid. The parent ester is often present in more than
one form and may include methyl, ethyl or ethoxy ethyl derivatives. The ester form of the active
ingredient can often be included in the general screen for GC amenable pesticides. The fluazifop
and fluroxypyr esters have been incorporated into GC HRMS and ECD methodologies. The
acidic forms of this group of pesticides, however, require derivatisation to render them amenable
to analysis by GC. Of the many methylating reagents available, ether solutions of diazomethane
are convenient and effective. The reaction of the herbicide trichlopyr and diazomethane is
shown.
54

N N
[(3,4,6-trichloro-2-pyridinyl)oxy]acetic acidtrichlopyr
OCH2COOCH3
ClCl
ClCl
Cl Cl
OCH2COOH
trichlopyr methyl ester
ether/10mins
CH2N2
The preparation of the diazomethane solution is presented in appendix 3. Following the
inclusion of a derivatisation step method development is the same as that undertaken for the other
GC amenable pesticides. A TIC is obtained, either be GC with a mass selective detector (MSD)
or on the GC HRMS. The retention times and the ions to be monitored are accurately calculated
and a suitable screen is programmed within which the mass spectrometer switches between the
ions to be monitored in each time window.
If the parent ester of the carboxylic acid is a simple methyl ester, the derivatisation of the
acid with diazomethane will produce an analyte identical to that which originally present in the
commercial formulation. Often cleavage from the ester to the acid form in the field situation is
incomplete and derivatised acid residues are indistinguishable from residues of the ester. In this
circumstance the sample should be analysed twice, with and without derivatisation. The amount
detected in the underivatised sample can then be subtracted from the amount detected in the
methylated sample. This will give the amount of acid contaminating any one sample.
Figure 19 shows the chromatogram for the analysis of haloxyfop, trichlopyr, MCPA,
dicamba and clopyralid, with endosulfan included as an internal standard.
55

Figure 19. GC HR MS of herbicides with acidic moiety
Table 11 shows the analytes, ions monitored and detection limits for haloxyfop, trichlopyr, mcpa,
dicamba and clopyralid.
56

Active ingredient Trade name Ion Chrom. Det. limit mgkg-1
haloxyfop Verdict 316.0352 good 0.5 trichlopyr Garlon 209.9280 good 0.1 dicamba Dicamba 214.0397 good 0.1 mcpa MCPA 202.9666 good 0.1 clopyralid Lontrel 173.9513 good 0.1
Table 11. GC HRMS of derivatised residues of pesticides with acidic moieties
Liquid Chromatography Liquid chromatography presents as a less deleterious separation process for thermally
labile chemicals, has application for non-volatile components and has more flexibility in terms of
adjustable parameters. These include flow rate, polarity of both mobile and stationary phases and
gradient profile of the liquid phase. High pressure liquid chromatography (HPLC) systems can
be configerated with multiple pumps, providing numeous options of solvent combinations within
one chromatographic run. HPLC systems can be interfaced with a range of detection systems,
however, this manual only includes the assessment of detection using ion trap MS.
Assessment of HPLC in the Analysis of Pesticide Residues in Essential Oils In ion trap MS, the effluent from the LC system is nebulised and can be ionised by a
range of methods as described below. The charged constituents of the aerosol are then transferred
to the mass separation system by the action of a high vacuum. The stream of ionised molecules
passes through a system by which many of the non-ionised particles are eliminated, into an ion
trap where the electromagnetic field oscillates to reject ions without the correct m/z ratio. The
concentration of the target analyte may then be measured. However, co-eluting ions may confuse
the background and so daughter ions can be formed from the target analyte by increasing the
energy of the selected ions in the ion trap, such that the collision of the ions effect a controlled
breakdown of the parent ion to form daughter ions. The second level of fragmentation, known as
MSMS, is normally very specific to the target ion and the level of interfering ions is greatly
reduced.
The ionisation methods interfacing liquid chromatography to ion mass detectors assessed
are:
Thermospray (TSP)- Proton transfer reactions may be stimulated by using a filament or
discharge electrode, termed filament assisted TSP or discharge assisted TSP respectively.
• Electrospray (ESP)- The LC effluent is sprayed in the vicinity of a small ion sampling orifice.
Ionisation is effected by applying a high voltage to the needle through which the spray exits.
57

• Atmospheric pressure chemical ionisation (APCI).- Ionisation occurs by molecular collisions.
The primary ions may be solvent molecules ionised by a corona discharge or desolvated
buffer ions.
Plate 4. Waters 2690 HLC and Ion Trap Mass Spectrometer
Retention of Essential Oil Components on HPLC Columns Clean-up methods were not to be considered within the initial framework of the
analytical methodology. Without clean-up techniques the threshold of detection is limited by the
amount of oil which can be safely loaded onto the HPLC system without the loss of column
functionality. The potential of oil components to be retained within the column under a given
mobile phase protocol may lead to a shorter working life of the column and the infusion of oil
components into the MS system, itself, has the potential to permanently contaminate the ion trap.
The retention characteristics of essential oils on a standard reverse phase (RP) HPLC C18 column
were therefore assessed.
A Total Ion Current (TIC) by MS of the effluent from a LC column will only detect
chemicals which have been ionised. Ultraviolet (UV) detection was applied to determine the total
elution profile of essential oils and extracts introduced into the HPLC and to ensure that
58

components do not remain on the column. In addition, the flow from the HLPC was diverted to a
collection vessel and the sample analysed by GC MS.
Experiments Undertaken in the Process of Method Development Example 6.
Behaviour of the Components of Parsley, Peppermint and Fennel Distilled Oils on RP HPLC Columns.
Aim: To assess the retention characteristics of essential oils on RP HPLC columns using
acetonitrile / ammonium acetate buffer mobile phase
Experimental: Four 200 µL (~200 mg) aliquots of each of peppermint, fennel and parsley oil
were dispensed with an Eppendorf into LC vials and 800 µL of analG acetone was added.
Injections of 20 µL were introduced into the HPLC system detailed below. The flow from the
column was diverted to a Waters photo diode array detector (PDA).
Analytical parameters: LC - A Waters 2690 separation module (Alliance) system equipped with
a NOVAPAK C18, 3.9 x 150 mm column was used to establish a mobile phase with gradient of
50:50 acetonitrile / 0.1M ammonium acetate buffer ramped to 90:10 over 15 minutes.
Results: Figures 20 to 22 show the LC UV traces of the essential oils analysed under the
conditions listed.
59

AU
0.00
0.50
1.00
1.50
2.00
2.50
3.00
3.50
Minutes2.00 4.00 6.00 8.00 10.00 12.00 14.00 16.00 18.00 20.00 22.00
Figure 20. HPLC UV trace of distilled fennel oil (270 nm)
AU
-0.20
0.00
0.20
0.40
0.60
0.80
1.00
1.20
1.40
Minutes2.00 4.00 6.00 8.00 10.00 12.00 14.00
Figure 21. HPLC UV trace of distilled parsley oil (220 nm)
60

AU
0.00
0.50
1.00
1.50
2.00
2.50
3.00
3.50
Minutes2.00 4.00 6.00 8.00 10.00 12.00 14.00
Figure 22. HPLC UV trace of distilled peppermint oil (270 nm)
The fractions collected from the HPLC were subject to GC MS analysis to confirm the
elution of the majority of essential oil components from the LC system.
Discussion: The main components of distilled essential oils do not remain on the RP
column under the parameters tested.
HLPC MSMS Method Development
In HPLC, the flexibility afforded by the interchangeable nature of the stationary phase of
the column, the solvents, the solvent gradients and the flow rates allows for adaptations to
accommodate specific analytes. Optimisation of these parameters for each analyte would be a
difficult undertaking. In the assessment of the HPLC equipment a reverse phase NOVAPAK C18,
3.9 x 150 mm column was selected with acetonitrile / ammonium acetate buffer as the mobile
phase. This system may not necessarily be optimal for each analyte, or for the separation of
pesticide residues from essential oil components, but this commonly used system served to give
workable results from which more specific methods may be developed.
61

The first steps in method development are the determination of the mass spectrum of the
analyte and the establishment of tune file optimising the collision energy and isolation width
specific for each parent and daughter ion for each ionisation source. To undertake the
optimisation a 10 µgmL-1 solution is infused directly into the MS using a worm driven syringe at
a rate of 0.8 mLmin-1. Table 12 records the parameters established for a selection of pesticides
analysed by ESI and APCI in the positive and negative modes.
ESI parent ion daughter ion collision isolation notes energy width (amu)
linuron NR no response oxyflurofen NR no response propiconazole 342 159 21 6 prometryn 242 200 20 5 tebuconazole 308 NR sethoxydim 328 282 17 5 simazine 202 124 18 4 endosulfan NR bromacil NR terbacil 215 (-ive) 159 15 6 haloxyfop ester 434 316 25 6 fluazifop ester 384 328 19 5 fluroxypyr ester 369 255 27 6
NR - no response
Table 12. Mass ions and collision energies detected by fragmentation of pesticide parent
molecules by ESI
Preliminary results listed in Table 12 indicate that ESI has limited application. No
response was recorded for some of the most commonly used pesticides in the essential oil
industry such as linuron, oxyflurofen and bromacil. For analytes such as tebuconazole the
molecular mass ion was detected but no useful daughter ions were produced. Hence MS/MS
could not be used to increase the specificity and lower background noise.
Bromacil and terbacil were successfully ionised in the negative mode using ESI but
combined with the poor sensitivity or lack of ionisation for the great majority of analytes trialed,
ESI appears to have limited application for a wide ranging screen.
All the chemicals were trialed using APCI in the negative and positive mode. Table 13
shows the general parameters established.
62

APCI parent ions daughter ions collision isolation notes
energy width (amu)
Linuron 251 182 19 6 poor response Oxyflurofen 363 316 21 5 poor response Propiconazole 342,343.344 159,161,163 21 6 Prometryn 242,243,244 200,201 Tebuconazole 308,310 Sethoxydim 328,329,330 282,283 Simazine 202,204 124 Endosulfan NR Bromacil 261,259(-ive) 203,205 19 5 Terbacil 215,217,218 161,163 19 5 Haloxyfop ester NR Fluazifop ester NR Fluroxypyr ester NR
NR - no response
Table 13. Mass ions and collision energies detected by fragmentation of pesticide parent
molecules by APCI
Results indicated that APCI had limited application for the detection of linuron, oxyflurofen
and the esters of the acid moiety pesticides. Again, poor results were obtained for tebuconazole,
with no daughter ions generated. However, excellent results were obtained for prometryn,
sethoxydim, simazine, bromacil and terbacil. Also, compared to ESI, APCI was slightly more
sensitive for the commonly used pesticides, tebuconazole and propiconazole and showed a
response, though poor, to linuron and oxyflurofen. In addition, APCI is the preferred ionisation
method for several reasons;
APCI uses less nitrogen gas compared to ESI, making overnight runs less costly;
• APCI does not have the high back pressure associated with ionisation by ESI such that APCI
can be run in conjunction with UV-VIS without risk of damaging the UV cell, which is
pressure sensitive.
Chromatography
Once the ions to be monitored by mass spectrometry were established the retention
characteristics of the analytes were assessed using the acetonitrile / ammonium acetate buffer
elution profile on the RP column. The chromatographic characteristics of the triazole pesticides,
propiconazole and tebuconazole were poor. In addition, bromacil, simazine and terbacil eluted in
a very narrow time frame under the mobile phase conditions tested. Terbacil had a higher
63

response in the negative mode by APCI. The MS trap has the capability to switch from the
positive mode to the negative several times within a single run. However, the similar elution
characteristics of simazine, which is ionised in the positive mode, precluded the monitoring of
these three pesticides in the same screen as there was insufficient separation to allow for
switching between the ionisation modes.
Overall, however, the mobile phase has general application to most of the pesticides
trialed. Fine tuning of the phase gradient, adjustments of the pH to provide better resolution of
the haloxyfop esters and triazine pesticides and trials of alternative mobile phases are all aspects
which warrant further experimentation.
The preliminary method developments described form the foundation on which
comprehensive method development can continue. The process of establishing the ionisation
properties and optimising tuning files, collision energies and isolation widths was undertaken for
a range of chemicals to be included in a general screen. An example of method development is
shown below.
Experiments Undertaken in the Process of Method Development Example 7. Method Development for the Analysis of 14 Pesticides by HPLC MSMS Using APCI in the Positive Mode.
Aim: To undertake method development for acephate, carbaryl, cyanazine, dicamba, dimethoate,
difenoconazole, ethofumesate, glyphosate, pirimicarb, pendimethalin, procymidone, mcpa,
monocrotophos and propazine.
Experimental: As previously described, standards of all the target analytes were prepared to
concentrations of 10 µgmL-1 in acetone and each were introduced into the MS via the continuous
flow worm drive with the mobile phase of 50/50 0.1M ammonium acetate buffer / acetonitrile
flowing from the HPLC at 0.8 mLmin-1. The ionisation potential, [M + H]+ ion, daughter ion,
collision energy (CE) and isolation width were determined for each compound. Target
compounds which had good ionisation potential in positive mode APCI were then analysed by
HPLC MS using the mobile phase previously established.
64

Results: Table 14 lists the optimised parameters for the analytes to be included in the screen.
analyte M.W. parent daughter band C.E. notes ions ions width
acephate 183 184 143 3 13 buffer adduct=loss signal carbaryl 201 202,203 143,145 4 20 good ionisation but lost in LC cyanazine 240 241,243 214,216 5 18 pot. Int. std. dicamba 220 219, 221 175,177 8 17 daughter ion weak, try -ive dimethoate 229 230 199 4 20 good ionisation but lost in LC difenaconazole 405 406,408 337,339,341 6 22 good signal - double peak ethofumesate 286 287 259,241,207 4 20 3 daughters similar inten.=poor glyphosate 169 no ion. possible ESI or -ive APCI pirimicarb 238 239,240 182,195 3 22 strong signal pendimethalin 281 282,283 212,213 4 20 strong signal but lost in LC procymidone 283 282,284(-) 161,163 6 23 weak signal-alternative LC MCPA 200 199,201(-) 141,143 5 18 poor signal mecoprop 213,214 141,143 4 18 +ive & -ive monocrotophos 224,225 193,167,98 5 22 strong signal & LC peak propazine 229 230,232 188,190 5 18
Table 14. Parameters established for the analysis of pesticides by APCI in the positive
mode.
Discussion: The results listed above formed the basis for the inclusion of monocrotophos,
pirimicarb, propazine and difenaconazole into the standard screen already established. Acephate,
carbaryl, dimethoate, ethofumesate and pendimethalin all require further work for enhanced
ionisation and/or improved elution profiles. Negative ionisation mode for APCI gives improved
characteristics for dicamba, procymidone, MCPA and mecoprop but this ionisation mode was
compromised by the acetate buffer. Analytes that ionised in the negative APCI mode were
incorporated into a separate screen which included bromacil and the pesticides with an acidic
moiety.
The thirteen pesticides included in this general screen were monocrotophos, simazine,
cyanazine, pirimicarb, propazine, sethoxydim, prometryn, tebuconazole, propiconazole,
difenoconazole and the esters of fluroxypyr, fluazifop and haloxyfop. Bromacil and terbacil were
not included as both require negative ionisation and elute within the same retention time window
as simazine, which requires positive ionisation.
The method validation was conducted for three oils, peppermint, parsley and fennel.
65

Experiments Undertaken in the Process of Method Development Example 8.
Method Validation for the Analysis of 10 Pesticides in Distilled Oils
Aim: To validate the method developed for the analysis of 10 pesticides in peppermint, fennel and
parsley oil.
Experimental: Four 200 µL (~200 mg) aliquots of each of peppermint, fennel and parsley oil
were dispensed with an Eppendorf pipette into GC vials and 800 µL of acetone was added. Stock
solutions (1 mgmL-1) of the 10 pesticides were prepared in volumetric flasks in acetone, which
were then diluted to 100, 10 and 1 µg/mL standard solutions. Oils were fortified with solutions of
the mix of the 13 pesticides to the equivalent of 0.1, 0.5, 1.0 and 10 mgkg-1. All fortified oils
were spiked with 20 µL of 100 µgmL-1 solutions of cyanazine as an internal standard. The oils
were analysed by LC using the following conditions.
Analytical Parameters: A Waters 2690 separation module (Alliance) system equipped with a
NOVAPAK C18, 3.9 x 150 mm column was used to establish a mobile phase with gradient of
50:50 acetonitrile / 0.1M ammonium acetate buffer ramped to 90:10 over 15 minutes. A Finnigan
MAT LCQ was used to monitor the ions listed in Table 15 within the relevant time windows.
analyte M.W. of centre of isolation collision product tentative retention
major isotope
parent m/z window [M+H]
width (amu) energy (CE) %
ions monitored identification time (mins)
monocrotophos 223 224 5 22 193 [M+H-CH3NH2]+ 1.50 simazine 201 202 4 18 124 [M+H-C2H5ClN]+ 2.56 cyanazine 240. 242 5 18 214,216 [M+H-HCN]+ 2.45 pirimicarb 238 239 3 22 182 [M+H-C3H7N]+ 3.11 propazine 229 231 5 18 188,190 [M+H-C3H6]+ 4.12 sethoxydim 327 328 5 17 282 [M+H-C2H6O]+ 3.90 prometryn 241 242 5 20 200 [M+H-C3H6]+ 5.15 tebuconazole 307 n/a n/a n/a 308,310 [M+H]+ 5.50 propiconazole 341 344 6 21 159,161 [C7H4Cl2+H]+ 6.58,6.66 difenaconazole 406 408 6 22 337,339 [M+H-C2H3N3]+ 7.62,7.81
Table 15. Parameters and conditions for the monitoring of ions monitored by MS.
66

Results: Figure 23 shows the HPLC MS trace for the analysis of pesticides listed in Table 15.
RT: 0.01 - 5.17
0.5 1.0 1.5 2.0 2.5 3.0 3.5 4.0 4.5 5.0
Time (min)
0
50
100
0
50
100
0
50
100
0
50
100
0
50
100monocrotophos
RT: 1.49AA: 4137884
simazine
RT: 2.56MA: 2522163
RT: 2.45MA: 1986999
pirimicarbRT: 3.13AA: 9862826
propazineRT: 4.11MA: 23349203
NL: 7.47E5
m/z= 192.5-193.5 F: + c SRM ms2 224.00 [ 165.50 - 194.50]
NL: 4.14E5m/z= 123.5-124.5 F: + c SRM ms2 202.00 [ 122.50 - 125.50]
NL: 3.52E5m/z= 212.0-218.0 F: + c SRM ms2 242.00 [ 212.50 - 217.50]
NL: 1.42E6m/z= 181.5-182.5 F: + c SRM ms2 239.00 [ 181.00 - 196.00]
NL: 2.90E6m/z= 187.5-188.5 F: + c SRM ms2 231.00 [ 186.50 - 189.50]
RT: 1.74 - 10.27
2 3 4 5 6 7 8 9 10
Time (min)
0
50
100
0
50
100
0
50
100
0
50
100
0
50
100
sethoxydim
RT: 4.09MA: 10313193
prometrynRT: 5.18MA: 30994994
folicurRT: 5.54MA: 8354032
tiltRT: 6.68MA: 2375398
difenoconozoleRT: 7.62MA: 32135613
NL: 1.13E6
m/z= 281.5-282.5 F: + c SRM ms2 328.00 [ 280.50 - 283.50]
NL: 4.19E6m/z= 199.0-200.8 F: + c SRM ms2 242.00 [ 198.50 - 201.50]
NL: 8.64E5m/z= 307.5-308.5 F: + c SIM ms [ 306.50 - 309.50]
NL: 2.03E5m/z= 158.5-159.5 F: + c SRM ms2 344.00 [ 157.50 - 160.50]
NL: 1.96E6m/z= 336.5-337.5 F: + c SRM ms2 408.00 [ 335.00 - 339.00]
Figure 23. HLC MS trace for the analysis of 10 pesticides.
67

Tables 16, 17 and 18 present the detection limit achieved, the coefficients for the standard curves,
the 'r' square value and the r.s.d.s calculated for the responses recorded at the 1 mgkg-1 detection
level in fennel, parsley and peppermint respectively.
r.s.d. = (standard deviation / mean) x 100. Fennel analyte det. limit x coefficient r2 r.s.d.
µgkg-1 (at 1 mgkg-1) monocrotophos 20 0.932 1.000 3 simazine 10 0.585 0.999 6 pirimicarb 10 2.12 1.000 7 propazine 5 4.858 1.000 4 sethoxydim 25 2.493 1.000 4 prometryn 10 6.869 1.000 6 tebuconazole 100 1.926 0.999 7 propiconazole 100 0.509 0.999 5 difenoconazole 10 7.248 1.000 3
Table 16. Method validation statistics for the analysis of pesticides in fennel distilled oil.
Parsley analyte det. limit x coefficient r2 r.s.d.
µgkg-1 (at 1 mgkg-1) monocrotophos 50 0.904 1.000 9 simazine 20 0.547 1.000 4 pirimicarb 20 1.995 1.000 8 propazine 0.5 4.45 1.000 6 sethoxydim 50 2.54 1.000 9 prometryn 0.5 5.827 1.000 6 tebuconazole 200 1.865 0.998 13 propiconazole 100 0.553 0.997 19 difenoconazole 10 7.134 1.000 6
Table 17. Method validation statistics for the analysis of pesticides in parsley distilled oil.
Peppermint analyte det. limit x coefficient r2 r.s.d.
µgkg-1 (at 1 mgkg-1) monocrotophos 20 1.029 0.999 7 simazine 20 0.645 1.000 11 pirimicarb 5 2.335 1.000 4 propazine 10 5.374 1.000 3 sethoxydim 25 2.69 1.000 5 prometryn 10 7.737 1.000 7 tebuconazole 200 2.125 0.998 16 propiconazole 50 0.558 0.996 11 difenoconazole 10 7.993 1.000 4
Table 18. Method validation statistics for the analysis of pesticides in peppermint
distilled oil.
68

Table 19 below records the r.s.d.s for repeat injections of fennel, parsley and peppermint
distilled oils fortified with the thirteen pesticides. Predictably, the values increase as the detection
limit is approached.
10 mgkg-1 1 mgkg-1 0.5 mgkg-1 0.1mgkg-1
Fennel monocrotophos 5 3 11 48 simazine 8 6 15 28 pirimicarb 7 7 9 4 propazine 7 4 4 14 sethoxydim 6 4 13 17 prometryn 7 6 5 19 tebuconazole 4 7 12 propiconazole 7 5 13 difenoconazole 6 3 8 15 Parsley monocrotophos 6 9 9 12 simazine 4 4 8 15 pirimicarb 4 8 2 21 propazine 4 6 3 14 sethoxydim 6 9 6 20 prometryn 2 6 5 7 tebuconazole 1 13 19 propiconazole 4 19 21 difenoconazole 4 6 5 11 Peppermint monocrotophos 4 7 9 14 simazine 4 11 20 38 pirimicarb 4 4 5 14 propazine 2 3 34 8 sethoxydim 6 5 10 22 prometryn 4 6 5 8 tebuconazole 6 16 15 propiconazole 5 11 26 difenoconazole 3 4 5 7
Table 19. R.S.D.s of repeat injections of fortified fennel, parsley and peppermint distilled
oils.
Discussion: HPLC MSMS provides an effective screen for pesticides in essential oils for ten
analytes with detection limits to 0.01 mgkg-1, excluding propiconazole and tebuconazole, which
can only be detected to levels of 0.5 mgkg-1. The type of oil analysed had minimal effect on the
response function as expressed by slope of the standard curve. The parsley oil selected for
background matrix for the method validation has background levels of prometryn such that the
standard curve did not pass through zero. These levels are in the order of 0.3 mgkg-1. Overall
method development experiments have found contamination of most parsley oils with this
69

pesticide. Location of an oil, not contaminated with prometryn, will allow for a repeat of this
validation experiment.
Experiments Undertaken in the Process of Method Development Example 9.
Method Validation for the Analysis of 10 Pesticides in Boronia concrete
Aim: A separate screen for detection in boronia extract of all the analytes listed in example 8 was
developed. A simple partition step was included in the extraction process to remove non-polar
components of the waxy extract.
Experimental: Stock solutions of 1 mgmL-1 of each of the 10 pesticides were prepared in acetone
using volumetric flasks. These were used to prepare mixed solutions of 100, 10 and 1 µgmL-1 by
volumetric serial dilution. Standard acetone solutions of 10 µgmL-1 and 100 µgmL-1 were used to
fortify 0.5 g of boronia concrete (weighed into 9 mL, 13 x 100 mm disposable test tubes) to
produce a calibration curve of 0.25, 1, 10 and 50 mgkg-1 relative to oil weight. Cyanazine (25 µL
of a 100 µgmL-1 solution) was added as an internal standard. The boronia concretes were
dissolved in 1 mL of hexane. The total volume of acetone in each tube was brought to 250 µL.
The samples were vortexed and 1 mL of methanol/water (5:1) was added. The mixtures were
again vortexed for 3 x 20 second bursts then centrifuged for 5 minutes at 3000 rpm to effect a
partition. The aqueous layer was sub-sampled using a disposable pipette and filtered through
cotton wool into a 200 µL GC vial insert. The samples were analysed by LC MS/MS using the
listed conditions. For determinations of recoveries, 1mL of methanol/water (5:1) were spiked at
concentrations equivalent to those prepared for the standard curve. 250 µL of acetone was added
to ensure the polarity was similar to the samples in boronia matrix. Samples for recovery
determinations were analysed under the same conditions as the standard solutions.
Analytical parameters: LC - A Waters 2690 separation module (Alliance) system equipped with
a NOVAPAK C18, 3.9 x 150 mm column preceded by a Alltech Econosphere C18, 5 µm guard
cartridge, was used to establish a mobile phase with gradient of 50:50 acetonitrile / 0.1M
ammonium acetate buffer ramped to 90:10 over 15 minutes. A Finnigan MAT LCQ APCI source
had a vaporiser temperature 450°C; sheath gas (nitrogen) at a pressure of 60 psi. with auxillary
gas at 20 psi.. Capillary temperature was 150°C with a voltage of 16 V. The corona current was
5 µA. The parent m/z, collision energies and product ions monitored are listed in Table 15.
70

Results & Discussion: The clean-up step used in the analyses of boronia required an assessment
of the suitability of cyanazine as an internal standard. The low recovery of 41.2 ± 0.7% of
cyanazine is offset by the excellent reproducibility. Table 20 lists the recoveries for the target
analytes across 4 concentration levels. mg/kg 50 10 1 0.25
analyte n mean ± SE mean ± SE mean ± SE mean ± SE
monocrotophos 4 123 ± 4 155 ± 7 178 ± 11 214 ± 11 simazine 4 38.4 ± 0.5 34 ± 1 34 ± 2 25 ± 3 pirimicarb 4 101 ± 1 107 ± 2 115 ± 2 109 ± 4 propazine 4 38.6 ± 0.5 43.3 ± 0.8 47.5 ± 0.5 49 ± 1 sethoxydim 4 35 ± 1 21.6 ± 0.3 20.7 ± 0.9 17 ± 2 prometryn 4 72.6 ± 0.8 66 ± 1 74 ± 2 81 ± 2 tebuconazole 4 105 ± 2 105 ± 3 119 ± 3 88 ± 7 propiconazole 4 24.4 ± 0.4 17.4 ± 0.5 15 ± 1 nil difenaconazole 4 72 ± 1 74 ± 0.5 75 ± 2 66 ± 2
Table 20. Percentage recoveries for target analytes in clean-up step for pesticides in
boronia
The high recoveries recorded for monocrotophos in boronia preclude the application of
this screen in quantitative experiments. The signal for ion m/z 193 is enhanced in the matrix of
boronia, probably as a result of co-eluting components in the boronia extract. As the level of
monocrotophos approaches the ppb level, the relative contribution of the co-eluting contaminant
increases. The recoveries for propiconazole, on the other hand are very low. However, the
repeatability of that low recovery, with an r.s.d. of 7% at 1 mgkg-1 still allows for the application
of this analytical method for the detection of gross contamination of propiconazole in boronia
concrete. Recoveries for simazine, propazine and sethoxydim are also less than 50%, however,
the consistency in the percentage of analyte recovered across the range of fortification levels
allows for the application of this analytical method to the screening of these three analytes in
boronia extract. Table 21 presents the detection limits achieved, the coefficients for the standard
curves, the 'r2' values and the relative standard deviations for the detection of all nine pesticides
investigated in boronia concrete.
71

Boronia concrete %rsd
det. limit x lin. reg. 50 10 1 0.25 analyte mg/kg coefficient fit (r2) mg/kg mg/kg mg/kg mg/kg
monocrotophos 0.15 0.140 0.993 2 2 8 10 simazine 0.1 0.038 1.000 3 3 11 22 pirimicarb 0.02 0.298 0.998 4 3 6 5 propazine 0.01 0.393 1.000 3 3 4 6 sethoxydim 0.1 0.115 0.994 3 4 7 17 prometryn 0.01 0.717 1.000 3 2 3 2 tebuconazole 0.2 0.287 0.990 3 2 9 16 propiconazole 0.2 0.030 0.997 6 10 18 n/a difenaconazole 0.02 1.108 1.000 6 6 1 8
Table 21. Method validation for pesticides boronia oils by LC MSMS using ionisation with
APCI in the positive mode.
The application of HPLC MSMS to the Analysis of Pesticides with Acidic Moieties. The process for method development for the detection of this class of pesticide followed
the same protocols described in the preceding section. Tuning files were established optimising
the fragmentation and ionisation of haloxyfop, fluazifop, fluroxypyr acids and their parent esters.
Parameters were established by direct infusion of 1 µgmL-1 acetone solutions into the MS.
Fluazifop possessed good ionisation characteristics using ESI. The elution profile for the esters
and the acids under the acetonitrile / ammonium acetate buffer RP chromatography showed
acceptable resolution but the responses for haloxyfop and fluroxypyr esters were poor with
haloxyfop registering a response thirty times lower than that of fluazifop. This variation in
response was partly due to the haloxyfop ester being present in the standards as both the ethyl and
methyl esters, effectively splitting the relevant peak. Table 22 records the ions monitored and the
relevant retention times.
72

analyte MW MS MSMS ret. time isol. window & C.E.
fluazifop-butyl 383 384 (+) 328 11.1 5 amu 19% fluazifop acid 327 326 (-) 254 3 amu 17% haloxyfop ethyl 433,435 434/436 (+) 316,318 10 6 amu 25% haloxyfop acid 361,363 360/362 (-) 288,290
361 288,290 4 amu 26% fluroxypyr methyl heptyl 366,368,370 367,369,371 (+) 255,257 12.7 6 amu 18% fluroxypyr acid 255,256,258 253,255,257 (-) 233,235 6 amu 17%
Table 22. MS parameters for the detection of the parent ester and acid forms of fluazifop,
haloxyfop and fluroxypyr.
Poor chromatography and response necessitated an improved mobile phase and the effect
of pH on elution characteristics was considered the most critical parameter.
The acidic nature of the active ingredient of this class of pesticide presented a moiety
which may be exploited in an extraction protocol. The inclusion of an aqueous extraction,
however, precluded the simultaneous analysis of the parent esters with the carboxylic acid forms.
The development of a screen for the pesticides with an acidic moiety proceeded with the
inclusion of an extraction step whilst the esters were to be included in the general screen using
APCI in the positive mode.
Extraction Protocol for Pesticides with Acidic Moieties Under basic conditions, the acid moiety of this class of pesticide is de-protonated
facilitating the extraction of the analytes from the essential oil into an aqueous layer. Preliminary
experiments whereby distilled oil samples were extracted with 0.01M NaOH, which was acidified
and back extracted with dichloromethane (DCM) had limited success. LC UV analysis of the
DCM confirmed that very little essential oil residue was co-extracted through the process but
recoveries were poor. The pesticides within this class are weak acids. The 0.01M NaOH was
replaced with 0.01M NaHCO3, which was adjusted to a pH of 10 with NaOH. In addition, the
acidification and subsequent back extraction with DCM was removed as it was considered that
only a limited amount of essential oil components should be soluble in an aqueous extract which
was analysed directly. To prevent excessive dilution of the pesticide extracts the ratio of essential
oil to NaHCO3 solution was lowered to 4 : 1. Recoveries and reproducabilities were improved
with these modifications.
73

The inclusion of an internal standard negates the errors introduced by inaccurate sub-
sampling and dilutions. The agents 2,4-D and 2,4,5-T were proposed as suitable internal
standards and both were introduced in the MS using direct infusion to determine the ionisation
and fragmentation parameters. Table 23 records the parameters established for 2,4-D, 2,4,5-T,
and for the acidic pesticides dicamba, MCPA and mecoprop.
analyte M.W. of centre of isolation collision product tentative retention
major isotope
parent m/z window [M+H]
width (amu) energy (CE) %
ions monitored identification time (mins)
dicamba 220 n/a n/a n/a 219,221 [M-H]+ 2.16 fluroxypyr 254 254 6 17 233,235 [M-H-H2O]+ 2.50 2,4-D 220 221 6 20 161,163 [M-H-C2H2O2]+ 4.13 MCPA 200 200 5 18 141,143 [M-H-C2H2O2]+ 4.51 2,4,5-T 254 255 8 20 195,197,199 [M-H-C2H2O2]+ 5.86 mecoprop 214 214 4 18 141,143 [M-H-C3H4O2]+ 6.02 haloxyfop 361 361 4 26 288,290 [M-H-C2H4O2]+ 8.89
Table 23. MS parameters for the monitoring of 2,4-D, 2,4,5-T dicamba, MCPA and
mecoprop.
The parameters established in the preliminary investigations were used in the validations
for the detection of pesticides with acidic moieties were conducted. The densities of parsley oil
were quite variable such that multi-layers were present when non-polar/aqueous partitions were
established during the extraction process. Validations were conducted for peppermint and fennel
distilled oils only.
Experiments Undertaken in the Process of Method Development Example 8.
Method Validation for the Analysis of Acidic Pesticides by HPLC MSMS.
Aim: To conduct method validation for the extraction and analysis for residues of pesticides with
acidic moieties in fennel and peppermint distilled oils.
Experimental: Commercially produced oils were combined to produce a blended oil with uniform
characteristics. Aliquots (20 x 5 mL) of each of peppermint and fennel oils were dispensed into
50 mL test tubes. Extracting solvent (1 mL of 0.01M NaHCO3 adjusted to pH 10 with NaOH)
was added and the mixtures were vortexed for 4 x 15 second bursts. The emulsions were
74

transferred to 13 x 100 mm borosiliate glass tubes and centrifuged at 2500 rpm for 15 minutes.
The aqueous layers were transferred to a 10 x 75 mm borosilicate glass tubes using pasteur
pipettes. Hexane (1 mL) was added to each and the mixtures were vortexed for 2 x 15 second
bursts to remove residual oil contaminants. The mixtures were centrifuged at 2000 rpm for 5
minutes and 250 µL of the aqueous layers were quantitatively transferred to a GC vial inserts.
Internal standard (10 µl of a 50 µgmL-1 solution of 2,4,5-T) was added to each and the samples
analysed using the conditions listed.
Analytical Parameters: A Waters 2690 separation module (Alliance) system equipped with a
NOVAPAK C18, 3.9 x 150 mm column was used to establish a mobile phase with gradient of
50:50 acetonitrile / 0.1M ammonium acetate buffer (adjusted to 3.8 with acetic acid) ramped to
90:10 over 15 minutes. A Finnigan MAT LCQ was used to monitor the ions listed in Table 22
and 23 within the relevant time windows.
Results: Figure 25 shows the trace for the analysis of acidic pesticides by HPLC MS.
RT: 0.01 - 11.81
1 2 3 4 5 6 7 8 9 10 11Time (min)
0
1000
100
0
100
0
100
0
100
0
100
0
100 dicamba2.16
2.53
fluroxypyr2.50
2.91
2,4D4.13
4.44
MCPA4.51
2,4,5-T5.86
mecoprop6.02
haloxyfop8.89
NL: 1.56E6
m/z= 218.3-219.3+220.3-221.3 F: - c SIM ms [ 218.00 - 284.00]
NL: 1.73E6m/z= 232.5-233.5+234.5-235.5 F: - c SRM ms2 254.00 [ 232.00 - 236.00]
NL: 2.02E6
m/z= 160.7-161.7+162.7-163.7 F: - c SRM ms2 221.00 [ 160.00 - 164.00]
NL: 2.57E6m/z= 140.7-141.7+142.7-143.7 F: - c SRM ms2 200.00 [ 140.00 - 144.00]
NL: 1.85E6m/z= 140.7-141.7+142.7-143.7 F: - c SRM ms2 214.00 [ 140.00 - 144.00]
NL: 3.15E6m/z= 287.7-288.7+288.7-289.7 F: - c SRM ms2 361.00 [ 287.00 - 291.00]
NL: 5.76E5
m/z= 194.7-195.7+196.7-197.7+198.7-199.7 F: - c SRM ms2 255.00 [ 193.00 - 201.00]
Figure 25. HPLC MS trace of analyse of acidic pesticides.
Table 24 records the detection limits, the slopes of the linear regression describing the
standard curves established, 'r2' value pertaining to the fitted curves and the reproducibilities as
75

described by the r.s.d.s for the analysis of the acidic forms of dicamba, fluroxypyr, mcpa,
mecoprop and haloxyfop acid. Table 25 records the r.s.d.s for each pesticide at each fortification
level in fennel and peppermint oil.
analyte det. limit x coefficient r2 %rsd Fennel mgkg-1 (at 1 mgkg-1)
dicamba 0.1 4.25E-06 0.999 2 fluroxypyr 0.1 3.20E-06 0.995 7 MCPA 0.01 2.28E-06 0.992 4 mecoprop 0.01 3.99E-06 0.995 6 haloxyfop 0.01 3.24E-06 0.997 6 Peppermint
dicamba 0.1 3.86E-06 0.999 13 fluroxypyr 0.01 3.28E-06 0.996 15 MCPA 0.01 2.78E-06 0.998 18 mecoprop 0.01 6.89E-06 0.999 20 haloxyfop 0.01 1.63E-06 0.999 14
Table 24. Detection limits correlation co-efficients and standard curve statistics for the
detection of pesticides with acidic moieties in fennel and peppermint distilled oil.
10 mgkg-1 1 mgkg-1 0.5 mgkg-1 0.1mgkg-1
Fennel
dicamba 9 2 16 fluroxypyr 8 7 8 MCPA 9 4 6 22 mecoprop 11 6 8 42 haloxyfop 12 6 5 50 Peppermint
dicamba 5 13 42 fluroxypyr 2 15 10 9 MCPA 5 18 6 31 mecoprop 4 20 18 7 haloxyfop 8 14 13 51
Table 25. R.S.D.s for the detection of pesticides with acidic moieties in fennel and peppermint distilled oil.
Discussion: The aqueous extraction and detection by HPLC MSMS in the negative mode of
pesticides with acidic moieties has excellent detection limits, is reproducible and gives a linear
relationship between analyte concentration and peak area.
76

The Application of Direct MSMS to the Analysis of Quaternary Ammonium Salts The quaternary ammonium salts form a distinctive class of pesticides. The method
development for the two main products used in the Australian essential industry, paraquat and
diquat, initially follow the same processes as the preceding methodologies, however, the
problems encountered are very specific to this chemical type.
Acetone / water solutions (50:50) of paraquat and diquat (1 mgmL-1) were diluted to 10
µgmL-1 and introduced into the MS using a continuous flow worm driven syringe at a flow rate of
0.8 mLmin-1. Initial trials of ESI showed excellent ionisation response. Parameters established
are listed in Table 26. analyte molecular M.W. parent ion daughter isolation collision
formula (+ive) ion width energy
diquat C12H12N22+ 184 183+ 157 4 17.1%
paraquat C12H14N32+ 186 186+ 171 1.5 17.1%
Table 26. MS parameters for the detection of diquat and paraquat.
The application of liquid chromatography to the separation of paraquat and diquat
presented difficulties. The effects of low solubility in organic solvents and the predisposition of
both analytes to absorb on to most surfaces was manifest by their complete loss when analysed by
the standard HPLC protocols. An alternative approach to the analysis of quaternary ammonium
salts was required.
Paraquat and diquat are both very soluble in water and virtually insoluble in
hydrocarbons. A water extraction of essential oils would be expected to effectively remove
paraquat and diquat from an oil extract with very little of the oil components co-extracting. The
power of mass spectrometry allows for the monitoring of ions specific to the target analyte
despite the collection of large amounts of background ions. An aqueous extract of paraquat and
diquat from essential oils may contain so few co-extracted oil components that direct injection of
samples into the injection loop of the mass spectrometer may be conceivable. The associated loss
of analyte within the LC system would be avoided. A post-column injection would still require
the continuous flow of mobile phase from the LC system through the injection loop of the mass
spectrometer, however the approach would also have the added advantage of a quick analysis turn
around time. This would offset the loss of automation that direct injection into the loop of the
mass spectrometer would represent.
77

The adsorption problems also had consequences for the reproducibility of direct manual
injections into the mass spectrometer. Repeated 20µL loop injection of a 0.5 mgmL-1 water
solution of paraquat and diquat showed a rapid decrease in response over 5 minutes, with
decreases extremely pronounced for diquat as illustrated in Figure 26.
RT: 0.01 - 47.76
2 4 6 8 10 12 14 16 18 20 22 24 26 28 30
Figure 26. Repeat injections of paraquat and diquat solutions.
In addition to the loss of analyte by absorption other problems encountered were shorting
across the ionisation source which was possibly related to the acetonitrile / ammonium acetate
buffer. The replacement of acetonitrile with methanol alleviated this problem.
The adsorption of quaternary ammonium salts onto surfaces has been encountered by
other research groups. Kaniansky et al., (1994) reported the introduction of serious analytical
errors in the analysis of paraquat and diquat at low concentrations by adsorption losses of the
analytes in sample storage containers. These were eliminated by spiking samples with
diethylenetriamine (DETA). DETA was found to preferentially accumulate on the surfaces of
sample containers, competitively binding on the adsorption sites.
Table 27 presents the areas for repeat injections of the fennel oil extracted in glassware
pre-conditioned with 5% of a 0.1M DETA solution compared to extractions in glassware not
conditioned.
32 34 36 38 40 42 44 46Time (min)
0
10
20
30
40
50
60
70
80
90
100
Rel
ativ
e A
bund
ance
RT: 9.42AA: 839050
RT: 38.78AA: 713276RT: 5.66
AA: 795152RT: 33.60AA: 673516
RT: 24.56AA: 740456
RT: 41.49AA: 622433
RT: 11.85AA: 712836
RT: 18.18AA: 668402
RT: 14.74AA: 734053
RT: 21.48AA: 612331
RT: 30.89AA: 557462
RT: 36.40AA: 585527
RT: 27.04AA: 618054
RT: 44.98AA: 611718
RT: 2.35AA: 583405
RT: 42.73AA: 133825
NL:1.29E5TIC F: + p SRM ms2 183.00 [ 156.00 - 159.00]
RT: 0.01 - 47.75
2 4 6 8 10 12 14 16 18 20 22 24 26
diquat
28 30 32 34 36 38 40 42 44 46Time (min)
0
10
20
30
40
50
60
70
80
90
100
Rel
ativ
e A
bund
ance
4.17
7.47
16.69 29.3513.07 23.0710.6826.1019.86
34.77 40.2742.8032.15 37.57
23.25 46.3326.2313.30 20.04 25.96 42.8916.9210.96 13.48 40.4635.004.72 46.1937.8923.4811.05 29.7217.2913.75 32.618.16 20.27 26.55 40.69 43.164.90 23.62 35.3630.2217.792.61 8.48 21.60 27.5615.912.38
NL: 1.22E5m/z= 156.0-173.0 F: + p SRM ms2 186.00 [ 170.00 - 173.00]
paraquat
78

paraquat diquat
parent ion 186 183 daughter range 170-173 (peak area) 156-159 (peak area) mgkg-1 + DETA - DETA + DETA - DETA
0.01 23234 5860 15028 12206 17824 4145 32109 6302 35127 9840 32640 20810
mean 25253 7671 std. Dev. 7986 3273 R.S.D. 32 43 + deta / -deta 3.3
0.1 186155 149364 144892 54473 206904 112825 126952 44854 273962 106703 146982 43708 236205 107986 99221 48236 183563 97298 102230 70337 231997 88943 173454
mean 213177 110520 124055 52322 std. Dev. 36064 20859 22701 10907 R.S.D. 17 19 18 21 + deta / -deta 1.9 2.4
0.5 374669 763011 505016 490703 474457 438389 420107 407946 385911
mean 432032 525012 std. Dev. 56317 162305 R.S.D. 13 31 + deta / -deta 0.8
linear regression r2 0.999 0.998 0.986 0.984
Table 27. Effect of the inclusion of DETA treated glassware in the area response for the
analysis of paraquat and diquat.
The inclusion of a DETA solution pre-treatment of all glassware has effected:
• a 3.3 fold increase in paraquat response at 0.01 mg/kg-1 fortification level;
• a 2.4 fold increase in diquat response at the 0.1 mgkg-1 fortification level;
79

• an increase in the repeatability of the analysis for paraquat as expressed by the relative
standard deviation (r.s.d.), lowered from 43 to 32%;
• an increase in the linearity of the standard curve at low concentrations as expressed by the
improved 'r2' values for both paraquat and diquat.
In addition to this experiment, 100 mgkg-1 samples of paraquat and diquat in fennel oil stored
for two weeks in un-treated glassware and glassware pre-treated with DETA solutions were
compared to freshly prepared standard extracts. Areas for the peaks of the respective treatments
are presented in Table 28.
0.1 mgkg-1 paraquat diquat parent ion 186 183 daughter range 170-173 (peak area) 156-159 (peak area)
+ DETA - DETA + DETA - DETA 2 weeks 8866 bdl 16903 bdl
< 12 hours 213177 110520 124055 52322
Table 28. Effect on the area response of the inclusion of glassware pre-conditioned with
DETA on the stability of paraquat and diquat in storage.
Results in Table 28 confirm that despite the improved response and reproducibility afforded
by the use of glassware pre-treated with DETA, depletion of both paraquat and diquat in solutions
necessitates the preparation of standards and samples on the day of analysis. Reproducibility in
the analyses of paraquat and diquat was further improved by including the following measures:
• pre-conditioning of all glassware to be used in the extraction procedures;
• extraction of all oil samples with DETA solutions;
• the inclusion of DETA in all solutions, including standard stock solutions;
• changing of mobile phase to 50 : 50 100 µM DETA / methanol;
• minimising of contact with all metallic surfaces in the flow path, including the
replacement of the metal injection loop with teflon.
80

Experiments Undertaken in the Process of Method Development Example 10.
Method Validation for the Detection of Paraquat and Diquat.
Aim: To determine the repeatability of the detection of paraquat and diquat using HPLC MSMS
Experimental: Fennel oil (16 x 5 mL) were weighed into 10 mL glass tubes, previously washed in
a 5% solution of 0.1M DETA and dried. Freshly prepared 10 µgmL-1 and 50 µgmL-1 solutions of
paraquat and diquat were used to spike each of 5 mL of fennel oils to produce fortification levels
of 0.1, 0.5 and 1.0 mgkg-1. The fortifications were repeated four times at each concentration to
determine repeatability of the method. The oils were extracted with 2 mL of 0.1M DETA
solution and vortexed for 3 x 20 second bursts. The tubes were centrifuged at 2500 rpm for 15
minutes and the aqueous layers were transferred into 10 x 74 mm 'Kimbal' tubes. The solutions
were washed with 0.75 mLs of DCM.
Analytical parameters: A Waters 2690 separation module (Alliance) system equipped with a
NOVAPAK C18, 3.9 x 150 mm column was used to establish an isocratic mobile phase of 50 : 50
DETA : methanol mobile phase. A Finnigan MAT LCQ was used to monitor the parent ion 186
for diquat with the daughter ion in range 170 to 173 and the parent ion 186 for paraquat with the
daughter ion range of 156 to 159. Manual injections to fill a 25 µL teflon loop were interposed
into the LC mobile phase post-column and introduced directly into the MSMS. Each injection
was repeated six times for each of the four repeats of each fortification level and the areas
averaged.
Results: Table 29 records the results obtained. diquat (mgkg-1) µg Response (mean area) r.s.d.
0.0 0 0 0.1 0.5 9528314 14 0.5 2.5 14776066 6 1.0 5 18640057 8
paraquat (mgkg-1) µg Response (mean area) r.s.d.
0.0 0 0 0.1 0.5 4494099 14 0.5 2.5 14490788 12 1.0 5 17807392 10
Table 29. Repeatability of the detection of paraquat and diquat using HPLC MSMS
81

Discussion: The results in Table 29 show a non-linear relationship between analyte concentration
and peak area for the analysis of paraquat and diquat by HPLC MSMS. A curve fit describing the
shape of the curve with a second order polynomial gave a 'r2' value of 0.971 and 1.000 for
paraquat and diquat respectively. At low concentrations adsorption problems seem more
pronounced for paraquat, such that the response for this analyte is half that seen for diquat at the
0.1 mgkg-1 level.
The problems encountered for the detection of paraquat and diquat at levels of 1 mgkg-1
have, to the greater extent, been overcome. Problems affecting linearity of the response at low
levels are evident but the method has been shown to be robust and efficient.
The Application of LC MSMS to the Analysis of Mancozeb This methodology is still in developmental stages, however, the details of progress to
date may be useful as an indication as to the applicability of LC MS/MS to the analysis of
dithiocarbamates.
The widely accepted method for the analysis of dithiocarbamate pesticides, that is
headspace GC FPD analysis of carbon disulfide produced by the acidified stannous chloride
digestion of dithiocarbamates (page 46), is not suitable for the analysis of essential oils. Sulfur
chemicals are endogenous to many essential oil crops and will produce carbon disulfide when
subjected to acidic digestion.
Gustafsson and Thompson (1981) developed a HPLC UV method for the determination
of dithiocarbamates using a EDTA / NaOH extraction followed by methylation with methyl
iodide. This method was adapted with the intention of using detection by HPLC MS/MS.
CH2
NH CCH2
NH C CH2
NH CCH2
NH C
aq.(pH 6.5-8.5)
CHCl3 -hexane (3:1)
TBAS
NaOH
EDTA
S
S
SCH3
SCH3mancozeb SNa
SNa
S
S
When mancozeb is extracted in an NaOH / EDTA solution the salt produced is disodium N, N'-
ethylenebis(dithiocarbamate), which is transferred across the aqueous organic interface into a
methyl iodide hexane / chloroform solution with the phase transfer reagent, tetrabutylammonium
hydrogen sulfate (TBAS), to produce dimethyl ethylenebis(dithiocarbamate) (DMED).
DMED was first synthesised using the method described by Gustafsson and Thompson
(1981). The product was then dissolved in acetone and introduced into the MS via the worm
drive syringe effecting direct infusion into the MS at a flow of 0.8 mLmin-1. The parent m/z ion
82

was 240.8 which when subject to a collision energy of 17% produced the daughter ion of m/z
192.8. The analyte was then introduced into the HPLC to be chromatographed on a NOVAPAC
C18 column with a 50 : 50 methanol : 0.1M ammonium acetate buffer mobile phase with a
gradient of 90 : 10 over 15 minutes. The analyte eluted at 5.2 minutes.
Mancozeb was dissolved in an EDTA / NaOH solution and TBAS was used to
transfer the solvated product into the chloroform / hexane layer containing methyl iodide.
However, when introduced into the HPLC MS, TBAS contaminated the entire system, such
that any signal from the target analyte was overwhelmed. This was overcome by the
washing the organic layer with water. Analyses by LC MS/MS gave positive results for
the mancozeb derivatives extracted from fortified NaOH / EDTA solutions down to the
0.25 mgkg-1 level. However, when essential oil was spiked with mancozeb and extracted
with NaOH / EDTA solutions and transferred into the organic layer for derivatisation with
MeI, no DMED was detected.
Further experimentation found that pre-washing the oil with NaOH / EDTA improved the
yield of DMED showing that the components of the oil, which are interfering in the analytical
procedure, are soluble in NaOH / EDTA and once removed allow for a successful extraction and
derivatisation of mancozeb. It was also concluded from further tests that increasing the
concentration of the phase transfer reagent, TBAS, was detrimental but that increasing the
concentration of the derivatising agent, methyl iodide, resulted in a marked increase in DMED
response. This would indicate that the essential oil components co-extracted with the mancozeb
may be competitively binding with methyl iodide
The separation of the ethylenebis(dithiocarbamate) salt from the aqueous phase was
attempted using specialised empore discs to allow for direct methylation without the need for
phase transfer reagent. Adapting the method of Wells et al. (2000), Emporite™ Anion-SR
exchange discs were to be used to selectively bind the salt produced by NaOH / EDTA solvation
of mancozeb. The discs were then dried at 60°C and the bound salt methylated with methyl
iodide in acetonitrile. In preliminary experiments the target analyte was not detected in any of the
extracted samples. It was found that the precursors and/or the target product were thermally
labile and that without heat, derivatisation could be accomplished. However, this methodology
was not taken to conclusion, despite showing some promise as a highly specific analytical
technique. Instead attention was diverted to the monitoring of manganese levels in oils to be
used as an indication of mancozeb contamination as detailed in the following pages.
83

Assessment of the application of ICP OES to the screening of essential oils ICP OES is used for elemental analysis. Samples, usually dissolved in aqueous solutions,
are introduced into a plasma formed by ionised gas in an oscillating magnetic field that reaches
extremely high temperatures. Atoms entering the plasma emit light (photons) with each element
producing a characteristic wavelength. This light is recorded by one or more optical
spectrometers and when calibrated against standards, provides a quantitative analysis. Obviously
most pesticides, which normally are present as contaminants at very low concentrations, would
not produce enough of any one element to register above background noise in a crude extract.
However, metals such as manganese, are trace elements in most vegetative materials and are only
present at very low levels. Mancozeb contains manganese and zinc in a ration of 10 : 1. Elevated
levels of these elements in samples treated with the pesticide may be indicative of mancozeb
contamination.
Initial trials were instigated to determine base levels of endogenous manganese / zinc
ratios and trial the effectiveness of standard digestion procedures. Digestions are traditionally
performed using nitric acid:perchloric acid (5:1). Samples are heated to 100°C for 2 hrs then
heated to 240°C and refluxed for 4 hrs. Sample volumes are then reduced to 1-2 mL on a heating
block under a stream of air, cooled and made up to 25 mL in volumetric flasks using distilled
water then filtered. This methodology was applied to the digestion of essential oils. Fennel
reacted moderately with the acid but formed amorphous lumps that were difficult to digest and
spontaneously combusted toward the end of the digestion. Parsley reacted violently with the acid
and combusted instantly resulting in the loss of the sample. Peppermint, on the other hand,
reacted only moderately. It was concluded that in addition to perchloric acid digests being
dangerous and unlikely to meet OH&S standards, essential oils do not react consistently under the
conditions trialed.
Digestions using H2SO4:H2O2 were trialed in samples of parsley, peppermint, fennel and
boronia oils. Sulphuric acid charred the oils such that a black solid mass formed in the bottom of
the tube. No ICP analysis was possible.
Due to the difficulty in digesting essential oils and the limited quantity of oil available for
analysis it was concluded part of the method proposed by Gustafsson and Thompson (1987) could
be adopted. A solution of 0.25M EDTA / 0.45M NaOH was used to complex mancozeb residues
allowing free manganese ions to pass into the aqueous phase. This method was found to be
successful, however, solutions had to be diluted 1 : 20 as the carbon content of co-extracted oil
components was too high. Despite this, increased mancozeb fortification levels coinciding with
higher levels of manganese detected. The manganese : zinc ratio recorded was not that expected
84

from the breakdown of mancozeb. Higher than expected levels of zinc may have been due to
contamination of glassware/reagents etc.
High carbon content was overcome by using a partly neutralised solution of 5 mM EDTA
/ 9 mM NaOH. Experiments were conducted to test the parameters of the method developed in
parsley, peppermint and fennel distilled oils and in boronia concrete.
Processes undertaken in the process of method development Example 11.
Method undertaken for the monitoring of manganese by ICP OES to screen for mancozeb in fortified essential oils.
Aim: To establish detection limits and linearity of response for the analyses of mancozeb in
essential oils using ICP OES
Experimental: Samples (5 mL) of peppermint, fennel and parsley were spiked with mancozeb
(suspended in acetone) at levels of 0.1 0.25, 1.0 and 10.0 mgkg-1. These were extracted with 2 x
5 mL of a 1 in 50 dilution of 0.25M EDTA / 0.45M NaOH and adjusted to pH 9.6. Boronia
extract (0.5 g) was dissolved in 5 mL of hexane prior to the sub-sampling of 5 mL such that only
2.5 grams of boronia matrix was extracted. Fortifications of boronia extracts were conducted as
for that undertaken for distilled oils. Solutions were vortexed for 3 x 20 seconds and centrifuged
for 10 minutes at 2500 rpm. The EDTA extracts were combined and washed with 3 mL of
hexane to remove any oil contamination.
Analytical parameters: Samples were submitted to the Central Science Laboratory, University of
Tasmania, for metals analysis. Mn and Zn were monitored using an 'IRIS" Inductively Coupled
Plasma Optical Emmission Spectrometer (ICP-OES, Thermo Jarrell Ash (Franklin, Ma, USA)).
Instrument tuning, optimisation and calibration were performed daily. Standard mixtures were
prepared in 5% (v/v) HNO3, with quantitation by means of external calibration. Each calibration
protocol typically consisted of a blank and 3-5 standards covering the concentration range 0 to
200 mgL-1. Commercial reference preparations (AccuStandard Inc, ICPMO143-5 and
ICPMO165-5, New Haven, CT, USA) were analysed regularly as quality control samples
(accurate to <10% for all elements considered). Sample uptake time to the ICP-OES was ~60
seconds, while the rinse time between samples was also ~60 seconds.
Results: Table 30 records the results obtained.
85
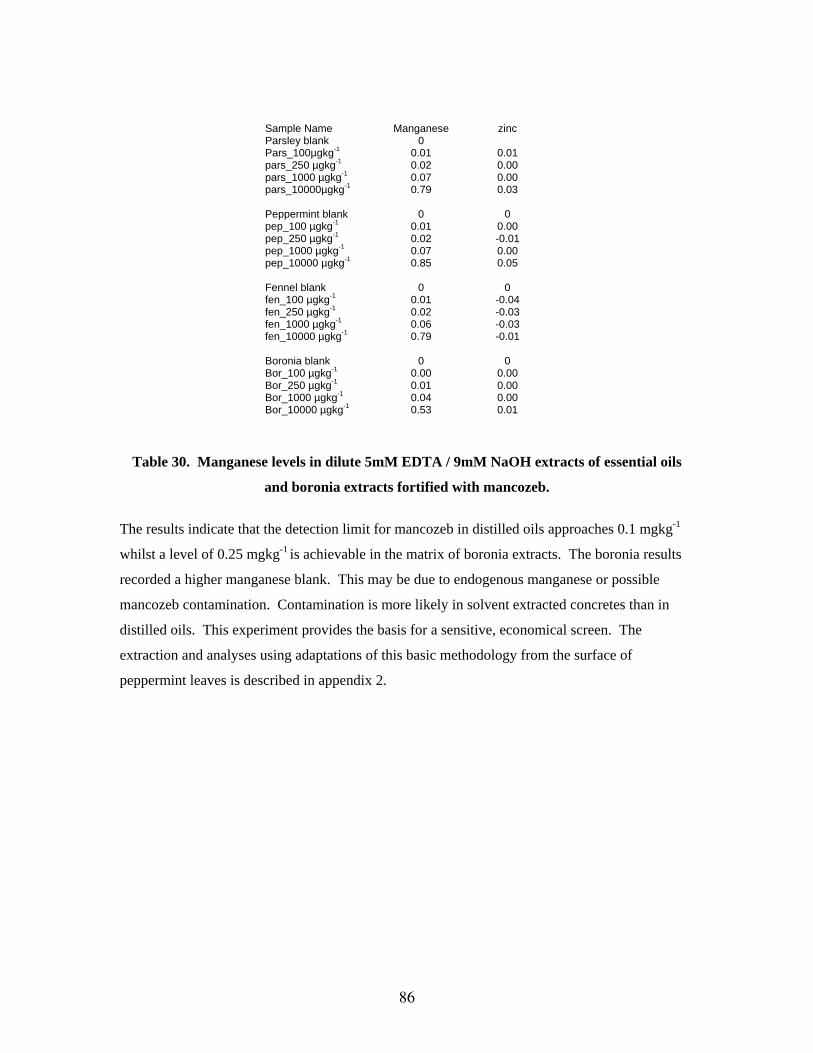
Sample Name Manganese zinc Parsley blank 0 Pars_100µgkg-1 0.01 0.01 pars_250 µgkg-1 0.02 0.00 pars_1000 µgkg-1 0.07 0.00 pars_10000µgkg-1 0.79 0.03 Peppermint blank 0 0 pep_100 µgkg-1 0.01 0.00 pep_250 µgkg-1 0.02 -0.01 pep_1000 µgkg-1 0.07 0.00 pep_10000 µgkg-1 0.85 0.05 Fennel blank 0 0 fen_100 µgkg-1 0.01 -0.04 fen_250 µgkg-1 0.02 -0.03 fen_1000 µgkg-1 0.06 -0.03 fen_10000 µgkg-1 0.79 -0.01 Boronia blank 0 0 Bor_100 µgkg-1 0.00 0.00 Bor_250 µgkg-1 0.01 0.00 Bor_1000 µgkg-1 0.04 0.00 Bor_10000 µgkg-1 0.53 0.01
Table 30. Manganese levels in dilute 5mM EDTA / 9mM NaOH extracts of essential oils
and boronia extracts fortified with mancozeb.
The results indicate that the detection limit for mancozeb in distilled oils approaches 0.1 mgkg-1
whilst a level of 0.25 mgkg-1 is achievable in the matrix of boronia extracts. The boronia results
recorded a higher manganese blank. This may be due to endogenous manganese or possible
mancozeb contamination. Contamination is more likely in solvent extracted concretes than in
distilled oils. This experiment provides the basis for a sensitive, economical screen. The
extraction and analyses using adaptations of this basic methodology from the surface of
peppermint leaves is described in appendix 2.
86

Preliminary clean-up methodology
Liquid / liquid extraction of pesticides from solvent extracted oils Direct analysis of solvent extracted concretes such as boronia and blackcurrant is
limited as the complex mixtures usually include low polarity hydrocarbons and waxes
which contaminate and reduce sensitivity in most analytical machines. A simple partition
clean-up step can be effective in removing non-polar components. This allows for the
introduction of the samples onto LC systems with reduced risk of blocking the guard
columns or non-polar phase LC columns. Many of the non-polar compounds removed are
non-volatile so the inclusion of a liquid/liquid extraction can also reduce the loading into
the injector of GC based analytical methodologies.
Experiments Undertaken in the Process of Method Development Example 12
The application of liquid / liquid partition in the preliminary clean-up of pesticides in solvent extracted oils.
Aim: To determine the effectiveness and recoveries of pesticides extracted from boronia concrete
using liquid / liquid partition.
Experimental: Standard acetone solutions of 10 µgmL-1 and 100 µgmL-1 of the pesticides were
used to fortify 0.5 g of boronia concrete (weighed into 9 mL, 13 x 100 mm disposable test tubes)
to produce fortification levels of 0.25, 1, 10 and 50 mgkg-1, relative to oil weight. Cyanazine
(0.025 mL of a 100 µgmL-1 solution) was added to each as an internal standard. The total volume
of acetone in each tube was brought to 250 µL. The boronia concretes were dissolved in 1 mL of
hexane. The samples were vortexed and 1 mL of methanol : water (5:1) was added. The
mixtures were again vortexed for 3 x 20 second bursts then centrifuged for 5 minutes at 3000 rpm
to effect a partition. The aqueous layer was sub-sampled using a disposable pipette and filtered
through cotton wool into a 200 µL GC vial insert. The samples were analysed by LC MS/MS
using the listed conditions. To allow for an estimation of recoveries fortified oil extracts were to
be compared to aliquots of 1mL of methanol:water (5:1) which had been fortified at
concentrations equivalent to those prepared for the standard curve. Acetone (250 µL) was added
to each to ensure the polarity was similar to the samples in boronia matrix. Samples, prepared to
determine recoveries, were analysed under the same conditions as the standard solutions.
87

Results & Discussion: Table 31 lists the recoveries at each fortification level using
the liquid / liquid partition method described.
mg/kg 50 10 1 0.25
analyte n mean ± SE mean ± SE mean ± SE mean ± SE
monocrotophos 4 123 ± 4 155 ± 7 178 ± 11 214 ± 11 simazine 4 38.4 ± 0.5 34 ± 1 34 ± 2 25 ± 3 pirimicarb 4 101 ± 1 107 ± 2 115 ± 2 109 ± 4 propazine 4 38.6 ± 0.5 43.3 ± 0.8 47.5 ± 0.5 49 ± 1 sethoxydim 4 35 ± 1 21.6 ± 0.3 20.7 ± 0.9 17 ± 2 prometryn 4 72.6 ± 0.8 66 ± 1 74 ± 2 81 ± 2 tebuconazole 4 105 ± 2 105 ± 3 119 ± 3 88 ± 7 propiconazole 4 24.4 ± 0.4 17.4 ± 0.5 15 ± 1 nil difenaconazole 4 72 ± 1 74 ± 0.5 75 ± 2 66 ± 2
Table 31. % Recoveries of pesticides using liquid / liquid partition.
The high recoveries recorded for monocrotophos in boronia preclude the application of
this screen in quantitative experiments. The signal for ion m/z 193 is enhanced in the matrix of
boronia, probably as a result of co-eluting components in the boronia extract. As the
concentration level of monocrotophos approaches the ppb level, the relative contribution of the
co-eluting contaminant increases. The recoveries for propiconazole, on the other hand are very
low. However, the repeatability of that low recovery, with an RSD of 7% at 1 mgkg-1 still allows
for the application of this analytical method for the detection of gross contamination of
propiconazole in boronia concrete. Recoveries for simazine, propazine and sethoxydim are also
less than 50%, however, the consistency in the percentage of analyte recovered across the range
of fortification levels allows for the application of this analytical method to the screening of these
three analytes in boronia extract.
Preliminary Development of Solid Phase Extraction of Pesticides from Essential Oils.
Solid phase extraction (SPE) has limited application for pesticides in essential oils,
as the elution characteristics of the components are often very similar to the analytes we
wish to separate from the oils. The large array of parameters which can be varied in SPE
methodology make the number of possible chromatographic conditions unmanageable.
However, thin layer chromatography (TLC) provides a quick effective method for selection
and optimisation of solvent regimes. Within this section TLC was used to establish a basic
method for the separation of a range of pesticides. Successful solvent / media
combinations were then scaled up for application in SPE.
88

Experiments Undertaken in the Process of Method Development Example 13
The application of Thin Layer Chromatography for Development of a Solvent Combination Suitable for the Separation of Pesticides from Essential Oil Components. Aim: The behaviour of oil components and pesticides were first trialed using TLC.
Commercially available, activated silica TLC plates were used to test the separation of
parsley oil, peppermint oil and boronia extracts trialed under a range of solvent
combinations.
Experimental: Thin layer chromatography aluminium sheets layered with silica gel 60 F254
supplied by Merck were cut into 15 x 4 cm sections. Pencil lines were inscribed on the
silica above the level of the chromatography chamber sumps and dilute aliquots of fennel
oil, parsley oil, peppermint oil and boronia extracts were spotted onto the base line with
glass capillaries. A range of solvent combinations was trialed. The retention
characteristics and U.V absorbances of a range of pesticides were also established. Solvent
combinations trialed included hexane / acetone, hexane / ether and chloroform / methanol
in varying ratios. After resolution of each plate the solvent front was marked and the Rf
calculated for the oil components and each pesticide where
Rf = elution distance of target analyte
elution distance of solvent front
Results & Discussion: Table 32 records the Rf of pesticides for some example solvent
combinations.
89

hexane/acetone chloroform/ hexane/ether hexane/ether
pesticide 50/50 methanol 50/50 50/50 90/10 difenaconazole 0.8 0.7 0.0 0.0 linuron 0.7 0.9 0.2 0.0 bromacil 0.8 0.5 0.1 0.0 terbacil 0.8 0.5 0.0 0.0 simazine 1.0 0.6 0.2 0.0 procymidone 1.0 1.0 0.4 0.2 ethofumesate 1.0 0.8 0.0 0.0 chloropropham 0.9 0.9 0.2 0.2 fluroxypyr ester 0.9 0.6 0.1 0.1 sethoxydim not tested not tested not tested 0.1 mecoprop not tested not tested not tested 0.2 pendimethalin not tested not tested not tested 0.4 pirimicarb not tested not tested not tested 0.0
Table 32. Chromotagraphic characteristics of selected pesticides resolved on TLC
under differing solvent regimes.
For all oils tested hexane / diethyl ether (90 / 10) effected separation of oil
components. The movement of oil components and the relative immobility of pesticides
presented the hexane / ether solvent combination as the most favourable.
Experiments Undertaken in the Process of Method Development Example 14.
SPE Method Validation
Aim: In the experiment described previously it had been established that the target
pesticides remained on silica columns when hexane / ether (90 / 10) is used as a mobile
phase. The analytes are then eluted from the column with acetone. A validation of the
application of this silica based SPE to the clean-up of essential oils was undertaken.
Experimental: 1 mL of peppermint oil and boronia concrete were spiked with 0.01, 0.1, 1
and 10 µg of monocrotophos, simazine, cyanazine, pirimicarb, propazine, propiconazole,
tebuconazole and difenaconazole to give fortification levels of 0.01, 0.1, 1 and 10 mgkg-1.
5 µL of a 1 mgmL-1 solution of cyanazine was added to all as an internal standard. Pre-
packed "Bond Elut" TM MEGA BE-SI 6 mL columns, containing 1 g of silica, were
purchased from Varian. Columns were pre-conditioned with 2 mL of hexane / ether (9:1).
Fortified oil (100 µL) was applied to the pre-conditioned columns and 4 x 1 mL of the
hexane / ether was used to remove oil components from the column. Acetone (4 mL) was
used to elute the retained pesticides. The acetone fraction was collected into 9 mL Kimbal
disposable test tubes and dried under nitrogen on a heating block. Acetonitrile (200 µL)
90
was added and the solution transferred to 200 µL insert in a 1 mL LC vial. The extractions
were repeated 4 times for each concentration. To assess the effect of oil on recoveries 100
µL of solvent spiked with the equivalent level of pesticides as that prepared in oil were also
passed through silica columns. This experiment was also conducted in quadruplicates.
The responses recorded for fortified solvents and peppermint oils applied to SPE were
compared to samples fortified with equivalent concentrations of pesticides but which had
not passed through columns. This was undertaken to obtain a measure of signal
suppression due to oil components alone and overall recovery of pesticides from the
acetone fraction. Also included in this experiment was an assessment of the amount of
volatiles eluted in each fraction relative to the total amount in oil not subject to SPE. To
obtain a measure of total volatiles in the oils used in the SPE validation experiment 25 µL
of peppermint oil (22 mg) was dissolved in 1 mL of acetone and spiked with 1.236 mg of
the internal standard, octadecane, and analysed directly. A further 100 µL of the
peppermint oil was applied to the SPE column as described. The fractions collected of ~4
mL of hexane / ether (9:1) and ~4 mL of acetone were each spiked with 4.927 mg of
octadecane and subject to analyses by GC flame ionisation detection (FID). The volatiles,
defined as all peaks eluting before the octadecane under the conditions described, were
expressed as pecentage recoveries relative to the amount of oil analysed by assuming a 1 :
1 response ratio to the known quantity of internal standard added. This process was
repeated with boronia oil to obtain a measure of the volatile material removed by SPE from
the polar fraction containing the target pesticides.
Analytical parameter: Samples were analysed by LC MS/MS using the conditions detailed
on page 70. The percent volatiles recovered in each SPE fraction were determined by GC
FID under the following conditions.
GC Hewlett Packard 6890 column: Hewlett Packard 5MS 30m, i.d 0.32µm carrier gas instrument grade nitrogen injection volume: 1µL (split) injector temp: 250°C detector temp: 280°C (FID) initial temp: 50°C (3 min), 10°Cmin-1 to 270°C (7 mins) head pressure : 10psi.
Results & Discussion: Table 33 records the %volatiles recovered in each SPE fraction
relative to the amount determined in the neat oil.
91

sample peppermint oil parameter neat hexane/ether acetone
fraction fraction wt of oil (mg) 21.8 87.1 87.1 wt of volatiles calculated (mg) 15.5 22.1 30.1 %volatiles 71.3 25.4 34.6 % menthol 49.3 0.0 84.9 sample boronia concrete parameter neat hexane/ether acetone
fraction fraction wt of oil (mg) 12.2 97.4 97.4 wt of volatiles calculated (mg) 0.8 3.3 2.7 %volatiles 6.7 3.3 2.8 %post C18 peaks by GC FID 15.6 12.3 3.6 %yield total GC-able peaks 22.3 15.6 6.4
Table 33. Recoveries of volatile components form peppermint and boronia oil in SPE
fractions.
A total of 71.3% of the volatiles in peppermint oil are detectable by GC FID under
the conditions listed. 84% of those volatiles come through in the 2 fractions collected with
58% eluting with the pesticides in the acetone fraction. This result, which at first appears
discouraging, reveals on closer analyses that 85% of the volatiles in the acetone fraction is
menthol. Excluding menthol, only 4.5 mg of the original 87.4 mg or 4.6% of volatiles co-
elute with the target pesticide. In some circumstances menthol can be selectively vented to
waste. In boronia extract only 22.3% of the oil is detectable by GC FID. Of that
percentage only 19% remained in the acetone fraction along with the pesticides. The
results presented for boronia, however, are of limited relevance as boronia concrete, which
is a solvent based extraction using low polarity solvents such as hexane, has a high
proportion of waxes and low polarity components which are not volatile within the GC
environment. Peppermint oil on the other hand is produced by steam distillation and has a
higher proportion of volatile components.
92

Table 34 lists the recoveries for the internal standard, cyanazine
n area %C.V. %response Response in solvent without SPE 4 4.23E+08 2 100 Response in peppermint oil without SPE 4 1.66E+08 2 39 Response in solvent with SPE 16 1.03E+08 2 24 Response in peppermint oil with SPE 16 3.80E+07 22 9 Response in boronia oil with SPE 16 3.17E+07 18 7
Table 34. Recoveries of cyanazine from SPE with hexane / ether mobile phase
The results listed in Table 34 indicate that cyanazine is not suitable as in internal standard
for the analyses of pesticides using silica columns with the mobile phase tested. When cyanazine
is analysed within the matrix of peppermint oil, 61% of the response is lost. This is further
exacerbated when only 24% of the analyte is recovered from the silica column. The combined
effect results in only 9% overall response to cyanazine. The %C.V. of 22% is too high to allow
for the application of a correction factor to relate the final result for cyanazine on silica to the
result obtained for the analyte not applied to silica.
The retention times of sethoxydim within the LC MS/MS were not consistent and did not
elute within the time window established for the target ion, m/z 282. Results are not reported for
this analyte. Note should be made, however, that in peppermint oil, and not subjected to SPE, the
response for sethoxydim was found to be linear with increasing analyte concentration and that
15% of that signal is suppressed when compared to the same fortification level in solvent only at
10 mgkg-1. Prometryn also did not elute from the silica column but the response of this analyte
when analysed in peppermint oil without SPE was 78% (S.E. 4% n=4) relative to that recorded
when analysed in solvent only. Table 35 records the signal suppression caused by the presence of
peppermint oil which is calculated by the formula
% response = area of signal in peppermint oil x 100
area of signal in solvent only
mgkg-1 monocrotophos simazine pirimicarb propazine tebuconazole propiconazole difenaconazole
10 69.0 68.6 53.4 62.4 56.7 69.7 66.4 1 76.6 67.9 78.1 66.3 80.9 83.2 77.9
0.1 70.2 56.3 96.1 64.1 0.0 242.2 90.2 0.01 0.0 0.0 377.9 0.0 0.0 0.0 0.0
Table 35. Percentage response of pesticides in peppermint oil relative to solvent only injections
93

Table 36 lists the responses of the target analytes applied to SPE in 100 µL of solvent, relative to
the same concentrations of analytes not subject to SPE. The recoveries are reported as
percentages. Tables 37 and 38 list the recoveries of pesticides from SPE in peppermnt oil and
boronia extract respectively.
mgkg-1 monocrotophos simazine pirimicarb propazine tebuconazole propiconazole difenaconazole 10 26.9±0.7 46.3±0.9 32.3±0.9 43±2 45±2 47±2 44±2 1 37±2 56±2 52±3 53±3 58.0±0.7 61±1 57.5±0.5
0.1 29±2 34.0±0.7 35±2 46±1 61±1 47±2 47±1 0.01 41±6 32±1 48±7 64±5 0.0 45±3 51±2
Table 36. Percentage recoveries of pesticides in solvent only when applied to SPE.
mgkg-1 monocrotophos simazine pirimicarb propazine tebuconazole propiconazole difenaconazole 10 74±6 59.3±0.7 64±1 57.4±0.6 48±3 68.8 64±2 1 60±5 52.4±0.4 70±1 65.4±0.8 90±5 65.9 59±2
0.1 62±6 49±3 82±2 60±1 178±3 65±3 0.01 58±7 154±12 13±13 571±89 67±7
Table 37. Percentage recoveries of pesticides in peppermint oil by SPE relative to pesticides
recovered from SPE without oil.
mgkg-1 monocrotophos simazine pirimicarb propazine tebuconazole propiconazole difenaconazole
10 137±11 49±3 111±11 74±5 74±6 16±0 97±6 1 127±5 41.7±0.6 114±5 64±16 76±2 9.3±0.7 95±2
0.1 210±11 68±3 158±4 192±2 93±4 15.7±0.8 119±11 0.01 514±7 73±1 179.7±0.8 785±2.5 181.0±0.6
Table 38. Percentage recoveries of pesticides in boronia oil by SPE relative to pesticides
recovered from SPE without oil.
The matrix effect of peppermint oil on the analyses of all the pesticides tested was
marked. For monocrotophos, simazine and propazine the response is reasonably constant across
the concentration ranges tested. However it would appear that for pirimicarb, propiconazole and
difenaconazole there may be a co-eluting peak which enhances the signal disproportionately at
lower concentrations. Alternatively the responses for propiconazole and difenaconazole may be
non-linear as the detection limits are approached, as a peak was not recorded for either analyte at
concentrations around 0.01 mgkg-1. The amount of essential oils able to be injected onto an LC
MS/MS system is limited as contamination of inlet systems and the ion trap itself is possible. As
such only 10 µL of the oil solution not subject to SPE was injected into the LC MS/MS. In
addition this had been diluted by 4:1. The areas recorded for each peak were multiplied by 2.4,
then by 4 to allow for direct comparison with the areas detected by the 10µL injection of
94

undiluted spiked solvents. In actuality this would mean that the LC MS/MS is attempting to
detect a lower level of pesticide in peppermint oil than in solvent only such that any non-linear
behaviour at low levels would be exasperated. This is not the case for pirimicarb, which recorded
a strong positive result even in non-fortified oil. This would result in a false positive being
recorded for pirimicarb in essential oil screens using LC MS/MS.
Excluding the signal suppression observed for pesticides in essential oils the recoveries of
pesticides in peppermint oil by SPE using the solvent protocol are low but the standard errors
recorded at each concentration level are within an acceptable range indicating that with further
work the SPE method developed has potential. Recoveries from fortified boronia concretes
detailed in Table 38 are higher than those obtained from peppermint oil further highlighting the
effect different matrices can have on SPE methodology.
The SPE methodology allows for the processing of larger amounts of essential oil and
reduces loading of essential oil components into analytical instrumentation. Standard curves
must be established within the matrices of contaminant free essential oil and must undergo the
same work-up as that undertaken for the samples to be tested. It would be difficult to identify an
internal standard without using isotopes of the analytes to be tested but the inclusion of an
internal standard post-SPE would negate the effects of poor instrument precision etc.
The application of ion exchange chromatography to the clean-up of acidic pesticides with detection by GC ECD
In basic solution acidic pesticides are present as negative ions. This presents the potential
to bind such pesticides onto ion exchange media whilst interfering matrices, such as components
from essential oils, are eluted. The retained pesticides can then be eluted from the ion exchange
media in an acidic mobile phase and submitted for analysis. In the following experiments the
binding of six herbicides onto ion exchange discs is undertaken with detection by gas
chromatography electron capture detection (GC ECD).
95

Experiments Undertaken in the Process of Method Development Experiment 15 The trapping and derivatisation of acidic pesticides on ion exchange discs.
Aim: The effectiveness of trapping of six commonly used acidic pesticides in basic solutions onto
anion exchange discs with subsequent methylation of the fixed acids with methyl iodide was to be
tested.
Experimental: Standard solutions of 1 mgmL-1 of clopyralid, dicamba, fluroxypyr acid, haloxyfop
acid, MCPA and mecoprop were made up in acetone. A 5 mL aliquot of NaHCO3 buffer,
adjusted to pH 10 with NaOH, was fortified with the standard solutions at levels equivalent to 10
mgkg-1 and 0.1 mgkg-1. Empore™ ion exchange discs, provided by Varian, were punched into 13
mm diameter discs and washed under a light vacuum with 5 mL of acetone followed by 5 mL of
methanol. Whilst still wet, 5 mL of the fortified buffer solution was passed through the pre-
conditioned discs under gravity. The discs were removed from the holders and dried at 80°C for
60 minutes. The discs were then rolled and inserted into a 1 mL GC vial. 1 mL of acetonitrile
and 100 µL of methyl iodide was added and then heated at 85°C for 60 mins. The GC lid was
then opened and the solvent removed under a stream of nitrogen. The samples were then
reconstituted in 200 µL of acetonitrile, transferred to a 100 µL GC insert and subject to GC ECD
under the following conditions.
Analytical parameters:
Instrumentation Hewlett Packard 5890 gas chromatograph Hewlett Packard Electron Capture Detector Processing Software - HP Chem Injection: 1 µL, splitless automatic injections Column: 30 m HP 5MS, 0.22 mm id, 0.25 µm film thickness Carrier gas: Instrument grade nitrogen Head Press : 10 psi Oven Temp: 60°C (1min.) -20°C/min-290°C (10 min.) Injection Temp: 260°C Detector: ECD 280°C Results & Discussion: Of the six acids included in the experiment only four were successfully
methylated using the method outlined. Table 40 lists the areas obtained for the two fortification
levels tested. A non-linear relationship between analyte concentration and area detected is
evident, an effect inherently associated with ECD.
96
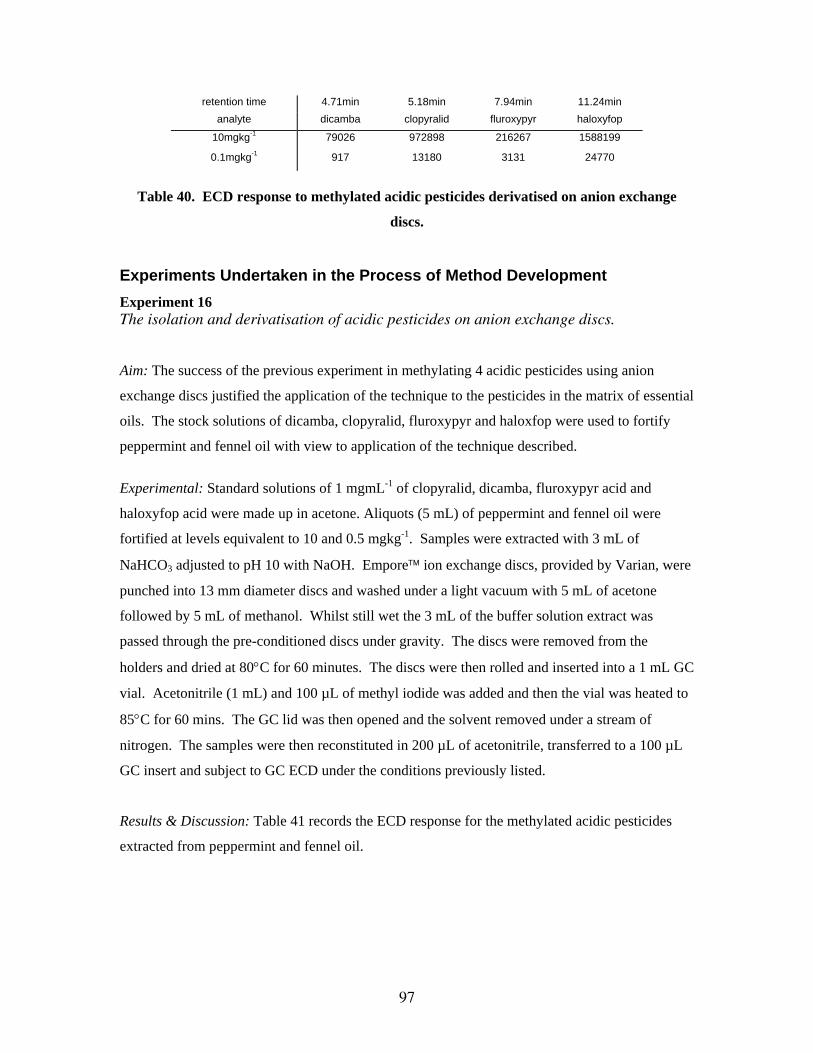
retention time 4.71min 5.18min 7.94min 11.24min analyte dicamba clopyralid fluroxypyr haloxyfop
10mgkg-1 79026 972898 216267 1588199
0.1mgkg-1 917 13180 3131 24770
Table 40. ECD response to methylated acidic pesticides derivatised on anion exchange
discs.
Experiments Undertaken in the Process of Method Development Experiment 16 The isolation and derivatisation of acidic pesticides on anion exchange discs.
Aim: The success of the previous experiment in methylating 4 acidic pesticides using anion
exchange discs justified the application of the technique to the pesticides in the matrix of essential
oils. The stock solutions of dicamba, clopyralid, fluroxypyr and haloxfop were used to fortify
peppermint and fennel oil with view to application of the technique described.
Experimental: Standard solutions of 1 mgmL-1 of clopyralid, dicamba, fluroxypyr acid and
haloxyfop acid were made up in acetone. Aliquots (5 mL) of peppermint and fennel oil were
fortified at levels equivalent to 10 and 0.5 mgkg-1. Samples were extracted with 3 mL of
NaHCO3 adjusted to pH 10 with NaOH. Empore™ ion exchange discs, provided by Varian, were
punched into 13 mm diameter discs and washed under a light vacuum with 5 mL of acetone
followed by 5 mL of methanol. Whilst still wet the 3 mL of the buffer solution extract was
passed through the pre-conditioned discs under gravity. The discs were removed from the
holders and dried at 80°C for 60 minutes. The discs were then rolled and inserted into a 1 mL GC
vial. Acetonitrile (1 mL) and 100 µL of methyl iodide was added and then the vial was heated to
85°C for 60 mins. The GC lid was then opened and the solvent removed under a stream of
nitrogen. The samples were then reconstituted in 200 µL of acetonitrile, transferred to a 100 µL
GC insert and subject to GC ECD under the conditions previously listed.
Results & Discussion: Table 41 records the ECD response for the methylated acidic pesticides
extracted from peppermint and fennel oil.
97

dicamba clopyralid fluroxypyr haloxyfop sample 4.477min 5.059min 8.908min 13.121min
10mgkg-1solvent only 1576381 711900 438271 269085
10mgkg-1 peppermint oil 1981816 574182 786839 85959
0.5mgkg-1 peppermint oil 33778 18148 14497 5871
10mgkg-1 fennel oil 1462200 684607 588610 217000
0.5mgkg-1 fennel oil 67826 58584
Table 41. Areas as obtained by GC ECD for acidic pesticides in peppermint and fennel oil
methylated on ion exchange discs.
The results indicate successful derivatisation of the acids on the ion exchange media. However, a
very large contaminant was evident, eluting at around 12.7 mins and elevating the base line
through to the next sample run. Figure 27 records the chromatogram as obtained by GC ECD for
acidic pesticides fortified at a concentration of 0.5 mgkg-1 in peppermint oil.
Figure 27. Chromatogram of 0.5 mgkg-1 methylated acidic pesticides in peppermint oil by
GC ECD
98

The contaminant bleed evident in Figure 27 continued through to subsequent injections,
however, much of the contaminant was removed following the elution of the solvent peak from
the next injection. This may indicate that the contaminant is moved through the column by
acetonitrile. Ideally the source of the contaminant should be isolated and removed from the
sample work-up. However, if the source is an indispensable ingredient in the process, an
injection of acetonitrile, followed by a 6 minute run to a GC oven temperature of around 100°C,
may remove the contaminant. Interspersing such a run between samples would ensure the GC
was relatively clean between injections. However, the elution of the methylated haloxyfop acid
rides the shoulder of the contaminant such that quantification of this analyte using the
methodology detailed would be problematic.
99

Literature Cited
Ballee, D. L., Gould, G. E. and Fahey, J. E. Residues of DDT and Analogues in Midwestern
Mint Hay and Oil. J. Econ. Entomol. 1970, 63, 1658-1660.
Buchert, A. and Lokke, H., J. Chromatography, 1975, 115 682 -686.
Chambers, J. E. and Patricia Levi. 1992. Organophosphates Chemistry, Fate, and Effects.
Academic Press, Inc. New York, NY.
Chemical Information Systems, Inc. Oil and Hazardous Materials/Technical Assistance Data
System, Baltimore, MD, 1988.10-16
Cullen, T. E. J. Assoc. Off. Anal. Chem. 1964 . 47, 221
Davies, N. W., Gas Chromatographic Retention Indices of Monoterpenes and Sesquiterpenes on
Methyl Silicone and Carbowax 20M Phases, J. Chromatogr., 1990 503 1-24.
Deleu, R. and Copin, A., J. Chromatogr., 1979, 171 263 - 268
Garland, S. M., Menary, R. C. and Claye, C. J., Variation during dormancy and the effect of
freezing and postharvest incubation on the chemical composition of blackcurrant buds (Ribes
nigrum L.). J. Hort. Sci. & Biotech., 2002, 77, (4) 489-497
Garland, S. M., Menary, R. C. and Davies, N. W. Dissipation of propiconazole and tebuconazole
in peppermint crops (Mentha piperita (Labiatae)) and their residues in distilled oils. J. Agric.
Food Chem. 1999, 47 294-298
Gould, G. E. Problems in the Control of Mint Insects. J. Econ. Entomol. 1960, 53, 526-527.
Graham, S. L. J. Agric. Food Chem. 1973, 21, 234
100

Graham, S. L., and Hansen, W. H. Bull. Environ. Contam. Toxicol., 1972, 7, 19
Gustafsson, K. H., Thompson, R. A. High-pressure liquid chromatographic determination of
fungicidal dithiocarbamates. J. Agric. Food Chem., 1981, 29, 729 - 732
Jennings, W. and Shibamoto,T., Qualitative Analysis of Flavour and Fragrance Volatiles by Gas
Capillary Column Gas Chromatography, Academic Press, New York, 1980.
Kaniansky, D., Ivanyi, F. and Onuska, F.I., On-Line Isotachophoretic Sample Pretreatment in
Ultratrace Detemination of Paraquat and Diquat in Water By Capillary Zone Electrophoresis,
Analytical Chemistry,1994, 66, (11),1817-1824
Keppel, G. E. J. Assoc. Off. Anal. Chem. 1969, 52, 162 - 167
Kidd, H. and James, D. R., Eds. The Agrochemicals Handbook, Third Edition. Royal Society of
Chemistry Information Services, Cambridge, UK, 1991
Mattern, G. C., Singer, G. M., Louis, J., Robson, M., and Rosen, J. D., J. Assoc. Off. Anal. Chem.,
1989, 72 970-974
Meister, R.T. Farm Chemicals Handbook 1992. Meister Publishing Company. Willoughby, OH.
1992.
Montgomery, J. H. (ed.). Agrochemicals Desk Reference. Environmental Data. Published by
Lewis Publishers, Chelsea, MI. 1993.
Rao, P. S. C. and Davidson, J. M. Estimation of pesticide retention and transformation parameters
required in nonpoint source pollution models. In Environmental Impact of Nonpoint Source
Pollution. Overcash, M. R., Davidson, J. M. Eds. Ann Arbor Science, 1980.
Rigaud, J., Etievant, P., Henry, R. Latrasse, A. Le methoxy-4-methyl-2 butanethiol-2, un
constituant majeur de l'arome du bourgeon de cassis (Ribes nigrum L.) Sci. des Aliments, 1986,
6, 213-220
101

Starr, H.; Kiigemagi, U.and Terriere, L. C. Insecticide Residues in Peppermint and their
Distillation with Peppermint Oil. J. Agric. Food Chem. 1963, 11, 482-486.
Thomson, W. T. Agricultural Chemicals. Book 1: Insecticides. . Thomson Publications, Fresno,
CA. 1992
U.S. Environmental Protection Agency. Guidance for the Registration of Pesticide Products
Containing Maneb as the Active Ingredient. Washington, DC, 1988.4-11
U.S. National Library of Medicine. Hazardous Substances Databank. Bethesda, MD, 1995.9-9
Wauchope, R. D., Buttler, T. M., Hornsby A. G., Augustijn-Beckers, P. W. M. and Burt, J. P.
SCS/ARS/CES Pesticide properties database for environmental decisionmaking. Rev. Environ.
Contam. Toxicol. 1992, 123: 1-157,
Weed Science Society of America. Herbicide Handbook, Seventh Edition. Champaign, IL, 1994
Wells, M. J. M. and Yu, L. Z., Solid-phase extraction of acidic herbicides, J. Chromgr., 2000.
885. (1-2) 237-250
Woodrow, J., Analytical Method for the Dithiocarbamate Fungicides Ziram and Mancozeb in Air.
J. Agric. Food Chem., 1995, 43, 1524-1529
Worthing, C. R. (ed.) . The Pesticide Manual: A World Compendium. Eighth edition. Published
by The British Crop Protection Council. 1987.
102
Appendix 1. Analysis for Mancozeb in Peppermint Leaves by Detection of Carbon Disulfide
Produced by Digestion with Acidified Stannous Chloride.
Acidified stannous chloride was prepared by dissolving 1.618 g of SnCl2.2H2O (M.W. = 225.65)
in 100 mL of the 5M HCl.. Peppermint leaves were ground under liquid nitrogen in a stainless
steel mortar and pestle. 2 g of the ground leaves were weighed into 25 mL headspace vials. 2 mL
of distilled water and 2 mL of acidified stannous chloride solution were added. The vials were
shaken vigorously and placed in an oven at 90ºC for 1 hour. The gaseous CS2 trapped in the
headspace vial was pressurised and vented to the injection port of a gas chromatograph. The FPD
detector had a 393 nm filter specific for the detection of sulphur.
The analytical system was calibrated with solutions of known quantities of analytical
grade carbon disulphide dissolved in acidified stannous chloride. Each unit of a mancozeb
molecule produce 2 molecules of carbon disulfide. The molecular weight of a unit of the
mancozeb chain is 266.31 so 1 µmole of mancozeb produces 146 µg CS2. Standard curves were
produced by fortifying leaf samples with known quantities of mancozeb. Note that mancozeb is
insoluble in water, but vigorous shaking of mancozeb / water mixtures produces a fine suspension
from which sub-samples can be taken with some degree of accuracy.
The response for carbon disulfide was non-linear and less sensitive than that recorded for
phosphorus compounds using the 524 µm filter
103

2. Analysis for Mancozeb in Peppermint Leaves by Detection of Manganese Quantified by
ICP OES.
Mancozeb is a non-systemic fungicide which remains on the surface of the leaf. Maceration of
leaves was therefore not undertaken as the co-extraction of vegetative matrix would not enhance
the amount of mancozeb extracted yet would increase the load of carbon compounds, thereby
precluding the application of ICP-OES to the monitoring of residual manganese from the
mancozeb polymer. Using tweezers to grasp the base of the petiole, 50 leaves were removed
from treated peppermint plants and placed in pre-weighed 250 mL 78 x 70 mm polycarbonate
vials. The samples were re-weighed. An extra 50 leaves were collected and passed through a
Paton Electronic Planimeter to give an estimate of total leaf area sub-sampled. A further
selection of leaves / sample were weighed and then dried at constant temperature and humidity to
determine dry weight. As neither maceration nor agitation were to be applied during the
extraction process a desorption isotherm was established to determine how long leaves should be
immersed in the extracting solution to effect solvation of mancozeb.
De-sorption Isotherm:
Following an application of Mancozeb, 5 X 20 samples of 50 leaves were collected to establish a
de-sorption profile of mancozeb into 5µM EDTA / 9 µM NaOH. The leaves were collected into
250 mL, 78 x 70 cm polycarbonate specimen containers sealed with a polypropylene lid. In the
laboratory the samples were divided into 5 groups of 4. 150 mL of the 5µM EDTA / 9 µM
NaOH was added ensuring all the leaves were covered. The containers were left for 1 minute,
without agitation before the aqueous extract was decanted into plastic 40 mL vials. Another 4
samples were immersed in 150 mL 5µM EDTA / 9 µM NaOH for periods of 5 minutes whilst the
remaining 3 x 4 leaf samples were subject to passive extraction for 10, 15 and 30 minutes. After
decanting all samples were submitted for analyses by ICP OES. The desorption isotherm
established (Figure 28) was used to determine the optimum time for extraction of mancozeb into
the chelating reagent. Unfortunately the isotherm did not reach an asymptote within 30 minutes
104

0
0.5
1
1.5
man
coze
b m
g/kg
DM
B
0 10 20 30 40
minutes
Figure 28. Desorption isotherm of mancozeb into NaOH / EDTA
3. Derivatisation of Residues of Pesticide with Acidic Moieties in Essential Oils
Diazomethane
Preparation - Potassium hydroxide, 16 g, was weighed into a 250 mL conical flask. 40 mL of
distilled water and 50 mL of diethyl ether was added. The mixture was placed on ice. N-methyl-
N-nitrosourea (3 g) was added slowly and the mixture was stirred for 20 minutes. The mix was
transferred to a separating funnel and the aqueous layer drained and washed with a further 25 mL
of ether. The ether solutions were combined and stored at -4°C until use.
Derivatisation - 20 -30 mg of essential oil was weighed into a GC vial. 0.75 mL of the
diazomethane in ether solution was added and the solutions were gently swirled to ensure the oil
was completely in solution. The vials were left at room temperature for 10 minutes. 200 µL of
glacial acetic acid was added to each vial to quench the remaining diazomethane. GC vials were
crimp sealed, ready for analysis.
105