Embed Size (px)
Citation preview

Practical Applications of Patent Valuation Approaches and Methods

American Institute of CPAs
Speaker Biography
For over 20 years, Robert Reilly has been a managing director of Willamette Management Associates. Willamette provides business valuation, forensic analysis, and financial opinion services for transaction, financing, taxation, bankruptcy, litigation, and planning purposes. For over 30 years, Robert has focused on business and securities valuation, intangible asset and intellectual property analyses, and on lost profits and economic damages analyses.
Robert holds a BA in economics and an MBA in finance, both from Columbia University. He is a certified public accountant, accredited in business valuation, and certified in financial forensics. He is also a chartered financial analyst, certified management accountant, and certified business appraiser.
Robert can be reached at (773) 399-4318 or at [email protected]
2

American Institute of CPAs
Discussion Outline
Defining the valuation analyst’s assignmentData gathering and due diligence proceduresGenerally accepted patent valuation approaches, methods, and proceduresPerforming the valuation synthesis and reaching the value conclusionPatent valuation illustrative exampleDefending the valuation analyst conclusion
3

American Institute of CPAs
Defining the Valuation Analyst’s Assignment
Alternative intellectual property (IP) analysis purposes• estimating a sale price between a willing buyer/willing seller• estimating a royalty rate between a willing licensor/willing licensee• estimating a value to the current owner/operator• estimating a value to a specific buyer owner/operator• estimating an intercompany transfer price (royalty rate) between
related parties• estimating economic damages related to an IP infringement or
other damages event• concluding the fairness of a sale price or a license royalty
transaction• concluding a mutual exchange ratio for two IP bundles• estimating the IP collateral value for asset-based financing• estimating the IP remaining useful life (RUL)
4

American Institute of CPAs
Defining the Valuation Analyst’s Assignment (cont.)
Alternative IP analysis purposes• intended objective: value (to an owner/operator), transaction
price, third-party license royalty rate, lost profits/economic damages, fairness
• alternative standards of value (value to whom?)- fair value- fair market value- use value- user value- owner value- investment value- acquisition value- collateral value
5

American Institute of CPAs
Defining the Valuation Analyst’s Assignment (cont.)
Alternative IP analysis purposes (cont.)• alternative premises of value (how the transaction occurs)
- value in continued use- value in place (not in use)- value in exchange—orderly disposition- value in exchange—voluntary liquidation- value in exchange—involuntary liquidation
• IP highest and best use (HABU) analysis- current owner/operator HABU- new owner/operator HABU- licensor/licensee HABU
6

American Institute of CPAs
Defining the Intellectual Property
Develop a clear and complete definition of the patent analysis subject• intellectual property: patents, trademarks, copyrights, trade
secrets• other related intangible assets, such as:
- trademarks—advertising materials, trade dress- patents—product/process drawings, proprietary technology- copyrights—software, masks and masters- trade secrets—customer lists, product formulae
7

American Institute of CPAs
Defining the Intellectual Property (cont.)
Develop a clear and complete definition of the patent analysis subject (cont.)• types of patents
- design patent—new, original or ornamental design for an article of manufacture; term is 14 years from date of grant
- utility patent—covers the following inventions: a process, a machine, a manufacture, or a composition of matter; term is 20 years from date of filing
- plant patent—for invention or discovery of a new and distinct variety of asexually reproduced plant; term is 20 years from date of filing
- applied to and granted by the United States Patent and Trademark Office (USPTO)
- protected by U.S. Patent Act, Title 35 United States Code- patent requirements: useful, novel, nonobvious
8

American Institute of CPAs
Defining the Intellectual Property (cont.)
Develop a clear and complete definition of the patent analysis subject (cont.)• subject bundle of patent legal rights
- fee simple- term/reversion interest- licensor/licensee interest- domestic/international interest- product line/industry interest
9
American Institute of CPAs
Defining the Intellectual Property (cont.)
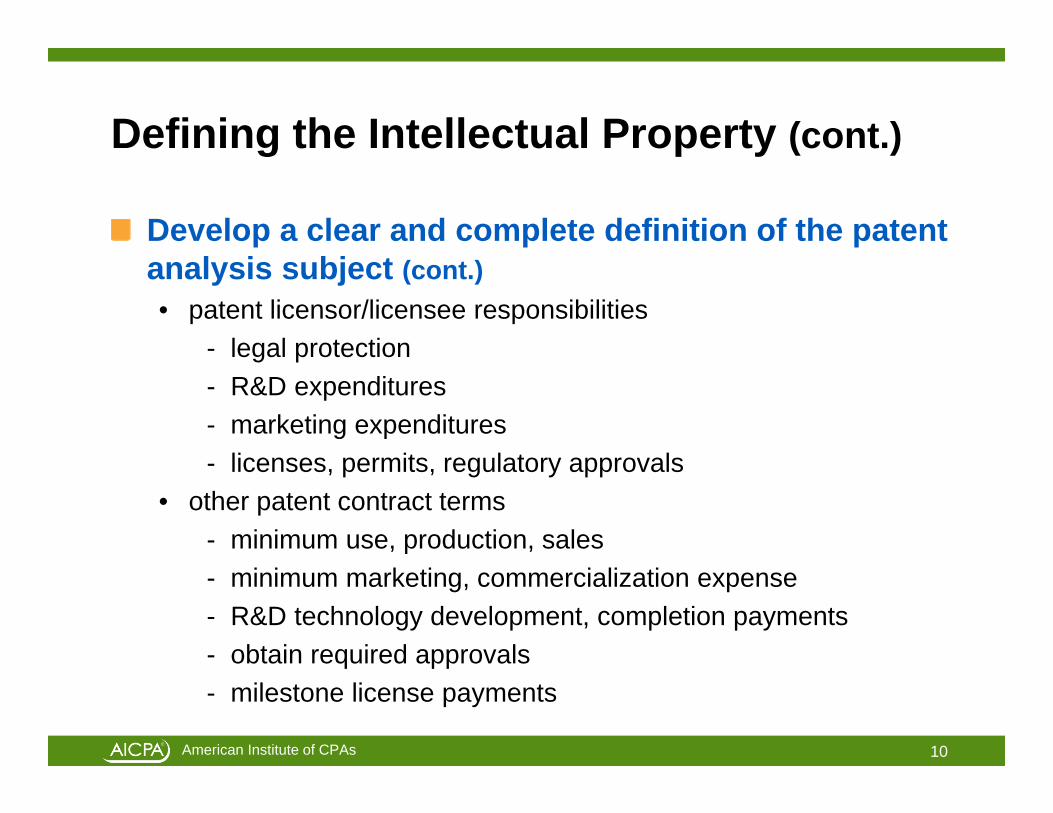
Develop a clear and complete definition of the patent analysis subject (cont.)• patent licensor/licensee responsibilities
- legal protection- R&D expenditures- marketing expenditures- licenses, permits, regulatory approvals
• other patent contract terms- minimum use, production, sales- minimum marketing, commercialization expense- R&D technology development, completion payments- obtain required approvals- milestone license payments
10
American Institute of CPAs
Valuation Analyst’s Data Gathering and Due Diligence Procedures
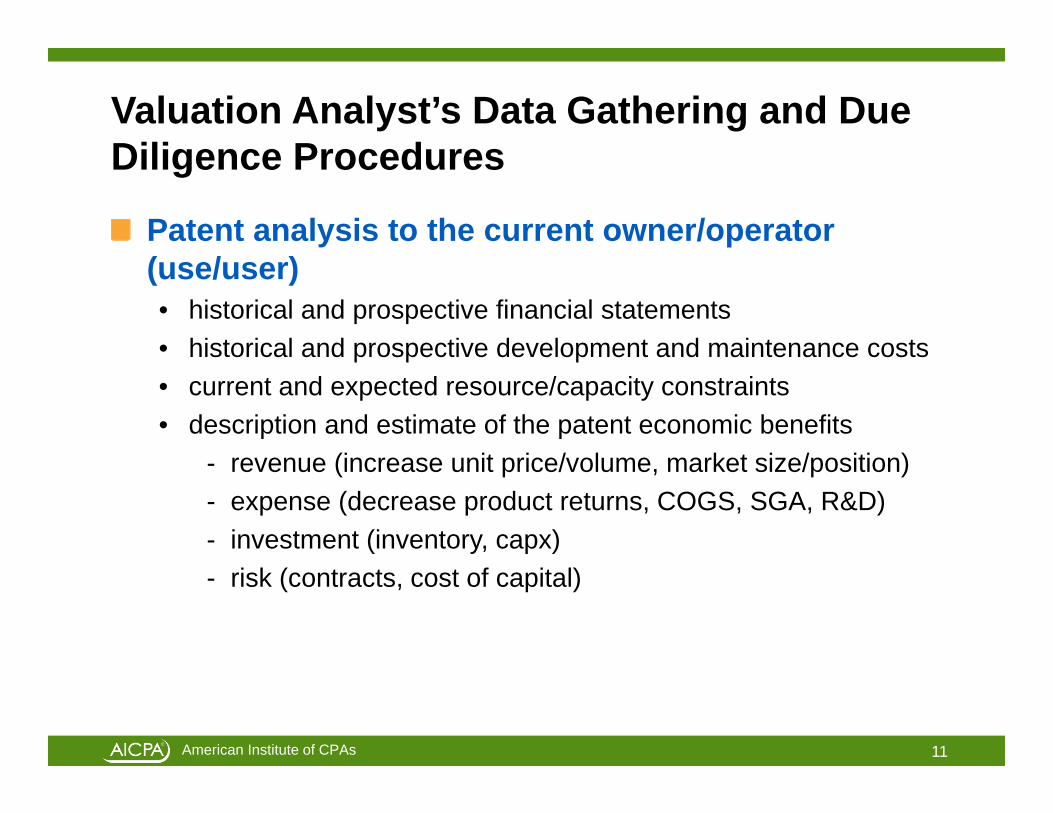
Patent analysis to the current owner/operator (use/user)• historical and prospective financial statements• historical and prospective development and maintenance costs• current and expected resource/capacity constraints• description and estimate of the patent economic benefits
- revenue (increase unit price/volume, market size/position)- expense (decrease product returns, COGS, SGA, R&D)- investment (inventory, capx)- risk (contracts, cost of capital)
11

American Institute of CPAs
Valuation Analyst’s Data Gathering and Due Diligence Procedures (cont.)
Patent analysis to the alternative owner/operator (use/user)• change in market definition or size• change in alternative/competitive uses• patent creates inbound/outbound license opportunities• owner operates and licenses patent (in different products,
territories, distribution channels)
12

American Institute of CPAs
Valuation Analyst’s Data Gathering and Due Diligence Procedures (cont.)
Analyze projections and patent economic benefits against a benchmark comparison• prior projections vs. prior actual results• current projections vs. capacity constraints• current projections vs. market size• consider industry average comparable profit margins (CPM)• consider guideline public company comparable profit margins• consider quality and quantity of guideline patent license data• consider patent RUL analysis, based on:
- legal/statutory life- contract/license life- technology obsolescence life- economic obsolescence life- prior generations of the subject invention- position of the subject invention in its life cycle
13

American Institute of CPAs
Valuation Analyst’s Data Gathering and Due Diligence Procedures (cont.)
Analyze projections and patent economic benefits against a benchmark comparison (cont.)• data sources commonly used to identify industry average profit
margins for patent owner/operators- Financial Research Associates—Financial Studies of the Small
Business- The Risk Management Association—Annual Statement
Studies: Financial Ratio Benchmarks- BizMiner (The Brandow Company)—Industry Financial Profiles- CCH, Inc.—Almanac of Business and Industry Ratios- Fintel, LLC—Fintel Industry Metrics Reports- MicroBilt Corporation (formerly IntegraInfo)—Integra Financial
Benchmarking Data- ValueSource—IRS Corporate Ratios- Schonfeld & Associates, Inc.—IRS Corporate Financial Ratios
14

American Institute of CPAs
Patent Valuation Approaches and Methods
Income approach methods• yield capitalization involves uneven income projections over a
finite projection period• direct capitalization involves an annual constant change rate
income projection over either a finite period or a perpetuity period• typical patent income measures:
- incremental/differential income (with vs. without the invention)- excess income/residual income (business enterprise income
less capital charge on all contributory assets)- profit split (percentage of business enterprise income assigned
to the subject patent, based on a “functional analysis”)- residual profit split (excess income “split” between two final
intangible assets)
15

American Institute of CPAs
Patent Valuation Approaches and Methods (cont.)
Income approach methods (cont.)• typical patent analysis income levels:
- net operating income- EBIT- pretax income- contribution income (for economic damages analysis)
• discount rate/capitalization rate should agree with the selected income measure
• discount rate/capitalization rate should agree with selected standard of value and the selected premise of value
• income projection period should agree with the patent RUL• income projection should consider the shape of patent life cycle• income projection should consider the patent maintenance costs
16

American Institute of CPAs
Patent Valuation Approaches and Methods (cont.)
Market approach methods• comparable profit margin (CPM) method:
- compare guideline public companies without patent to the subject company with patent
- difference in profit margins is due to the subject patent- the profit margin delta is considered to equal a royalty rate- royalty income (i.e., royalty rate × revenue) is capitalized over
patent RUL to indicate value• note that, typically, guideline companies may also have patents• so, the CPM method compares the superior subject patent profit
margin to an industry average patent profit margin• typically, EBIT is used as the CPM income measure
17
American Institute of CPAs
Patent Valuation Approaches and Methods (cont.)
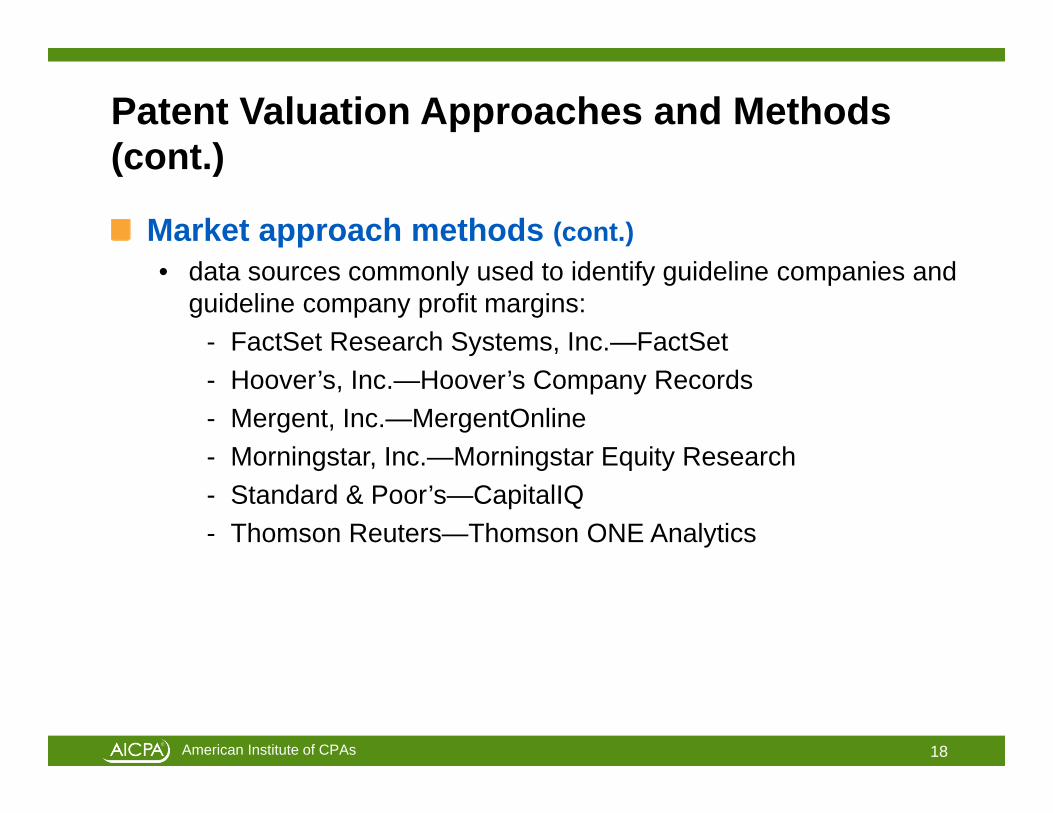
Market approach methods (cont.)• data sources commonly used to identify guideline companies and
guideline company profit margins:- FactSet Research Systems, Inc.—FactSet- Hoover’s, Inc.—Hoover’s Company Records- Mergent, Inc.—MergentOnline- Morningstar, Inc.—Morningstar Equity Research- Standard & Poor’s—CapitalIQ- Thomson Reuters—Thomson ONE Analytics
18
American Institute of CPAs
Patent Valuation Approaches and Methods (cont.)
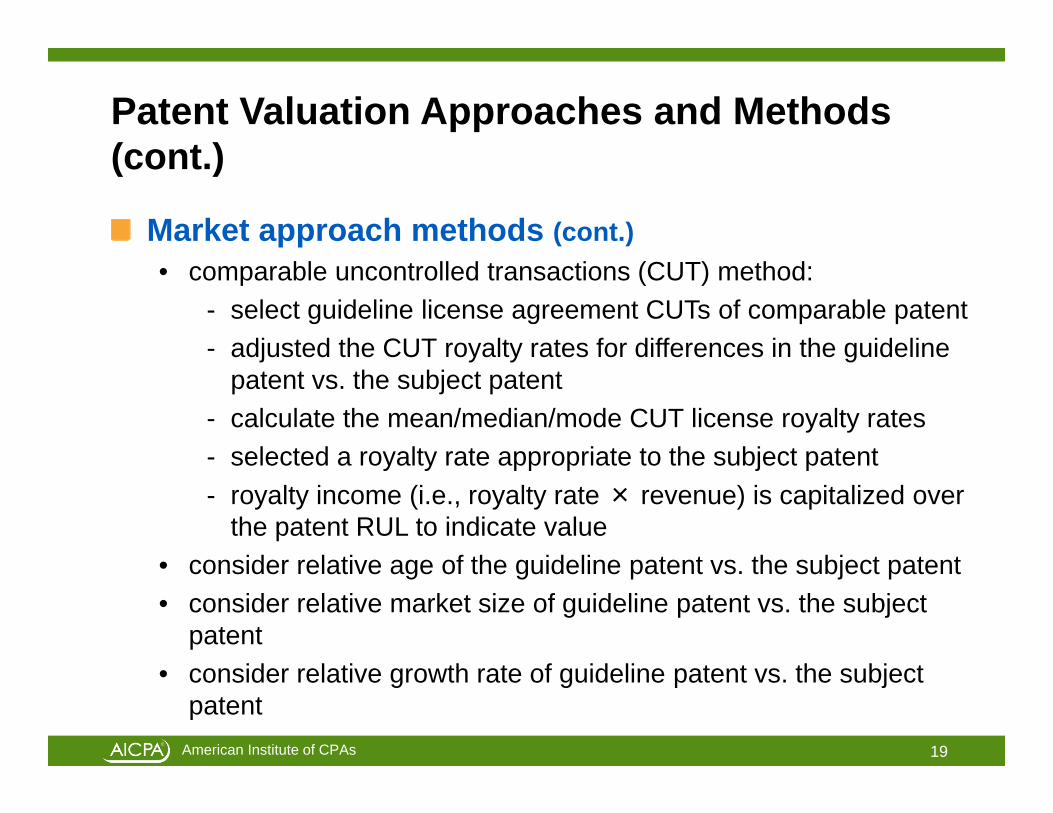
Market approach methods (cont.)• comparable uncontrolled transactions (CUT) method:
- select guideline license agreement CUTs of comparable patent- adjusted the CUT royalty rates for differences in the guideline
patent vs. the subject patent- calculate the mean/median/mode CUT license royalty rates- selected a royalty rate appropriate to the subject patent- royalty income (i.e., royalty rate × revenue) is capitalized over
the patent RUL to indicate value• consider relative age of the guideline patent vs. the subject patent• consider relative market size of guideline patent vs. the subject
patent• consider relative growth rate of guideline patent vs. the subject
patent19

American Institute of CPAs
Patent Valuation Approaches and Methods (cont.)
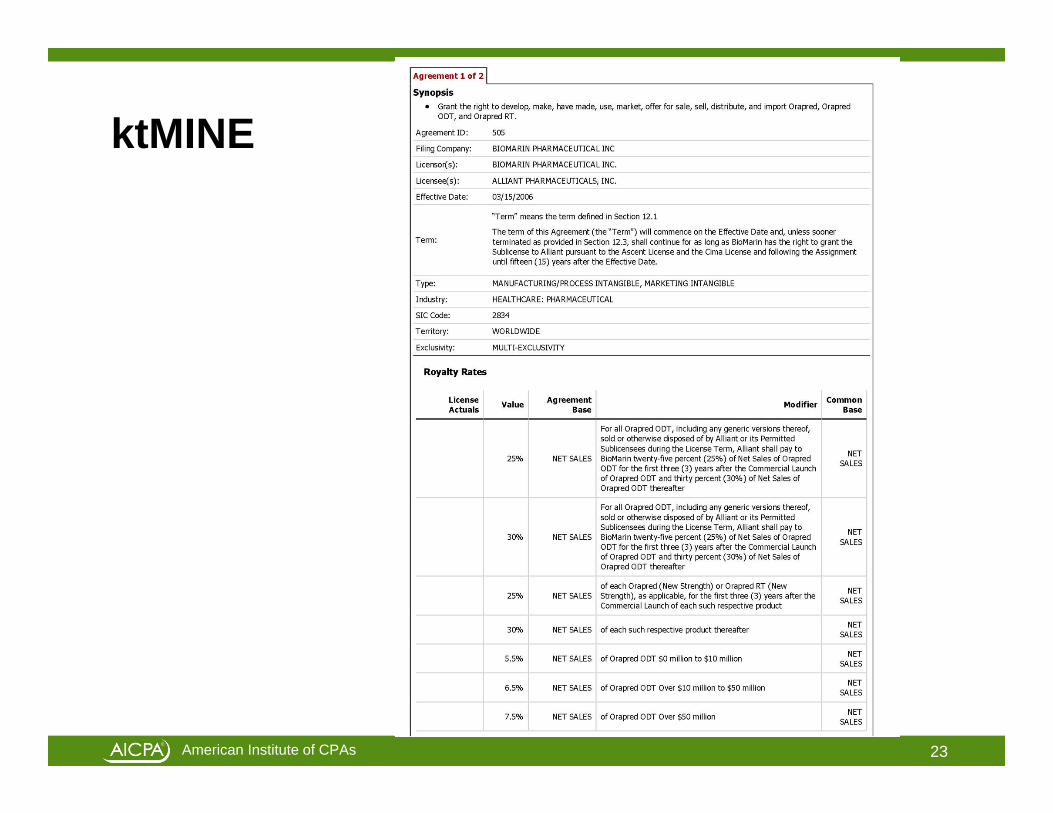
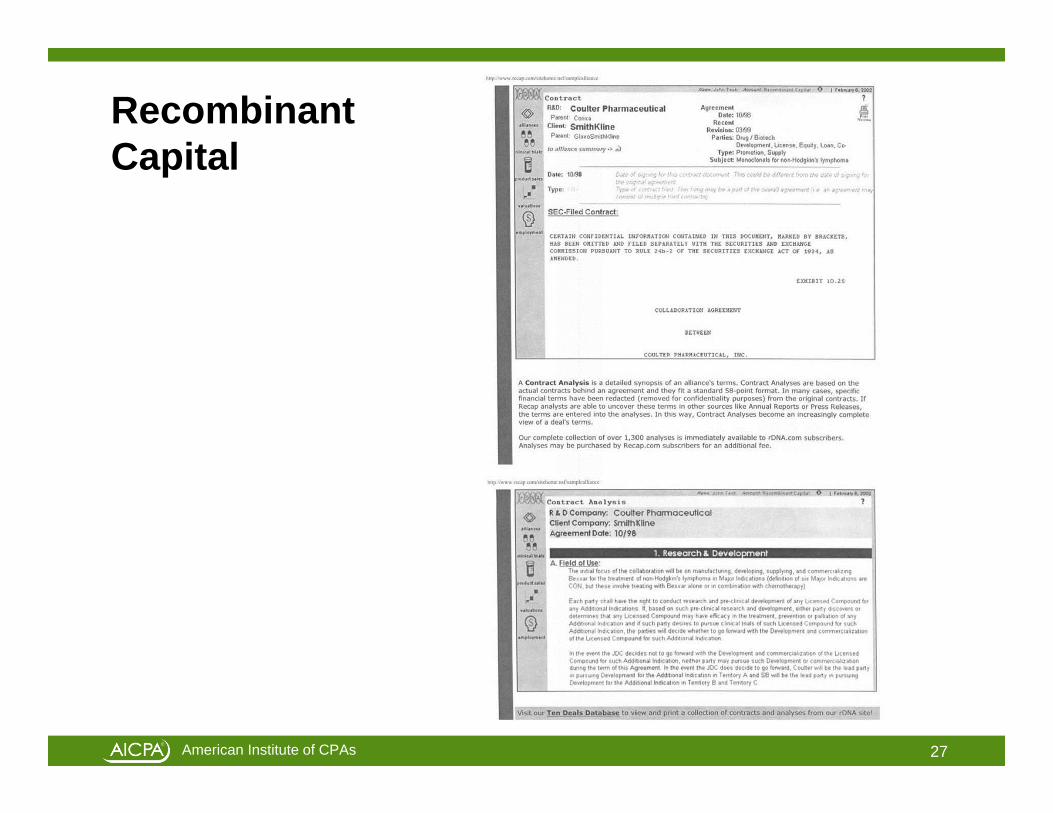
Market approach methods (cont.)• data sources commonly used to identify patent CUT royalty rates:
- AUS Corporation—RoyaltySource Royalty Rates- ktMINE, LLC—ktMINE- RoyaltyStat, LLC—RoyaltyStat
20

American Institute of CPAs
Market Approach Data Sources Examples
RoyaltySource illustrative examplektMINE illustrative exampleRoyaltyStat illustrative exampleRecombinant Capital illustrative example
21

American Institute of CPAs
Royalty Source
22
American Institute of CPAs
ktMINE
23

American Institute of CPAs
RoyaltyStat
24

American Institute of CPAs
RecombinantCapital
25

American Institute of CPAs
RecombinantCapital
26
American Institute of CPAs
RecombinantCapital
27

American Institute of CPAs
Patent Valuation Approaches and Methods (cont.)
Cost approach methods• particularly applicable for recently developed invention, for which
development cost or development effort data are available• also applicable for in-development or non-commercialized (e.g.,
defensive use) invention• value is commonly estimated as replacement cost new less
depreciation (RCNLD)• replacement cost new (RCN) includes:
- direct costs (person-months × cost per month)- indirect costs (out-of-pocket costs)- developer’s profit (return on cost investment)- entrepreneurial incentive (opportunity cost during patent
development period)
28

American Institute of CPAs
Patent Valuation Approaches and Methods (cont.)
Cost approach methods (cont.)• less depreciation (LD) allowances for:
- functional obsolescence (excess operating costs)- technological obsolescence (age/life before replacement)- economic obsolescence (inadequate ROI)
• owners often don’t track invention development costs• all conceptualization/commercialization costs should be included• consider the subject patent RUL for obsolescence• remember: value is RCNLD, value is not RCN
29
American Institute of CPAs
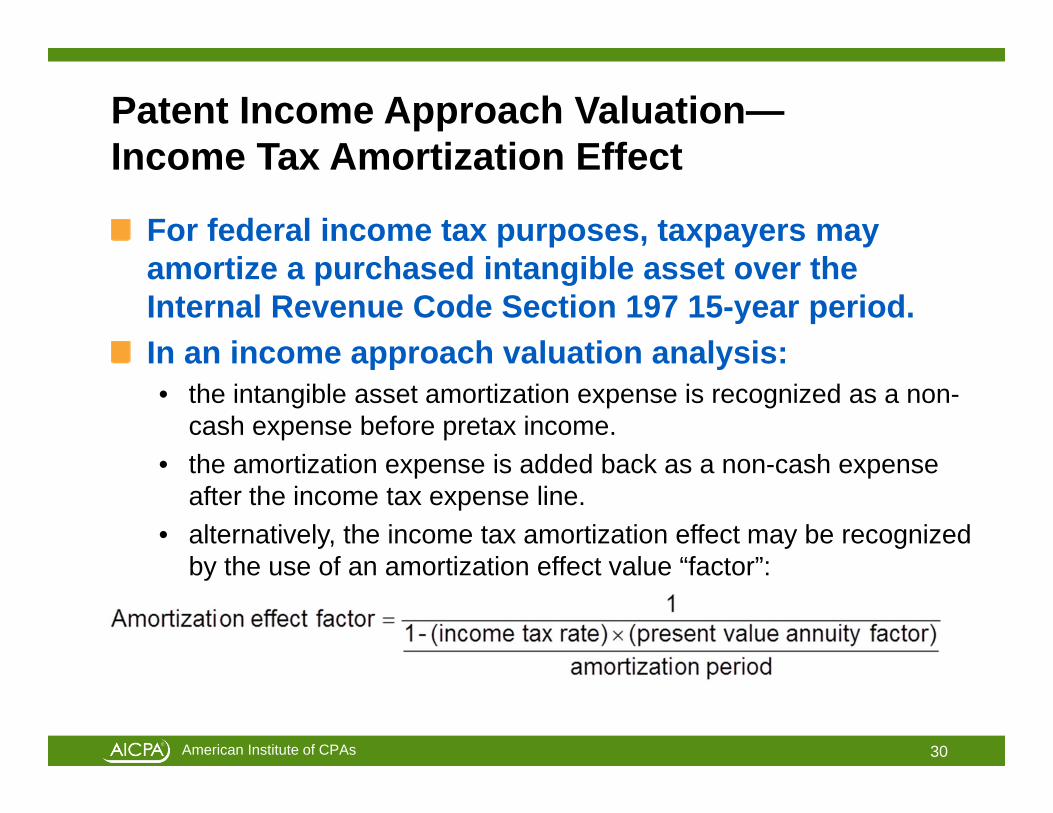
Patent Income Approach Valuation—Income Tax Amortization Effect
For federal income tax purposes, taxpayers may amortize a purchased intangible asset over the Internal Revenue Code Section 197 15-year period.In an income approach valuation analysis:• the intangible asset amortization expense is recognized as a non-
cash expense before pretax income.• the amortization expense is added back as a non-cash expense
after the income tax expense line.• alternatively, the income tax amortization effect may be recognized
by the use of an amortization effect value “factor”:
30
American Institute of CPAs
Patent Income Approach Valuation—Income Tax Amortization Effect (cont.)
In an income approach valuation analysis: (cont.)• income tax rate – for the owner/operator• amortization period – always 15 years• PVAF – for 15 years at the present value discount rate used in the
income approach analysis
31

American Institute of CPAs
Patent Income Approach Valuation—Income Tax Amortization Effect (cont.)
Illustrative example variables:• Income approach patent value indication - $100,000,000• Owner/operator income tax rate – 40%• Present value discount rate – 20%
Amortization effect factor = 14%
32

American Institute of CPAs
Patent Income Approach Valuation—Income Tax Amortization Effect (cont.)
Illustrative example conclusion:
$100,000,000 × (1 + 14%) = $114,000,000
Preliminary DCF value × (1 + factor %) =Patent fair market value indication
33

American Institute of CPAs
Income Approach—Income Tax Amortization Effect Conditions
This valuation adjustment is only appropriate:• in an income approach valuation analysis• for a Section 197 intangible asset (not all intangible assets qualify
as a Section 197 intangible asset)• in the purchase of a going concern operating business (not of a
single patent) in a taxable purchase of assets (not in a non-taxable purchase of stock)
• in a transaction between taxpayer entities that can recognize the income tax benefits (e.g., not between tax-exempt entities, tax pass-through entities, entities with large NOLs, etc.)
34
American Institute of CPAs
Patent Valuation Synthesis and Conclusion
How to select the valuation approaches and methods to use• does the selected valuation method accomplish the analyst’s
assignment?- defined value- transaction price- third-party license rate- intercompany transfer price- economic damages- IP bundle exchange ratio- transaction fairness opinion
35

American Institute of CPAs
Patent Valuation Synthesis and Conclusion (cont.)
How to select the valuation approaches and methods to use (cont.)• does the selected valuation method analyze the appropriate
bundle of legal rights?• are there sufficient available data to perform the selected
valuation method?• will the selected valuation method be understandable to the
intended audience?
36
American Institute of CPAs
Patent Valuation Synthesis and Conclusion (cont.)
How to weight the various valuation approach/ method value indications to conclude a final patent value• valuation analyst’s confidence in the quantity and quality of
available data• valuation analyst’s level of due diligence performed on available
data• relevance of the valuation method to the subject patent life cycle
stage and degree of marketability• degree of variation in the range of value indications• final value can be point estimate or a value range (for
transaction negotiations or fairness opinions)
37

American Institute of CPAs
Patent Valuation Illustrative Examples
Income approach—excess earnings method – Alpha Company chi pharmaceutical patentMarket approach—relief from royalty method – Beta Company psi pharmaceutical patentCost approach—RCNLD method – Gamma Company omega pharmaceutical patent
38
American Institute of CPAs
Income Approach—Excess Earnings Method Example
39
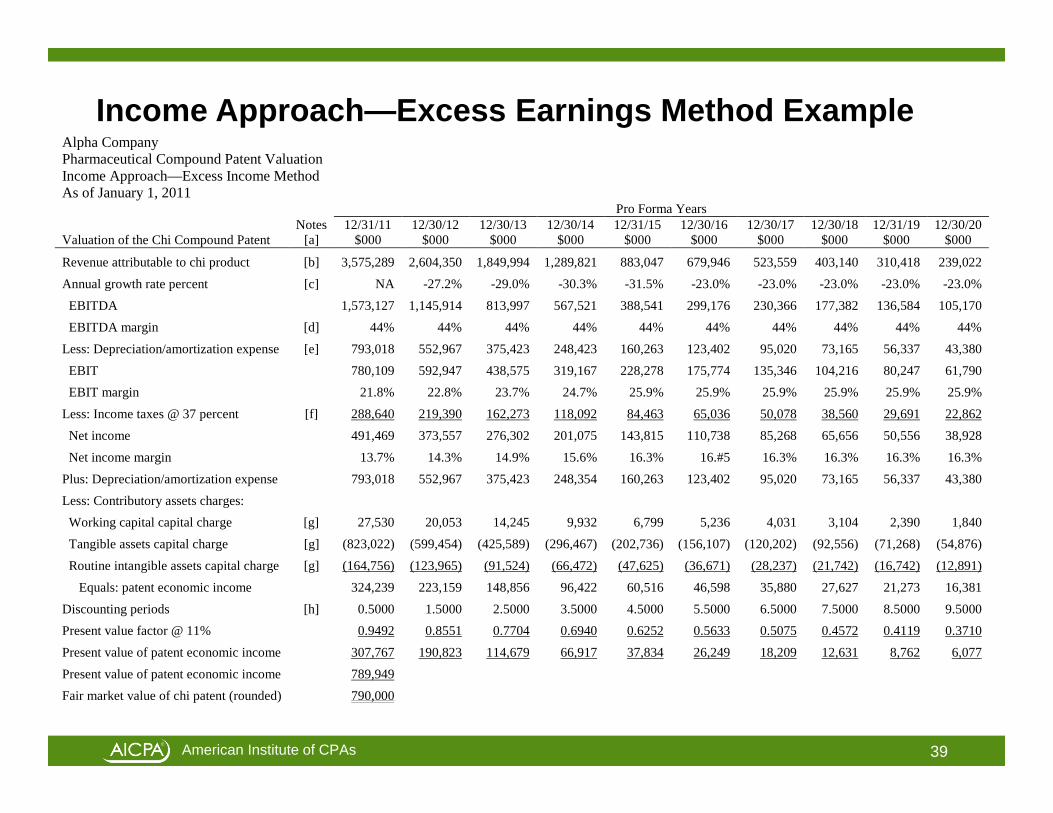
Alpha Company Pharmaceutical Compound Patent Valuation Income Approach—Excess Income Method As of January 1, 2011 Pro Forma Years Notes 12/31/11 12/30/12 12/30/13 12/30/14 12/31/15 12/30/16 12/30/17 12/30/18 12/31/19 12/30/20 Valuation of the Chi Compound Patent [a] $000 $000 $000 $000 $000 $000 $000 $000 $000 $000
Revenue attributable to chi product [b] 3,575,289 2,604,350 1,849,994 1,289,821 883,047 679,946 523,559 403,140 310,418 239,022 Annual growth rate percent [c] NA -27.2% -29.0% -30.3% -31.5% -23.0% -23.0% -23.0% -23.0% -23.0% EBITDA 1,573,127 1,145,914 813,997 567,521 388,541 299,176 230,366 177,382 136,584 105,170 EBITDA margin [d] 44% 44% 44% 44% 44% 44% 44% 44% 44% 44% Less: Depreciation/amortization expense [e] 793,018 552,967 375,423 248,423 160,263 123,402 95,020 73,165 56,337 43,380 EBIT 780,109 592,947 438,575 319,167 228,278 175,774 135,346 104,216 80,247 61,790 EBIT margin 21.8% 22.8% 23.7% 24.7% 25.9% 25.9% 25.9% 25.9% 25.9% 25.9% Less: Income taxes @ 37 percent [f] 288,640 219,390 162,273 118,092 84,463 65,036 50,078 38,560 29,691 22,862 Net income 491,469 373,557 276,302 201,075 143,815 110,738 85,268 65,656 50,556 38,928 Net income margin 13.7% 14.3% 14.9% 15.6% 16.3% 16.#5 16.3% 16.3% 16.3% 16.3% Plus: Depreciation/amortization expense 793,018 552,967 375,423 248,354 160,263 123,402 95,020 73,165 56,337 43,380 Less: Contributory assets charges: Working capital capital charge [g] 27,530 20,053 14,245 9,932 6,799 5,236 4,031 3,104 2,390 1,840 Tangible assets capital charge [g] (823,022) (599,454) (425,589) (296,467) (202,736) (156,107) (120,202) (92,556) (71,268) (54,876) Routine intangible assets capital charge [g] (164,756) (123,965) (91,524) (66,472) (47,625) (36,671) (28,237) (21,742) (16,742) (12,891) Equals: patent economic income 324,239 223,159 148,856 96,422 60,516 46,598 35,880 27,627 21,273 16,381 Discounting periods [h] 0.5000 1.5000 2.5000 3.5000 4.5000 5.5000 6.5000 7.5000 8.5000 9.5000 Present value factor @ 11% 0.9492 0.8551 0.7704 0.6940 0.6252 0.5633 0.5075 0.4572 0.4119 0.3710 Present value of patent economic income 307,767 190,823 114,679 66,917 37,834 26,249 18,209 12,631 8,762 6,077 Present value of patent economic income 789,949 Fair market value of chi patent (rounded) 790,000

American Institute of CPAs
Income Approach—Excess Earnings Method Example (cont.)Notes:[a] RUL on the chi compound patent is 10 years. Alpha management is planning to
replace the chi product with a new product as soon as it goes “off patent.”[b] Management provided a revenue projection for the chi product for the next five
years. That projection indicates the expected impact of non-infringing competitive pharmaceutical products.
[c] The analyst quantified the 23% revenue decay rate for similar drugs during the last five years of their patent life cycles.
[d] The chi product EBITDA margin has been fairly constant at around 44% during the first half of the patent life cycle.
[e] Depreciation expense is allocated to all Alpha products based on their relative revenue.
[f] Income tax rate at the marginal Alpha rate.[g] Capital charge is based on a fair rate of return multiplied by the:
-- FMV of product line NWC-- FMV of product line RE and TPP-- FMV of product line routine intangible assets (other than the chi patent)
[h] Mid-year discounting convention.40

American Institute of CPAs
Market Approach—Relief from Royalty Example
Beta Company Psi Compound Patent Valuation Hypothetical Guideline Patent License Agreements As of January 1, 2011 Guideline
Drug Patent
License
Guideline
Drug Patent Licensee
Guideline
Drug Patent Licensor
GuidelineLicense
Start Date
Guideline License Term Years
Guideline License Royalty Rate %
Other Consideration
Paid to the Licensor
Type of Licensed
Drug Product
1 Pfizer, Inc. Columbia U. 2008 15 6 $4m [a] ED 2 Glaxo Smith Kline Autogent 2007 10 5 $10m [b] cardiovascular 3 Johnson & Johnson Novel N.V. 2008 12 10 [c] anti-obesity 4 Merck & Co. All Saints Hospital 2008 10 4.5 [d] vascular 5 Pharmacia & Upjohn MIT 2009 15 5.5 [e] pulmonary hypertension6 Wyeth-Ayerst MD, LP 2009 20 8-10 [f] [f] botanical ED
Notes: [a] Represents an upfront (i.e., development financing) license payment. [b] Represents a milestone payment after the 5th year of the license. [c] The license agreement also settles a pending $50 million litigation between the various license parties. [d] The physician owners/employees also receive research grants from Merck. [e] There are also numerous other relationships between the licensor/licensee parties. [f] The royalty rate range is based on the level of the drug product annual sales volume.
41
American Institute of CPAs
Market Approach—Relief from Royalty Example (cont.)
42
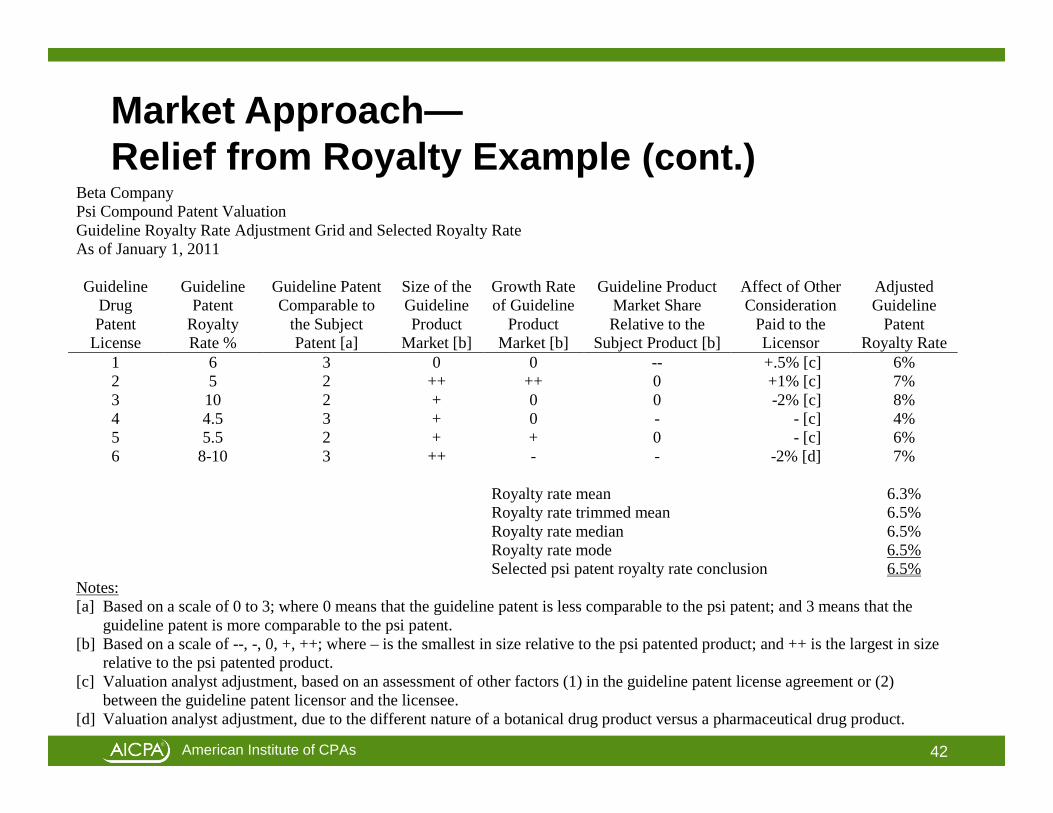
Beta Company Psi Compound Patent Valuation Guideline Royalty Rate Adjustment Grid and Selected Royalty Rate As of January 1, 2011 Guideline
Drug Patent
License
Guideline Patent
Royalty Rate %
Guideline Patent Comparable to
the Subject Patent [a]
Size of the Guideline Product
Market [b]
Growth Rate of Guideline
Product Market [b]
Guideline Product Market Share Relative to the
Subject Product [b]
Affect of Other Consideration
Paid to the Licensor
Adjusted Guideline
Patent Royalty Rate
1 6 3 0 0 -- +.5% [c] 6% 2 5 2 ++ ++ 0 +1% [c] 7% 3 10 2 + 0 0 -2% [c] 8% 4 4.5 3 + 0 - - [c] 4% 5 5.5 2 + + 0 - [c] 6% 6 8-10 3 ++ - - -2% [d] 7% Royalty rate mean 6.3% Royalty rate trimmed mean 6.5% Royalty rate median 6.5% Royalty rate mode 6.5% Selected psi patent royalty rate conclusion 6.5%
Notes: [a] Based on a scale of 0 to 3; where 0 means that the guideline patent is less comparable to the psi patent; and 3 means that the
guideline patent is more comparable to the psi patent. [b] Based on a scale of --, -, 0, +, ++; where – is the smallest in size relative to the psi patented product; and ++ is the largest in size
relative to the psi patented product. [c] Valuation analyst adjustment, based on an assessment of other factors (1) in the guideline patent license agreement or (2)
between the guideline patent licensor and the licensee. [d] Valuation analyst adjustment, due to the different nature of a botanical drug product versus a pharmaceutical drug product.

American Institute of CPAs
Market Approach—Relief from Royalty Method Example (cont.)
43
Beta Company Psi Compound Patent Valuation Relief from Royalty Valuation Method As of January 1, 2011 (in $ millions) Projection Period Psi Patent Valuation Analysis: [a] Year 1 Year 2 Year 3 Year 4 Year 5 Year 6 Year 7 Year 8 Year 9Psi product revenue expected growth rate [b] 10% 10% 10% 0% 0% 0% -12% -12% -12%Psi revenue amount (year 0 revenue = 400) 440 484 532 532 532 532 469 412 363Selected patent license royalty rate 6.5% 6.5% 6.5% 6.5% 6.5% 6.5% 6.5% 6.5% 6.5%Projected “relief from royalty” license expense (rounded) 29 31 35 35 35 35 30 27 24Projected patent maintenance expense (year 0 expense = 10) [c] 10 11 11 11 12 12 12 13 13Projected net “relief from royalty” license expense (rounded) 19 20 24 24 23 23 18 14 11Present value discount factor (at 20%, mid-year convention) 0.91 0.76 0.63 0.53 0.44 0.37 0.30 0.25 0.21Present value of “relief from royalty” net license expense 17 15 15 13 10 9 5 4 2Total present value or “relief from royalty” net license expense 90 Fair market value of the psi compound patent (rounded) 90

American Institute of CPAs
Market Approach—Relief from Royalty Method Example (cont.)Notes:[a] Expected RUL of the psi patent is 9 years, based on management’s projection of the
psi product economic life. Management is currently developing a replacement product.
[b] Analyst derived the projected revenue growth/decline rates (in conjunction with management) based on an analysis of similar drug product revenue growth/decline rates during the last half of their patent life cycles.
[c] Analyst derived (in conjunction with management) an estimate of the psi product legal, R&D, marketing, and other maintenance expenses.
44

American Institute of CPAs
Cost Approach—RCNLD Method Example
45
Gamma Company Omega Compound Patent Cost Approach—Replacement Cost New Less Depreciation (RCNLD) Method As of January 1, 2011 Product Development Stages
Estimated Replacement
Development Effort in Person Months [a]
Time to Develop Replacement (in Calendar Months) [b]
Indicated RCNLD
Component [c] $000
Initial compound 4,531 29 66,100 Product compound 575 25 8,400 Initial stage product tests 3,304 16 48,200 Second stage product tests 1,229 5 17,900 Third stage product tests 1,807 41 26,400 Final FDA license process 325 12 4,700 Branding and marketing 85 9 1,200 Total direct and indirect costs 11,856 24 172,900 Plus developer’s profit [d] 10,500 Plus entrepreneurial incentive [e] 31,200 Equals: Total replacement cost new 214,600 Less: Depreciation and obsolescence [f] 13,300 Equals: Replacement cost new less depreciation 201,300 Fair market value of omega compound patent (rounded) 200,000

American Institute of CPAs
Cost Approach—RCNLD Method Example (cont.)Notes:[a] Based on Gamma Company employee time records and laboratory notebooks—
related to this recently developed (and not yet commercialized) drug compound patent.
[b] Based on the actual elapsed development time for the omega product and for similar Gamma Company pharmaceutical products.
[c] Based on $14,585 per person-month—i.e., the actual weighted average full absorption cost of all Gamma Company employees who worked on the omega compound development project (stated in 1/1/11 dollars).
[d] Based on the total direct costs plus indirect costs times the typical profit margin for an independent laboratory/compound development firm.
[e] Expected lost profit (net cash flow) during the first 24 months (i.e., the elapsed replacement period) of the omega drug commercialization process.
[f] Based on the RCN of person-hours related to the development of unsuccessful compound features.
46
American Institute of CPAs
Defending the Value Conclusion
Defending the patent value, price, royalty rate, economic damages, exchange ratio, fairness conclusion• explain the valuation (or price, royalty rate, etc.) assignment• describe the subject patent and the subject bundle of legal rights• explain the selection/rejection of all generally accepted valuation
approaches and methods• explain the selection and application of all specific analysis
procedures• describe the data gathering and due diligence procedures• list all documents and data considered• include copies of all documents specifically relied on
47

American Institute of CPAs
Defending the Value Conclusion (cont.)
Defending the patent value, price, royalty rate, economic damages, exchange ratio, fairness conclusion (cont.)• summarize all of the qualitative analyses performed• include schedules and exhibits of all quantitative analyses• avoid any unexplained or unsourced variables/assumptions• allow for the replicability of all analyses• encourage the reader’s reliability of the written report
- report should be clear, convincing, and cogent- report should be well-organized, well-written, and well-
presented- report should be free of grammar, punctuation, spelling, and
mathematical errors
48

American Institute of CPAs
Summary and ConclusionUnderstand the analyst’s assignmentUnderstand the subject patent and the subject legal rightsCollect sufficient owner/operator financial dataCollect sufficient industry, market, competitive dataDocument the specific patent economic benefitsPerform due diligence procedures on all available dataSelect and apply income, market, and cost approach valuation methodsReconcile all value (price, royalty rate, etc.) indications into a final conclusionDefend the analysis conclusion in a replicable and well-documented report
49