Embed Size (px)
Citation preview

1/42
Practical Analysis and Interpretation: DTI and tractography
Gwenaëlle Douaud
FMRIB, University of Oxford
FSL course – Oxford, 21/08/14

2/42
𝑦
𝑥
𝑧
Historical description of the diffusion tensor
• Formalised by Peter Basser and colleagues (1994a; 1994b)
S(b)
S0
= e-bD
In an isotropic, unconstrained environment: D = scalar
In an anisotropic, constrained environment: D = 33 definite symmetric positive D = “diffusion tensor”
𝑦
𝑥
𝑧
FSL course – Oxford, 21/08/14

3/42
In an anisotropic, constrained environment: D = 33 definite symmetric positive D = “diffusion tensor”
𝑦
𝑥
𝑧
D = Dxx Dxy Dxz
Dyx Dyy Dyz
Dzx Dzy Dzz
D 𝑒𝑖 = i 𝑒𝑖
𝑒3
𝑒1
𝑒2 2
3
1
with i {1,2,3}
𝑒𝑖 = “eigenvector” i = “eigenvalue” with 123
Historical description of the diffusion tensor
FSL course – Oxford, 21/08/14
4/42
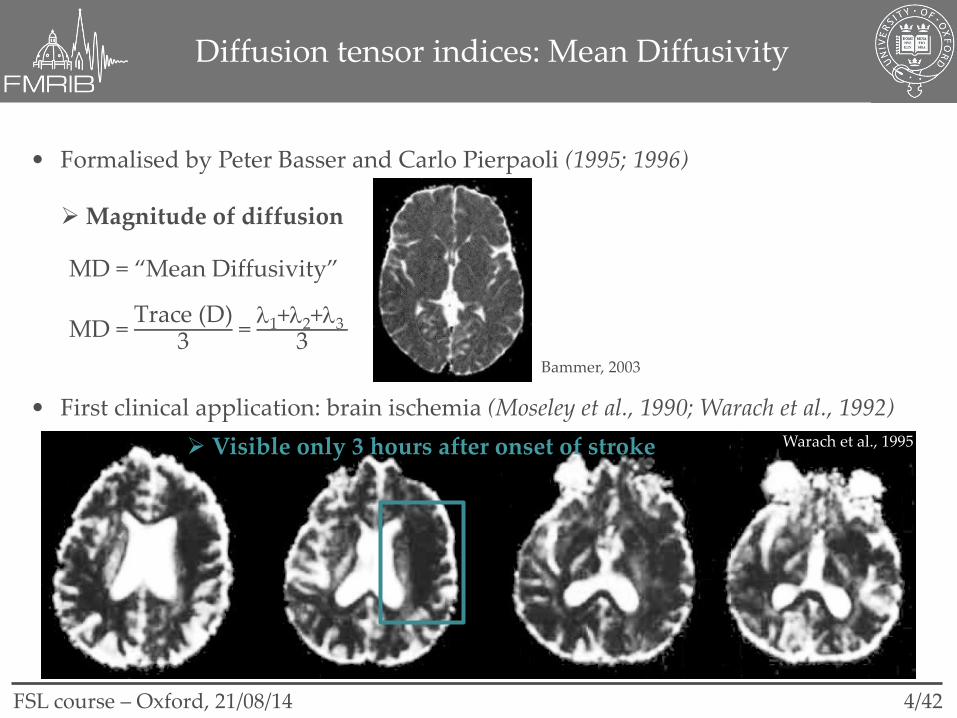
• First clinical application: brain ischemia (Moseley et al., 1990; Warach et al., 1992)
Diffusion tensor indices: Mean Diffusivity
• Formalised by Peter Basser and Carlo Pierpaoli (1995; 1996)
MD = “Mean Diffusivity”
MD = Trace (D)
3 = 1+2+3
3
Magnitude of diffusion
Bammer, 2003
Warach et al., 1995 Visible only 3 hours after onset of stroke
FSL course – Oxford, 21/08/14

5/42
• Formalised by Peter Basser and Carlo Pierpaoli (1995; 1996)
FA = “Fractional Anisotropy”
FA = 3Var()
2(12+2
2+32)
RA = “Relative Anisotropy” VR = “Volume Ratio”
VR = 123 MD3 RA =
Var()
3MD
Bammer, 2003
Diffusion tensor indices: diffusion anisotropy
• Formal comparison of three anisotropy indices (Papadakis et al., 1999)
Anisotropy of diffusion
FSL course – Oxford, 21/08/14

6/42
Fractional Anisotropy and Mean Diffusivity: region-of-interest (ROI) vs voxel-wise analysis
• Developmental study: comparison between ROI and voxel-based diffusion analysis (VBD) (Snook et al., 2007)
The discrepancies related to: - ROI approach inherently limited – FIRST, FreeSurfer etc. but bias? - Issues with the spatial normalisation for VBD analysis (*) - Averaging out localised changes within a ROI (**)
FSL course – Oxford, 21/08/14

7/42
• Increasing sensitivity and interpretability of results compared with VBD TBSS (Smith et al., 2006)
Fractional Anisotropy and Mean Diffusivity: (*) region-of-interest (ROI) vs voxel-wise analysis
FSL course – Oxford, 21/08/14

8/42
TBSS VBD
Mean Control
Mean Patient
Fractional Anisotropy and Mean Diffusivity: (*) region-of-interest (ROI) vs voxel-wise analysis
• Increasing sensitivity and interpretability of results compared with VBD TBSS (Smith et al., 2006)
FSL course – Oxford, 21/08/14

9/42
• Developmental study: anatomical and tractography-defined ROI (Lebel et al., 2008)
Fractional Anisotropy and Mean Diffusivity: region-of-interest (ROI) & voxel-wise analysis
FSL course – Oxford, 21/08/14

10/42
• Large developmental and ageing study using TBSS (Westlye et al., 2010)
Fractional Anisotropy and Mean Diffusivity: region-of-interest (ROI) & voxel-wise analysis
FSL course – Oxford, 21/08/14

11/42
• Large developmental and ageing study using TBSS (Westlye et al., 2010)
Fractional Anisotropy and Mean Diffusivity: region-of-interest (ROI) & voxel-wise analysis
Limits of the general linear model (GLM)
FSL course – Oxford, 21/08/14

12/42
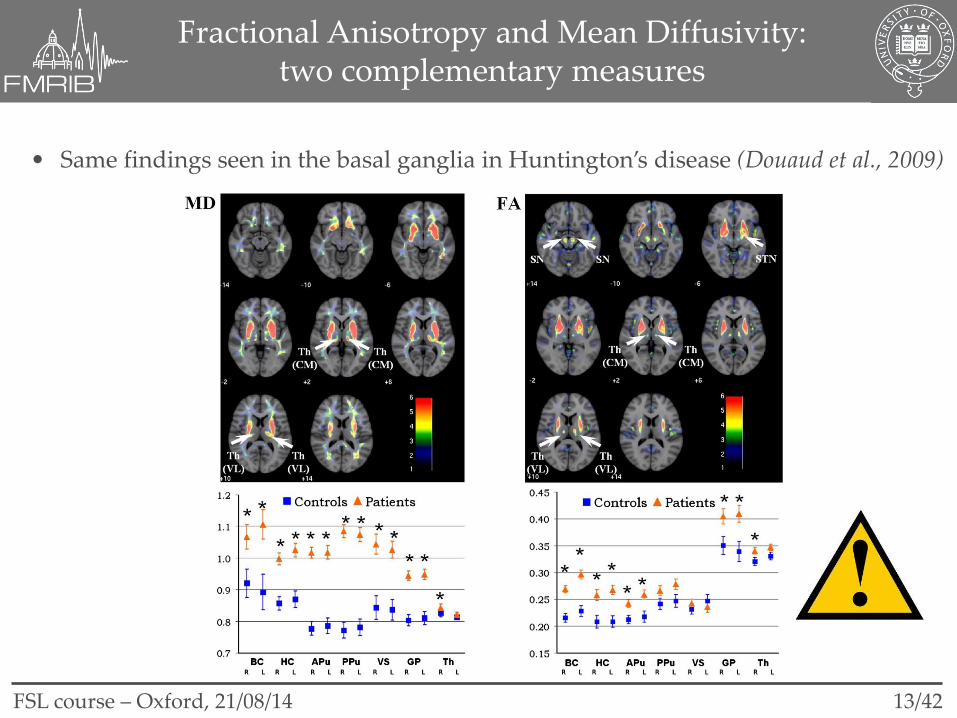
Fractional Anisotropy and Mean Diffusivity: two complementary measures
• An intriguing finding in multiple sclerosis (Ciccarelli et al., 2001)
Patient
Control
White matter
basal ganglia
Increased FA in the basal ganglia in MS = selective Wallerian degeneration, making it appear “more organised”?
FSL course – Oxford, 21/08/14
13/42
• Same findings seen in the basal ganglia in Huntington’s disease (Douaud et al., 2009)
Fractional Anisotropy and Mean Diffusivity: two complementary measures
FSL course – Oxford, 21/08/14

14/42
Beyond Fractional Anisotropy and Mean Diffusivity: Principal Diffusion Direction (e1)
• Using the information from the PDD (Schwartzmann et al., 2005)
𝑒3
𝑒1
𝑒2 2
3
1
Douaud et al., 2009
FSL course – Oxford, 21/08/14

15/42
• Decrease of the dispersion of the PDD in Huntington’s disease (Douaud et al., 2009)
Beyond Fractional Anisotropy and Mean Diffusivity: Principal Diffusion Direction (e1)
FSL course – Oxford, 21/08/14

16/42
• No difference in the white matter of mild cognitive impairment (MCI) patients using MD or FA (Douaud et al., 2011)
Mode of anisotropy (MO): 3rd moment of the tensor, introduced by Basser (1997), formalised by Ennis and Kindlamnn (2006).
-1 Planar, disc-like 1~ 2:
e.g., areas of crossing fibres
+1 Linear, cigar-like 2~ 3:
e.g., areas of one predominating fibre
population
Beyond Fractional Anisotropy and Mean Diffusivity: the MOde of anisotropy (MO)
FSL course – Oxford, 21/08/14

17/42
• Significant difference in the white matter of MCI patients, with an increase of MO
MCI>CON
AD>CON AD>CON
Douaud et al., 2011
Beyond Fractional Anisotropy and Mean Diffusivity: the MOde of anisotropy (MO)
FSL course – Oxford, 21/08/14
18/42
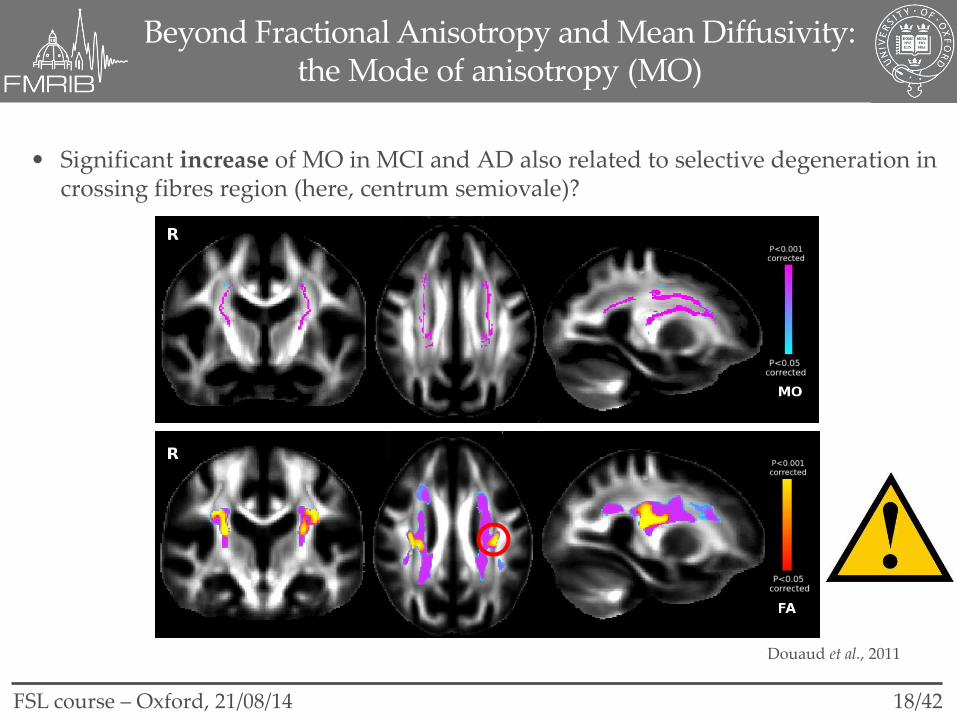
• Significant increase of MO in MCI and AD also related to selective degeneration in crossing fibres region (here, centrum semiovale)?
Douaud et al., 2011
Beyond Fractional Anisotropy and Mean Diffusivity: the Mode of anisotropy (MO)
FSL course – Oxford, 21/08/14

19/42
• Significant increase of MO in MCI and AD also related to selective degeneration in crossing fibres region (here, centrum semiovale)
Douaud et al., 2011
Beyond Fractional Anisotropy and Mean Diffusivity: the Mode of anisotropy (MO)
FSL course – Oxford, 21/08/14

20/42
Tractography: think before you publish!
AD>CON
AD<CON
Association tracts
Motor tracts
FSL course – Oxford, 21/08/14

21/42
• So… you can’t use tractography streamlines directly
Tractography: what you can do
• And… you can’t use tractography to prove the existence of a tract (Jbabdi & Johansen-berg, 2011)
But you can use tractography to: - create ROI/parcellate - help understand further some results: shape analysis (Parkinson’s disease)
Menke et al., 2013
FSL course – Oxford, 21/08/14

22/42
• So… you can’t use tractography streamlines directly
Tractography: what you can do
But you can use tractography to: - create ROI/parcellate - help understand further some results: TBSS (amyotrophic lateral sclerosis)
Douaud, Filippini et al., 2011
• And… you can’t use tractography to prove the existence of a tract (Jbabdi & Johansen-berg, 2011)
FSL course – Oxford, 21/08/14

23/42
Increase FC in ALS
Douaud, Filippini et al., 2011
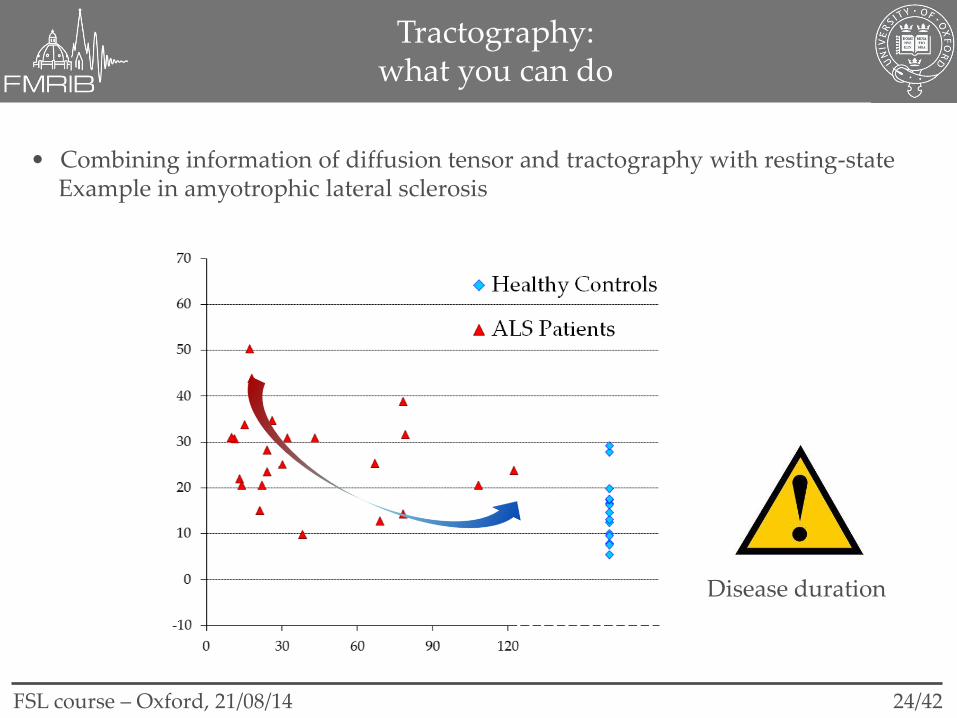
• Combining information of diffusion tensor and tractography with resting-state Example in amyotrophic lateral sclerosis
FSL course – Oxford, 21/08/14
Tractography: what you can do
24/42
Disease duration
• Combining information of diffusion tensor and tractography with resting-state Example in amyotrophic lateral sclerosis
FSL course – Oxford, 21/08/14
Tractography: what you can do

25/42
• Reconciling lower structural connectivity (SC) with higher functional connectivity?
Higher functional connectivity not necessarily better
Innocenti, 2009
corpus
callosum
GABAergic
interneurons
• Combining information of diffusion tensor and tractography with resting-state Example in amyotrophic lateral sclerosis
FSL course – Oxford, 21/08/14
Tractography: what you can do

26/42
Low SC + high FC in ALS = loss of GABA interneurons
- GABA + FC
• Combining information of diffusion tensor and tractography with resting-state Example in amyotrophic lateral sclerosis
Douaud, Filippini et al., 2011
FSL course – Oxford, 21/08/14
Tractography: what you can do

27/42
“Our data suggest that the optimum target for tremor suppression is defined by its remote connections rather than spatial coordinates“
• So… you can’t use tractography streamlines directly
Tractography: what you can do
But you can use tractography to: - create ROI/parcellate - help understand further some results: deep brain stimulation (Klein et al., 2012)
• And… you can’t use tractography to prove the existence of a tract (Jbabdi & Johansen-berg, 2011)
FSL course – Oxford, 21/08/14

28/42
• So… you can’t use tractography streamlines directly
Tractography: what you can do
But you can use tractography to: - create ROI/parcellate - help understand further some results - correlate “seeds-to-target” with behaviour/compare between populations
Cohen et al., 2009
• And… you can’t use tractography to prove the existence of a tract (Jbabdi & Johansen-berg, 2011)
FSL course – Oxford, 21/08/14

29/42
• Validated in animal models by Song and colleagues (2002; 2005)
= 1
Parallel diffusivity or axial diffusivity: assessing axonal injury
= 2+3
2
Perpendicular diffusivity or radial diffusivity: assessing myelin injury
Beyond Fractional Anisotropy and Mean Diffusivity: Parallel and Perpendicular Diffusivity
FSL course – Oxford, 21/08/14

30/42
Beyond Fractional Anisotropy and Mean Diffusivity: Parallel and Perpendicular Diffusivity
• Validated in humans using the model of callosotomy (Concha et al., 2006)
Axonal degradation Myelin degradation
FSL course – Oxford, 21/08/14

31/42
Diffusion tensor indices: in vivo models and histological validation
• Basis of diffusion anisotropy in the brain: comprehensive review by Beaulieu (2002)
Anisotropy due to membrane, not myelin Myelin modulates anisotropy Axonal cytoskeleton does not contribute to anisotropy
FSL course – Oxford, 21/08/14

32/42
Diffusion tensor indices: in vivo models and histological validation
• Combined in vivo diffusion/histological study: animal model (van Camp et al., 2012)
FSL course – Oxford, 21/08/14

33/42
• Combined in vivo diffusion/histological study: epilepsy (Concha et al., 2010)
Diffusion tensor indices: in vivo models and histological validation
FSL course – Oxford, 21/08/14

34/42
The take-home message slides
• Voxel-wise (VBD) results depend on the accuracy of the registration
TBSS
• TBSS doesn’t cover the basal ganglia and regions of crossing fibres
VBD!
ROI
Yendiki et al., 2011
“Tracula!”
FSL course – Oxford, 21/08/14

35/42
• (**) Tractography/atlas ROI of tracts: effects can be averaged out
Groeschel et al., 2014
Look along the tract, or only in regions with one dominating fibre population
The take-home message slides
FSL course – Oxford, 21/08/14
36/42
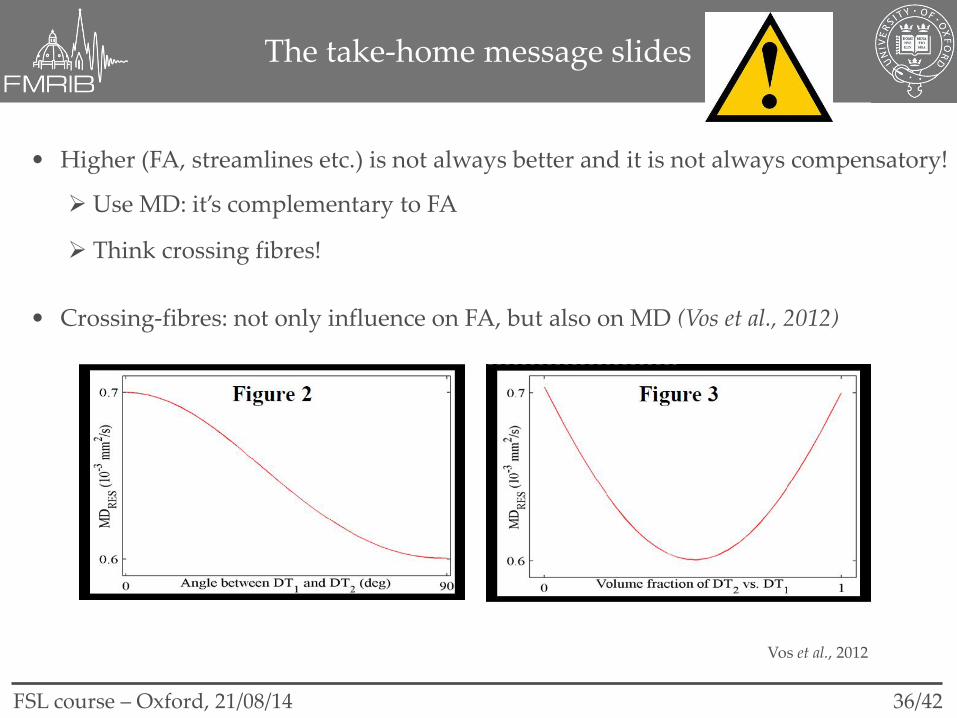
Think crossing fibres!
• Higher (FA, streamlines etc.) is not always better and it is not always compensatory!
Use MD: it’s complementary to FA
The take-home message slides
• Crossing-fibres: not only influence on FA, but also on MD (Vos et al., 2012)
Vos et al., 2012
FSL course – Oxford, 21/08/14

37/42
The take-home message slides
• Crossing-fibres: problematic interpretation of and
>70% of the voxels have more
than 1 fibre population
If ambiguous interpretation: MO, PDD dispersion, Westin indices (Westin et al., 1997)
FSL course – Oxford, 21/08/14

38/42
The take-home message slides
• Crossing fibres help detect subtle differences (Tuch et al., 2005; Douaud et al., 2011)
Tuch et al., 2005
MCI>CON
Douaud et al., 2011
FSL course – Oxford, 21/08/14

39/42
Progressing MCI – Stable MCI MCI – Healthy elderly
Microstructural white matter differences between progressive MCI and stable MCI?
FSL course – Oxford, 21/08/14

40/42
Increasing volume (hippocampus)
Incr
easi
ng
mic
rost
ruct
ura
l d
amag
e
(hip
po
cam
pu
s)
sMCI
pMCI
Progression to Alzheimer’s disease: diffusion & GM measures are complementary
FSL course – Oxford, 21/08/14

41/42
• Effect of partial volume effect (PVE) on FA, MD etc. (Jones, ISMRM 2011)
• Choice of sequence: anisotropic voxels (Vos et al., ISMRM 2011)
• Choice of sequence: 12 orientations, 5 b-values: more sensitive to using MD 30 orientations, 2 b-values: more sensitive to using FA
The take-home message slides
Correction for CSF contamination? (Metzler-Baddeley et al., 2012)
FSL course – Oxford, 21/08/14

42/42
The 8 commandments
• FA and MD complementary to interpret results: higher FA is not necessarily better
• Do not forget about PVE, noise, non-linearity and X fibres to help interpret results
• and give additional information, but are problematic in crossing-fibre regions
• Choice of sequence: isotropic voxels, optimised for specific question
• Always check opposite contrast, it might give you the only significant results!
• Think about the right approach for your study, if necessary use complementary ones (ROI, TBSS, VBD, tractography…)
• Think before you publish!
• Do not directly use the tractography paths for your study (ROI, classification etc.)
FSL course – Oxford, 21/08/14

43/42
FMRIB, University of Oxford - Karla Miller - Stamatios Sotiropoulos - Timothy Behrens - Steve Smith - Peter Jezzard - Saad Jbabdi
QUESTIONS?
Special thanks to:
SHFJ, CEA, Orsay - Cyril Poupon - Yann Cointepas - Denis Riviere - Jean-Francois Mangin
FSL course – Oxford, 21/08/14