Embed Size (px)
Citation preview

PR19 Business Plan Supporting Information
PR19 Outcome Delivery Incentives
Ref 5.5 PR19 Outcome Delivery Incentives September 2018

PR19 Business Plan Supporting Information
PR19 Outcome Delivery Incentives
PR19 Outcome Delivery Incentives
1. OVERVIEW ............................................................................................................................................... 1
2. REPUTATIONAL ODIS ............................................................................................................................... 5
3. FINANCIAL ODIS ...................................................................................................................................... 8
4 RORE RANGE ......................................................................................................................................... 24
5 TIMING AND PAYMENT OF ODI PAYMENTS ........................................................................................... 28
6 CUSTOMER PROTECTION ....................................................................................................................... 29
7 RESULTS AND IMPACT ON BILLS ............................................................................................................ 31
8 ALLOCATION ACROSS PRICE CONTROLS ................................................................................................ 32
APPENDIX 1: COMPLIANCE WITH OFWAT’S GUIDANCE ................................................................................. 34
APPENDIX 2: OVERVIEW OF INDIVIDUAL FINANCIAL ODIS ............................................................................. 39
Supporting Document
5.5.1 - PR19 Outcome Delivery Incentives- ODI Payment Incentive Rates

PR19 Business Plan Supporting Information Page 1 of 65
PR19 Outcome Delivery Incentives
1. Overview
Introduction
For the five years of AMP7 we are introducing a suite of 47 performance commitments (PCs). Outcome Delivery Incentives (ODIs) are the reputational and financial incentives that will drive us to deliver on these performance commitments. Their development draws upon research into customer views and valuations and information on costs and benefits, supplemented with management judgement.
The purpose of this document is to explain how we have arrived at our proposed ODIs and their potential effect on customers and company finances. Sections 2 and 3 describe the derivation of reputational and financial ODIs respectively, which is followed by a presentation of the impact of the latter on the RoRE range in section 4. Sections 5 and 6 address ODI design issues, section 7 considers the potential impact of ODIs on customer bills, including the effects of our “WaterShare” initiative, and finally section 8 explains how the impact on the financial ODIs is spread across the different price controls. Appendix 1 provides an overview of how we have complied with the final methodology requirements. Appendix 2 contains “at-a-glance” reference sheets for each of the financial ODIs setting out all the relevant facts and figures together with an explanation of how they were derived.
Overview of ODIs
Of our 47 performance commitments, reputational incentives have been applied to 19 and financial incentives have been applied to 28, including C-Mex and D-Mex. Our suite of financial ODIs, outlined below, delivers a RoRE range of -1.5% for underperformance payments and +1.2% for outperformance payments (excluding C-Mex and D-Mex).

PR19 Business Plan Supporting Information Page 2 of 65
PR19 Outcome Delivery Incentives
Performance Commitment Maximum (Over 5 years)
Underperformance
Payment (£m) Outperformance
Payment (£m) Customer Trust 32 32 Tap Water Quality Compliance Risk Index 25 - Water Supply Interruptions 25 25 Leakage 25 25 Sewer Flooding on Customer Property (Internal) 25 25 Pollution Incidents from Wastewater 25 25 Acceptability of Drinking Water 13 13 Wastewater Treatment Works 'look-up' Table Compliance 13 - Km of River Improved 13 13 Total Complaints 13 13 Asset Resilience (Reservoirs) 13 13 Asset Resilience (Water Network+ Above Ground) 13 13 Asset Resilience (Water Network+ Below Ground) 13 13 Asset Resilience (Waste Network+ Above Ground) 13 13 Asset Resilience (Waste Network+ Below Ground) 13 13 Water Mains Burst 7 - Sewer Collapses 7 - Water and Wastewater Treatment Works Compliance 7 - Sewer Flooding on Customer Property (External) 7 7 Business Customer Satisfaction 7 7 Visitors to Recreational Facilities 7 7 Community Education 7 7 Surface Water Removed from Sewers 7 7 Bioresources Product Quality 7 7 Bioresources Disposal Compliance 7 - Lead Supply Pipes Replaced 7 7 2017-18 Prices 351 285
Under the new WaterShare mechanism that we are introducing for AMP7, 50% of any net outperformance payment in a year will be returned to customers in the form of lower average bills. The total annual bill decrease where all maximum underperformance payments are earned is £40 and the total bill increase when all maximum outperformance are applied is £16 per year (£33 before WaterShare). The RoRE range is defined between the point at which there is a 10% probability of performance being worse and a 10% percent probability of it being better. The graph shows the potential impact of ODIs on customer bills at the different probabilities before and after the application of the WaterShare adjustment. At the 10% probability the reduction in the average bill is £17 per annum and the increase in the average bill is £6 per annum (£11 before WaterShare).
Table 1: Suite of PCs

PR19 Business Plan Supporting Information Page 3 of 65
PR19 Outcome Delivery Incentives
1.3. Summary of the results of customer research
As part of our extensive programme of PR19-focused customer research, specific studies were undertaken to explore customers’ views on ODIs. The work was carried out by our research partner, Accent, to gain a comprehensive understanding of customers’ views on the overall principles of the ODI framework, including underperformance and outperformance payments. The ODI-specific research consisted of qualitative research into the attitudes of both household and non-household customers, involving two large scale workshops, homework for customers, and eight reconvened groups. The key findings may be summarised as following:
• Customers generally understood the principle of outperformance and underperformance payments as an effective way of incentivising businesses, but a significant minority of customers felt confused about the underlying concept.
• For all customers, our ‘not for profit’ model added an additional layer of complexity, and many participants questioned the relevance of outperformance and underperformance payments for us.
• The principle that an outperformance payment leads to a bill increase for customers mainly generated a negative response. A minority supported a bill increase because they believe that they will benefit through improved service levels in the future.
• Most customers also felt that the application of underperformance payments and the related bill decrease is not appealing, and prompts concerns that it may lead to a negative service spiral.
• There were divided opinions on whether ODIs should be in-period or applied at the end of period. There was a view that measures that are intrinsically long term in nature should be addressed through end of period ODIs. Customers noted the benefits of in period ODIs in that they are dynamic, visible and generate more customer engagement. On the other hand customers noted that the benefit of end of period ODIs is that the effect of performance can be smoothed and therefore lead to more stable bills.
-20
-15
-10
-5
0
5
10
15
P10 P20 P30 P40 P50 P60 P70 P80 P90
Bil I
mpa
ct (£
)
Potential Bill Impact of Financial Incentives
WaterShareBill Impact
Bill Impact
Figure 1: Potential Bill Impact of Financial Incentives

PR19 Business Plan Supporting Information Page 4 of 65
PR19 Outcome Delivery Incentives • The majority of customers did not support deadbands as they felt that this shifts the target.
A minority did accept deadbands, citing the fact that “occasionally things to wrong that are outside of our control (such as, extreme weather events)”.
• Customers also emphasised the need for caps and collars to protect the customer from spiralling bills and to protect against the loss of revenue for investment.
Full details of all of the ODI-related research can be found at 1.1G PR19 Customer Engagement- ODI Research.
1.4. Compliance with Final Methodology Requirements
In preparing our proposed suite of ODIs, we have taken full account of the requirements of Ofwat’s methodology. Where we have been presented with trade-offs between competing principles, we have made the choices that we judge to be in the best interests of customers. As a result, on some issues we have departed from the letter of the methodology requirements, but where we do so we have made clear exactly what we have done and why. For ease of reference we have prepared a consolidated explanation of how we comply with the final methodology. This is presented in Appendix 1.

PR19 Business Plan Supporting Information Page 5 of 65
PR19 Outcome Delivery Incentives
2. Reputational ODIs
Financial versus Reputational ODIs
Although all published performance measures have an impact on company reputation, we draw a distinction between those that give rise to a financial outperformance or underperformance payment, and those that do not. For ease of reference we call the latter “reputational” and the former “financial”.
When considering the design of ODIs for individual measures, our default position is that there should be a financial element. For some, however, there are sound reasons as to why a reputational incentive is appropriate. The criteria we have considered to justify the use of non-financial incentives are as follows:
• Implicit Financial Incentive- Where a performance commitment has implicit financial incentives within the measure, it may be inappropriate to have further financial incentives, for example bad debt.
• Supporting measures- Where a performance commitment is a supporting measure it may be inappropriate to have a financial incentive, possibly because it has no direct impact on customers and possibly because the inclusion of a financial element would lead to an overlap with other financial ODIs for example staff training and expertise.
• New measures- Where a performance commitment is a new measure and there is little or no historical data or there is limited evidence of how the measure will be calculated, it may not be appropriate to have a financial incentive.
The remainder of this section presents our proposed reputational incentives. Section 3 below covers the financial incentives.
2.2. Reputational ODIs overview
Reputational ODIs have been applied to 19 of the 47 PCs. They are listed in Table 2 below, which also explains why they were not considered suitable for a financial ODI.

PR19 Business Plan Supporting Information Page 6 of 65
PR19 Outcome Delivery Incentives
MOS Reason for Reputational ODIs Water Process unplanned outages
Unplanned outages is a new measure and the lack of historical data would make it difficult to calibrate appropriate outcome delivery incentives.
Water Catchments Improved
This is a new measure and there is limited evidence on how the safeguard zones will be judged therefore making it difficult to set robust outcome delivery incentives.
Per Capita Consumption Although this is a common measure that Ofwat has required all companies to adopt, our understanding is that a wide range of methodologies for estimating per capita consumption are in use. We do not think it would be appropriate to apply financial incentives at this time to a measure that is likely to be subject to re-definition over the course of the next few years. Customers thought it was important for us to monitor consumption, measure supply/demand and ensure futures supply for everyone. However, customers disliked financial incentives on per capita consumption as this is ultimately about customer choice and they felt this would be counter intuitive with customers paying more for using less.
Vulnerable customers on priority services register
Keeping the Priority Services Register up to date is a basic provision of our services. The important thing is that the entries are accurate, so it does not lend itself to financial incentives to encourage us to achieve numbers that are any higher or lower. This is in line with our ODI customer research.
Customers on Welsh Language register
Success on this measure will feed into C-Mex and our Customer Trust performance measures, for which significant financial incentives are already in place. In addition, it is not a measure for which industry benchmarks exist.
Worst served customers for water services
We are not proposing a general financial incentive for the worst served customers as we are proposing direct compensation to those affected instead through our ‘WaterFair’ initiative. It would not be appropriate to adjust bills across the whole of the customer base because of our successes and failures on this measure.
Worse served customers for wastewater services
We are not proposing a general financial incentive for the worst served customers as we are proposing direct compensation to those affected instead through our ‘WaterFair’ initiative. It would not be appropriate to adjust bills across the whole of the customer base because of our successes and failures on this measure.
Change in average household bill
As all outperformance and underperformance payments have an impact on the average household bill, having a financial incentive for the average household bill would be circular.
Vulnerable customers on social tariffs
The assistance tariffs are partly funded by the company through revenue sacrifice. It would be perverse to have outperformance payments for over-achieving the take-up of social tariffs, as this would mean taking back part of what we are aiming to give away.
Company level bad debt There is a financial incentive implicit within the reduction of bad debt, so it is not necessary to have a financial outperformance payment or underperformance payment.
Unbilled properties There is a financial incentive implicit in billing unbilled properties as any additional revenue can be used to lower the average bill to other customers.
Table 2: Reputational ODIs

PR19 Business Plan Supporting Information Page 7 of 65
PR19 Outcome Delivery Incentives
2.3 Reporting Reputational ODIs
Reputational ODIs are reported within our Annual Performance Report and Accounts which is published for customers and a wide range of key stakeholders, including Ofwat and our CCG.
To increase the effect of reputational PCs, performance will be reported against target, past performance and, where possible, our performance will be reported alongside industry data. In particular, contextual information will be available for per capita consumption, risk of severe restrictions in drought, risk of sewer flooding in a storm and asset health unplanned outage as these form part of Ofwat’s 14 common performance commitments for PR19. Useful benchmarking information is also available from the Drinking Water Inspector (DWI) for ERI.
We will look for additional ways in which we can bring our performance on reputational ODIs to the attention of stakeholders, investors and customers. In particular, we would support an initiative to publish the results of these measures on Discover Water.
MOS Reason for Reputational ODIs
Financial Resilience There is a financial incentive implicit in improving the company’s credit rating, so it is not necessary to have a financial outperformance payment or underperformance payment.
Risk of severe restrictions in a drought
Risk of severe restrictions in drought is a new measure and the lack of historical data makes it difficult to set robust outcome delivery incentives.
Risk of sewer flooding in a severe storms
Risk of sewer flooding in a severe storm is a new measure and the lack of historical data makes it difficult to set robust outcome delivery incentives.
Energy self-sufficiency There is a financial incentive in generating electricity and gas through the reduction in power costs, therefore it is not appropriate to have a financial outperformance payment or underperformance payment.
Reportable injuries Health and safety is our number one priority. This is a supporting measure and it does not have a direct impact on customers so a financial incentive would not be appropriate.
Staff training and expertise Staff training and expertise is a supporting measure to enable business improvement. Performance will therefore manifest itself in how we do on all the other measures, including those for which we already have financial incentives. Since staff training and expertise does not directly affect customers, a financial incentive of its own would not be appropriate.
Employee Engagement Employee engagement is a supporting measure to facilitate business improvement, and as such performance will manifest itself in how we do on all the other measures, including those for which we already have financial incentives. Since employee engagement does not directly affect customers, a financial incentive of its own would not be appropriate.
Event Risk Index (ERI) ERI is a new measure and the lack of historical data makes it difficult to set robust outcome delivery incentives.

PR19 Business Plan Supporting Information Page 8 of 65
PR19 Outcome Delivery Incentives 3. Financial ODIs
3.1. Overview and Approach to Calibration
Our approach to financial incentives for the remaining 28 ODIs that fall into this group is based on the following key principles:
• Categorisation- we have categorised them into three bands, to each of which we have assigned a level of financial incentives.
• Symmetry - our default position is to have financial incentives for both outperformance and underperformance, except where there are compelling reasons to do otherwise.
• Balance- The total outperformance payments and underperformance payments for an individual measure should be balanced.
The application of each of these principles is explored below.
Categorisation
The financial ODIs have been categorised into one of three bands, based on what customers told us were their priorities. This categorisation allowed for a simple and transparent approach to setting financial incentives that was easy for customers to understand. We did consider a more nuanced approach, but judged that this created a risk of confusing some participants and producing spurious results. By applying the same total potential financial incentive for the ODIs placed in the same band, we have applied an equal weight to the performance measures for which customers’ valuations are similar.
Symmetry
Our default position is that there are financial incentives on both outperformance and underperformance. However, six of our ODIs are underperformance payments only, the reasons being as follows:
• Tap Water Quality Compliance Risk Index, Water and wastewater treatment works compliance, Bioresources disposal compliance, wastewater treatment works ‘look-up’ compliance- the target values for these measures is 100% compliance, therefore underperformance payments only are appropriate.
• Mains Burst and Sewer Collapses- These measures are asset health measures: our target is for stable performance, which is considered optimal, therefore it is not appropriate to have outperformance payments for deviations from the targets.
Balance
For the ODIs where symmetry is applied, there should be a degree of balance between the financial incentives for outperformance and underperformance. In this way, the value at stake is the same for both outperformance and underperformance which ensures that the company is no more focused on avoiding the risk of underperformance than achieving outperformance, and vice versa.

PR19 Business Plan Supporting Information Page 9 of 65
PR19 Outcome Delivery Incentives Our approach to the calibration of the ODIs for the 28 measures is set out in the remainder of this section. However, it is helpful to provide a summary of the principal elements of the methodology:
1. Measures were grouped into categories of importance, based on customer research.
2. Willingness-to-pay and other techniques were used to provide estimates of the incremental benefit to customers of different service levels for a number of measures.
3. Outperformance and underperformance rates were calculated by combining
incremental benefit information with incremental cost and other information.
4. Meanwhile, statistical analysis and management judgement was used to estimate the “P10 and P90” ranges for each performance commitment.
5. The rates calculated in step 3 were applied to these ranges to produce total
potential outperformance and underperformance values for each measure.
6. The range of results for the measures in each category were examined, and judgement was applied to select an appropriate common aggregate “value at risk” amount to be applied to all the measures in that category.
3.2 Categorisation of ODIs
To understand the relative importance to customers of each of our performance measures, we engaged customers through both the ODI research itself and the “Phase 1 Triangulation” work, further information is in 1.1G PR19 Customer Engagement- ODI research and 1.1J PR19 Customer Engagement- Phase 1 triangulation of priorities. Customers were asked which of our performance measures they regarded as low, medium and high priority.
We took the results of these research exercises and placed each of the ODIs into one of 3 bands. Given its paramount and unique performance, we assigned Customer Trust to its own “Band Zero”, as outlined in section 3.11.
Table 3 presents these results, using the following key: 1= high priority, 2= medium priority, 3= low priority. The fourth column shows the categories to which we have assigned each performance measure. Where the results from the two sources are consistent, we have adopted the result. Where there is a difference we have used our judgement, and the rationale for our choice is provided in the final column. Similarly, where our decision is different from the result implied by the research, we have explained our thinking, with reference to other survey findings, such as from qualitative research.

PR19 Business Plan Supporting Information Page 10 of 65
PR19 Outcome Delivery Incentives
MOS ODI Research Triangulation
ODI Category 1-3: Our Decision Rationale
Tap Water Quality Compliance Risk Index (CRI) 1 1 1
Water Supply Interruptions 1 1 1
Pollution Incidents from Wastewater 1 1 1
Leakage 2 1 1
ODI research placed leakage as “medium” whilst the triangulation is high. Leakage is a “high” priority for both customer and the company.
Sewer Flooding on customer property (internal) 1 1 1
Total Complaints 2 2 2
Acceptability of Drinking Water 2
2
Sewer Flooding on customer property (External) 2
3
Customers viewed external sewer flooding as a medium priority in the ODI customer research. As Ofwat has indicated the ODIs should be calibrated for any overlap between PCs. As a result of the high correlation and overlap between internal and external sewer flooding this has been assigned into category 3.
Asset Resilience (Water Resources) 2 2
Asset Resilience Water (Network+ above ground) 2 2
Asset Resilience Water (Network+ below ground) 2 2
Asset Resilience Waste (Network+ above ground) 2 2
Asset Resilience Waste (Network+ below ground) 2 2
Wastewater Treatment Works ‘look-up table’ compliance 2
Wastewater Treatment Works compliance is one of our statutory obligations measured by the NRW. The triangulation of
Table 3: ODI Categorisation

PR19 Business Plan Supporting Information Page 11 of 65
PR19 Outcome Delivery Incentives
MOS ODI Research Triangulation
ODI Category 1-3: Our Decision Rationale
customer priorities placed the environment as a medium level priority.
Community Education 3 2 3 Given the ODI research and triangulation we consider level 3 is appropriate as we have two separate measures for education and recreational facilities. Visitors to recreational facilities 3 1 3
Bioresources Product Quality 3 3
Bioresources Disposal Compliance 3 3
Business Customer Satisfaction 2 3
Although this was categorised as a medium priority in the Triangulation Research, it is only applicable to a subset of our customer base, so we have chosen category 3 reflecting the proportion of business customers relative to household customers.
Surface Water Removed from Sewers 3
The removal of surface water from the sewers is a solution technique to reduce sewer flooding and pollution incidents. Notwithstanding that they are both of high importance, given the overlap between those measures and this one we have categorised this as level 3.
Km of river improved 2 2
Lead Pipe Replacement 3
Lead pipe replacement is a high priority for the DWI and The Welsh Government. This was covered in our Welsh Water 2050 customer research and our proposed ranking is consistent with customers’ priorities.
Water Mains Burst 2 3
Customers assessed asset health as medium importance, however customers also identified that there was a significant degree of overlap with Category 1
Sewer Collapses 2 3
Table 3: ODI Categorisation

PR19 Business Plan Supporting Information Page 12 of 65
PR19 Outcome Delivery Incentives
MOS ODI Research Triangulation
ODI Category 1-3: Our Decision Rationale
Water and Wastewater treatment works compliance 2 3
measures, so we have lowered it to category 3.
Customer Trust 2 0* Customer trust is our flagship measure. For further detail see section 3.11.
3.3 Financial Incentives
This section outlines our approach to determining the appropriate level of financial incentives for each of the three main financial ODI categories.
Willingness to pay research has been undertaken by Accent and PJM economics to explore customer’s Willingness to Pay (WTP) for a range of possible service level changes. Details of the research can be found in 1.1A PR19 Customer Engagement- WTP. Separate MOS research was also undertaken that explored customers’ willingness to pay. This research was used to inform the range of incentive payment rates. Details of the research can be found in 1.1F PR19 Customer Engagement- Performance Targets quantitative research
The total financial incentive for each performance commitment is calculated by combining the incentive payment rates and the P10 and P90 performance ranges. The P10 level is the point at which there is a 10% probability of performance being worse, and the P90 level is the point at which there is a 10% probability of performance being better than the target. The total financial incentive spans the range between these points because we have applied caps and collars on our financial incentives at these levels, as described in section 6.2.1.
The following sections explain how we derived values for the P10 and P90 levels of performance.
3.3.1 P10 and P90
Stretching targets have been set for each measure of success. If performance falls short or exceeds these targets the company incurs financial outperformance or underperformance payments. To understand the likely range of these payments it is important to understand the potential probability distribution of future performance.
Figure 2 is an illustration of a normal distribution with the P50, P90 and P10 identified. The P50 is the median outcome which is set to be our target level of performance in each year. The P10 and P90 are determined through statistical analysis of company data and/or management judgement, as described below.
Table 3: ODI Categorisation

PR19 Business Plan Supporting Information Page 13 of 65
PR19 Outcome Delivery Incentives
Monthly Data
To generate a probability distribution of possible performance in each year, and in particular to capture the intrinsic variability in each measure, we undertook simulations using historical monthly performance data for the company. The simulations draw from monthly data over several years to create a simulated annual performance level. In this way we derived performance probability distributions for the following measures:
• Customer Minutes Lost;
• Internal Sewer Flooding;
• Pollution Incidents;
• Acceptability of Water;
• Mains Burst;
• Sewer Collapses; and
• External Sewer Flooding.
3.4 Methodology
The probability distribution for each measure was estimated by bootstrapping monthly data as follows.
Step 1: The first step was to obtain an estimate of the distribution for our current level of performance. The monthly data was bootstrapped to create 50,000 simulated annual
Figure 2: Distribution function
P10 P90
P50

PR19 Business Plan Supporting Information Page 14 of 65
PR19 Outcome Delivery Incentives performance levels to create the estimated distribution. The P10, P50 and P90 levels were obtained from the distribution.
Step 2: The estimated P10 and P90 are based on the historical performance. As we continue to improve our level of performance set by our performance commitments the distribution will shift. To reflect the target level of performance the monthly data was then adjusted by the improvement in performance commitment level each year.
Step 3: Simulations were then undertaken on the adjusted data to estimate the forecast distribution for the target performance levels, effectively shifting the probability distribution in line with the targeted improvement in performance. The future P10 and P90 levels were then calculated.
3.5. Results
An example of the results obtained from this exercise is set out below for external sewer flooding.
3.5.1. Sewer Flooding on Customer Property (External)
The P10 and P90 for external sewer flooding is calculated using monthly data from April 2012 to June 2018. The first step is to estimate the distribution based on the recent historical performance. The average performance over the period was 7,037 incidents per year with an estimated P10 and P90 value of 7,580 and 6,382 respectively (The historical data reports total flooding incidents, the convergence definition reports curtilage only).
Figure 3: Shifted Distribution Function
P10 P90
P50

PR19 Business Plan Supporting Information Page 15 of 65
PR19 Outcome Delivery Incentives The monthly data is adjusted for each year of the price control period to reflect the target level of performance outlined in App1, for example the target value in 2020-21 is 4,057. Once the data is adjusted for the target value the P10 and P90 shift to 4,702 and 3,416 respectively.
The results for the rest of the performance measures are set out in Appendix 2.
3.6. Use of discretion and judgement
To determine appropriate values for P10 and P90 we applied management judgement in conjunction with the statistical analysis for some measures. When estimated the P10 and P90 using monthly data, this analysis does not reflect the true underlying performance as it will reflect any mitigation actions taken, therefore the P10 and P90 range will be different to true underlying performance. Where appropriate management judgement has been applied, for example, acceptability of water. Our target level of performance for acceptability of water in 2024-25 is 2 contacts per 1,000 population served. The statistical analysis produces a P10 and P90 of 2.5 and 1.5 respectively. Given the level of stretch that is already built into the target, we judged that the probability of achieving a performance of 2.5 or above was considerably higher than 10 percent. Our judgement, taking into account our past performance, is that the P10 is more likely to be at 3. To ensure an appropriate level of balance between the P10 and P90, the P90 has been subsequently widened reflecting the increase in the P10, therefore maximum outperformance payments will only be achieved at a significantly stretching level.
In addition, where historical data that could reasonably be expected to shed light on future performance variability is not available, we used management judgement to inform the P10 and P90 values. For example, for Ft4 – “Surface Water Removed from Sewers” we judged that P10 and P90 could reasonably be expected to lie 8,000 roof equivalents either side of the end period target of 55,000, and applied these percentage deviations to each of the four previous years. Where management judgement has been applied this has been made explicit for each ODI in Appendix 2.
3.6.1 Outperformance and underperformance rates
The provisional total financial incentive for each measure was calculated by combining the P10 and P90 with the outperformance and underperformance rate. The outperformance and underperformance rates are calculated following Ofwat’s formula in figure 4.

PR19 Business Plan Supporting Information Page 16 of 65
PR19 Outcome Delivery Incentives
The incentive rates are calculated in 5.5.1 PR19 Outcome Delivery Incentives- ODI Payment Incentive Rates and 5.2.2- Delivering outcomes for customers Appendix 2. As noted earlier, the incremental benefit is calculated using the results from our WTP and MOS research. The WTP undertaken by PJM economics and Accent explored customers’ WTP for a range of possible service levels.
The MOS research explored customer valuation across a wide range of measures within the context of the impact on the bill of improved performance, the historical level of performance and comparisons with other companies’ performance and it allowed for trading off of improvements across measured with a fixed bill profile. Further information is available in 1.1F PR19 Customer Engagement- Performance Targets quantitative research.
The WTP research used a combination of techniques including MaxDiff and a ‘package’ exercise containing questions requiring participants to trade off packages of service change and bill changes. Further information is available in 1.1A PR19 Customer Engagement- WTP.
Figure 4: Ofwat’s incentive payment rate methodology

PR19 Business Plan Supporting Information Page 17 of 65
PR19 Outcome Delivery Incentives Incremental costs were calculated using one-off costs and on-going costs, which are the same as the cost benefit analysis used in setting the MOS targets. The costs are forecast efficient cost for providing the level of service. The costs are derived by using current cost information and applying a percentage adjustment to reflect the extent of efficiencies that can be made in delivery, reflecting engineering judgement. The on-going costs are assumed to be 1% of the one-off capital costs. The one off capital costs were annualised using assumptions for assets lives and discount rates, further details available in 5.2.2- Delivering outcomes for customers Appendix 2 and 5.5.1- PR19 Outcome Delivery Incentives- ODI Payment Incentive Rates. The combination of the incremental benefits, incremental costs and the sharing rates as outlined in figure 4 produce an indicative outperformance and underperformance rate.
The ODI research was undertaken for 8 of our measures. The table below provides a summary of the results for both the underperformance and outperformance payment rates for both the MOS research, WTP research and the average of the two. The table highlights that the research can provide a range of results and therefore we are cautious not to rely on one piece of research.

PR19 Business Plan Supporting Information Page 18 of 65
PR19 Outcome Delivery Incentives
Underperformance Payment Incentive Rates
(£m per Measurement Unit; 2017-18 CPIH)
Outperformance Payment Incentive Rates
(£m per Measurement Unit; 2017-18 CPIH)
Category MOS Research Average WTP Research MOS Research Average WTP Research
Water Supply Interruptions
(£ per Minute lost) 1 £159,130 £766,890 £1,374,650 £159,130 £766,890 £1,374,650
Leakage
(£ per Ml/D) 1 £41,033 £411,317 £956,445 £41,033 £313,597 £586,161
Pollution Incidents
(£ per incident) 1 £55,661 £69,377 £82,962 £55,661 £69,311 £82,962
Internal Sewer Flooding
(£ per incident) 1 £5,630 £8,948 £12,266 £5,630 £8,948 £12,266
Water Acceptability
(£ per contacts per
1,000 population) 2 £3,076,930 £2,469,970 £1,863,011 £3,076,930 £2,469,970 £1,863,011
River Water Quality
(£ per km improved) 3 £1,146 £18,933 £36,720 £1,146 £18,933 £36,720
External Sewer Flooding
(£ per incident) 3 £1,530 £2,174 £2,818 £1,530 £2,174 £2,818
Rainscape
(£ per roof equivalent) 3 £12 £12 £12 £12
Table 4: Payment Incentive Rates Research

PR19 Business Plan Supporting Information Page 19 of 65
PR19 Outcome Delivery Incentives 3.7 Total Financial Incentives
The total outperformance and underperformance potential payments are calculated by combining the estimated P10 to P90 ranges with the results for rates. Underperformance and outperformance rates have been calculated for 8 performance commitments. The results from the WTP data have been extrapolated to determine the outperformance and underperformance payments for each of our three ODI categories.
Table 5 provides the total underperformance and outperformance payments for the 8 ODIs for the 5 years. This table indicates that the range of financial incentives is considerably wide, for example water supply interruptions varies from £7m to £60m over the five years for underperformance payments.
The results for these measures have been extrapolated to determine the level of financial incentives for each of our three ODI categories. Table 6 provides a summary of the range of WTP outperformance and underperformance payments for each category. As the table shows, the range of WTP outperformance and underperformance payments for each category is wide. Given the range of WTP and the ranking of customer priorities, we have exercised our judgement in selecting an appropriate value within these ranges for the proposed level of financial incentives. The final column presents our choices for the total ODI over performance and underperformance payments at the P10 and P90 levels.
Category MOS Average WTP MOS Average WTPWater supply interruptions 1 7 34 60 3 15 27Leakage 1 1 10 24 1 6 12Pollution incidents 1 10 13 15 9 11 14Internal sewer flooding 1 2 3 4 2 3 4Water acceptability 2 20 16 12 15 12 9River water quality 2 0 1 2 0 1 2External sewer flooding 3 5 7 9 5 7 9Rainscape 3 0 0 0 0 0 0
Total Underperformance Payment (£m) Total Outperformance Payment (£m)
Table 5: Total underperformance and outperformance payments ranges

PR19 Business Plan Supporting Information Page 20 of 65
PR19 Outcome Delivery Incentives
Category 1-3 Range for WTP Outperformance
Payments
Range for WTP Underperformance
Payments
ODI
Over/Underperformance Payments
1 £1m- £27m £1m- £60m
£25m
2 £0m-15m £0m- £20m
£13m
3 £0m- 9m £0m- £9m
£7m
3.8 Rates
Having decided on the level of outperformance payments and underperformance payments for each category, the rates are inferred by the P10 and P90. Having arrived at our results we have cross checked them against a range of evidence, including the WTP research for PR19 and the rates from PR14.
Given the limitations of the WTP research, as highlighted by Ofwat and the wide ranges of results derived from our WTP and MOS research the rates have not been directly applied. The MOS and WTP research has been used to inform the total financial incentive per category and the rates have been calculated using the P10 and P90. This approach is beneficial as willingness to pay was not examined for each measure. This approach allows for performance commitments that customer’s value with the same level of priority to have the same level of financial incentives.
3.9 Deadbands
Deadbands are zones of performance close to the performance commitment level, for which no financial ODI applies, even though the performance commitment has a financial ODI. Our customer research revealed that the majority of customers did not support deadbands as they felt that this shifts the target. A minority did accepted deadbands, citing the fact that “occasionally things to wrong that are outside of our control (such as, extreme weather events)”.
The use of deadbands is discouraged. However, Ofwat recognise that for CRI, as it is a new measure and it is intended to be a more demanding measure that companies can take this into account when proposing penalty deadbands.
Underperformance deadbands have been proposed for the following measures:
• Compliance Risk Index (CRI);
• Water and Wastewater Treatment Works Compliance;
Table 6: Total underperformance and outperformance payments

PR19 Business Plan Supporting Information Page 21 of 65
PR19 Outcome Delivery Incentives • Wastewater treatment works ‘look-up; compliance; and
• Business Customer Satisfaction
Deadbands have been proposed for the first three measures at their target is 100% compliance. Whilst we strive towards 100% compliance, we acknowledge that this is not generally achievable in practice. The deadbands have been set at a sufficiently stretching level. The deadband for CRI is set at the level of performance experienced by the top third of customers. For the two treatment works compliance PCs the level of based on a number of treatment work fails which is based on historical performance and management judgement.
A deadband has been introduced for Business Customer Satisfaction due to the level of ambition in our target. Our target level is to achieve a score of 4.5 out of 5 and the proposed deadband is 4.4. Our past performance has been in the range of 4.3 to 4.5. A deadband has been introduced as our performance on business customer satisfaction is industry-leading. CCWater’s NPS score reported in their “Testing the Waters” report has put us top of the water and sewerage companies. Whilst we will face reputational incentives for performance under this level it is not deemed appropriate to incur financial underperformance payments until the performance is below 4.4. Further information on these measures are included in Appendix 2.
3.10 Customer Trust
Our flagship ODI is customer trust, measured by CCWater. As noted above, we have put this in a category of its own. The total amount of outperformance payments and underperformance payments is set at £32m over the 5 years. The maximum financial payment is in line with Ofwat’s maximum outperformance and underperformance payment for their customer experience measure C-Mex.
3.11 Enhanced outperformance and underperformance payments
Ofwat indicated that companies could introduce enhanced outperformance and underperformance rates to incentivise a step change in performance. Enhanced rates would only be appropriate for the common measures and for performance that is industry-leading. Ofwat also noted that where enhanced outperformance payment rates are proposed, there must also be underperformance payment rates for below-standard performance.
Careful consideration has been given to the possibility of enhanced outperformance and underperformance payments for those measures where we are industry leading. On balance we concluded that we would not have enhanced outperformance or underperformance payments. This decision was influenced by the following considerations, in particular:
• Our customer engagement revealed that generally customers understand the principle of outperformance and underperformance payments as an effective way of incentivising businesses. For all customers our ‘not for profit’ model adds an additional layer of complexity and many participants questioned the relevance of outperformance payments and underperformance payments for our organisation;
• In the context of our proposed WaterShare mechanism, under which we will only claim 50% of any net outperformance payments, we did not consider it appropriate to set enhanced outperformance payments.

PR19 Business Plan Supporting Information Page 22 of 65
PR19 Outcome Delivery Incentives 3.12 Asset Health
Within the overall suite of ODIs for our 47 performance measures, particular attention has been paid to the 8 that fall within the “asset health” umbrella. Customers viewed asset health as a critically important and fundamental responsibility for us. These have been developed using the general methodological approach outlined above, but with specific attention to certain points, namely:
• we have used a broad range of customer research techniques to inform target levels and ODIs for these 8 measures;
• on all 8 measures we are performing within the bounds of historical commitments as outlined in our APR;
• targets have been set at levels that are at or better than what has been achieved in the past so that, in general, any deterioration below historical levels attracts underperformance payments; and
• On the whole customers thought that there should not be outperformance payments on asset health. Outperformance payments have only been proposed for two measures, Acceptability of Water and Sewer flooding, which have a direct impact on customers and where we have evidence that customers are willing to pay for higher performance.
Each of the 8 measures is covered in detail in the “at-a-glance” reference sheets in the Appendix 2. A summary of the 8 measures and the ODIs that have been assigned to each is presented below.
Measure Outperformance payment
Underperformance payment
Water mains bursts x
Water process unplanned outages x x
Tap water quality Event Risk Index x x
Acceptability of drinking water
Sewer collapses x
Water and Wastewater Treatment works compliance x
Wastewater Treatment works ‘look-up’ table compliance
x
Sewer flooding on customer property (external)
Table 7: Asset Health ODI Overview

PR19 Business Plan Supporting Information Page 23 of 65
PR19 Outcome Delivery Incentives Finally, we have calculated our potential asset health underperformance payments as a percentage of RoRE. This is shown in section 3.12 below.
3.12 Summary of our Suite of financial ODIs
By way of conclusion to this section, all our financial ODIs are presented in table 8. This provides an overview of the financial incentives for each of the 3 categories of ODIs and customer trust.
Performance Commitment Maximum (Over 5 years)
Underperformance
Payment (£m) Outperformance
Payment (£m) Customer Trust 32 32 Tap Water Quality Compliance Risk Index 25 - Water Supply Interruptions 25 25 Leakage 25 25 Sewer Flooding on Customer Property (Internal) 25 25 Pollution Incidents from Wastewater 25 25 Acceptability of Drinking Water 13 13 Wastewater Treatment Works 'look-up' Table Compliance 13 - Km of River Improved 13 13 Total Complaints 13 13 Asset Resilience (Reservoirs) 13 13 Asset Resilience (Water Network+ Above Ground) 13 13 Asset Resilience (Water Network+ Below Ground) 13 13 Asset Resilience (Waste Network+ Above Ground) 13 13 Asset Resilience (Waste Network+ Below Ground) 13 13 Water Mains Burst 7 - Sewer Collapses 7 - Water and Wastewater Treatment Works Compliance 7 - Sewer Flooding on Customer Property (External) 7 7 Business Customer Satisfaction 7 7 Visitors to Recreational Facilities 7 7 Community Education 7 7 Surface Water Removed from Sewers 7 7 Bioresources Product Quality 7 7 Bioresources Disposal Compliance 7 - Lead Supply Pipes Replaced 7 7 2017-18 Prices 351 285
Table 8: Suite of ODIs

PR19 Business Plan Supporting Information Page 24 of 65
PR19 Outcome Delivery Incentives
Asset Health Incentives
The asset health ODI incentives are shown as a percentage of the regulatory equity to allow for comparability been companies. The underperformance payments are equal to 0.45% of the regulatory equity over the 5 years.
Underperformance Payments over 5 years (£m)
Underperformance Payments (% of Regulatory Equity)
Acceptability of drinking water 13 0.11% Water Wastewater Treatment Works 'look-up' table compliance
13 0.11%
Sewer Collapses 7 0.06% Wastewater Treatment Works Compliance 7 0.06%
Sewer Flooding on Customer Property (External) 7 0.06%
Water Mains Burst 7 0.06% Total 54 0.45%
4 RoRE Range
The RoRE range expresses the potential range of outperformance and underperformance payments as a percentage of the regulatory equity at the notional gearing level. The potential payments are examined at P10 and P90, a 10 percentage probability of performance being higher or lower than the target performance.
Ofwat has indicated an expectation that the range of ODI outperformance payments and underperformance payments will be in the range of +/-1% to +/- 3% of RoRE.
4.1 Calculation of the RoRE Range
The table below provides an overview of the maximum underperformance and outperformance payments that could be achieve per year for each financial ODI. To ensure that customers are protected from the effects of large payments we have capped the maximum outperformance and underperformance payments at the P10 and P90 levels for each measure, (see section 6.2.1 for more detail).
If performance on all of the measures reached the P10 level simultaneously the maximum underperformance payment would be £70.2m per year (£351m over the AMP) which equates on average to 2.9% of Regulatory Equity. Similarly if performance on all of the measures reached the P90 level simultaneously the maximum outperformance payment would be £57m per year (£285 over the AMP) which equates on average to 2.3% of Regulatory Equity.
Table 9: Asset Health as a percentage of Regulatory Equity

PR19 Business Plan Supporting Information Page 25 of 65
PR19 Outcome Delivery Incentives
Outperformance Underperformance Total Financial Incentive per annum (£m) (70) 57 AMP Average Regulatory Equity (£m) 2,421 2,421 Total Financial Incentive (% of RoRE) (2.9%) 2.3%
The probability of achieving P10 or P90 levels on all the performance measures simultaneously is extremely small. Therefore, to provide a realistic view of the scale of potential outperformance and underperformance at overall P10 and P90 levels an understanding of the distribution of probabilities across the whole business is required. We estimated this distribution by applying Monte Carlo simulation analysis of the individual financial ODI distributions. This technique draws on each of the individual ODI distributions to obtain an overall estimate of total incentive payments. Simulations are carried out 50,000 times to obtain an estimate of the distribution of overall outperformance and underperformance payments.
4.2 Distributions of each measure
The Monte Carlo simulation analysis requires an understanding of the position and shape of the distribution for each ODI. As outlined in section 3.3.1, the P10 and P90 levels for each measure have been determined either through the fitting of historical company performance data or management judgement. For those measures where monthly data is available the distribution of the data has been estimated through bootstrap analysis: the detailed methodology and results are shown in section 3.3.1.
Where monthly data is not available the P10 and P90 levels have been estimated using informed management judgement. Due to the limited availability of statistical information for these measures a triangle-shaped distribution has been assumed. This requires specification of the following:
• the minimum value;
• the maximum value; and
• the most likely value.
The most likely value for each ODI is considered to be the performance target. The minimum and maximum values are back-solved to achieve the estimated P10 and P90 values.
Example: Educational Activities
The table below outlines the key data for the financial ODI for Educational Activities for 2024-25, including the target and the P10 and P90 levels. The graph depicts the triangular distribution that is implied by the maximum and minimum values that achieve the estimated P10 and P90 levels.
Table 10: Maximum RoRE

PR19 Business Plan Supporting Information Page 26 of 65
PR19 Outcome Delivery Incentives
Education Visitors Target 75,000 P10 45,000 P90 105,000 Minimum Value 22,000 Maximum Value 128,000
4.3 Correlations
As noted above, the probability of performance being at the P10 or P90 level simultaneously for all measures is extremely small. Conversely, however, performance on each individual measure cannot be assumed to be totally independent of performance on all other measures, because performance on some measures does influence performance on others. For example there is a correlation between external and internal sewer flooding: if there is a comparatively high number of external sewer flooding incidents, there is a higher probability that some customers will experience internal sewer flooding, all else equal.
There are two ways in which such correlations could be accommodated within the simulation exercise:
• Rule of thumb
• Correlations matrix
Table 11: Education Activities Target, P10 and P90 for 2024-25
Figure 4: Education Activities Distribution

PR19 Business Plan Supporting Information Page 27 of 65
PR19 Outcome Delivery Incentives Rule of Thumb
Rules of thumb can be applied to the probability distributions so that if performance on one PC is in a given part of the distribution the performance of another PC has to be within a given part of its distribution. For example if the performance of internal sewer flooding in the bottom 30th percentile of its distribution then external sewer flooding might be expected to be in the bottom 30th percentile of its performance. The application of such rules of thumb avoids the situation where one PC is in the bottom 10% and incurring large underperformance payments, whilst another correlated PC is in the top 10% and earning large outperformance payments.
Correlation matrix
Alternatively, correlations between PCs could be incorporated within the analysis through the estimation of a correlation matrix.
For the purposes of this exercise, a rule of thumb approach was taken to incorporate correlations between the variables into the simulation analysis. This approach was preferred due to its comparative ease and flexibility. In particular, it enables relatively lax rules on the relationships between performance measures to be incorporated. It also allows for rules of thumb to be incorporated where there is a strong prior expectation regarding the relationship between variables, but also allows for variables to be independent where there is no strong expected relationship.
We did test the use of a correlation matrix in the course of our preparations for the Business Plan, but we found that it generated spurious results due to the presence of cross-correlation relationships. As a result of the complex relationship between different factors of performance the correlation matrix is not self-consistent.
We therefore went ahead and prepared a set of rules of thumb on the possible correlation between different measures. Table 12 presents an overview of the correlations that were assumed in the analysis. The rule of thumb is that if the performance of one PC is in the top or bottom 30th percentile then the correlated PC will be in the corresponding top or bottom 30th percentile respectively. Sensitivity analysis on this rule of thumb has been undertaken as is outlined in section 7.1.

PR19 Business Plan Supporting Information Page 28 of 65
PR19 Outcome Delivery Incentives
PC 1 PC 2 Rule of Thumb CRI ERI If CRI>P70 , ERI>P70
If CRI<P30, ERI< P30 CML Leakage If CML>P70, Leakage>P70
If CML<P30, Leakage< P30 CML Mains Burst If CML>P70, Bursts>P70
If CML<P30, Bursts< P30 Internal Sewer Flooding
Pollution Incidents
If Sewer Flooding>P70, Pollution>P70 If Sewer Flooding L<P30, Pollution < P30
Pollution Incidents
WWTW Compliance
If Pollution> P70, WWTW Compliance >P70 If Pollution><P30, WWTW Compliance <P30
WWTW Compliance
WTW and WWTW Compliance
If WWTW Compliance > P70, WTW and WWTW Compliance >P70 If WWTW Compliance <P30, WTW and WWTW Compliance <P30
Internal Sewer Flooding
External Sewer Flooding
If Internal Sewer Flooding>P70, External Sewer Flooding>P70 If Internal Sewer Flooding L<P30, External Sewer Flooding < P30
Internal Sewer Flooding and CML
Total Complaints If Internal Sewer Flooding and CML> P70, Complaints >P70 If Internal Sewer Flooding and CML<P30, Complaints <P30
Total Complaints Customer Trust If Complaints >P70, Customer Trust>P70 If Complaints<P30, Customer Trust<P30
Customer Trust Business Customer Trust
If Customer Trust >P70, Business Customer Trust>P70 If Customer Trust<P30, Business Customer Trust<P30
The results of the application of these constraints in our simulation modelling are presented in section 7 below.
5 Timing and payment of ODI Payments
5.1 In-period ODIs
Ofwat has indicated that it expects ODIs to be applied in-period as the default. This brings the outperformance and underperformance payments closer in line with the performance experienced. All of our ODIs are in-period with the exception of kilometres of rivers improved. This is an end-of-period ODI as the measurement of this performance level is cumulative and the phasing of this ODI is likely to change as a result of ongoing consultations with our regulators. In particular, we note that the final version of the NEP, which will have a significant bearing on the timing of our performance on this measures, will not be published until 2021.
5.2 Revenue ODIs
The outperformance payments and underperformance payments for both in-period and end of period ODIs are revenue adjustments. Revenue adjustments bring the outperformance and underperformance payments closer to the performance generated compared to RCV adjustments. This is consistent with our approach at PR14 and Ofwat’s expectations.
Table 12: ODI Correlations

PR19 Business Plan Supporting Information Page 29 of 65
PR19 Outcome Delivery Incentives 6 Customer Protection
6.1 Range of ODI Payments
The probability distributions that we have estimated also generate values for maximum possible outperformance and underperformance payments at the extremes. The table below presents values for total financial payments at the 10% probability and maximum levels from the Monte Carlo simulations. The table shows that there are substantial outperformance and underperformance payments that could be achieved at the tail of the distribution in the absence of caps and collars. The current distributions are based on recent historical performance, which provides a realistic view of the P10, P90, minimum and maximum levels, but it only examines data for a relatively short period of time. It is possible that there could be significant events albeit with low probability that have not been experienced in recent history which could widen the distribution and therefore raise the potential outperformance and underperformance payments considerably.
10% Probability Maximum Underperformance Payments (£m) (42.0) (82.2) AMP Average Regulatory Equity (£m) 2,421 2,421 Underperformance Payments (% of RoRE) (1.7%) (3.4%) Outperformance Payments (£m) 33.8 59.4 AMP Average Regulatory Equity (£m) 2,421 2,421 Outperformance Payments (% of RoRE) 1.4% 2.4%
6.2 Customer protection
The understanding of the tails of the overall probability distribution highlights the potential for aggregate outperformance and underperformance payments that are higher than the levels that customers indicated they would support, and are also higher than the indicative RoRE range. This section outlines our proposals on customer protection, including the introduction of caps and collars at the P10 and P90 levels, and the introduction of our WaterShare mechanism.
6.2.1 Caps and Collars
Caps set the maximum level of outperformance payments and collars set the maximum level of underperformance payments. Our customer research on ODIs indicated that there is customer support for caps and collars, first to protect customers from spiralling bills and second to provide protection against the loss of revenue for future investment. We have therefore set the cap and collar for each ODI at its P10 and P90 levels.
Ofwat outlined that the cost of caps and collars is the reduced incentive for companies to improve their performance near and beyond the cap and collar. Our P90s have been set at a sufficiently stretching level of performance, this ensures that the maximum financial incentive is earnt when performance is significantly
Table 12: Understanding the tails of the distribution

PR19 Business Plan Supporting Information Page 30 of 65
PR19 Outcome Delivery Incentives beyond the target level of performance. Overall we have concluded that the cost of caps and collars is outweighed by the benefits of reducing the exposure of extremely high outperformance and underperformance payments.
It should be pointed out, however, that the application of collars does not mean that our incremental liability at performance levels below P10 is zero. In practice, when performance falls to low levels we face a range of potential costs arising because of the regulatory framework within which we operate, including prosecutions, fines, regulatory penalties and customers compensation payments. For example, as a result of ‘Storm Emma’ in March 2018 we exceeded the collar for “minutes lost due to interruptions to supply” thereby incurring the maximum penalty, but we also had to make direct financial compensation payments to customers, which were not limited in any way.
6.2.2 WaterShare
In AMP7 we will introduce a new scheme called ‘WaterShare’- by which 50% of any net outperformance payments over the period will not be ‘claimed’; instead they will be returned directly to customers. The remaining 50% will be set aside in a WaterShare fund. We would then consult with customers, regulators and the CCG before committing any of these funds. These funds will be applied to the benefit of customers, which might involve bill reductions, extra funding for social tariffs or additional service, environmental and resilience-related investment. Any outstanding outperformance payments may be used to offset future underpayment payments.
6.2.3 Bill Volatility
In-period ODIs could result in significant bill volatility. Our charges are managed through an annual process which includes the consideration of incidence effects; the impact of any financial incentives would form part of this consideration. Any decision we make regarding the implementation of the ODIs will be clearly explained in the “Statement of Significant Changes” and accompanying handling strategies which would be developed in conjunction with appropriate consultation with customers and their representatives.

PR19 Business Plan Supporting Information Page 31 of 65
PR19 Outcome Delivery Incentives 7 Results and Impact on Bills
The results from the Monte Carlo simulations produce a RoRE range of 1.5% for underperformance payments and 1.2% for outperformance payments (these are difference to table 12 due to the inclusion of caps and collars).
2020-21 (£m)
2021-22 (£m)
2022-23 (£m)
2023-24 (£m)
2024-25 (£m)
AMP Total (£m)
Underperformance Payments (35.4) (34.4) (34.4) (34.6) (39.3) (178.1) Outperformance Payments 27.9 28.7 28.2 27.3 32.8 144.9 Regulatory Equity 2,296 2,369 2,429 2,483 2,529 12,106 Underperformance (%) (1.5%) (1.5%) (1.4%) (1.4%) (1.6%) (1.5%) Outperformance (%) 1.2% 1.2% 1.2% 1.1% 1.3% 1.2%
7.1 Sensitivity Analysis
Sensitivity analysis has been undertaken to examine the sensitivity of the correlation rules of thumb assumptions on the overall RoRE range. In general, expanding and widening the correlations does not materially change the results. If the correlations are set at P80/P20 or P60/P40 the RoRE range for underperformance payments is 1.4%-1.5% and for outperformance it is 1.1%-1.2%.
7.2 Impact on customers’ bills
We have analysed the potential impact on customers’ bills by examining both the maximum possible increase and decrease in bills and the potential impact on the bill based on the probability of incurring under and outperformance payments.
The maximum increase in bills is £16 per year (£33 before WaterShare) and the maximum reduction in bill is £40 per year. The maximum increase in the bill is where we simultaneously incur maximum outperformance payments at the P90 level on all ODIs. The maximum reduction in the bill is where we simultaneously incur the maximum underperformance payment at the P10 level on all ODIs. The use of caps and collars ensures that the impact does not exceed these values to protect the customers. The maximum increase is lower than the maximum reduction because of the effect of the WaterShare mechanism.
The likelihood of all ODIs achieving their P10 or P90 simultaneously is small. To understand the likely impact of ODIs on customers’ bills we have looked at the results of the Monte Carlo simulation outlined in section 3.3.1. The graph shows the likely bill impact alongside the range of probabilities.
Table 13: Overall RoRE range

PR19 Business Plan Supporting Information Page 32 of 65
PR19 Outcome Delivery Incentives
The graph shows the estimated potential outperformance and underperformance payments alongside its probability. The light blue line shows the bill impact before the impact of WaterShare and the dashed dark blue line shows the impact when WaterShare is accounted for.
The graph shows that at P50 the outcome is a reduction in the bill of £0.40. This result arises because of the presence of underperformance payment only ODIs. At the P10 level the expected impact on customer bills is a reduction of £17. At the P90 the forecast impact on customer bills is an increase £11, which reduces to £6 after the effect of the WaterShare mechanism.
8 Allocation across price controls
App1 of the business plan tables requires that each PC is assigned to at least one price control. For the PCs with associated financial ODIs, the allocation across controls will be used to allocate outperformance payments and underperformance payments. 24 of the 28 financial ODIs (34 of the 47 PCs) are allocated to a single price control and 4 of the ODIs (13 of the PCs) are spread across multiple price controls.
The PCs are allocated to the price controls that directly impact their ability to achieve the target level of performance. For example, CRI is allocated to Water Network plus as water quality is substantially driven by the performance of the water network plus segment of the value chain. Performance for 13 of the PCs is influenced by more than one price control. For example, total complaints are driven by the Water Network plus, Wastewater Network plus and Residential retail price controls.
-20
-15
-10
-5
0
5
10
15
P10 P20 P30 P40 P50 P60 P70 P80 P90
Bil I
mpa
ct (£
)
Potential Bill Impact of Financial Incentives
WaterShareBill Impact
Bill Impact
Figure 5: Potential Bill Impact of Financial Incentives

PR19 Business Plan Supporting Information Page 33 of 65
PR19 Outcome Delivery Incentives For the purposes of allocating ODIs across price controls we have used either proportion of revenue over the 5 year price control period or headcount. Specific allocations for each ODI are presented in Appendix 2 and App1 commentary.

PR19 Business Plan Supporting Information Page 34 of 65
PR19 Outcome Delivery Incentives
Appendix 1: Compliance with Ofwat’s Guidance
Action Our Compliance/Response Companies should propose how they will approach their reputational ODIs. Companies should provide contextual information to increase the impact of their ODIs.
Our approach to reporting reputational ODIs, including providing contextual information to increase their strength is outlined in section 2.3.
Companies should justify, with supporting evidence, whenever a PC is not supported by a financial ODI.
Our default position is that each PC has a financial element. We have assessed whether financial incentives are appropriate against three criteria; implicit financial incentive, supporting measure and new measures. Justification for why any financial ODI is not applied is outlined in section 2.1.
For an ODI outperformance payment to be appropriate, the company must at least:
- Be proposing a stretching PC level so that outperformance payments are for strong outperformance and not for carrying out the “day job”.
- Demonstrate that there are benefits from improved performance; and have customer support for its proposed outperformance payments
We have set stretching PC levels for our MOSs. Further information is available in our supporting document 5.2 Delivering outcomes for customers. We have set outperformance payments based on the customer WTP. Where we have not undertaken WTP we have inferred the benefit with reference to the fact that customers have given equivalent priorities to the measure as they have given to the measure where we have WTP. Our approach is outlined in section 3.
Expect companies to propose approaches to protecting customers in case their ODI payments turn out to be much higher than their expected RoRE ranges for these ODIs. This could involve companies demonstrating their understanding of the tail
Section 6 provides an overview of customer protection. This includes an understanding of the range of financial incentives. Our proposals for customer protection includes the introduction of caps and collars, the introduction of our “WaterShare” and the management of bill volatility.
All the common PCs should have in period ODIs, with the exception of the two resilience common performance commitments (because they are at relatively early stage of development).
In-period ODIs have been applied to the 14 common PCs with the exception of the two resilience common PCs and the following measure:
- Per capital consumption - Unplanned outages

PR19 Business Plan Supporting Information Page 35 of 65
PR19 Outcome Delivery Incentives Action Our Compliance/Response
Section 2.2 outlines the justification for reputational only incentives for these measures.
Companies must set out how they propose to manage bill volatility of the period.
Section 6.2.3 outlines the management of bill volatility. The application of in-period ODIs will be managed through our annual charges process which includes the consideration of incidence effects.
Enhanced out and under performance payments are only appropriate for the common performance commitments which are based on comparable data.
Enhanced outperformance or underperformance payments have not been proposed this is outlined in section 3.11.
Companies should calibrate their ODIs for any overlap between the PCs, if they consider they would involve undue out or under performance payments.
Consideration has been given with regards to the level of overlap between measures within the categorisation. Several ODIs have been placed into one of our lower categories for example the overlap between the asset health measures and “category 1” measures. Further information is in section 3.2.
Where a performance commitment is allocated across more than one price control companies should explain clearly in the business plan commentary how the allocation has been derived.
PCs have been assigned to multiple price controls where the price control has a direct impact on the level of performance. An overview of our approach is outlined in section 8 and further details are in Appendix 2 and App1 commentary.
For water companies operating wholly or mainly in Wales we expect those companies to propose performance commitments for their business retail customers.
We have introduced an ODI for Business Customer Satisfaction. The level of financial incentive is in line with the financial incentives for customer trust, proportional to the number of customers served.
Companies should commit that their ODI payments will only relate to real performance change and not definitional, methodological or data changes in the performance commitment
We have committed that ODI payments will only relate to real performance changes and not definitional, methodological or data changes.
We are suggesting an indicative range for the size of companies’ outperformance and underperformance payments of +/-1% to +/-3%. Expect companies to develop their ODIs in consultation with their customers, and obtain customer support for the overall RoRE range propose in their business plan.
Our RoRE range is 1.5% for underperformance payments and 1.2% for outperformance payments. Our ODI customer research indicated that in general payments should be smaller rather than larger. Our RoRE range is at the lower end of Ofwat’s indicative range. We did not explicitly ask customers of their views on the RoRE range as this is a technical concept which does not lend itself to ordinary customer research.
Companies should set their asset health underperformance penalties using a wide variety of customer research so that they can strengthen their incentives in line with customer preferences.
Our asset health underperformance payments were set on the basis of the priorities that customers told us they attached to these measures. This finding was derived from an extensive range of customer engagement

PR19 Business Plan Supporting Information Page 36 of 65
PR19 Outcome Delivery Incentives Action Our Compliance/Response
including ODI and “Phase 1 Triangulation” research, WTP and MOS research. Further information is in section 3.
Companies should explain to their customers, CCGs and Ofwat how their asset health outperformance and underperformance payments relate to their past performance and the asset health challenges they face.
We have outperformance payments for Acceptability of Water and External Sewer flooding for our asset health measures. These have been proposed as these measures have a direct impact on customers and there is willingness to pay. Our target level of performance is to be stable, if performance deteriorates from this level then we will incur underperformance payments.
Companies should report their proposed asset health underperformance penalties as a percentage of RoRE so that they are comparable across companies.
Our asset health ODIs are equal to 0.45% of Regulatory Equity. Further information is in section 3.12.
Companies can only propose outperformance payments for asset health performance commitments if they can show that there are benefits for customers and their proposals reflect the evidence of customer preferences.
Outperformance payments have been proposed for two asset health measures; Acceptability of Water and External Sewer Flooding. Our research shows that there is WTP beyond our target level of performance and these measures directly impact on customers. Further information is in section 3.13.
Companies that wish to propose deadbands will need to provide strong evidence as to why their proposals are appropriate and in the interest of customers. We provide the example of CRI above where there is a rationale for proposing a deadband.
Deadbands have been proposed for four measures where the target is either full compliance or the target performance is one of the best performing companies. Further information is included in section 3.10
Companies can propose outperformance payments caps and underperformance penalty collar on individual ODIs, if supported by their customer engagement. In doing so, companies will need to consider the cost and benefit of such caps and collars.
Caps and Collars have been introduced for each ODI at the P10 and P90 level. Customers support caps and collars firstly to avoid spiralling bills and secondly to provide protection against the loss of revenue for future investment. Further information is in section 6.2.1.
We are discouraging the use of gated ODIs. No gated ODIs have been proposed. Companies overall RoRE range will be built bottom-up, from individual customer valuation on individual ODIs.
Our RoRE range has been built bottom-up. We estimated total ODI payments at the P10 and P90 level using WTP information for the chosen subset of measures in which we have carried out research. Separately we classified all of the measures that have financial incentives in three categories using a range of customer research. We then set the total incentive payments at the P10 and P90 levels at the same level for all of the measures in each category informed by the range of results we

PR19 Business Plan Supporting Information Page 37 of 65
PR19 Outcome Delivery Incentives Action Our Compliance/Response
obtained for the individual measures to which we have WTP information. Monte Carlo simulations, taking into account the correlation between the measures was used in order to derive the overall RoRE range. Further information is in section 4.
Companies should adopt in-period ODIs as a default for all their ODIs, unless they can justify why an in-period ODI is not appropriate.
All ODI payments are in-period with the exception of km of rivers improved. Km of rivers improved is an end-of-period ODI as it is a cumulative measure and the phasing of the ODI is likely to change as a result on on-going conversations with our regulators. Further information is available in 5.1
We propose that end-of-period ODIs should be linked to revenue, unless companies could justify with evidence, why this should not be the case.
All end-of-period ODIs are linked to revenue. Further information is available in section 5.2.
Setting ODI outperformance and underperformance rates - Companies can base their ODI rates on the existing formula but
amended so that companies can use alternative customer valuations instead of only marginal stated preference WTP.
- Companies can use other customer evidence to propose changes to the ODI outperformance and underperformance rates calculated according to the existing formulas, provided changes are well justified.
- Companies should not propose top-down, calculated
outperformance and underperformance payment rates derived from a pre-setting starting RoRE range or amount of revenue. Companies should use a bottom-up approach which is based on customer evidence
- CCGs will challenge companies on how well their proposed ODI outperformance and underperformance payment rates reflect a suitably wide range of evidence on their customer preference.
Ofwat’s formula was used in the calculation of outperformance and underperformance rates to inform our overall financial incentives, outlined in section 3.7. Two pieces of research are used within the calculation of rates, our WTP and MOS research. Customer prioritisation was used to categorise the ODIs into one of our three categories. The total financial incentives at the P10 and P90 levels are the same for all ODIs in each category. A bottom-up approach based on customer evidence to derive our financial incentives and our RoRE range, this is outlined in section 4. Our approach to ODIs was discussed and challenged by the CCG with reference to our customer research. The financial ODI are calibrated using the 50% totex sharing mechanism.

PR19 Business Plan Supporting Information Page 38 of 65
PR19 Outcome Delivery Incentives Action Our Compliance/Response
- Companies should calibrate their financial ODIs with total expenditure (totex) efficiency sharing and any other incentives that might apply to their performance.

PR19 Business Plan Supporting Information Page 39 of 65
PR19 Outcome Delivery Incentives Appendix 2: Overview of Individual Financial ODIs
Wt1- Tap Water Quality Compliance Risk Index (CRI) Wt1- Tap Water Quality Compliance Risk Index (CR) (Number) 2020-21 2021-22 2022-23 2023-24 2024-25 Target 0 0 0 0 0 Underperformance Deadband
33.3% of Customers
33.3% of Customers
33.3% of Customers
33.3% of Customers
33.3% of Customers
P10 Relative to Deadband
12 12 12 12 12
Underperformance Collar Relative to Deadband
12 12 12 12 12
ODI Operator £m/Unit/year Comment Underperformance Rate (0.416667) Equivalent to £416,667 per unit of the
index below the 33.3%-of-customers deadband.
2017-18 prices
Frequency of measurement and use of averaging Annual Timing of outperformance and underperformance payments
In-Period
Form of financial incentives Revenue Maximum outperformance payment over 5 years N/A Maximum underperformance payment over 5 years £25m (Category 1) Price Control Allocation 100% Water Network Plus
Overview
The target performance for CRI is 0. CRI has a target of zero and it is a new measure therefore a deadband has been introduced. The deadband is set at the level of performance which the top third of customers in England and Wales receive. The P10 and underperformance collar is set at 12 points below the deadband level of performance.
Determining the P10 and P90
The P10 is set at 12 points below the performance that is received by the top third of customers in England and Wales. Historical analysis indicates that over the last two years the deviation from the performance received by the top third of customers and the lowest performance is on average 12 points.
Maximum Standard Underperformance and Outperformance Payments
Column 114 of App1, the maximum standard underperformance payments shows an error. The underperformance deadband for this measure is set at performance received by the top third of customers in the year. The outperformance payment is for each point below this deadband. If the deadband is zero at 0 and the underperformance payments are set for each point below this the table reads:
2021-22 2022-23 2023-24 2024-25 2024-25 Total Maximum standard outperformance penalties (£m)
5 5 5 5 5 25

PR19 Business Plan Supporting Information Page 40 of 65
PR19 Outcome Delivery Incentives Wt2- Water Supply Interruptions
Wt2- Water Supply Interruptions (minutes lost per property) 2020-21 2021-22 2022-23 2023-24 2024-25 Outperformance Cap 6.4 6 5.5 5.4 5 P90 6.4 6 5.5 5.4 5 Target 11.2 10.4 9.6 8.8 8 P10 19.8 19.1 18.6 17.4 17.1 Underperformance Collar 19.8 19.1 18.6 17.4 17.1
ODI Operator £m/Minute/Year Comment Underperformance Rate (0.568182) £568k per minute lost per property Outperformance Rate 1.269036 £1.269m per minute lost per property
2017-18 prices
Frequency of measurement and use of averaging Annual Timing of outperformance and underperformance payments
In-Period
Form of financial incentives Revenue Maximum outperformance payment over 5 years £25m (Category 1) Maximum underperformance payment over 5 years £25m (Category 1) Price Control Allocation 100% Water Network+
Determining the P10 and P90
The P10 and P90 is determined through bootstrapping monthly data to estimate the probability distribution function. The monthly data used is from April 2014 to June 2018. Data prior to this was not used due to the substantial level of improvement that was achieved over the preceding period. In March 2018 the impact of ‘Storm Emma’ increased customer minutes lost by circa 28 minutes per property. Within the dataset ‘Storm Emma’ is automatically treated as a 1 in 4 year event. However, ‘Storm Emma’, which was quite extreme, was considered to be a 1 in 10 year event, and so in order to enable the analysis to treat it as such an additional 6 years of data was bootstrapped from the dataset so as to produce 10 years’ worth of observations in total. The effect of this change is to reduce the estimated P10 level from 48 to 19.8 minutes per property in 2020-21.

PR19 Business Plan Supporting Information Page 41 of 65
PR19 Outcome Delivery Incentives Wt3- Acceptability of drinking water
Wt3 Acceptability of drinking water (contacts per 1,000 population served) 2020-21 2021-22 2022-23 2023-24 2024-25 Outperformance Cap 1.16 1.12 1.08 1.04 1.00 P90 1.16 1.12 1.08 1.04 1.00 Target 2.32 2.24 2.16 2.08 2.00 P10 3.48 3.36 3.24 3.12 3.00 Underperformance Collar
3.48 3.36 3.24 3.12 3.00
ODI Operator £m/Nr/Year Comment Underperformance Rate (2.407407) Equivalent to £2,407 for each
contact per million population Outperformance Rate 2.407407 2017-18 prices
Frequency of measurement and use of averaging Annual Timing of outperformance and underperformance payments
In-Period
Form of financial incentives Revenue Maximum outperformance payment over 5 years £13m (Category 2) Maximum underperformance payment over 5 years £13m (Category 2) Price Control Allocation 100% Water Network+
Determining the P10 and P90
The P10 and P90 is determined through bootstrapping monthly data to estimate the probability distribution function. The monthly data is from April 2014 to June 2018. Our target level of performance for acceptability of water in 2024-25 is 2 contacts per 1,000 population served. The statistical analysis produces a P10 and P90 of 2.5 and 1.5 respectively. Given the level of stretch that is already built into the target, we judged that the probability of achieving a performance of 2.5 or above was considerably higher than 10 percent. Our judgement, taking into account our past performance, is that the P10 is more likely to be at 3. To ensure an appropriate level of balance between the P10 and P90, the P90 has been subsequently widened reflecting the increase in the P10, therefore maximum outperformance payments will only be achieved at an extremely stretching level.

PR19 Business Plan Supporting Information Page 42 of 65
PR19 Outcome Delivery Incentives Wt4- Water Mains Bursts
Wt4- Water Mains Bursts (Number per 1,000km of mains) 2020-21 2021-22 2022-23 2023-24 2024-25 Target 133.0 132.7 130.8 130.5 128.4 P10 165.3 165.0 163.0 162.7 160.5 Underperformance Collar
165.3 165.0 163.0 162.7 160.5
ODI Operator £m/Nr/Year Comment Underperformance Rate (0.043451) Equivalent to £43,451 per burst per 1,000km
of main 2017-18 prices
Frequency of measurement and use of averaging Annual Timing of outperformance and underperformance payments
In-Period
Form of financial incentives Revenue Maximum outperformance payment over 5 years N/A Maximum underperformance payment over 5 years £7m (Category 3) Price Control Allocation 100% Water Network+
Determining the P10 and P90
The P10 and P90 is determined through bootstrapping monthly data to estimate the probability distribution function. The monthly data is from April 2009 to June 2018. This produced a P10 of 144 per 1,000km of mains in 2024-25. However, we judged that the probability of achieving performance at or below this level is greater than 10 percent. The P10 has therefore been widened and instead it has been set at the level that reflects the average level of performance that was experienced during the adverse weather events in 2010 and 2018.

PR19 Business Plan Supporting Information Page 43 of 65
PR19 Outcome Delivery Incentives Wt8- Lead Supply Pipes Replaced
Wt8- Lead Supply Pipes Replaced (Number) 2020-21 2021-22 2022-23 2023-24 2024-25 Outperformance Cap 2,000 4,000 6,000 8,000 10,000 P90 2,000 4,000 6,000 8,000 10,000 Target 1,400 2,800 4,200 5,600 7,000 P10 800 1,600 2,400 3,200 4,000 Underperformance Collar
800 1,600 2,400 3,200 4,000
ODI Operator £m/0.001 Nr/Year Comment Underperformance Rate (0.777778) Equivalent to £778 per Lead Supply Pipe Outperformance Rate 0.777778
2017-18 prices
Frequency of measurement and use of averaging Annual Timing of outperformance and underperformance payments
In-Period
Form of financial incentives Revenue Maximum outperformance payment over five years £7m (Category 3) Maximum underperformance payment over five years
£7m (Category 3)
Price Control Allocation 100% Water Network+
Overview
This measure is the number of customers’ lead supply pipes that are replaced over the AMP. This is a cumulative measure. The outperformance and underperformance payments are defined relative to the cumulative performance.
Determining the P10 and P90
The P10 and P90 levels are based on an over- or under- delivery of 3,000 lead pipes in 2024-25. This is equivalent to 43% under and outperformance. We do not have historical data for this measure so management judgement was used. The number of lead pipes replaces is unpredictable due to operational factors. The outperformance and underperformance rate is equivalent to £778 per pipe.

PR19 Business Plan Supporting Information Page 44 of 65
PR19 Outcome Delivery Incentives
En1- Water and Wastewater Treatment Works Compliance
En1- Water and Wastewater Treatment Works Compliance (%) 2020-21 2021-22 2022-23 2023-24 2024-25 Target 100% 100% 100% 100% 100% Underperformance Deadband 97% 97% 97% 97% 97% P10 95% 95% 95% 95% 95% Underperformance Collar 95% 95% 95% 95% 95%
ODI Operator £m/%/Year Comment Underperformance Rate (0.7) Equivalent to £70,000 for each 0.1% of under-
performance in a year 2017-18 prices
Frequency of measurement and use of averaging Annual Timing of outperformance and underperformance payments
In-Period
Form of financial incentives Revenue Maximum outperformance payment over 5 years N/A Maximum underperformance payment over 5 years
£7m (Category 3)
Price Control Allocation 100% Wastewater Network+
Underperformance Deadband
The target for Water and Wastewater treatment works compliance is 100%. As this represents 100% compliance the measure has a deadband of 97%. 97% is equivalent to ‘Red’ under the Environment Performance Assessment (EPA).
Determining the P10 and P90
Our estimate of the P10 level of performance is a compliance level of 95%. This reflects our historical performance and the judgement of the wastewater treatment works team taking into account their assessment of works ‘at risk’ of non-compliance.
Price Control Allocation
The price control allocation is 100% to Wastewater network+. This measure does cover both Water and Wastewater treatment works. Any financial incentive will be paid to Wastewater Network+ and there will be an internal mechanism of transfer payments to deal with the share of any under-performance payments attributable to Water Network+.

PR19 Business Plan Supporting Information Page 45 of 65
PR19 Outcome Delivery Incentives
En2- Wastewater treatment works ‘look-up table’ compliance
En2- Wastewater treatment works ‘look-up table’ compliance (%) 2020-21 2021-22 2022-23 2023-24 2024-25 Target 100% 100% 100% 100% 100% Underperformance Deadband 99.2% 99.2% 99.2% 99.2% 99.2% P10 98.2% 98.2% 98.2% 98.2% 98.2% Underperformance Collar 98.2% 98.2% 98.2% 98.2% 98.2%
ODI Operator £m/%/Year Comment Underperformance Rate (2.6) Equivalent to £260k for each 0.1% of under-
performance in a year 2017-18 prices
Frequency of measurement and use of averaging Annual Timing of outperformance and underperformance payments
In-Period
Form of financial incentives Revenue Maximum outperformance payment over 5 years N/A Maximum underperformance payment over 5 years
£13m (Category 2)
Price Control Allocation 100% Wastewater Network+
Underperformance Deadband
The target for Wastewater treatment works compliance is 100%. As this represents 100% compliance, the measure has a deadband. This has been set at 99.2%, which is equivalent to more than 4 of our 558 permits failing in a year.
Determining the P10 and P90
The P10 of this measure is set at 98.2%, this is equivalent to 10 of 558 permits failing in a year. This reflects our historical performance and the judgement of the wastewater treatment works team taking into account their assessment of works ‘at risk’ of non-compliance.

PR19 Business Plan Supporting Information Page 46 of 65
PR19 Outcome Delivery Incentives En3- Pollution Incidents from Wastewater
En3- Pollution Incidents from Wastewater (Incidents per 10,000km of sewers) 2020-21 2021-22 2022-23 2023-24 2024-25 Outperformance Cap 22 18 17 15 15 P90 22 18 17 15 15 Target 28 27 26 25 24 P10 41 37 36 34 34 Underperformance Collar
41 37 36 34 34
ODI Operator £m/Nr/Year Comment Underperformance Rate (0.480769) Equivalent to £481k per incident per 10,000 kms Outperformance Rate 0.581395 Equivalent to £581k per incident per 10,000 kms
2017-18 prices
Frequency of measurement and use of averaging Annual Timing of outperformance and underperformance payments
In-Period
Form of financial incentives Revenue Maximum outperformance payment over 5 years £25m (Category 1) Maximum underperformance payment over 5 years
£25m (Category 1)
Price Control Allocation 100% Wastewater Network+
Determining the P10 and P90
The P10 and P90 levels are determined by bootstrapping monthly data to estimate the probability distribution function. The monthly data covers January 2010 to June 2018. This produced P10 and P90 levels of 34 and 16 incidents per 10,000km of sewers respectively in 2024-25. The P90 was widened slightly to 15 incidents on the basis of management judgement.

PR19 Business Plan Supporting Information Page 47 of 65
PR19 Outcome Delivery Incentives En4- Leakage
En4- Leakage (Ml/d) 2020-21 2021-22 2022-23 2023-24 2024-25 Outperformance Cap 163.9 159.8 154.6 149.4 144.2 P90 163.9 159.8 154.6 149.4 144.2 Target 167.9 163.8 158.6 153.4 148.2 P10 172.9 168.8 163.6 158.4 153.2 Underperformance Collar
172.9 168.8 163.6 158.4 153.2
ODI Operator £m/Ml/d/Year Comment Underperformance Rate (1.00) Equivalent to £1m per Ml/d Outperformance Rate 1.25 Equivalent to £1.25m per Ml/d
2017-18 prices
Frequency of measurement and use of averaging Annual. 3 year average. Timing of outperformance and underperformance payments
In-Period
Form of financial incentives Revenue Maximum outperformance payment over 5 years £25m (Category 1) Maximum underperformance payment over 5 years £25m (Category 1) Price Control Allocation 100% Water Network+
Determining the P10 and P90
Historical data was not used to estimate a probability distribution for leakage performance. This is because we are embarking on a new leakage strategy (see document 3.5: “Leakage Strategy”) which reduces the relevance of the variability of past performance to future performance.
Instead, the P10 and P90 levels for leakage have been set through management judgement taking into account the expected increase in the variability of the Sustainable Economic Level of Leakage (SELL) due to our new approach. The P10 for leakage has been set 5 Ml/d higher than the target value for each year, and the P90 at 4 Ml/D lower than the target value. The underperformance rate per Ml/d is £1m and the outperformance rate is £1.25m: these are of the same order of magnitude as our PR14 rates.

PR19 Business Plan Supporting Information Page 48 of 65
PR19 Outcome Delivery Incentives En6- Km of River Improved
En6- Km of River Improved (km) 2020-21 2021-22 2022-23 2023-24 2024-25 Outperformance Cap 478 P90 478 Target 0 5 25 25 418 P10 358 Underperformance Collar
358
ODI Operator £m/Nr/Year Comment Underperformance Rate (0.216667) Equivalent to £217k per km of
river improved by 2024-25 Outperformance Rate 0.216667 2017-18 prices
Frequency of measurement and use of averaging Annual Timing of outperformance and underperformance payments
End of Period
Form of financial incentives Revenue Maximum outperformance payment (at end period) £13m (Category 2) Maximum underperformance payment (at end period) £13m (Category 2) Price Control Allocation 100% Wastewater Network+
Determining the P10 and P90
Historical data does not provide insights into the probability distribution of future performance. The P10 and P90 levels have been set at 14% outperformance and underperformance, using management judgement. Our performance on this measure is certified by the NRW. Through the NEP uncertainty mechanism any expenditure that is saved will be spent on other aspects of the NEP. The outperformance payment incentivises us to find and deliver the lowest cost solutions, because only in that way can we increase the length of river improved. The unit cost of a km of river improved varies widely from location to location, the £217k rate per km lies conformably in the range of estimated.

PR19 Business Plan Supporting Information Page 49 of 65
PR19 Outcome Delivery Incentives En7- Bioresources Product Quality
En7- Bioresources Product Quality (%) 2020-21 2021-22 2022-23 2023-24 2024-25 Outperformance Cap 96.1% 98.4% 98.4% 98.4% 98.4% P90 96.1% 98.4% 98.4% 98.4% 98.4% Target 95.0% 97.3% 97.3% 97.3% 97.3% P10 90.4% 92.7% 92.7% 92.7% 92.7% Underperformance Collar
90.4% 92.7% 92.7% 92.7% 92.7%
ODI Operator £m/%/Year Comment Underperformance Rate (0.304348) Equivalent to £0.3m for each 1% of sludge
that does not meet the standard Outperformance Rate 1.272727 Equivalent to £1.3m for each additional 1%
of sludge that meets the standard 2017-18 prices
Frequency of measurement and use of averaging Annual Timing of outperformance and underperformance payments
In-period
Form of financial incentives Revenue Maximum outperformance payment over 5 years £7m (Category 3) Maximum underperformance payment over 5 years £7m (Category 3) Price Control Allocation 100% Bioresources
Determining the P10 and P90
Our long term target is to generate energy from 100% of our sludge. The improvement in the target reflects the planned investment in one site. Historical data does not provide insights into the probability distribution of future performance. The projected P10 and P90 levels have been set based on a forecast of the level of unplanned shutdowns and the availability of our sludge treatment centres at a 10 percent probability.

PR19 Business Plan Supporting Information Page 50 of 65
PR19 Outcome Delivery Incentives En8- Bioresources Disposal Compliance
En8- Bioresources Disposal Compliance (%) 2020-21 2021-22 2022-23 2023-24 2024-25 Target 100% 100% 100% 100% 100% P10 96.6% 96.6% 96.6% 96.6% 96.6% Underperformance Collar
96.6% 96.6% 96.6% 96.6% 96.6%
ODI Operator £m/ %/Year Comment Underperformance Rate (0.411765) Equivalent to £412k per percentage point of
underperformance 2017-18 prices
Frequency of measurement and use of averaging Annual Timing of outperformance and underperformance payments
In-period
Form of financial incentives Revenue Maximum outperformance payment over 5 years N/A Maximum underperformance payment over 5 years £7m (Category 3) Price Control Allocation 100% Bioresources
Determining the P10 and P90
Historical data does not provide insights into the probability distribution of future performance. The target for Bio-resources disposal compliance is 100%. We have achieved 100% compliance in recent years so no deadband has been introduced. Our P10 has been set using management judgment with particular regard to the level of storage and the risk that farmers are unable to take the sludge.

PR19 Business Plan Supporting Information Page 51 of 65
PR19 Outcome Delivery Incentives SV3- Customer Trust
SV3- Customer Trust (Score of 1-10) 2020-21 2021-22 2022-23 2023-24 2024-25 Outperformance Cap 0.25 0.25 0.25 0.25 0.25 P90 0.25 0.25 0.25 0.25 0.25 Target Upper
Quartile Customers
Upper Quartile Customers
Upper Quartile Customers
Upper Quartile Customers
Upper Quartile Customers
P10 (0.5) (0.5) (0.5) (0.5) (0.5) Underperformance Collar
(0.5) (0.5) (0.5) (0.5) (0.5)
ODI Operator £m/Nr/Year Comment Underperformance Rate (12.8) Equivalent to £1.2m per 0.1 points Outperformance Rate 25.6 Equivalent to £2.56 m per 0.1 points
2017-18 prices
Frequency of measurement and use of averaging Annual Timing of outperformance and underperformance payments
In-period
Form of financial incentives Revenue Maximum outperformance payment over 5 years £32m (Category 0) Maximum underperformance payment over 5 years £32m (Category 0) Price Control Allocation Allocated
Determining the P10 and P90
The target value for “earning the trust of customers” is to deliver the level of service that is in the top quartile for the industry measured by number of customers. The historical evidence from 2016 and 2017 indicates that on average the best performing company’s trust score is 0.25 higher than the trust score received by the top 25% of customers. On average over the last two years the worst performing water and sewerage company’s trust score was 0.5 points lower than the upper quartile. Reflecting these results the P90 is set at 0.25 points above the upper quartile and the P10 is set at 0.5 points below the upper quartile.
Maximum Standard Underperformance and Outperformance Payments
Columns 114 and 120 of App1, maximum standard underperformance and outperformance payments shows an error. The underperformance and outperformance deadband for this measure is set at the performance received by the upper quartile of customers in the year. The underperformance and outperformance payment is set for each point below and above this deadband. If the deadband is zero at 0 and the underperformance payments are set for each point below this the table reads:
2021-22 2022-23 2023-24 2024-25 2024-25 Total Maximum standard outperformance penalties (£m)
6.4 6.4 6.4 6.4 6.4 32

PR19 Business Plan Supporting Information Page 52 of 65
PR19 Outcome Delivery Incentives Price Control Allocation
Customer Trust is driven by what we do across all price controls. Therefore forecast revenue over the AMP7 period has been used as the basis of the allocation.
Water Resources
Water Network+
Wastewater Network+
Bioresources Residential Retail
Total
Revenue for AMP7 (£m)
167 1,284 1,840 168 319 3,757
Revenue (%) 4.4% 34.2% 48.4% 4.5% 8.5% 100%

PR19 Business Plan Supporting Information Page 53 of 65
PR19 Outcome Delivery Incentives Sv4- Business Customer Satisfaction
Sv4- Business Customer Satisfaction (Numerical Score out of 5) 2020-21 2021-22 2022-23 2023-24 2024-25 Outperformance Cap 4.7 4.7 4.7 4.7 4.7 P90 4.7 4.7 4.7 4.7 4.7 Target 4.5 4.5 4.5 4.5 4.5 Deadband 4.4 4.4 4.4 4.4 4.4 P10 4.0 4.0 4.0 4.0 4.0 Underperformance Collar
4.0 4.0 4.0 4.0 4.0
ODI Operator £m/Nr/Year Comment Underperformance Rate (3.5) Equivalent to £350k for under-performance of
0.1 Outperformance Rate 7.0 Equivalent to £700k for out-performance of 0.1
2017-18 prices
Frequency of measurement and use of averaging Annual Timing of outperformance and underperformance payments
In-period
Form of financial incentives Revenue Maximum outperformance payment over 5 years £7m (Category 3) Maximum underperformance payment over 5 years
£7m (Category 3)
Price Control Allocation 100% Business Retail
Under-performance deadband
A deadband has been introduced for Business Customer Satisfaction due to the level of ambition in our target. Our target level is to achieve a score of 4.5 out of 5 and the proposed deadband is 4.4. Our past performance has been in the range of 4.3 to 4.5. A deadband has been introduced as our performance on business customer satisfaction is industry-leading. CCWater’s NPS score reported in their “Testing the Waters” report has put us top of the WaSCs. Whilst we will face reputational incentives for performance under this level it is not deemed appropriate to incur financial underperformance payments until the performance is below 4.4.
Determining P10 and P90 and deadband
Historical data does not provide an indication of the likely probability distribution of future performance. The P10 and P90 levels have been set using management judgement. For out-performance we think that the P10 level is only 0.2 higher than the 4.5 target because there will always be a “hard core” that prevents performance from approaching the maximum level of 5.0. The potential downside, however, is much longer, and we judge that 4.0 is the level at which we think there is a 10% probability of even poorer performance.

PR19 Business Plan Supporting Information Page 54 of 65
PR19 Outcome Delivery Incentives Rt1- Sewer Flooding on Customer Property (Internal)
Rt1- Sewer Flooding on Customer Property (Internal) (Incidents) 2020-21 2021-22 2022-23 2023-24 2024-25 Outperformance Cap 226 220 214 207 202 P90 226 220 214 207 202 Target 294 288 283 280 273 P10 368 363 356 349 344 Underperformance Collar
368 363 356 349 344
ODI Operator £m/0.1 Nr/Year Comment Underperformance Rate (0.690677) Equivalent to £69k per Incident Outperformance Rate 0.716332 Equivalent to £72k per Incident
2017-18 prices
Frequency of measurement and use of averaging Annual Timing of outperformance and underperformance payments
In-period
Form of financial incentives Revenue Maximum outperformance payment over 5 years £25m (Category 1) Maximum underperformance payment over 5 years £25m (Category 1) Price Control Allocation 100% Wastewater Network+
Determining the P10 and P90
The P10 and P90 is determined through bootstrapping monthly data to estimate the probability distribution function. The monthly data is from April 2010 to February 2018. This produced a P10 and P90 of 336 and 212 respectively in 2024-25 (250 and 158 prior to the expected impact of convergence to the new definition). However, the resulting range was judged to be somewhat narrower than it should be, so the distribution was slightly widened for both the P10 and P90 levels to reflect a more realistic view of likely outcomes at the 10% level.

PR19 Business Plan Supporting Information Page 55 of 65
PR19 Outcome Delivery Incentives Rt2- Sewer Flooding on Customer Property (External)
Rt2- Sewer Flooding on Customer Property (External) (Incidents) 2020-21 2021-22 2022-23 2023-24 2024-25 Outperformance Cap 4704 4642 4578 4513 4448 P90 4704 4642 4578 4513 4448 Target 4057 3993 3928 3864 3800 P10 3421 3356 3290 3227 3164 Underperformance Collar
3421 3356 3290 3227 3164
ODI Operator £m/0.001 Nr/Year Comment Underperformance Rate (2.198492) Equivalent to £2.2k per External Sewer Flooding
Incident Outperformance Rate 2.158495 Equivalent to £2.2k per External Sewer Flooding
Incident 2017-18 prices
Frequency of measurement and use of averaging Annual Timing of outperformance and underperformance payments
In-period
Form of financial incentives Revenue Maximum outperformance payment over 5 years £7m (Category 3) Maximum underperformance payment over 5 years £7m (Category 3) Price Control Allocation 100% Wastewater Network+
Determining the P10 and P90
The P10 and P90 is determined through bootstrapping monthly data to estimate the probability distribution function. The monthly data is taken from April 2012 to June 2018.

PR19 Business Plan Supporting Information Page 56 of 65
PR19 Outcome Delivery Incentives Rt3- Sewer Collapses
Rt3- Sewer Collapses (expressed as % deviation from target) 2020-21 2021-22 2022-23 2023-24 2024-25 Target 0% 0% 0% 0% 0% P10 10% 10% 10% 10% 10% Underperformance Collar
10% 10% 10% 10% 10%
ODI Operator £m/100 %/Year Comment Underperformance Rate (0.14) Equivalent to £140k per 1% deviation from target
2017-18 prices
Frequency of measurement and use of averaging Annual Timing of outperformance and underperformance payments
In-period
Form of financial incentives Revenue Maximum outperformance payment N/A Maximum underperformance payment over 5 years £7m (Category 3) Price Control Allocation 100% Wastewater Network+
Determining the P10 and P90
The P10 and P90 is determined through bootstrapping historical monthly data to estimate the probability distribution function. The data is from April 2012 to June 2018. This produced a P10 and P90 of 775 collapses, based on the pre-convergence measure. This is converted into a percentage reduction from 2019-20 forecast performance level.

PR19 Business Plan Supporting Information Page 57 of 65
PR19 Outcome Delivery Incentives Rt4- Total Complaints
Rt4- Total Complaints (Complaints per 10,000 customers) 2020-21 2021-22 2022-23 2023-24 2024-25 Outperformance Cap 52 50 48 45 44 P90 52 50 48 45 44 Target 73 71 68 64 60 P10 142 138 132 124 117 Underperformance Collar
142 138 132 124 117
ODI Operator £m/0.1 Nr/Year Comment Underperformance Rate (0.410095) Equivalent to £41k per complaint per 10,000
customers Outperformance Rate 1.340206 Equivalent to £134k per complaint per 10,000
customers 2017-18 prices
Frequency of measurement and use of averaging Annual Timing of outperformance and underperformance payments In-period Form of financial incentives Revenue Maximum outperformance payment over 5 years £13m (Category 2) Maximum underperformance payment over 5 years £13m (Category 2) Price Control Allocation Allocated
Determining the P10 and P90
The target level of complaints is set at our forecast level of performance. In our retail business plan complaints is a priority area of focus, including an increased focus on systems, people and processes. Our targets are ambitious and at the 10 percent probability level there is uncertainty around the delivery of the programme. Whilst we have processes and systems to reduce complaints, they are also driven by exogenous events that are beyond our control.
Price Control Allocation
Total complaints is allocated between water network+, wastewater network+ and residential retail as these price controls are the main drivers of the level of performance. The price control allocation is based on the revenue over the 5 years.
Water Network+
Wastewater Network+
Residential Retail
Total
Revenue for AMP7 (£m) 1,284 1,840 319 3,422 Revenue (%) 37.5% 53.2% 9.3% 100%

PR19 Business Plan Supporting Information Page 58 of 65
PR19 Outcome Delivery Incentives Ft4- Surface Water Removed from Sewers
Ft4- Surface Water Removed from Sewers (Roof Equivalents) 2020-21 2021-22 2022-23 2023-24 2024-25 Outperformance Cap 32,766 37,447 40,957 46,809 55,000 P90 32,766 37,447 40,957 46,809 55,000 Target 28,000 32,000 35,000 40,000 47,000 P10 23,234 26,553 29,043 33,192 39,000 Underperformance Collar
23,234 26,553 29,043 33,192 39,000
ODI Operator £m/0.001 Nr/Year Comment Underperformance Rate (0.225967) Equivalent to £225 per Roof Equivalent Outperformance Rate 0.225967
2017-18 prices
Frequency of measurement and use of averaging
Annual
Timing of outperformance and underperformance payments
In-period
Form of financial incentives Revenue Maximum outperformance payment £7m (Category 3) Maximum underperformance payment £7m (Category 3) Price Control Allocation 100% Wastewater Network+
Determining the P10 and P90
Historical data does not provide an indication of the likely probability distribution of future performance for this measure. We have therefore used management judgment to arrive at P10 and P90 levels that are 17% from target performance in 2024-25. This reflects the fact that, although this is our preferred approach to address reduced capacity in the sewers because it offers a sustainable solution over the long term, it is not necessarily the most cost effective answer in each instance where a local network is under pressure. The ranges reflect the uncertainty surrounding how often it will be chosen, and the under- and out-performance rates have been set at £226 per roof equivalent, which is the same order of magnitude as the PR14 incentive rate.
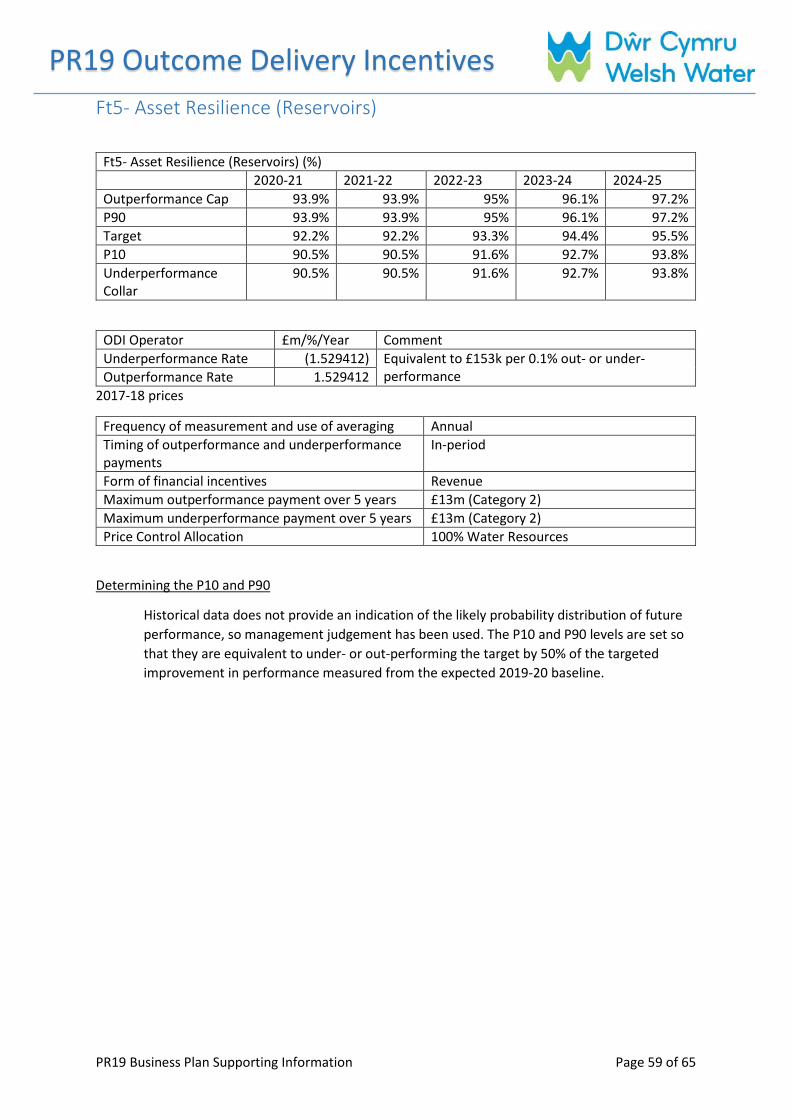
PR19 Business Plan Supporting Information Page 59 of 65
PR19 Outcome Delivery Incentives Ft5- Asset Resilience (Reservoirs)
Ft5- Asset Resilience (Reservoirs) (%) 2020-21 2021-22 2022-23 2023-24 2024-25 Outperformance Cap 93.9% 93.9% 95% 96.1% 97.2% P90 93.9% 93.9% 95% 96.1% 97.2% Target 92.2% 92.2% 93.3% 94.4% 95.5% P10 90.5% 90.5% 91.6% 92.7% 93.8% Underperformance Collar
90.5% 90.5% 91.6% 92.7% 93.8%
ODI Operator £m/%/Year Comment Underperformance Rate (1.529412) Equivalent to £153k per 0.1% out- or under-
performance Outperformance Rate 1.529412 2017-18 prices
Frequency of measurement and use of averaging Annual Timing of outperformance and underperformance payments
In-period
Form of financial incentives Revenue Maximum outperformance payment over 5 years £13m (Category 2) Maximum underperformance payment over 5 years £13m (Category 2) Price Control Allocation 100% Water Resources
Determining the P10 and P90
Historical data does not provide an indication of the likely probability distribution of future performance, so management judgement has been used. The P10 and P90 levels are set so that they are equivalent to under- or out-performing the target by 50% of the targeted improvement in performance measured from the expected 2019-20 baseline.

PR19 Business Plan Supporting Information Page 60 of 65
PR19 Outcome Delivery Incentives Ft6- Asset Resilience (Water Network+ above ground)
Ft6- Asset Resilience (Water Network+ above ground) (%) 2020-21 2021-22 2022-23 2023-24 2024-25 Outperformance Cap 85.3% 85.3% 86.1% 86.9% 87.8% P90 85.3% 85.3% 86.1% 86.9% 87.8% Target 84.0% 84.0% 84.8% 85.6% 86.5% P10 82.7% 82.7% 83.5% 84.3% 85.2% Underperformance Collar
82.7% 82.7% 83.5% 84.3% 85.2%
ODI Operator £m/%/Year Comment Underperformance Rate (2.0) Equivalent to £200k per 0.1%
out- or under-performance Outperformance Rate 2.0 2017-18 prices
Frequency of measurement and use of averaging Annual Timing of outperformance and underperformance payments
In-period
Form of financial incentives Revenue Maximum outperformance payment over 5 years £13m (Category 2) Maximum underperformance payment over 5 years £13m (Category 2) Price Control Allocation 100% Water Network+
Determining the P10 and P90
Historical data does not provide an indication of the likely probability distribution of future performance, so management judgement has been used. The P10 and P90 levels are set so that they are equivalent to under- or out-performing the target by 50% of the targeted improvement in performance measured from the expected 2019-20 baseline.

PR19 Business Plan Supporting Information Page 61 of 65
PR19 Outcome Delivery Incentives Ft7- Asset Resilience (Water Network+ below ground)
Ft7- Asset Resilience (Water Network+ below ground) (%) 2020-21 2021-22 2022-23 2023-24 2024-25 Outperformance Cap 51.5% 51.5% 54.5% 57.5% 60.5% P90 51.5% 51.5% 54.5% 57.5% 60.5% Target 47% 47% 50.0% 53.0% 56.0% P10 42.5% 42.5% 45.5% 48.5% 51.5% Underperformance Collar
42.5% 42.5% 45.5% 48.5% 51.5%
ODI Operator £m/%/Year Comment Underperformance Rate (0.577778) Equivalent to £58k per 0.1%
out- or under-performance Outperformance Rate 0.577778 2017-18 prices
Frequency of measurement and use of averaging Annual Timing of outperformance and underperformance payments
In-period
Form of financial incentives Revenue Maximum outperformance payment over 5 years £13m (Category 2) Maximum underperformance payment over 5 years £13m (Category 2) Price Control Allocation 100% Water Network+
Determining the P10 and P90
Historical data does not provide an indication of the likely probability distribution of future performance, so management judgement has been used. The P10 and P90 levels are set so that they are equivalent to under- or out-performing the target by 50% of the targeted improvement in performance measured from the expected 2019-20 baseline.

PR19 Business Plan Supporting Information Page 62 of 65
PR19 Outcome Delivery Incentives Ft8- Asset Resilience (Wastewater Network+ above ground)
Ft8- Asset Resilience (Wastewater Network+ above ground) (%) 2020-21 2021-22 2022-23 2023-24 2024-25 Outperformance Cap 78.9% 78.9% 79.7% 80.5% 81.2% P90 78.9% 78.9% 79.7% 80.5% 81.2% Target 77.7% 77.7% 78.5% 79.3% 80.0% P10 76.5% 76.5% 77.3% 78.1% 78.8% Underperformance Collar
76.5% 76.5% 77.3% 78.1% 78.8%
ODI Operator £m/%/Year Comment Underperformance Rate (2.166667) Equivalent to £217k per 0.1%
out- or under-performance Outperformance Rate 2.166667 2017-18 prices
Frequency of measurement and use of averaging Annual Timing of outperformance and underperformance payments
In-period
Form of financial incentives Revenue Maximum outperformance payment over 5 years £13m (Category 2) Maximum underperformance payment over 5 years £13m (Category 2) Price Control Allocation 100% Wastewater Network+
Determining the P10 and P90
Historical data does not provide an indication of the likely probability distribution of future performance, so management judgement has been used. The P10 and P90 levels are set so that they are equivalent to under- or out-performing the target by 50% of the targeted improvement in performance measured from the expected 2019-20 baseline.

PR19 Business Plan Supporting Information Page 63 of 65
PR19 Outcome Delivery Incentives Ft9- Asset Resilience (Wastewater Network+ below ground)
Ft9- Asset Resilience (Wastewater Network+ below ground) (%) 2020-21 2021-22 2022-23 2023-24 2024-25 Outperformance Cap 36.7% 36.7% 42.3% 47.9% 53.4% P90 36.7% 36.7% 42.3% 47.9% 53.4% Target 28.3% 28.3% 33.9% 39.5% 45.0% P10 19.9% 19.9% 25.5% 31.1% 36.6% Underperformance Collar
19.9% 19.9% 25.5% 31.1% 36.6%
ODI Operator £m/%/Year Comment Underperformance Rate (0.309524) Equivalent to £31k per 0.1%
out- or under-performance Outperformance Rate 0.309524 2017-18 prices
Frequency of measurement and use of averaging Annual Timing of outperformance and underperformance payments
In-period
Form of financial incentives Revenue Maximum outperformance payment over 5 years £13m (Category 2) Maximum underperformance payment over 5 years £13m (Category 2) Price Control Allocation 100% Wastewater Network+
Determining the P10 and P90
Historical data does not provide an indication of the likely probability distribution of future performance, so management judgement has been used. The P10 and P90 levels are set so that they are equivalent to under- or out-performing the target by 50% of the targeted improvement in performance measured from the expected 2019-20 baseline.

PR19 Business Plan Supporting Information Page 64 of 65
PR19 Outcome Delivery Incentives Ft10- Community Education
Ft10- Community Education (Number of persons) 2020-21 2021-22 2022-23 2023-24 2024-25 Outperformance Cap 98,000 100,800 102,200 103,600 105,000 P90 98,000 100,800 102,200 103,600 105,000 Target 70,000 72,000 73,000 74,000 75,000 P10 42,000 43,200 43,800 44,400 45,000 Underperformance Collar
42,000 43,200 43,800 44,400 45,000
ODI Operator £m/0.001 Nr/year Comment Underperformance Rate (0.048077) Equivalent to £48 per Student Outperformance Rate 0.048077
2017-18 prices
Frequency of measurement and use of averaging Annual Timing of outperformance and underperformance payments
In-Period
Form of financial incentives Revenue Maximum outperformance payment over 5 years £7m (Category 3) Maximum underperformance payment over 5 years £7m (Category 3) Price Control Allocation Allocated
Determining the P10 and P90
The P10 and P90 have been set based on management judgement. The P10 is based on the risk of changes to the school curriculum and funding which could reduce the number of students. The P90 is based on the potential increase in students through our ‘Water resilient communities’.
Price Control Allocation
Community education has been allocated between Water Network and Wastewater Network+. The allocation is based on the percentage of revenue.
Water Network+ Wastewater Network+ Total Total Revenue over AMP (£m) 1,284 1,820 3,104
Total Revenue over AMP 41.4% 58.6% 100%

PR19 Business Plan Supporting Information Page 65 of 65
PR19 Outcome Delivery Incentives Ft11- Visitors to recreational facilities
Ft11- Visitors to recreational facilities (Number) 2020-21 2021-22 2022-23 2023-24 2024-25 Outperformance Cap 890,000 1,018,000 1,079,000 1,144,000 1,210,000 P90 890,000 1,018,000 1,079,000 1,144,000 1,210,000 Target 560,000 675,000 720,000 775,000 830,000 P10 230,000 332,000 361,000 406,000 450,000 Underperformance Collar
230,000 332,000 361,000 406,000 450,000
ODI Operator £m/0.0001 %/year Comment Underperformance Rate (0.039304) Equivalent to
£3.93 Per visitor Outperformance Rate 0.039304 2017-18 prices
Frequency of measurement and use of averaging Annual Timing of outperformance and underperformance payments
In-Period
Form of financial incentives Revenue Maximum outperformance payment over 5 years £7m (Category 3) Maximum underperformance payment over 5 years £7m (Category 3) Price Control Allocation 100% Water Resources
Determining the P10 and P90
Our target is set using management judgement through consultation with our Recreation team, which includes leisure sector professionals who have recently joined us, and external consultants have advised us on the level of scope to increase visitors to our facilities. There is potential variation in the forecast target as a result of timing of the facilities being available, the take-up rate of the facilities and competition of other attractions in the area.


![Barratt Homes v Welsh Water - The Supreme Court · Michaelmas Term [2009] UKSC 13 On appeal from: [2008] EWCA 1552 JUDGMENT Barratt Homes Limited (Respondents) v Dwr Cymru Cyfyngedig](https://img.dokumen.tips/doc/110x75/5bde43ad09d3f2995d8c717a/barratt-homes-v-welsh-water-the-supreme-court-michaelmas-term-2009-uksc.jpg)