Embed Size (px)
Citation preview

““PPuubblliicc--PPrriivvaattee CCoommppeettiittiioonn iinn RReegguullaatteedd
MMaarrkkeettss””
ZZiiaadd RR.. GGhhaannddoouurr
NIPE WP 02/ 2019
““PPuubblliicc--PPrriivvaattee CCoommppeettiittiioonn iinn RReegguullaatteedd
MMaarrkkeettss””
ZZiiaadd RR.. GGhhaannddoouurr
NNIIPPEE** WWPP 0022//22001199
URL: http://www.nipe.eeg.uminho.pt/
«This paper is financed by National Funds of the FCT – Portuguese Foundation for Science and Technology within the project «UID/ECO/03182/2019»
Public-Private Competition in Regulated
Markets ∗
Ziad R. Ghandour †
March 26, 2019
Abstract
We analyse the effect of competition on quality provision in mixed markets,
such as healthcare and education, where public and private providers coex-
ist. We draw two key assumptions about the public provider in such markets,
namely in that it faces a regulated price and is (partly) motivated. We also
explore the effects of changes in the state subsidy and co-payment fees. Our
main contribution is that, under certain circumstances, more competition
leads to lower average quality in equilibrium. Similarly, the effects of higher
co-payment fees or larger state subsidies on average quality are also a pri-
ori ambiguous. These conclusions hold regardless of whether providers seek
profit maximisation or the public provider has altruistic preferences. Further-
more, we characterise the incentives for the private provider to unilaterally
relocate towards the public provider.
Keywords: Mixed Duopoly, Competition, Quality Provision, Motivated
Provider, State Subsidy, Co-payment Fees
JEL classification: D4, L1, L2, L3
∗I would like to thank my supervisor: Professor Odd Rune Straume, who consistentlyallowed this paper to be my own work, but steered me in the right direction, whenever hethought I needed it.
†Department of Economics / NIPE, University of Minho, Campus de Gualtar, 4710-057 Braga, Portugal. E-mail: [email protected].
1
1 Introduction
OECD 2017 report reads “ Competition in public markets is often neglected
or, in some cases, actively suppressed”. The report seeks to design pro-
competitive reforms to derive quality improvements in the healthcare and
education market sectors. Despite the goal of public provision to offer af-
fordable access to merit goods, quality is a central concern for policymakers.
Our paper is motivated by the observation that, whenever public and private
providers coexist, quality differentiation varies. The public provider supplies
higher quality than the private provider within the context of US nursing
homes (Friedman et al., 2019) and the European education market (Romero
and Del Rey, 2004), whereas, the scenario is reversed in most US universities
(Deming and Goldin, 2012) and in the healthcare market in Lebanon and
Bangladesh (Bemo, 2013; Pavel et al., 2015). One of the key policy chal-
lenges is how to ensure providers have more incentives so as to offer more
quality provision in mixed markets.
Regulated markets have one important feature in common: government plays
the central role of the major funder of the services to the public provide.1
In practice, governments tie the payment of subsidy to the provision of a
particular service. Another important feature in several public sector areas
is the use of co-payments. This was suggested by policymakers as a poten-
tial solution to control costs and to fund an increasingly costly education or
healthcare system.2 Both policy instruments, state subsides and co-payment
fees, act as competitive forces to produce desirable outcomes. Therefore,
1Historically, governments have contributed to public firms financial subsidies thatresult in an overall growth of the public sector. For instance, in 2015, education andhealthcare markets account for circa 13 percent of the GDP and around 18 percent ofpublic expenditure in OECD countries (OECD, 2017).
2For example, Sabik and Gandhi (2016) suggest that co-payments maybe an effectivetool for reducing the use of the Emergency Department for non-urgent care.
2
market mechanisms with these tools regulate the flow of services for the
public provider which are mainly not available to private rivals, perhaps in
selecting the range of quality standards.
Services in education, healthcare, long-term care, nursing homes and child-
care markets have experienced a rapid growth in the private sector.3 Accord-
ing to Henry KFF, from 1999 to 2016, the US share of for-profit private hos-
pitals has surged from 15.1 to 21.4 percent.4 Although most European mar-
kets in higher education and healthcare are dominated by public firms (where
prices are typically regulated), the private market is very active. Jeurissen
et al. (2016) report that for-profit hospital beds in eight European countries
surged from about 15.6 percent in 2005 to 18.4 percent in 2013. In addition,
the private sector facilities account for 74 percent of nursing home care in
England (Barron and West, 2017). The private provider’s incentive for qual-
ity investment depends on the total funds received by the public provider.
In most countries, private providers compete on quality and price to attract
consumers. For instance, in developed and emerging countries, elite private
universities are allowed to set their own fees while public universities charge
low tuition fees.
Under the applied co-payment system, consumers face trade-off in select-
ing the service provider who offers the highest quality as there is a share of
costs paid directly by households. Based on purchasing behaviour, in some
cases, the consumer would top-up the government contribution in order to
purchase a higher quality service. More precisely, the responsiveness of the
demand for higher quality is induced with larger marginal willingness-to-pay
(WTP) for quality. In several countries, public healthcare providers charge
3The intention of this paper is not to blindly advocate for either deregulation or priva-tization.
4The Henry Kaiser Family Foundation (2017). State Health Facts, Hospitals by Own-ership Type https : //www.kff.org/other/state− indicator/hospitals− by− ownership.
3
lower fees than private facilities, but have less amenities and longer waiting
times. In Lebanon, patients tend to prefer private clinics for their flexible
measures, less crowded facilities and rapid procedures in providing medical
services (Bemo, 2013). Therefore, the role of WTP for quality is useful for
government and private sector in the allocation of their funds and in the
setting of appropriate user fees (Pavel et al., 2015).
In this study, we focus on market outcomes in which the private provider
competes in quality and price, while the public provider competes in the
quality given at an exogenous level of state subsidy and co-payment fees.
Within the framework of a horizontally differentiated mixed duopoly mar-
ket, we study the nature of the strategic interaction between both providers
under different ownership structures. We also examine the effect of competi-
tion and changes in policy instruments on average quality, thus highlighting
the role of the consumers’ marginal willingness-to-pay for quality. We address
the following questions: If the goal is increasing quality provision, should the
regulator increase state-subsidy per-consumer to the public provider or de-
crease the amount of co-payment? How does the private provider respond
to changes in public policies? These questions are highly topical and of key
importance. Thus, it is relevant, from a policy standpoint, to offer insight
regarding the relation between key policy instruments and average quality in
mixed markets, which has received relatively little attention in the existing
literature.
We theoretically analyse the effect of competition on quality provision in
mixed markets such as healthcare and education, where public and private
providers coexist. We use a spatial competition framework as it is well-suited
to study competition in such markets where consumers display a preference
for the closest provider unless more distant providers offer better quality
and/or lower price. We make two key assumptions about the public provider
4

in such markets, namely that it faces a regulated price and is (partly) mo-
tivated. At stage one of the game, both providers simultaneously choose
quality, while anticipating the price chosen by the private provider at the
subsequent stage of the game. We consider the profit-maximising duopoly
as a benchmark and explore the effects of heterogeneous objective functions.
Surprisingly, our model fills the gap in the literature for mixed markets and
has policy implications.
We develop two sets of results. The first, in the profit-maximising duopoly,
concerns the public provider’s best response which is strategically indepen-
dent of the quality offered by the private provider. We find the relationship
between competition and the quality of the private provider to be ambiguous.
Furthermore, under certain circumstances, more competition leads to lower
average quality in equilibrium. Similarly, the effects of higher co-payment
fees or larger state subsidies on average quality are also a priori ambiguous.
Lastly, if the private provider chooses its location, we find that it has an
incentive to relocate towards the public provider, should the amount of state
subsidy be sufficiently small.
Our second set of results takes a closer look at the additional chain of re-
sponse when the public provider is altruistic. In this case, the best response
function of the public provider has a strategic interaction with the quality
of the private provider. We find the relationship between competition and
quality of the public provider to be generally ambiguous. Additionally, the
scope for positive relationship between average quality and competition is
larger in the presence of altruism. Furthermore, we demonstrate that higher
co-payment fees lead to lower quality for the public, should it be highly mo-
tivated. Our conclusion is that the relationship between average quality and
state subsidy or co-payment fees can be defined as a priori ambiguous re-
gardless of altruistic preferences.
5
Within our model, we also investigate the effects of a higher share of co-
payment relative to the share of state-subsidy given that the public provider
receives same price level. In a profit-maximising duopoly, we find that a
higher share of co-payment has positive effect on equilibrium levels of the
private provider, while it has no effect on the quality for the public. How-
ever, in the presence of altruism, the quality of the public provider has an
inverse relation with the share of co-payment regardless of the level of altru-
ism, in contrast to the result obtained under the effect of co-payment fees.
Our paper contributes to the theoretical literature on the relationship be-
tween competition and quality provision. Generally, more competition has
two countering effects on quality. The direct effect, on the one hand, is that
increased competition makes demand more responsive to a marginal increase
in quality for given prices.5 On the other hand, the indirect effect, consumers
are also responsive to price changes with more competition. The provider
reduces the prices which, in return, reduces the marginal profit. Thus, lower
prices reduces the provider’s marginal return to quality investments. The
ingredients of the theoretical model used determine the relative strength of
these two general effects.6
Standard spatial competition models, where providers compete in prices and
quality, reveal that the two aforementioned effects cancel each other out
(produce neutrality results) exactly, hence; there is no effect of more com-
petition on quality provision (Ma and Burgess, 1993; Gravelle, 1999). Two
papers show that the two above-mentioned effects do not cancel when al-
5Wolinsky (1997); Matsumura and Matsushima (2007); Brekke et al. (2006) report adirect positive relation between competition and quality with regulated prices.
6For instance, under regulated prices, Brekke et al. (2011) find the effect of competitionon quality in hospital markets to be ambiguous with a fairly general cost structure in thepresence of altruism.
6
lowing for income effects in consumer utility. Brekke et al. (2010) find that
more competition tends to increase quality when consumers have decreasing
marginal utility of income. Conversely, Brekke et al. (2017) find an unam-
biguously negative relationship between competition and quality if providers
are (partly) motivated and utility is strictly concave in income. In this pa-
per, where the private provider chooses quality and price, we investigate the
characteristics that define the dominance of either effects in equilibrium.
In mixed markets, there is an impressive amount of studies examining the
competition between state-owned maximising firm and profit-maximising pri-
vate firm. In the literature on Hotelling-type spatial competition framework,
our paper relates partly to Herr (2011) and Amin et al. (2018) where a for-
profit hospital competes with a not-for-profit hospital on quality. However,
both papers consider price regulation. In contrast, our model assumes that
households either share part of the cost of the service (that is regulated
co-payment) or an endogenous price chosen by the private provider. Accord-
ingly, we fill the gap in the literature of competition in public markets. The
private provider has a price choice compared to a price faced by the public
provider, is considered to describe an additional feature in mixed markets
yet to be explored.
With a vertical differentiation framework, where consumers are heteroge-
neous with respect to their willingness-to-pay for quality product, there is
extensive literature studying quality and price competition (recent studies
in the context of mixed duopoly (Stenbacka and Tombak, 2015; Laine and
Ma, 2017; Klumpp and Su, 2018)). One recent study by Stenbacka and
Tombak (2018) examines the effects of different market configuration (for-
profit monopoly and mixed duopoly) on quality provision and optimal re-
imbursement policy.7 This analysis uses horizontal (rather than vertical)
7They state that the socially optimal reimbursement policy is invariant to the intro-
7
differentiation for two reasons. First, we avoid heterogeneity in consumers’
preferences to make our analysis more tractable.8 However, we highlight
the importance of consumers’ marginal willingness-to-pay for quality in our
model. Second, there is strong empirical evidence that the traveling distance
is one of the main predictors of consumer’s choice of education or healthcare
provider (De Fraja and Iossa, 2002; Kessler and McClellan, 2000; Tay, 2003).
Both quality differentiation and market equilibria may differ largely depend-
ing on the assumptions made and the country one looks at. For instance,
Epple and Romano (1998) study the competition between public and pri-
vate schools in the US and obtain that the quality for the former is lower
compared to latter in equilibrium.9 On the contrary, Romero and Del Rey
(2004), focused on a mixed duopoly market in European higher education
market where public universities set higher admission standards and set al-
most zero tuition fees to maintain the quality of enrollments compared to
commercially-run institutions with price policy only.10
Empirically, there is strong evidence that competition has a positive impact
on the quality in education markets (Dee, 1998; Hoxby, 1994; Deming et al.,
2012). When the price is a choice variable, the scenario is mixed. Some stud-
ies find a positive relation between competition and quality in the healthcare
market (Cooper et al., 2011; Gaynor et al., 2013). However, a negative rela-
tionship between competition and quality is suggested by Grabowski (2004)
duction of for-profit competition with a premium quality directed towards high qualitypreference consumers.
8Hirth (1997) states ”with heterogeneous quality preferences, there would be severalsub-markets for different quality and cost combinations”.
9They stated that if an equilibrium exits, then it is hierarchical in terms of innateability and parent’s income
10Cremer and Maldonado (2013) study mixed oligopoly equilibria with private and pub-lic schools. They examine how the equilibrium allocation (quality, tuition fees and welfare)is affected by the presence of public schools and by their relative position in the qualityrange.
8
for nursing homes in the US. In England, Forder and Allan (2014) find that
competition reduces the quality for care homes for the elderly. Propper et al.
(2004); Burgess et al. (2008) find a positive relation between competition and
mortality rates for patients with heart attack in England.11
The theoretical framework for the analysis of the behavioural effects of co-
payment takes its point of departure from the demand side. In hospital
markets, empirical studies find either a very small or absence of any effect on
use from changes in the co-payment in Belgium, France and Sweden respec-
tively (Jakobsson and Svensson, 2016; Cockx and Brasseur, 2003; Chiappori
et al., 1998). On the contrary, Landsem and Magnussen (2018) concluded
that the introduction of a co-payment leads to an overall reduction of GP
visits of 10-15 percent in Norway. In the education market, a recent empirical
work on US public post-secondary institutions concludes that tuition cuts are
less effective per-dollar than the spending increases on college attainment, in
terms of degree completion and enrollment(Deming and Walters, 2017). Fur-
thermore, Baum et al. (2014) show that college quality has declined in US
due to a drastic decline in total-per student spending between 2000 and 2014
by 16 percent, even though the federal government has tripled expenditures
on Federal financial aid over the last two decades.12
The rest of the paper is organised as follows. In Section 2, we outline the
model, and in the subsequent section, we derive the equilibrium price and
quality under the assumption of sequential choices. In Section 4, we analyse
the effect of competition on quality provision and price; in addition, we study
the effects of changes in the state subsidy, co-payment fees and share of co-
11For a comprehensive survey on competition and quality in healthcare markets, see(Gaynor and Town, 2011)
12Spending cuts may reduce degree completion by harming the quality of instruction,while limiting the number and variety of course portfolio, increasing class size, or movingstudents into non-credit-bearing remedial courses (Bettinger and Long, 2009; Bahr, 2014)
9
payment on equilibrium outcomes. In Section 5, we consider two extensions:
direct provision information (public reporting) and relocation incentives for
the private provider. The paper is concluded in Section 6.
2 Model
We employ the standard Hotelling (1929) duopoly model in regulated markets
where consumers are uniformly distributed on the line segment L = [0, 1].
There are two providers indexed by j = 1, 2 and each chooses a quality level
qj. Provider 1 (provider 2) is the public (private) provider and located at
the left (right) endpoint of the line. As in D’Aspremont et al. (1979), we
use quadratic consumer transportation cost to avoid discontinuities in the
providers’ profit functions. Each consumer demands one unit of the product.
The utility of a consumer who is located at z ∈ L and getting a unit of the
product from provider j is given by: 13
Uj(z) =
U + βq1 − T − tz2, if public
U + βq2 − p2 − t(1− z)2, if private(1)
We assume U is so large that each customer consumes one unit of the prod-
uct. Consumers are identified by a parameter β > 0 that characterizes their
preferences over qualities. Given the utility function,∂Uj(z)
∂qj∂β> 0, a higher β
reflects a higher marginal willingness to pay for quality (consumers always
prefer higher quality). The parameter t > 0 reflects the degree of horizon-
tal product differentiation like the heterogeneity of services. An alternative
physical interpretation of t is a traveling cost parameter which includes all
13If each provider chooses a location xj ∈ L where we assume ∆ = x2− x1 and x2 ≥ x1, then [t∆] appears as a multiplicative term in all equilibrium functions. Accordingly, weused fixed locations to avoid redundancy (∆ = 1) as both parameters t and ∆ have exactlythe same effect.
10
monetary costs incurred while traveling to the location of the provider j. The
regulator sets the co-payment, T, and the public provider follows the level
of regulatory commitment. In the absence of price as a strategic variable for
the public provider, the private provider has both quality and price choices.
Accordingly, p2 is endogenous in our model compared to exogenous product
price for the public provider. Marginal utility of income is constant and same
for all consumers. Hence, the income distribution has no impact on our re-
sults. Given that U in Equation (1) is assumed to be equal for all consumers,
the location z of the consumer who is indifferent between buying the service
from either provider is solved by: βq1−T − tz2 = βq2− p2− t(1− z)2. With
a uniform distribution of consumers, demand faced by the public provider
and the private provider is D1 = z and D2 = 1− z, respectively. Hence, the
market share for the public provider is given by
D1 =t+ p2 − T − β(q2 − q1)
2t(2)
Accordingly, the private provider gets the remainder of the consumers: D2 =
1−D1.
We assume that output (denoted Dj) and quality (denoted qj) are separable
in costs. Apart from considering fixed costs, the cost function is given by: 14
C(Dj, qj) = cDj +k
2q2j (3)
The costs are linear in the output and convex in quality Cq > 0, Cqq > 0
and Cq=0 ≡ cDj. Accordingly, we assume the marginal cost of production
(denoted c) is constant. In addition, k > 0 is a cost parameter related
to quality investment. The government transfers state subsidy to the pub-
lic provider per each unit demand of the consumer for the service, denoted
λ. We assume both parameters T and λ are exogenous (regulated) in our
14This model setting is a widely used assumption in the literature (Economides, 1989;Barros and Martinez-Giralt, 2002; Calem and Rizzo, 1995; Brekke et al., 2006)
11
model. Furthermore, we make the following parameter assumptions: T ≤ c
and T + λ > c. The former explains that consumers pay at most the fees
equal to the marginal cost of production. The latter asserts that the total
price received by the public provider (p1 = λ+ T ) is strictly higher than the
marginal cost.
In order to ensure non-negative profits for the public provider, we assume it
receives a lump sum-transfer (philanthropic source of finance or a block grant
that does not affect the provider’s actions) from the government, denoted B.
The profits of the provider j is given by
πj =
B + (p1 − c)D1 − k2q2
1, if public
(p2 − c)D2 − k2q2
2, if private(4)
The objective function of the public provider reflects an additional element,
namely, altruistic preferences. As there will be no perfect alignment with
the social planner, the degree of motivation for the public is assumed to
enter directly in the objective function.15 Hence, the public provider maxi-
mizes profits in addition to certain level of altruism, denoted by α, towards
the quality offered to consumers.16 Consequently, the payoff of the public
provider is given by
W = π1 + α
∫ D1
0
(U + βq1)dy (5)
In our framework, the private provider potentially differs from the public
provider along two different dimensions: profit orientation (for-profits have
15In public sector, literature on motivated agents shows that they have no perfectalignment with the objective function of the principals (Francois and Vlassopoulos, 2008;Makris, 2009; Prendergast, 2007)
16Tonin and Vlassopoulos (2010) disclose an experimental evidence of altruistic prefer-ences.
12
profit margin goals) and p2 as a choice variable. To better facilitate a com-
parison with the benchmark model, we consider both providers share the
same objective function, namely profit maximization. Later, we assess how
the degree of motivation for the public provider impacts the equilibrium out-
comes.
We use a spatial competition framework to study the effect of more com-
petition (reduction in a traveling cost parameter, t) on quality provision in
a two-stage game. In addition, we study the relationship between average
quality and changes in the state subsidy and co-payment fees. For the main
part of the analysis, we allow for sequential choices where quality is treated
more as a long term variable.17 We consider the following two-stage game:
• Stage 1: Both providers simultaneously choose q1 and q2
• Stage 2: The private provider chooses the price level p2.
This sequence of moves is widely used in the literature. The existing theo-
retical models consider price choice in the second stage where both providers
obtain the price set for a given pair of quality levels (q1,q2) respectively. This
kind of Bertrand competition differs from our model because only the pub-
lic provider is facing a fixed product price. To our knowledge, the present
paper is the first attempt to analyze competition in such settings. Later, we
extend our model in two dimensions: First, we check if the private provider
has an incentive to relocate unilaterally towards the public provider. Second,
we examine the impact of more public reporting on the quality provision in
equilibrium.
17Our results hold regardless of whether quality and price decisions are made simulta-neously or sequentially
13
3 Nash Equilibrium
We start out by deriving the Nash Equilibrium for a given p1 (regulated) in
order to analyze how the providers’ choices of quality and price are deter-
mined under symmetric locations. As usual, the game is solved by backward
induction.
3.1 Optimal Private Price
First, we discuss the optimal price for the private provider in the second stage
of the game. For a given pair of quality levels, the optimal price is computed
by taking the first-order condition in Equation (4) which yields: 18
p2 =T + c+ t+ β(q2 − q1)
2(6)
Co-payment fees (T ), marginal cost of production (c) and the transporta-
tion costs (t) have direct (positive) effects on the optimal price for the private
provider. If we consider t as product space interpretation of horizontal dif-
ferentiation, all else equal, the private provider responds to increase p2 if the
market faces higher level of heterogeneity in the services offered. Moreover,
the optimal price depends on the quality difference (q2 − q1). All else equal,
the higher q2 is relative to q1, the higher is the price, p2. We see that the
optimal price and rival’s quality are strategic substitutes (∂p2∂q1
< 0).
3.2 Quality Competition
We consider the equilibrium in the first stage of the game. Both providers
choose simultaneously the quality levels in anticipation of the optimal price
for the private provider. Substituting Equation (6) into Equation (4) and
18Second order condition satisfies the global maximum criterion ∂2π2
∂p22< 0.
14
maximizing Equations (4-5) with respect to quality levels (∂W∂q1
= 0, ∂π2∂q2
= 0)
yields the first -order conditions for provider 1 and 2 which implicitly de-
fine best response functions q1(q2) and q2(q1) respectively. The second order
conditions (∂2W∂q21
< 0 and ∂2π2∂q22
< 0) are always satisfied for: 2kt > αβ2 and
4kt > β2. Moreover, uniqueness and stability of the equilibrium is confirmed
by the positive sign of the Jacobian if:19 α < 4kt(4kt−β2)β2(8kt−β2)
.
The best response functions q1(q2) and q2(q1) are given by
q1(q2) = β(T + λ− c) + α(3t+ c+ U − T − βq2)
2(2kt− αβ2)(7)
q2(q1) = β(T − c+ t− βq1)
4kt− β2(8)
Quality is optimal when the marginal benefit from increased demand equals
the marginal cost of quality provision. The nature of strategic interaction in
q1(q2) behaves differently as it depends on the degree of altruism (∂q1∂q2
< (=)0
if α > (=)0). First, if α = 0, neither marginal revenue nor marginal cost
for the public provider depends on q2, the quality of the private provider.20
Hence, q1 is strategically independent of q2 when both providers are pure
profit-maximisers. Second, if α > 0, the public provider has marginal non-
financial benefit from aggregate consumer utility as an additional term. The
marginal payoff of quality is increasing in α. A marginal revenue of quality
increase is captured by two effects in the following term
19 ∂2W∂q21
∂2π2
∂q22− ∂2W
∂q1∂q2∂2π2
∂q1∂q2= (β2−4kt)(αβ2−2kt)
8t2 − αβ4
16t2 > 0.20MR=(T + λ− c) ∂D1
∂q1= (T+λ−c)β
2t and MC=kq1
15
α
(βD1 + (U + βq1)
∂D1
∂q1
)The first term shows the existing consumers get higher utility and it is known
as the ”inframarginal” utility increase. The second term is the marginal util-
ity increase which captures the utility of new consumers. Nevertheless, the
inframarginal utility increase is affected by q2. The demand of the public
provider (D1) is decreasing in q2. A higher q2 leads to lower D1 which means
fewer consumers benefit from an increase in q1. When the public provider is
altruistic (α > 0), this reduces the marginal benefit of quality investments.
Accordingly, all else equal, higher q2 leads to lower q1.
The best response function q2(q1) has an inverse relation with rival’s quality∂q2(q1)∂q1
= − β2
4kt−β2 < 0. This strategic interaction holds true at any degree
of altruism. Higher q1 leads to lower D2, which, in return, makes the de-
mand more price elastic. A lower p2 leads to lower q2 (price and quality are
complementary strategies). Notice that regardless the level of α, q1(q2) is
monotonically increasing in the state subsidy while this parameter (λ) does
not appear in q2(q1).
If the Subgame Perfect Nash Equilibrium is an interior solution, the equilib-
rium outcome is given by
q∗1 = β(T + λ− c)(4kt− β2) + αθ
4kt(4kt− β2)− αβ2(8kt− β2)(9)
q∗2 = β(T − c)(4kt− β2) + 4kt2 − β2λ− αφ
4kt(4kt− β2)− αβ2(8kt− β2)(10)
p∗2 =2kt[(4kt− β2)(T + c) + 4kt2 − λβ2]− αµ
4kt(4kt− β2)− αβ2(8kt− β2)(11)
16
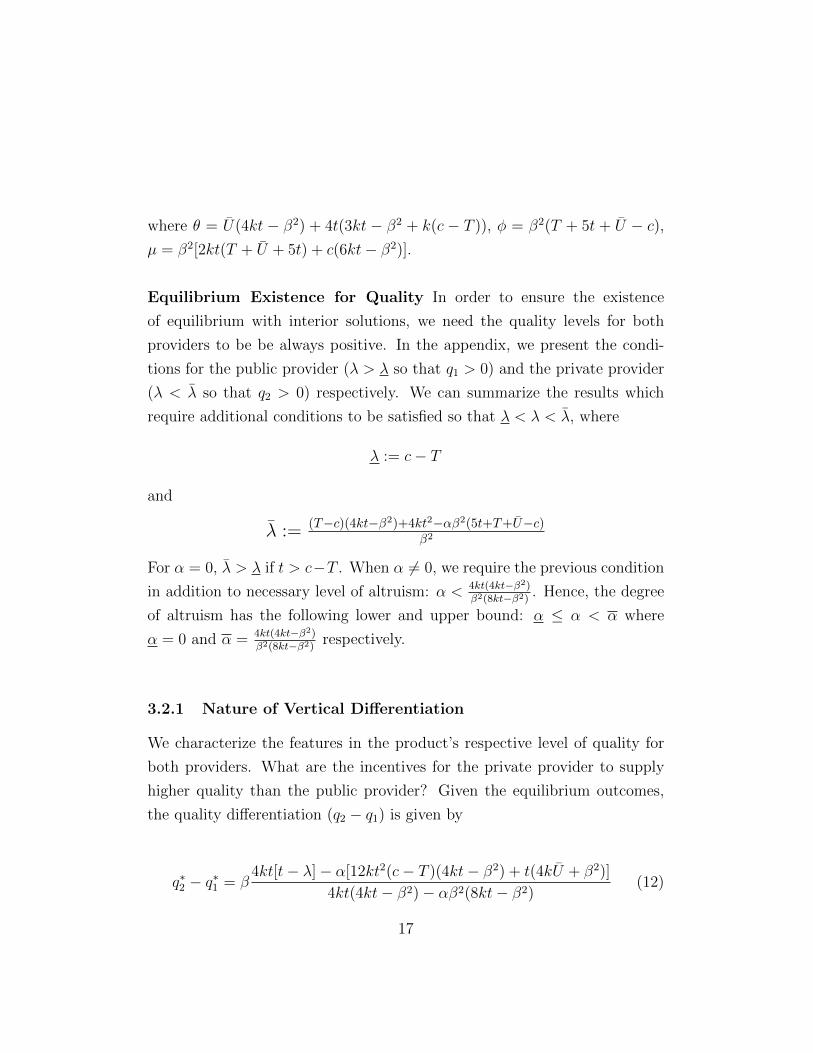
where θ = U(4kt − β2) + 4t(3kt − β2 + k(c − T )), φ = β2(T + 5t + U − c),µ = β2[2kt(T + U + 5t) + c(6kt− β2)].
Equilibrium Existence for Quality In order to ensure the existence
of equilibrium with interior solutions, we need the quality levels for both
providers to be be always positive. In the appendix, we present the condi-
tions for the public provider (λ > λ so that q1 > 0) and the private provider
(λ < λ so that q2 > 0) respectively. We can summarize the results which
require additional conditions to be satisfied so that λ < λ < λ, where
λ := c− T
and
λ := (T−c)(4kt−β2)+4kt2−αβ2(5t+T+U−c)β2
For α = 0, λ > λ if t > c−T . When α 6= 0, we require the previous condition
in addition to necessary level of altruism: α < 4kt(4kt−β2)β2(8kt−β2)
. Hence, the degree
of altruism has the following lower and upper bound: α ≤ α < α where
α = 0 and α = 4kt(4kt−β2)β2(8kt−β2)
respectively.
3.2.1 Nature of Vertical Differentiation
We characterize the features in the product’s respective level of quality for
both providers. What are the incentives for the private provider to supply
higher quality than the public provider? Given the equilibrium outcomes,
the quality differentiation (q2 − q1) is given by
q∗2 − q∗1 = β4kt[t− λ]− α[12kt2(c− T )(4kt− β2) + t(4kU + β2)]
4kt(4kt− β2)− αβ2(8kt− β2)(12)
17

Proposition 1: (i) If the public provider is a profit-maximiser, the private
provider offers higher (lower) quality in equilibrium than the public if the
degree of product differentiation is sufficiently large (small) relative to the
state subsidy. (ii) The presence of altruism reduces the scope for the private
provider to have higher quality provision than the public provider in equilib-
rium.
Proof: (i) If α = 0, the numerator in (12) reduces to β(t − λ) which is
positive if t > λ. Thus, if α = 0, q∗2 > q∗1 if t > λ. (ii) In the presence of
altruism, the statement is true if the second square bracket is positive, which
follows immediately from (12). To put differently, there exists a threshold t
where t > λ such that q∗2 > q∗1 if t > t . Conversely, q∗2 < q∗1 if t < t. �
The first part of Proposition 1 shows that if both providers are profit ori-
ented, the public provider is the high-quality provider if t < λ. A large
λ increases the marginal revenue of quality for the public provider (higher
q1). Due to strategic substitutability (∂q2∂q1
< 0), it leads to lower q2. There-
fore, the incentive for the private to supply higher quality than the public
provider is reinforced if the amount of state subsidy received by the regulator
is sufficiently small. In the presence of altruism, the intuition is straightfor-
ward. A high level of motivation towards the quality (α > 0) increases the
marginal revenue of quality (higher q1), which, in return, lowers q2 due to
strategic substitution. Therefore, if α > 0, the quality of the public provider
dominates for a larger set of parameters.
4 Effects of Competition and Regulatory Tools
The impact of more competition (measured by a reduction in transportation
costs) on quality is clear when prices are regulated. Competition leads to
more quality when price is above marginal cost. In our framework, the public
18
provider only chooses the quality for a given regulated price. On the contrary,
the private provider chooses both quality and price. Hence, more competi-
tion makes demand more responsive to changes in qualities and prices. This
generates two effects on the incentives for quality provision: one direct and
one indirect. For a given price, the provider has an incentive to increase
its quality provision in order to attract more consumers, who are now more
responsive to such a quality increase. This is the direct effect. On the other
hand, since more competition also makes consumers more response to price
changes, the private provider has an incentive to reduce the price. However,
a price reduction reduces the private provider’s profit margin, and therefore
reduces the provider’s incentive to attract more demand by increasing qual-
ity. In other words, a lower price reduces the provider’s return to quality
investments. This indirect effect counteracts the aforementioned direct ef-
fect and makes the relationship between competition and quality provision
a priori ambiguous for the private provider. In our framework, if the public
provider is committed to follow a regulated price, p1, does more competition
induce providers to offer higher-quality services?
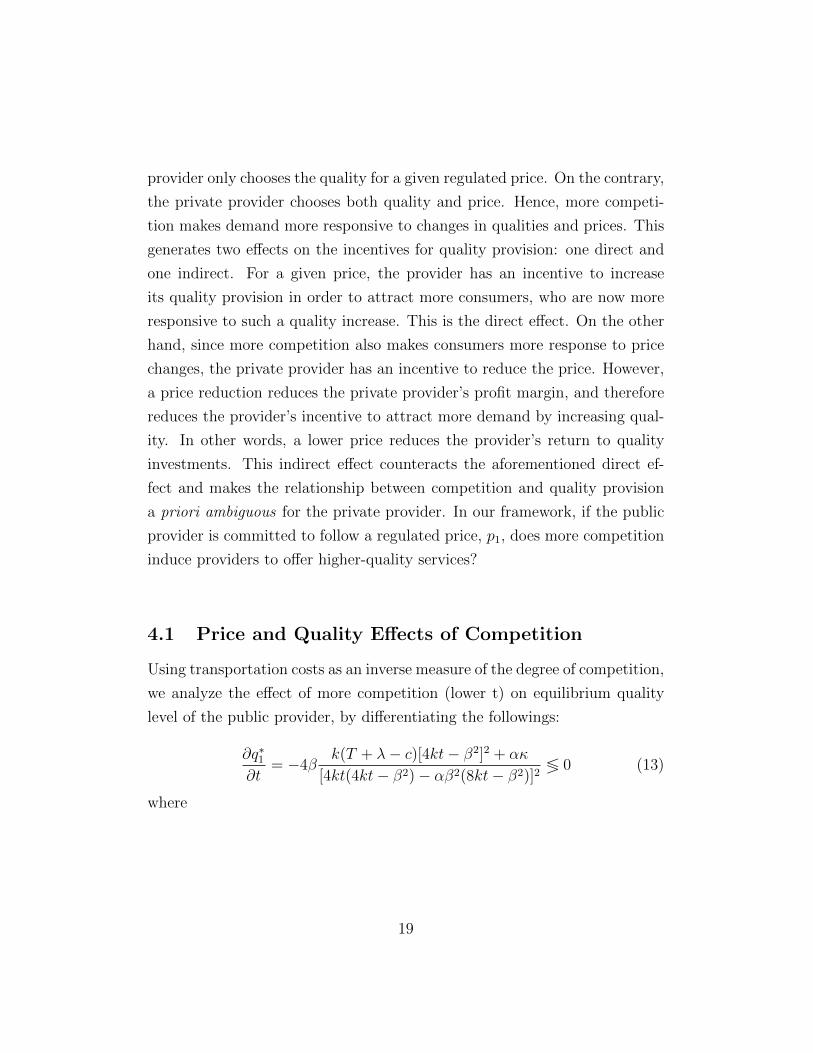
4.1 Price and Quality Effects of Competition
Using transportation costs as an inverse measure of the degree of competition,
we analyze the effect of more competition (lower t) on equilibrium quality
level of the public provider, by differentiating the followings:
∂q∗1∂t
= −4βk(T + λ− c)[4kt− β2]2 + ακ
[4kt(4kt− β2)− αβ2(8kt− β2)]2≶ 0 (13)
where
19
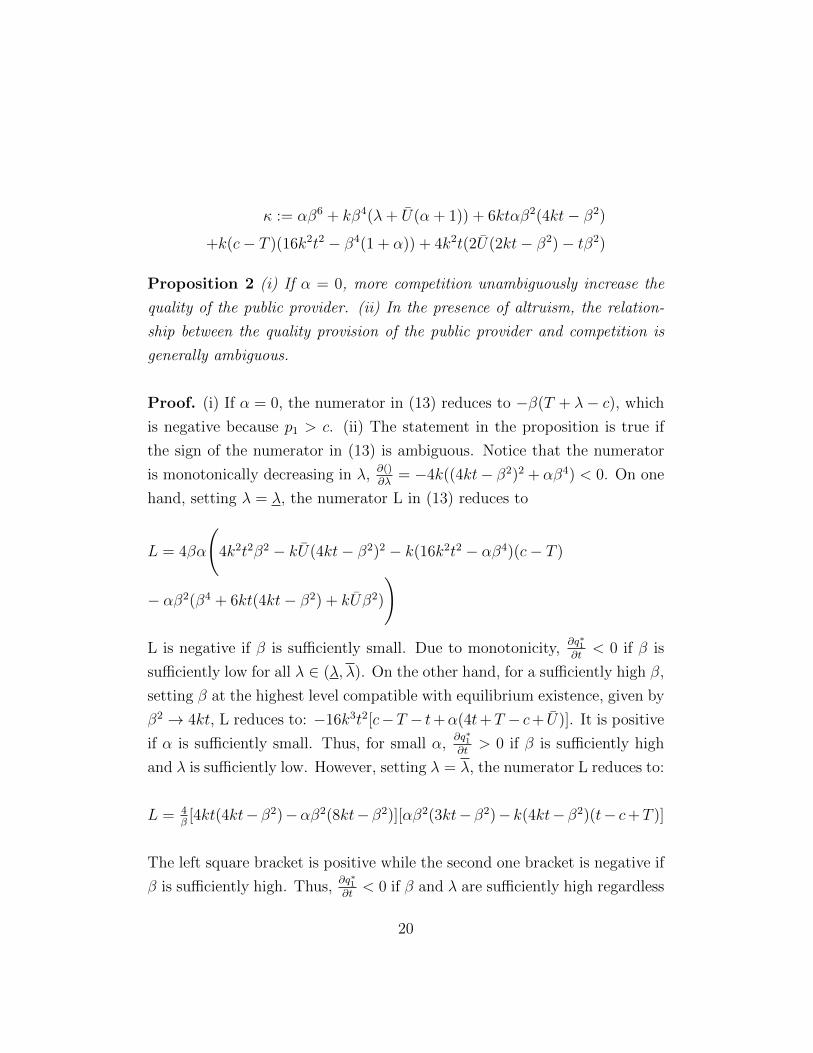
κ := αβ6 + kβ4(λ+ U(α + 1)) + 6ktαβ2(4kt− β2)
+k(c− T )(16k2t2 − β4(1 + α)) + 4k2t(2U(2kt− β2)− tβ2)
Proposition 2 (i) If α = 0, more competition unambiguously increase the
quality of the public provider. (ii) In the presence of altruism, the relation-
ship between the quality provision of the public provider and competition is
generally ambiguous.
Proof. (i) If α = 0, the numerator in (13) reduces to −β(T + λ− c), which
is negative because p1 > c. (ii) The statement in the proposition is true if
the sign of the numerator in (13) is ambiguous. Notice that the numerator
is monotonically decreasing in λ, ∂()∂λ
= −4k((4kt− β2)2 + αβ4) < 0. On one
hand, setting λ = λ, the numerator L in (13) reduces to
L = 4βα
(4k2t2β2 − kU(4kt− β2)2 − k(16k2t2 − αβ4)(c− T )
− αβ2(β4 + 6kt(4kt− β2) + kUβ2)
)
L is negative if β is sufficiently small. Due to monotonicity,∂q∗1∂t
< 0 if β is
sufficiently low for all λ ∈ (λ, λ). On the other hand, for a sufficiently high β,
setting β at the highest level compatible with equilibrium existence, given by
β2 → 4kt, L reduces to: −16k3t2[c−T − t+α(4t+T − c+ U)]. It is positive
if α is sufficiently small. Thus, for small α,∂q∗1∂t
> 0 if β is sufficiently high
and λ is sufficiently low. However, setting λ = λ, the numerator L reduces to:
L = 4β[4kt(4kt−β2)−αβ2(8kt−β2)][αβ2(3kt−β2)− k(4kt−β2)(t− c+T )]
The left square bracket is positive while the second one bracket is negative if
β is sufficiently high. Thus,∂q∗1∂t< 0 if β and λ are sufficiently high regardless
20
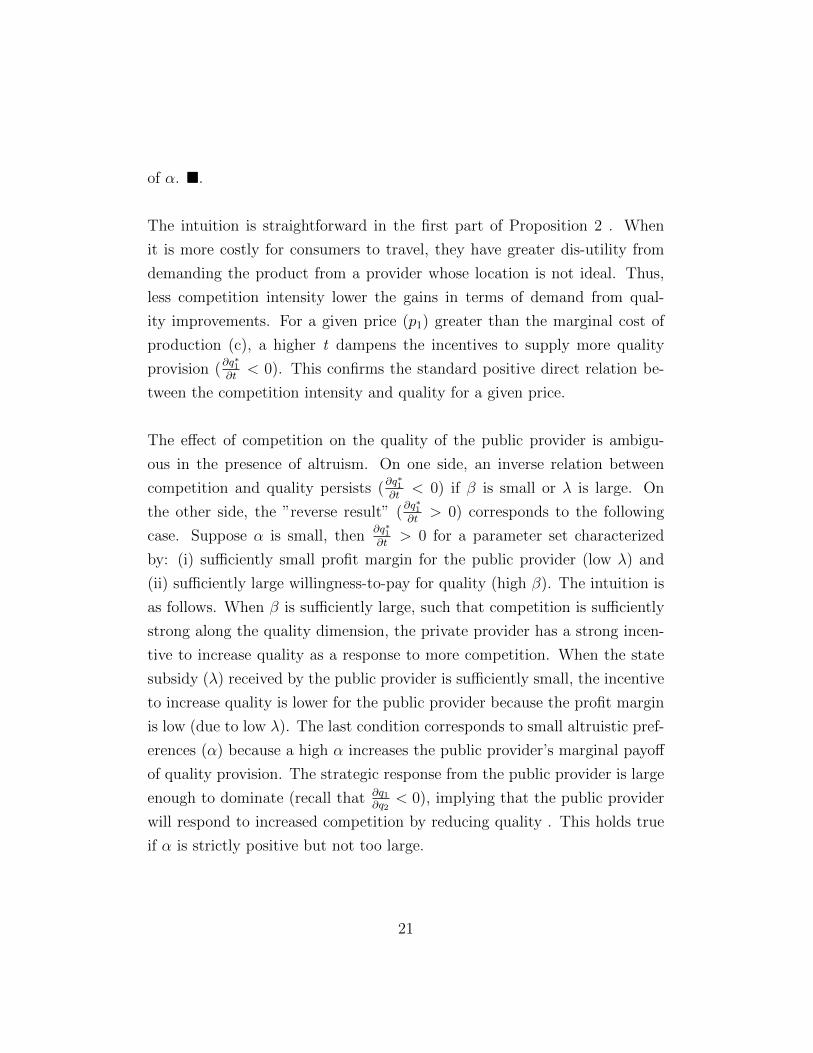
of α. �.
The intuition is straightforward in the first part of Proposition 2 . When
it is more costly for consumers to travel, they have greater dis-utility from
demanding the product from a provider whose location is not ideal. Thus,
less competition intensity lower the gains in terms of demand from qual-
ity improvements. For a given price (p1) greater than the marginal cost of
production (c), a higher t dampens the incentives to supply more quality
provision (∂q∗1∂t
< 0). This confirms the standard positive direct relation be-
tween the competition intensity and quality for a given price.
The effect of competition on the quality of the public provider is ambigu-
ous in the presence of altruism. On one side, an inverse relation between
competition and quality persists (∂q∗1∂t
< 0) if β is small or λ is large. On
the other side, the ”reverse result” (∂q∗1∂t
> 0) corresponds to the following
case. Suppose α is small, then∂q∗1∂t
> 0 for a parameter set characterized
by: (i) sufficiently small profit margin for the public provider (low λ) and
(ii) sufficiently large willingness-to-pay for quality (high β). The intuition is
as follows. When β is sufficiently large, such that competition is sufficiently
strong along the quality dimension, the private provider has a strong incen-
tive to increase quality as a response to more competition. When the state
subsidy (λ) received by the public provider is sufficiently small, the incentive
to increase quality is lower for the public provider because the profit margin
is low (due to low λ). The last condition corresponds to small altruistic pref-
erences (α) because a high α increases the public provider’s marginal payoff
of quality provision. The strategic response from the public provider is large
enough to dominate (recall that ∂q1∂q2
< 0), implying that the public provider
will respond to increased competition by reducing quality . This holds true
if α is strictly positive but not too large.
21
For the private provider, the effect of more competition on equilibrium quality
is given by:
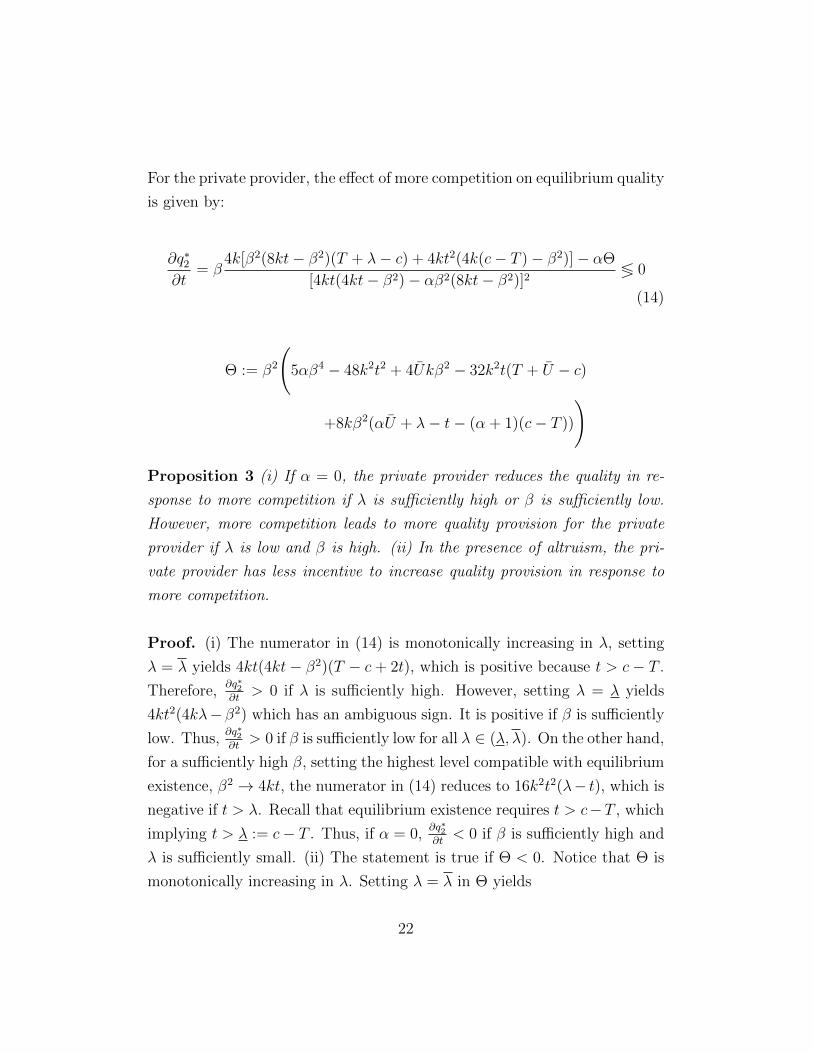
∂q∗2∂t
= β4k[β2(8kt− β2)(T + λ− c) + 4kt2(4k(c− T )− β2)]− αΘ
[4kt(4kt− β2)− αβ2(8kt− β2)]2≶ 0
(14)
Θ := β2
(5αβ4 − 48k2t2 + 4Ukβ2 − 32k2t(T + U − c)
+8kβ2(αU + λ− t− (α + 1)(c− T ))
)
Proposition 3 (i) If α = 0, the private provider reduces the quality in re-
sponse to more competition if λ is sufficiently high or β is sufficiently low.
However, more competition leads to more quality provision for the private
provider if λ is low and β is high. (ii) In the presence of altruism, the pri-
vate provider has less incentive to increase quality provision in response to
more competition.
Proof. (i) The numerator in (14) is monotonically increasing in λ, setting
λ = λ yields 4kt(4kt− β2)(T − c+ 2t), which is positive because t > c− T .
Therefore,∂q∗2∂t
> 0 if λ is sufficiently high. However, setting λ = λ yields
4kt2(4kλ−β2) which has an ambiguous sign. It is positive if β is sufficiently
low. Thus,∂q∗2∂t> 0 if β is sufficiently low for all λ ∈ (λ, λ). On the other hand,
for a sufficiently high β, setting the highest level compatible with equilibrium
existence, β2 → 4kt, the numerator in (14) reduces to 16k2t2(λ− t), which is
negative if t > λ. Recall that equilibrium existence requires t > c−T , which
implying t > λ := c− T . Thus, if α = 0,∂q∗2∂t< 0 if β is sufficiently high and
λ is sufficiently small. (ii) The statement is true if Θ < 0. Notice that Θ is
monotonically increasing in λ. Setting λ = λ in Θ yields
22
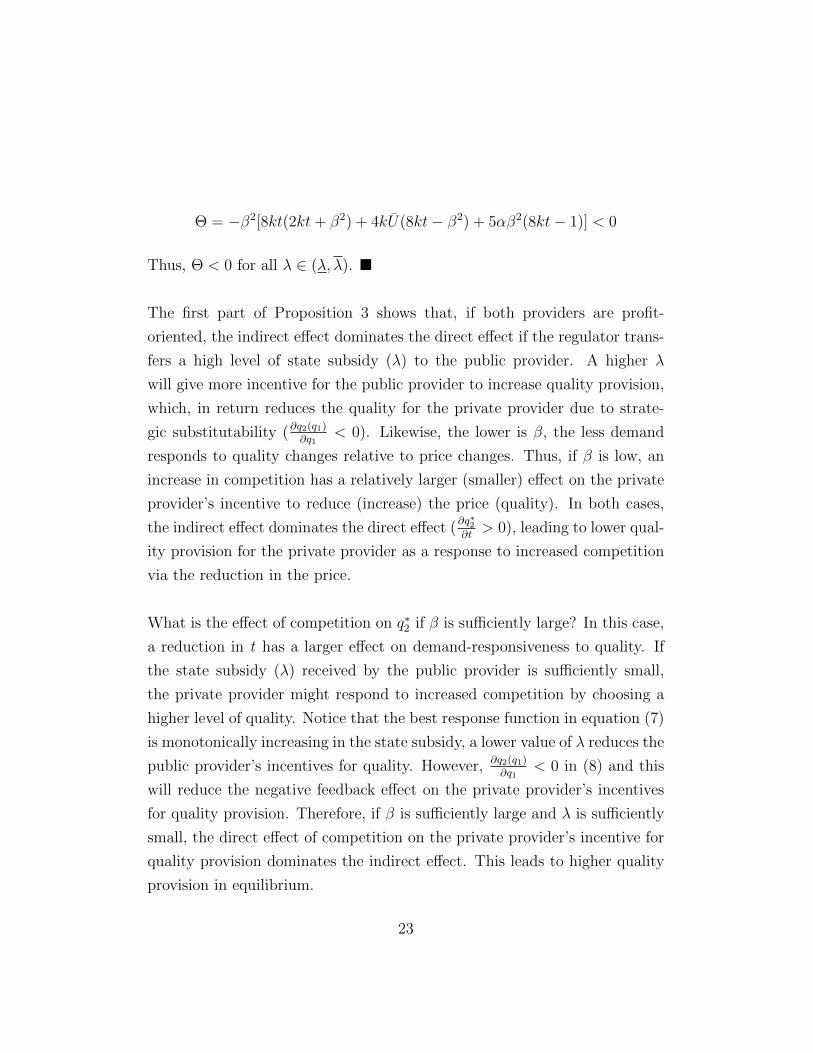
Θ = −β2[8kt(2kt+ β2) + 4kU(8kt− β2) + 5αβ2(8kt− 1)] < 0
Thus, Θ < 0 for all λ ∈ (λ, λ). �
The first part of Proposition 3 shows that, if both providers are profit-
oriented, the indirect effect dominates the direct effect if the regulator trans-
fers a high level of state subsidy (λ) to the public provider. A higher λ
will give more incentive for the public provider to increase quality provision,
which, in return reduces the quality for the private provider due to strate-
gic substitutability (∂q2(q1)∂q1
< 0). Likewise, the lower is β, the less demand
responds to quality changes relative to price changes. Thus, if β is low, an
increase in competition has a relatively larger (smaller) effect on the private
provider’s incentive to reduce (increase) the price (quality). In both cases,
the indirect effect dominates the direct effect (∂q∗2∂t> 0), leading to lower qual-
ity provision for the private provider as a response to increased competition
via the reduction in the price.
What is the effect of competition on q∗2 if β is sufficiently large? In this case,
a reduction in t has a larger effect on demand-responsiveness to quality. If
the state subsidy (λ) received by the public provider is sufficiently small,
the private provider might respond to increased competition by choosing a
higher level of quality. Notice that the best response function in equation (7)
is monotonically increasing in the state subsidy, a lower value of λ reduces the
public provider’s incentives for quality. However, ∂q2(q1)∂q1
< 0 in (8) and this
will reduce the negative feedback effect on the private provider’s incentives
for quality provision. Therefore, if β is sufficiently large and λ is sufficiently
small, the direct effect of competition on the private provider’s incentive for
quality provision dominates the indirect effect. This leads to higher quality
provision in equilibrium.
23

The main idea behind the second part of Proposition 3 is that higher α
reinforces the public provider to increase quality as a response to more com-
petition (marginal payoff of quality is increasing in α). Due to strategic
substitutability (∂q2∂q1
< 0), it will increase the ”probability” that the private
provider dampens quality provision in response to increased competition.
For the private provider, the effect of more competition on the equilibrium
price is given by:
∂p∗2∂t
= 2k16k2t2(2t(2kt− β2) + λβ2) + α%
[4kt(4kt− β2)− αβ2(8kt− β2)]2(15)
% := β2
(αβ4(c− T )− β4λ+ 10αtβ2(4kt− β2)
+32kt2(β2 − 2kt) + (c− T )(4kt− β2)2 + U(16k2t2 − αβ4)
)
Proposition 4 (i) If α = 0, the private provider reduces the price in re-
sponse to more competition if λ is sufficiently high or β is sufficiently low.
However, more competition leads to higher price for the private provider if
λ is low and β is high. (ii) The scope for a price reduction by the private
provider in response to more competition is larger in the presence of altruism.
Proof. (i) If α = 0, the numerator in (15) reduces to: 2t(2kt−β2) +λβ2. It
is monotonically increasing in λ, setting λ = λ yields 2k(T − c + 2t), which
is positive because t > c − T . Therefore,∂p∗2∂t
> 0 if λ is sufficiently high.
However, setting λ = λ yields 2k[β2(c − T ) + 2t(2kt − β2)] which has an
ambiguous sign. It is positive if β is sufficiently low. Thus,∂p∗2∂t
> 0 if β is
sufficiently low for all λ ∈ (λ, λ). On the other hand, for a sufficiently high β,
24
setting the highest level compatible with equilibrium existence, β2 → 4kt, the
numerator in (15) reduces to −4kt(t− λ), which is negative if t > λ. Recall
that equilibrium existence requires t > c−T , which implying t > λ := c−T .
Thus, if α = 0,∂p∗2∂t
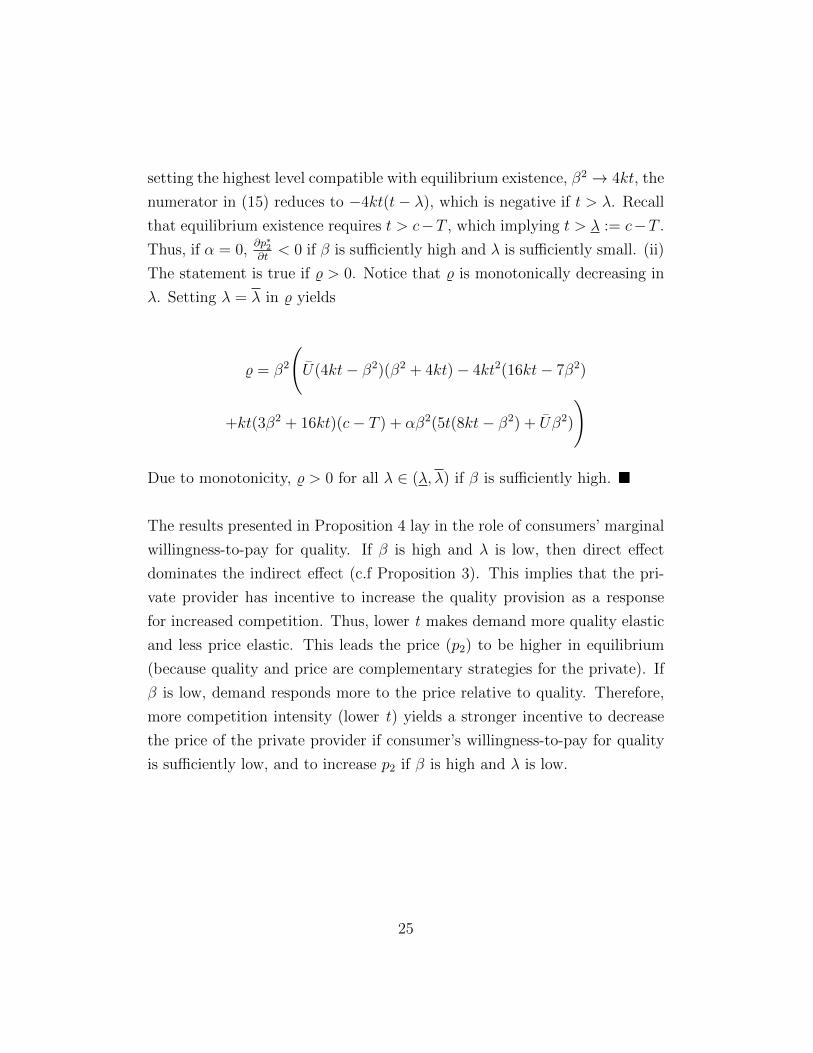
< 0 if β is sufficiently high and λ is sufficiently small. (ii)
The statement is true if % > 0. Notice that % is monotonically decreasing in
λ. Setting λ = λ in % yields
% = β2
(U(4kt− β2)(β2 + 4kt)− 4kt2(16kt− 7β2)
+kt(3β2 + 16kt)(c− T ) + αβ2(5t(8kt− β2) + Uβ2)
)
Due to monotonicity, % > 0 for all λ ∈ (λ, λ) if β is sufficiently high. �
The results presented in Proposition 4 lay in the role of consumers’ marginal
willingness-to-pay for quality. If β is high and λ is low, then direct effect
dominates the indirect effect (c.f Proposition 3). This implies that the pri-
vate provider has incentive to increase the quality provision as a response
for increased competition. Thus, lower t makes demand more quality elastic
and less price elastic. This leads the price (p2) to be higher in equilibrium
(because quality and price are complementary strategies for the private). If
β is low, demand responds more to the price relative to quality. Therefore,
more competition intensity (lower t) yields a stronger incentive to decrease
the price of the private provider if consumer’s willingness-to-pay for quality
is sufficiently low, and to increase p2 if β is high and λ is low.
25
4.1.1 Average Quality
In this section, we evaluate whether the average quality will increase in
response to more competition. When both providers are profit oriented,
under certain conditions, the indirect effect dominates the direct effect for
the private provider (∂q∗2∂t
> 0) while more competition always gives an
incentive for the public provider to increase quality provision in equilib-
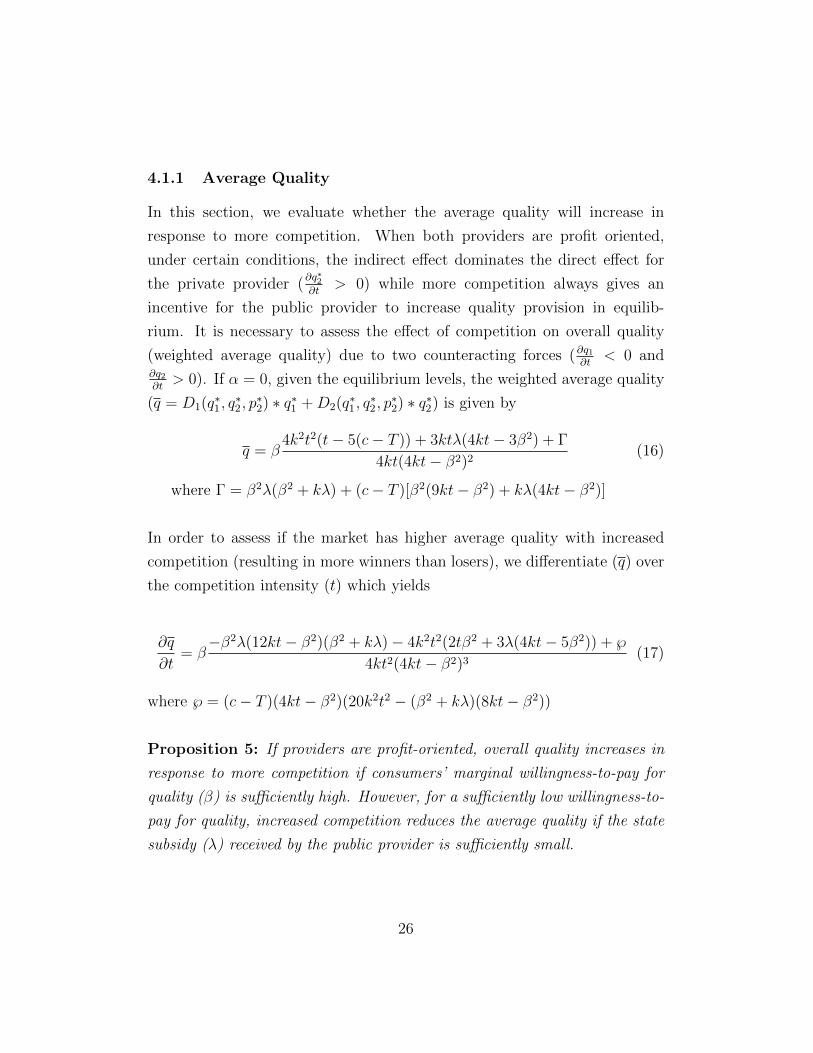
rium. It is necessary to assess the effect of competition on overall quality
(weighted average quality) due to two counteracting forces (∂q1∂t
< 0 and∂q2∂t> 0). If α = 0, given the equilibrium levels, the weighted average quality
(q = D1(q∗1, q∗2, p∗2) ∗ q∗1 +D2(q∗1, q
∗2, p∗2) ∗ q∗2) is given by
q = β4k2t2(t− 5(c− T )) + 3ktλ(4kt− 3β2) + Γ
4kt(4kt− β2)2(16)
where Γ = β2λ(β2 + kλ) + (c− T )[β2(9kt− β2) + kλ(4kt− β2)]
In order to assess if the market has higher average quality with increased
competition (resulting in more winners than losers), we differentiate (q) over
the competition intensity (t) which yields
∂q
∂t= β−β2λ(12kt− β2)(β2 + kλ)− 4k2t2(2tβ2 + 3λ(4kt− 5β2)) + ℘
4kt2(4kt− β2)3(17)
where ℘ = (c− T )(4kt− β2)(20k2t2 − (β2 + kλ)(8kt− β2))
Proposition 5: If providers are profit-oriented, overall quality increases in
response to more competition if consumers’ marginal willingness-to-pay for
quality (β) is sufficiently high. However, for a sufficiently low willingness-to-
pay for quality, increased competition reduces the average quality if the state
subsidy (λ) received by the public provider is sufficiently small.
26

Proof: The sign of (17) is determined by the sign of the numerator. If β
is sufficiently high, setting 4kt→ β2, the numerator reduces to −32k3t2(t−λ)2 < 0. Thus, ∂q
∂t< 0 if β is sufficiently high. The partial derivative of the
numerator with respect to λ yields
∂()
∂λ=
(− β4
(12kt− β2
)− 12k2t2
(4kt− 5β2
)− 2kβ2λ
(12kt− β2
)−k (c− T )
(4kt− β2
) (8kt− β2
))
∂()∂λ
< 0 if β is sufficiently low. In this case, the numerator is monoton-
ically decreasing in λ. Otherwise, for sufficiently high β, setting 4kt →β2, reduces to: 64k3t2(t − λ) which has an ambiguous sign. It is posi-
tive (negative) if t > λ (t < λ). Setting λ = λ in the numerator yields4ktβ2 (4kt−β2)2(T−c+t)(β2+k(c−T−6t)) < 0 regardless if β is high or low. On
the other hand, setting λ = λ yields 8k2t2 (T − c+ t) (4k(c− T )− β2) ≶ 0.
It is positive if β is sufficiently low. Thus, ∂q∂t> 0 if β and λ are sufficiently
small. �
The intuition is simple. A reduction in t has a larger effect on demand-
responsiveness to quality the larger β is. Thus, the intensity of quality com-
petition is strong when consumer’s marginal willingness-to-pay for quality is
high. Both providers will have a strong incentive to increase quality as a
response to more competition. In sum, this leads to higher average quality.
On the contrary, if β is low, the private provider will reduce quality in re-
sponse to increased competition (c.f Proposition 3). Moreover, the role of
state subsidy (λ) is essential to the profit margin for the public provider. If
λ is low, the public provider has weak incentives for quality incentives due
to tight profit margin. Hence, a reduction in quality for the private provider
(because the indirect effect dominates the direct effect ∂q2∂t
> 0) outweighs
27
weak incentive (small positive effect) for the public provider. The overall
effect, though, is a decrease in the equilibrium average quality in response to
increased competition.
In the presence of altruism, the function is so tedious. In the Appendix, we
provide a numerical example to tackle the effect of competition on average
quality if α > 0. We encounter, given the space restrictions, that average
quality increases in response to more competition if the direct effect domi-
nates the indirect effect.
4.2 Key Policy Instruments - Regulatory Tools
In this section, we analyze the role of the social planner who controls the
regulatory tools: state subsidy and copayment fees. Thus, we study the ef-
fect of an increase in each of the key policy instruments on the equilibrium
quality and price levels. How do regulatory tools affect quality competition
and average quality under profit orientation or altruistic preferences?
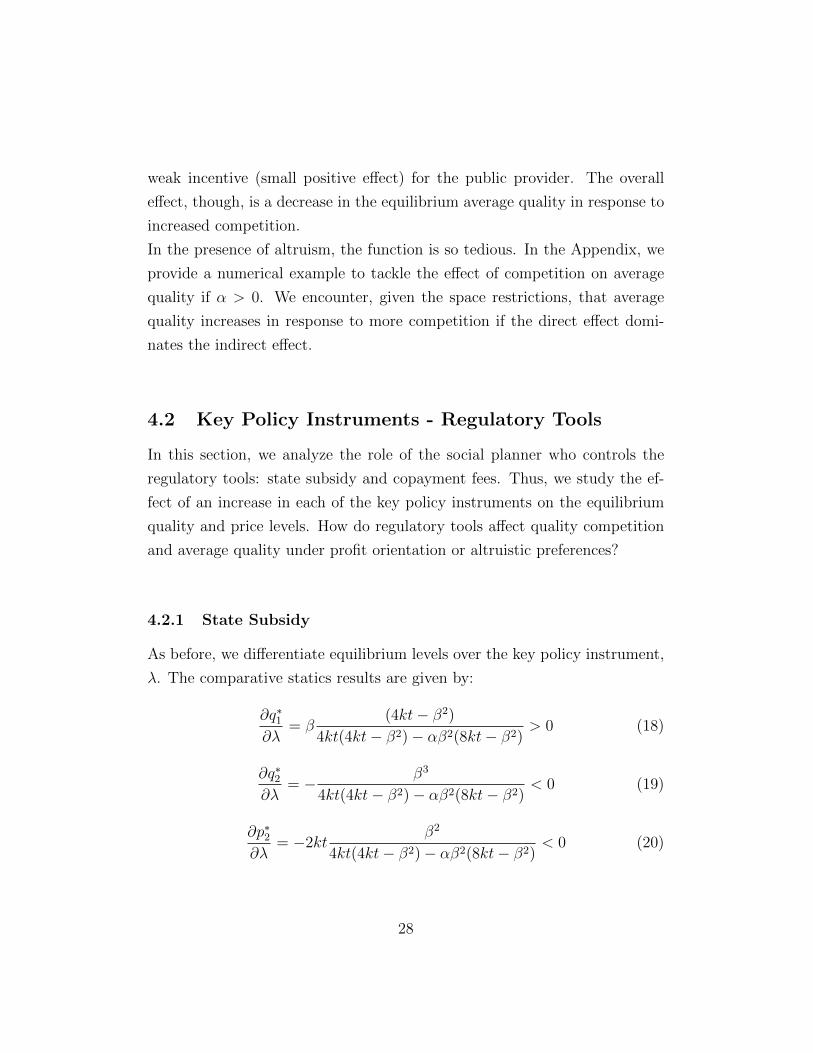
4.2.1 State Subsidy
As before, we differentiate equilibrium levels over the key policy instrument,
λ. The comparative statics results are given by:
∂q∗1∂λ
= β(4kt− β2)
4kt(4kt− β2)− αβ2(8kt− β2)> 0 (18)
∂q∗2∂λ
= − β3
4kt(4kt− β2)− αβ2(8kt− β2)< 0 (19)
∂p∗2∂λ
= −2ktβ2
4kt(4kt− β2)− αβ2(8kt− β2)< 0 (20)
28
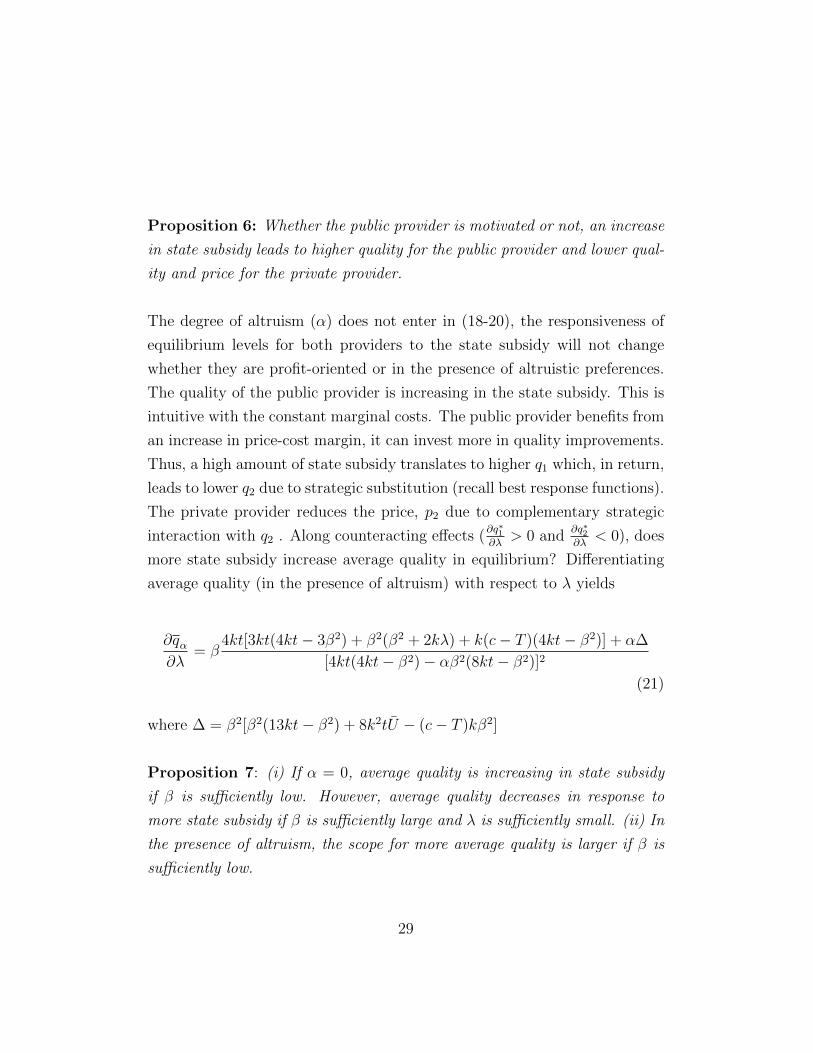
Proposition 6: Whether the public provider is motivated or not, an increase
in state subsidy leads to higher quality for the public provider and lower qual-
ity and price for the private provider.
The degree of altruism (α) does not enter in (18-20), the responsiveness of
equilibrium levels for both providers to the state subsidy will not change
whether they are profit-oriented or in the presence of altruistic preferences.
The quality of the public provider is increasing in the state subsidy. This is
intuitive with the constant marginal costs. The public provider benefits from
an increase in price-cost margin, it can invest more in quality improvements.
Thus, a high amount of state subsidy translates to higher q1 which, in return,
leads to lower q2 due to strategic substitution (recall best response functions).
The private provider reduces the price, p2 due to complementary strategic
interaction with q2 . Along counteracting effects (∂q∗1∂λ
> 0 and∂q∗2∂λ
< 0), does
more state subsidy increase average quality in equilibrium? Differentiating
average quality (in the presence of altruism) with respect to λ yields
∂qα∂λ
= β4kt[3kt(4kt− 3β2) + β2(β2 + 2kλ) + k(c− T )(4kt− β2)] + α∆
[4kt(4kt− β2)− αβ2(8kt− β2)]2
(21)
where ∆ = β2[β2(13kt− β2) + 8k2tU − (c− T )kβ2]
Proposition 7: (i) If α = 0, average quality is increasing in state subsidy
if β is sufficiently low. However, average quality decreases in response to
more state subsidy if β is sufficiently large and λ is sufficiently small. (ii) In
the presence of altruism, the scope for more average quality is larger if β is
sufficiently low.
29
Proof: (i) The numerator in (21) is positive if β is low. Thus, ∂q∂λ> 0. How-
ever, for a sufficient large β, setting β2 → 4kt, reduces (21) to: −8k2t(t−λ),
which is negative if t > λ. Recall that t > λ := c− T . Hence, ∂q∂λ< 0 if β is
high and λ is small. (ii) The statement is true if ∆ is positive. If the value
of β is sufficiently small, ∆ > 0. �.
The amount of state subsidy determines the market shares of the two providers.
A high λ has a positive impact on public provider’s incentive to offer more
quality provision and thus lead to an inflow of consumers (market share ex-
pansion). On the contrary, due to strategic interaction (∂q2∂q1
< 0), there is
a negative effect on the private provider where the strength of the strategic
response depends on consumer’s marginal willingness-to-pay for quality, β.
It is stronger (weaker) if β is large (small). If β is sufficiently low, an increase
in λ will cause the reduction in q2 to be relatively small in comparison to the
increase in q1. In sum, this leads to higher average quality. On the contrary,
if β is sufficiently high, the reverse result requires λ to be sufficiently small.
Suppose λ is sufficiently small, the market share of the private provider is
sufficiently high such that the reduction in q2 outweighs the rise in q1 and
yields a lower average quality in response to more state subsidy. Notice that
the marginal revenue of quality for the public provider increases in the pres-
ence of altruism. Thus, the superiority of the positive effect (due to increase
in q1) over the negative one (due to reduction in q2) leads to more average
quality, but only if β is sufficiently low.
4.2.2 Co-payment Fees
The growing interest in raising the co-payment reflects a desire to simulate
market-like behavior in regulated markets. The marginal effect of an increase
in co-payment on equilibrium levels is obtained by differentiating
30
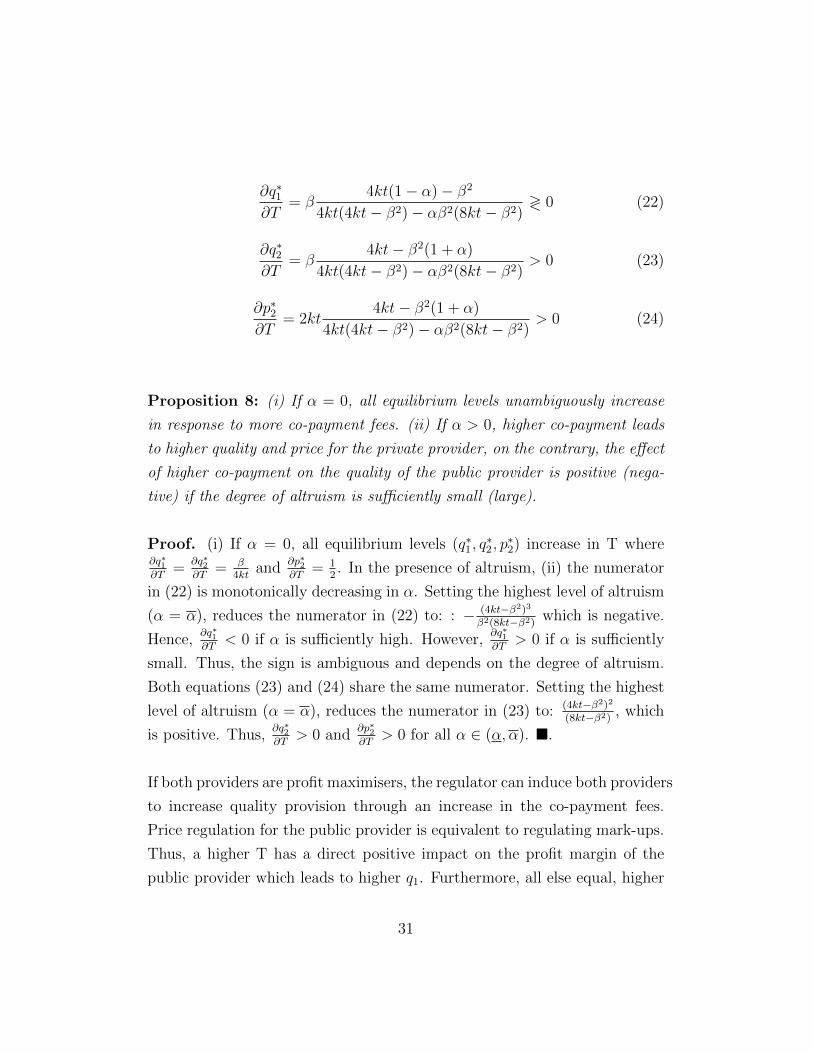
∂q∗1∂T
= β4kt(1− α)− β2
4kt(4kt− β2)− αβ2(8kt− β2)≷ 0 (22)
∂q∗2∂T
= β4kt− β2(1 + α)
4kt(4kt− β2)− αβ2(8kt− β2)> 0 (23)
∂p∗2∂T
= 2kt4kt− β2(1 + α)
4kt(4kt− β2)− αβ2(8kt− β2)> 0 (24)
Proposition 8: (i) If α = 0, all equilibrium levels unambiguously increase
in response to more co-payment fees. (ii) If α > 0, higher co-payment leads
to higher quality and price for the private provider, on the contrary, the effect
of higher co-payment on the quality of the public provider is positive (nega-
tive) if the degree of altruism is sufficiently small (large).
Proof. (i) If α = 0, all equilibrium levels (q∗1, q∗2, p∗2) increase in T where
∂q∗1∂T
=∂q∗2∂T
= β4kt
and∂p∗2∂T
= 12. In the presence of altruism, (ii) the numerator
in (22) is monotonically decreasing in α. Setting the highest level of altruism
(α = α), reduces the numerator in (22) to: : − (4kt−β2)3
β2(8kt−β2)which is negative.
Hence,∂q∗1∂T
< 0 if α is sufficiently high. However,∂q∗1∂T
> 0 if α is sufficiently
small. Thus, the sign is ambiguous and depends on the degree of altruism.
Both equations (23) and (24) share the same numerator. Setting the highest
level of altruism (α = α), reduces the numerator in (23) to: (4kt−β2)2
(8kt−β2), which
is positive. Thus,∂q∗2∂T
> 0 and∂p∗2∂T
> 0 for all α ∈ (α, α). �.
If both providers are profit maximisers, the regulator can induce both providers
to increase quality provision through an increase in the co-payment fees.
Price regulation for the public provider is equivalent to regulating mark-ups.
Thus, a higher T has a direct positive impact on the profit margin of the
public provider which leads to higher q1. Furthermore, all else equal, higher
31
T increases the demand for the private provider (c.f Equation (2)), which
makes the demand for this provider less price-elastic. Thus, the provider op-
timally responds by increasing the price (p2). Based on Equation (6), both
price and quality of the private provider are complementary strategies, this
will lead to higher quality, q2. The intuition for the second part of the propo-
sition entails the trade-off effect on the public provider’s incentive for quality
provision in response to more co-payment fees. In the presence of altruism,
α > 0, there is an additional strategic response (∂q1(q2)∂q2
< 0). A higher quality
for the private provider as a response to higher T leads to lower quality for
the public, and this effect is sufficiently strong only if α is large enough.
If α = 0, an increase in T induces both providers to increase quality pro-
vision. Is it clear-cut to draw a conclusion for a higher average quality in
equilibrium? Besides, the average quality might increase or decrease depend-
ing on the dominant effect (∂q∗2∂T
> 0 vs.∂q∗1∂T
< 0). We examine the effect of
the copayment fees on the average quality which is given by
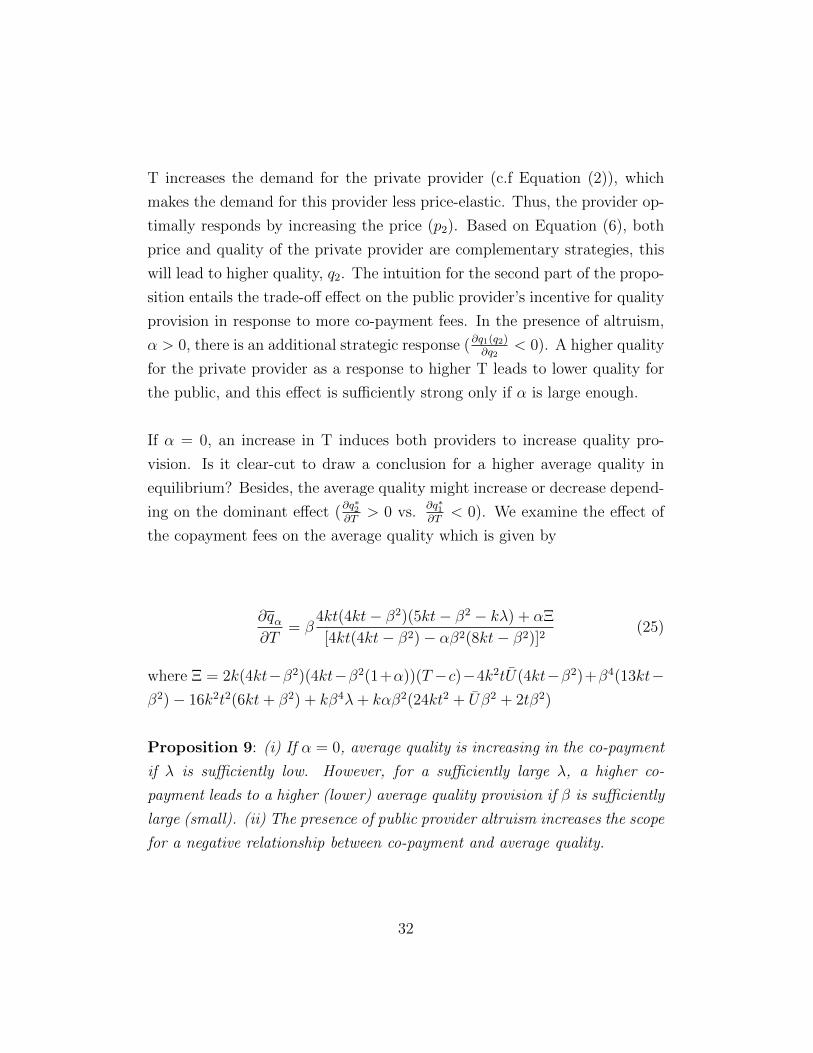
∂qα∂T
= β4kt(4kt− β2)(5kt− β2 − kλ) + αΞ
[4kt(4kt− β2)− αβ2(8kt− β2)]2(25)
where Ξ = 2k(4kt−β2)(4kt−β2(1+α))(T −c)−4k2tU(4kt−β2)+β4(13kt−β2)− 16k2t2(6kt+ β2) + kβ4λ+ kαβ2(24kt2 + Uβ2 + 2tβ2)
Proposition 9: (i) If α = 0, average quality is increasing in the co-payment
if λ is sufficiently low. However, for a sufficiently large λ, a higher co-
payment leads to a higher (lower) average quality provision if β is sufficiently
large (small). (ii) The presence of public provider altruism increases the scope
for a negative relationship between co-payment and average quality.
32
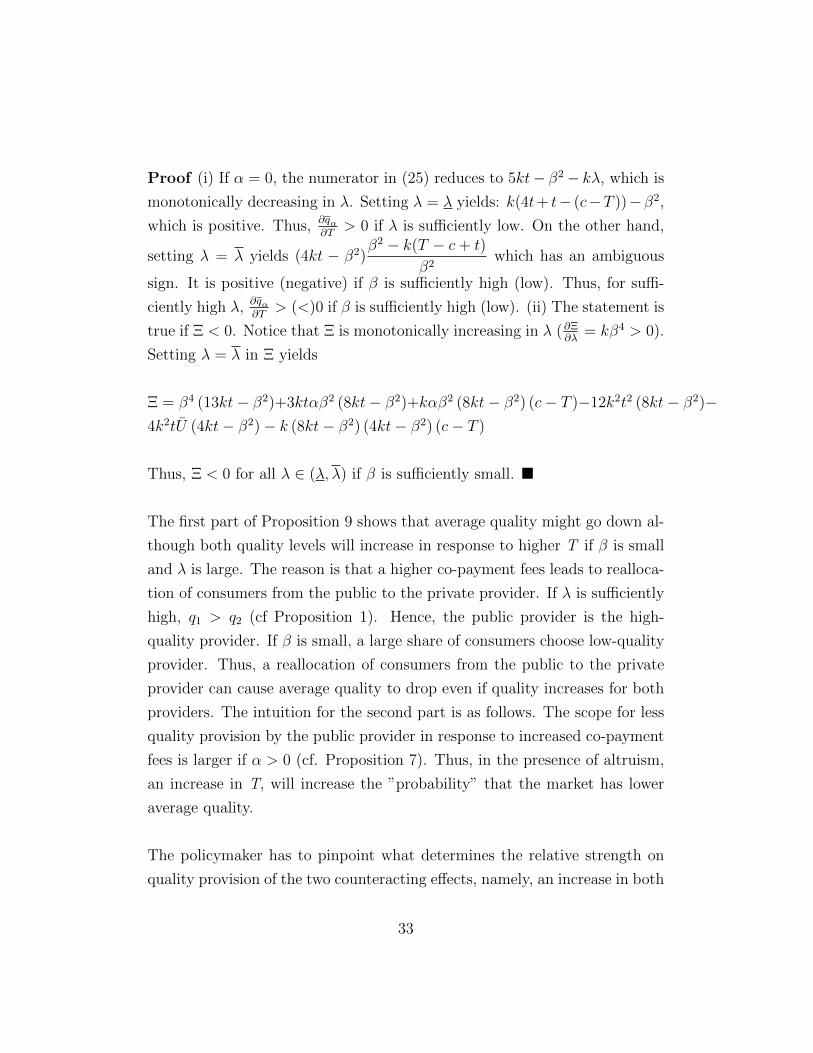
Proof (i) If α = 0, the numerator in (25) reduces to 5kt− β2− kλ, which is
monotonically decreasing in λ. Setting λ = λ yields: k(4t+ t− (c−T ))−β2,
which is positive. Thus, ∂qα∂T
> 0 if λ is sufficiently low. On the other hand,
setting λ = λ yields (4kt − β2)β2 − k(T − c+ t)
β2which has an ambiguous
sign. It is positive (negative) if β is sufficiently high (low). Thus, for suffi-
ciently high λ, ∂qα∂T
> (<)0 if β is sufficiently high (low). (ii) The statement is
true if Ξ < 0. Notice that Ξ is monotonically increasing in λ (∂Ξ∂λ
= kβ4 > 0).
Setting λ = λ in Ξ yields
Ξ = β4 (13kt− β2)+3ktαβ2 (8kt− β2)+kαβ2 (8kt− β2) (c− T )−12k2t2 (8kt− β2)−4k2tU (4kt− β2)− k (8kt− β2) (4kt− β2) (c− T )
Thus, Ξ < 0 for all λ ∈ (λ, λ) if β is sufficiently small. �
The first part of Proposition 9 shows that average quality might go down al-
though both quality levels will increase in response to higher T if β is small
and λ is large. The reason is that a higher co-payment fees leads to realloca-
tion of consumers from the public to the private provider. If λ is sufficiently
high, q1 > q2 (cf Proposition 1). Hence, the public provider is the high-
quality provider. If β is small, a large share of consumers choose low-quality
provider. Thus, a reallocation of consumers from the public to the private
provider can cause average quality to drop even if quality increases for both
providers. The intuition for the second part is as follows. The scope for less
quality provision by the public provider in response to increased co-payment
fees is larger if α > 0 (cf. Proposition 7). Thus, in the presence of altruism,
an increase in T, will increase the ”probability” that the market has lower
average quality.
The policymaker has to pinpoint what determines the relative strength on
quality provision of the two counteracting effects, namely, an increase in both
33
key policy instruments. If α = 0, for the public provider we have∂q∗1∂T
> 0
and∂q∗1∂λ
> 0 whereas opposite effects appear for the private provider:∂q∗2∂T
> 0
and∂q∗2∂λ
< 0. If α > 0, the public provider has a trade off between regulatory
tools if he has high altruistic preferences:∂q∗1∂T
< 0 and∂q∗1∂λ
> 0.
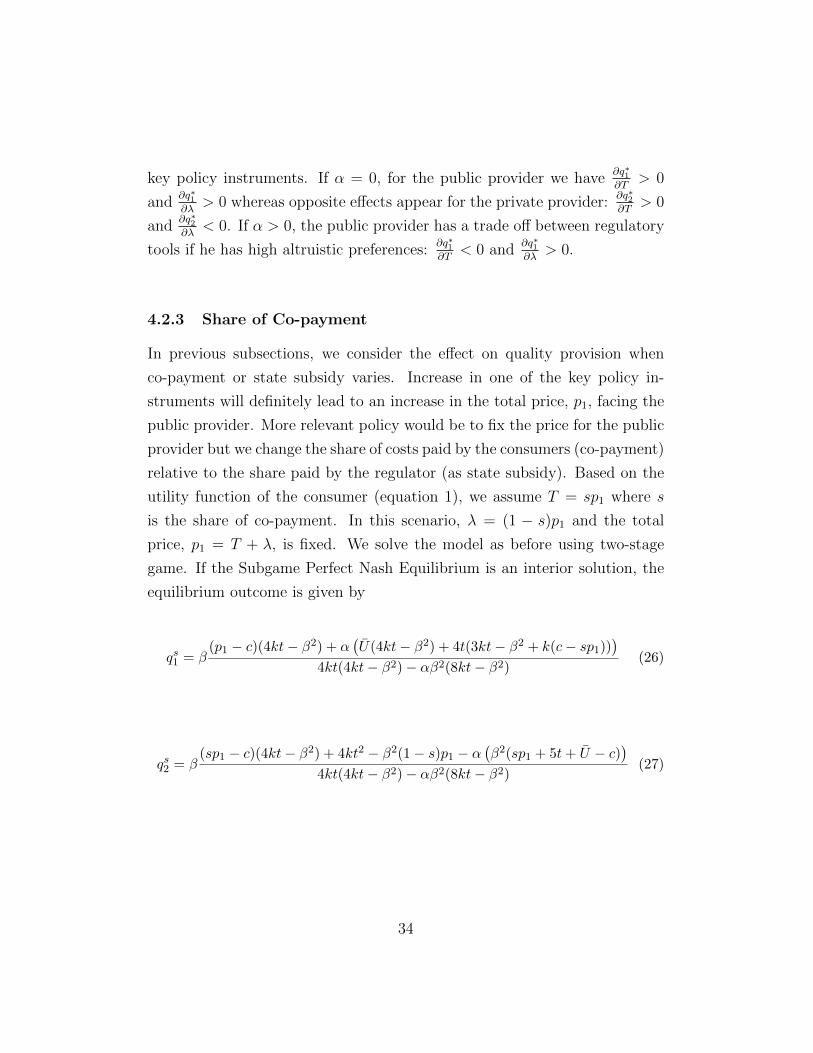
4.2.3 Share of Co-payment
In previous subsections, we consider the effect on quality provision when
co-payment or state subsidy varies. Increase in one of the key policy in-
struments will definitely lead to an increase in the total price, p1, facing the
public provider. More relevant policy would be to fix the price for the public
provider but we change the share of costs paid by the consumers (co-payment)
relative to the share paid by the regulator (as state subsidy). Based on the
utility function of the consumer (equation 1), we assume T = sp1 where s
is the share of co-payment. In this scenario, λ = (1 − s)p1 and the total
price, p1 = T + λ, is fixed. We solve the model as before using two-stage
game. If the Subgame Perfect Nash Equilibrium is an interior solution, the
equilibrium outcome is given by
qs1 = β(p1 − c)(4kt− β2) + α
(U(4kt− β2) + 4t(3kt− β2 + k(c− sp1))
)4kt(4kt− β2)− αβ2(8kt− β2)
(26)
qs2 = β(sp1 − c)(4kt− β2) + 4kt2 − β2(1− s)p1 − α
(β2(sp1 + 5t+ U − c)
)4kt(4kt− β2)− αβ2(8kt− β2)
(27)
34

ps2 =2kt((4kt− β2)(sp1 + c) + 4kt2 − β2(1− s)p1)− α
(β2(2kt
(sp1 + U + 5t
)+ c
(6kt− β2
)))
4kt(4kt− β2)− αβ2(8kt− β2)(28)
We differentiate equilibrium levels (Equations (26-28)) with respect to the
share of co-payment, s, which are given by
∂qs1∂s
= −4ktαβp1
4kt(4kt− β2)− αβ2(8kt− β2)≤ 0 (29)
∂qs2∂s
= βp1 (4kt− αβ2)
4kt(4kt− β2)− αβ2(8kt− β2)> 0 (30)
∂ps2∂s
=2ktp1 (4kt− αβ2)
4kt(4kt− β2)− αβ2(8kt− β2)> 0 (31)
Proposition 10: (i) If α = 0, the quality of the public provider is indifferent
to change in the share of co-payment, s, on the contrary, both the quality and
price of the private provider are increasing in s (ii) If α > 0, higher share
of co-payment leads to higher quality and price for the private provider, how-
ever, the relationship is negative for the public provider.
Proof. (i) If α = 0, equations (29-31) are reduced to:∂qs1∂s
= 0,∂qs2∂s
=
β p14kt−β2 > 0, and
∂ps2∂s
= 2kt p14kt−β2 > 0 respectively. (ii) If α > 0, it follows
immediately from equations (29-31) that the relation is negative between s
and qs1 while it is positive with respect to qs2 and ps2 respectively (second order
conditions are satisfied, recall 2kt > αβ2). �
The first part of Proposition 10 shows that if consumers face higher co-
payment fees (as costs paid out of their pockets) relative to the share paid
35
by the regulator in terms of state-subsidy (lower λ), this has no effect on
the quality for the public provider. An increase in s does not increase the
profit margin of the public provider as the total price is fixed. However, all
else equal, higher s (which means higher T ) increases the demand for the
private provider (equation (2)), which makes the demand for this provider
less price-elastic. This will, in turn, lead to higher quality (because price and
quality are complementary strategies).
In the presence of altruism, there is an additional strategic response (∂qs1∂qs2
< 0).
A higher quality for the private provider in response to higher s leads to lower
quality for the public, and this effect holds regardless of the motivation level
(i.e degree of α) in contrast to Proposition 8.
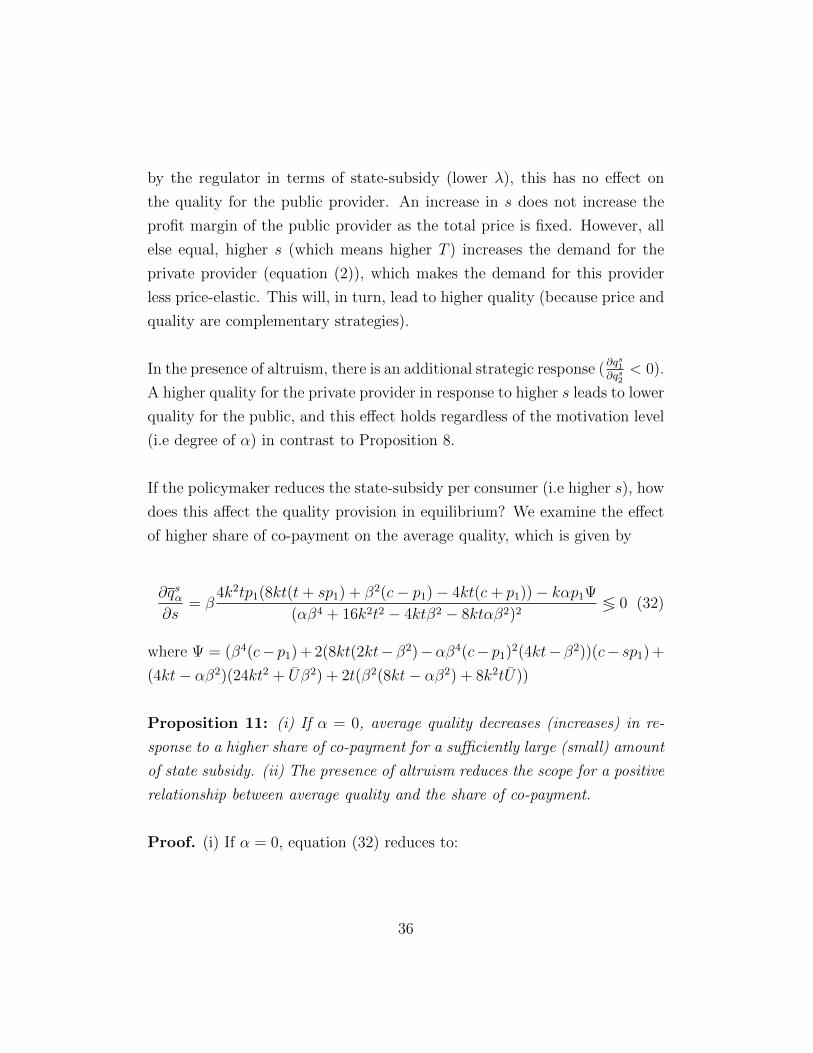
If the policymaker reduces the state-subsidy per consumer (i.e higher s), how
does this affect the quality provision in equilibrium? We examine the effect
of higher share of co-payment on the average quality, which is given by
∂qsα∂s
= β4k2tp1(8kt(t+ sp1) + β2(c− p1)− 4kt(c+ p1))− kαp1Ψ
(αβ4 + 16k2t2 − 4ktβ2 − 8ktαβ2)2≶ 0 (32)
where Ψ = (β4(c− p1) + 2(8kt(2kt−β2)−αβ4(c− p1)2(4kt−β2))(c− sp1) +
(4kt− αβ2)(24kt2 + Uβ2) + 2t(β2(8kt− αβ2) + 8k2tU))
Proposition 11: (i) If α = 0, average quality decreases (increases) in re-
sponse to a higher share of co-payment for a sufficiently large (small) amount
of state subsidy. (ii) The presence of altruism reduces the scope for a positive
relationship between average quality and the share of co-payment.
Proof. (i) If α = 0, equation (32) reduces to:
36
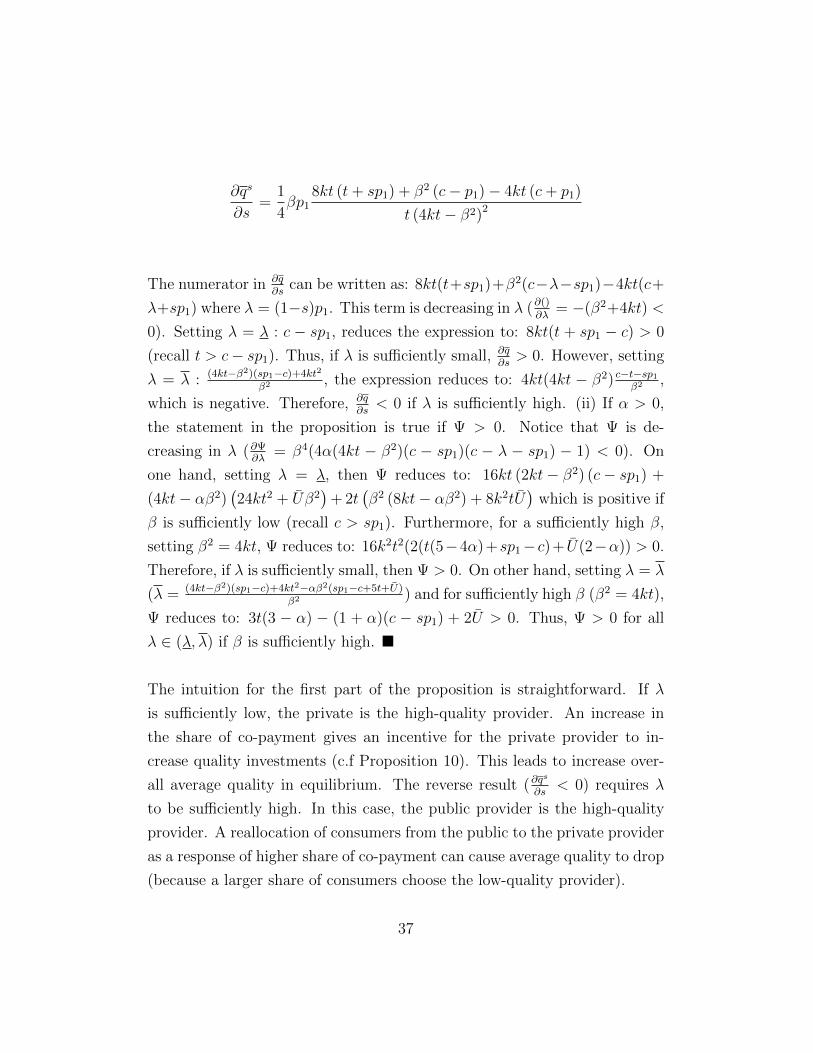
∂qs
∂s=
1
4βp1
8kt (t+ sp1) + β2 (c− p1)− 4kt (c+ p1)
t (4kt− β2)2
The numerator in ∂q∂s
can be written as: 8kt(t+sp1)+β2(c−λ−sp1)−4kt(c+
λ+sp1) where λ = (1−s)p1. This term is decreasing in λ (∂()∂λ
= −(β2+4kt) <
0). Setting λ = λ : c − sp1, reduces the expression to: 8kt(t + sp1 − c) > 0
(recall t > c− sp1). Thus, if λ is sufficiently small, ∂q∂s> 0. However, setting
λ = λ : (4kt−β2)(sp1−c)+4kt2
β2 , the expression reduces to: 4kt(4kt − β2) c−t−sp1β2 ,
which is negative. Therefore, ∂q∂s< 0 if λ is sufficiently high. (ii) If α > 0,
the statement in the proposition is true if Ψ > 0. Notice that Ψ is de-
creasing in λ (∂Ψ∂λ
= β4(4α(4kt − β2)(c − sp1)(c − λ − sp1) − 1) < 0). On
one hand, setting λ = λ, then Ψ reduces to: 16kt (2kt− β2) (c− sp1) +
(4kt− αβ2)(24kt2 + Uβ2
)+ 2t
(β2 (8kt− αβ2) + 8k2tU
)which is positive if
β is sufficiently low (recall c > sp1). Furthermore, for a sufficiently high β,
setting β2 = 4kt, Ψ reduces to: 16k2t2(2(t(5−4α)+sp1− c)+ U(2−α)) > 0.
Therefore, if λ is sufficiently small, then Ψ > 0. On other hand, setting λ = λ
(λ = (4kt−β2)(sp1−c)+4kt2−αβ2(sp1−c+5t+U)β2 ) and for sufficiently high β (β2 = 4kt),
Ψ reduces to: 3t(3 − α) − (1 + α)(c − sp1) + 2U > 0. Thus, Ψ > 0 for all
λ ∈ (λ, λ) if β is sufficiently high. �
The intuition for the first part of the proposition is straightforward. If λ
is sufficiently low, the private is the high-quality provider. An increase in
the share of co-payment gives an incentive for the private provider to in-
crease quality investments (c.f Proposition 10). This leads to increase over-
all average quality in equilibrium. The reverse result (∂qs
∂s< 0) requires λ
to be sufficiently high. In this case, the public provider is the high-quality
provider. A reallocation of consumers from the public to the private provider
as a response of higher share of co-payment can cause average quality to drop
(because a larger share of consumers choose the low-quality provider).
37
When the public provider is altruistic (α > 0), it increases the scope for a
quality reduction by the public provider in response to higher s as there is
an additional chain of response∂qs1∂s
< 0 (c.f Proposition 10). For example,
if consumer’s marginal willingness-to-pay for quality is sufficiently high, the
strategic response is strong (∂qs1∂qs2
< 0). The decrease in qs1 is sufficiently high
(compared to the increase in qs2) such that average quality decreases as a
response to a higher share of co-payment.
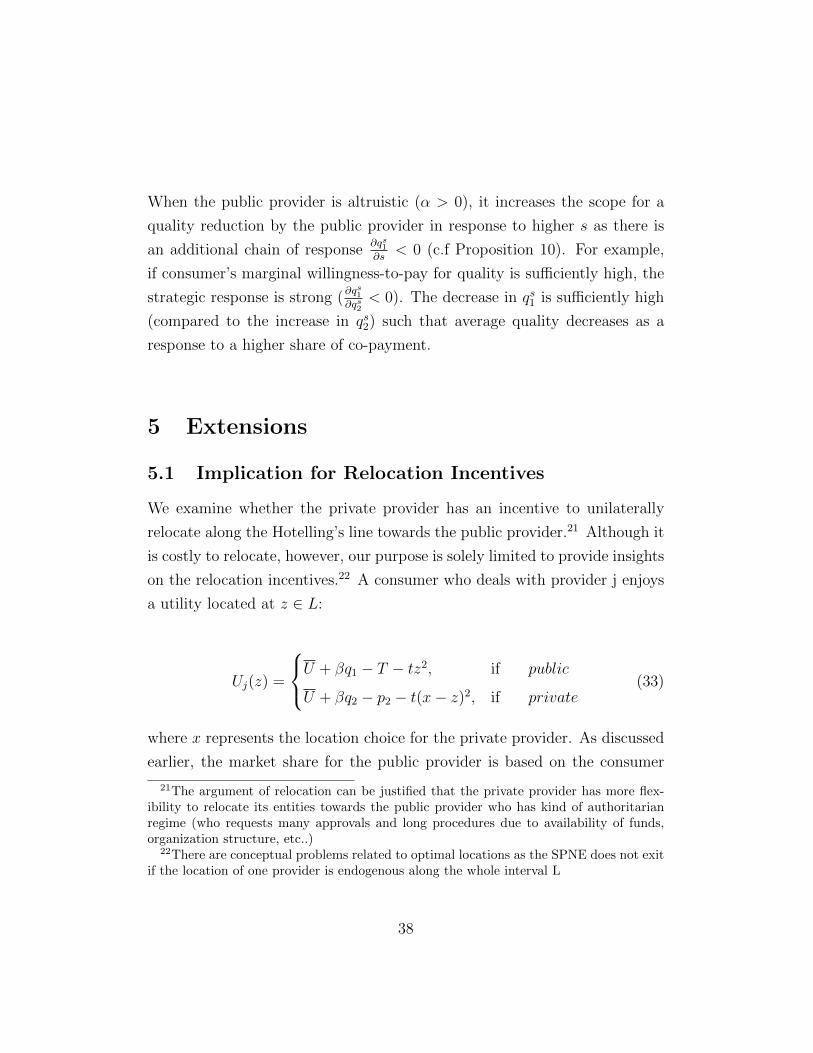
5 Extensions
5.1 Implication for Relocation Incentives
We examine whether the private provider has an incentive to unilaterally
relocate along the Hotelling’s line towards the public provider.21 Although it
is costly to relocate, however, our purpose is solely limited to provide insights
on the relocation incentives.22 A consumer who deals with provider j enjoys
a utility located at z ∈ L:
Uj(z) =
U + βq1 − T − tz2, if public
U + βq2 − p2 − t(x− z)2, if private(33)
where x represents the location choice for the private provider. As discussed
earlier, the market share for the public provider is based on the consumer
21The argument of relocation can be justified that the private provider has more flex-ibility to relocate its entities towards the public provider who has kind of authoritarianregime (who requests many approvals and long procedures due to availability of funds,organization structure, etc..)
22There are conceptual problems related to optimal locations as the SPNE does not exitif the location of one provider is endogenous along the whole interval L
38
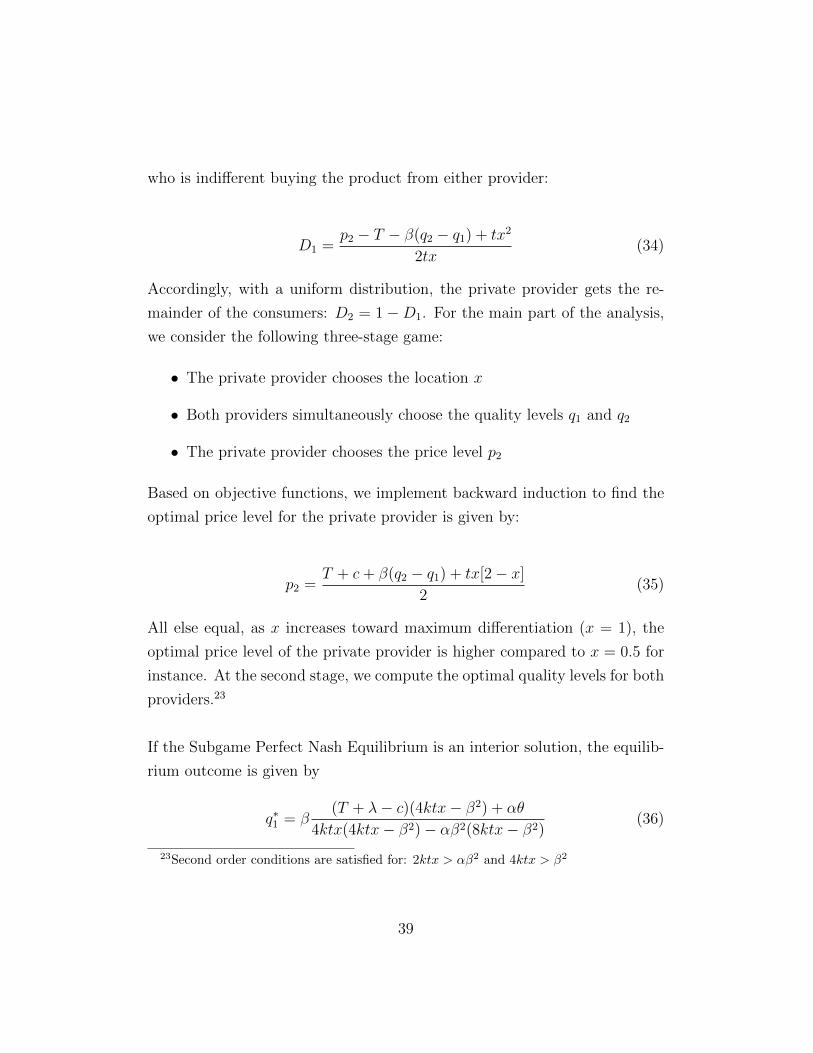
who is indifferent buying the product from either provider:
D1 =p2 − T − β(q2 − q1) + tx2
2tx(34)
Accordingly, with a uniform distribution, the private provider gets the re-
mainder of the consumers: D2 = 1−D1. For the main part of the analysis,
we consider the following three-stage game:
• The private provider chooses the location x
• Both providers simultaneously choose the quality levels q1 and q2
• The private provider chooses the price level p2
Based on objective functions, we implement backward induction to find the
optimal price level for the private provider is given by:
p2 =T + c+ β(q2 − q1) + tx[2− x]
2(35)
All else equal, as x increases toward maximum differentiation (x = 1), the
optimal price level of the private provider is higher compared to x = 0.5 for
instance. At the second stage, we compute the optimal quality levels for both
providers.23
If the Subgame Perfect Nash Equilibrium is an interior solution, the equilib-
rium outcome is given by
q∗1 = β(T + λ− c)(4ktx− β2) + αθ
4ktx(4ktx− β2)− αβ2(8ktx− β2)(36)
23Second order conditions are satisfied for: 2ktx > αβ2 and 4ktx > β2
39
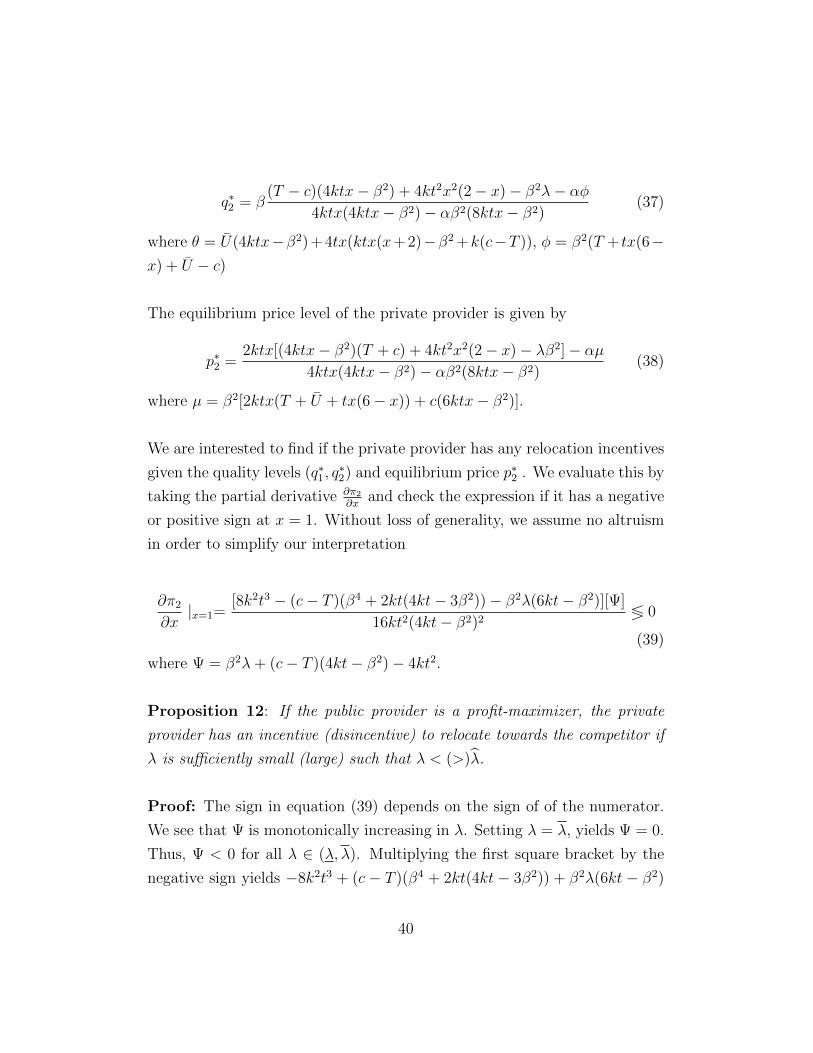
q∗2 = β(T − c)(4ktx− β2) + 4kt2x2(2− x)− β2λ− αφ
4ktx(4ktx− β2)− αβ2(8ktx− β2)(37)
where θ = U(4ktx−β2) + 4tx(ktx(x+ 2)−β2 +k(c−T )), φ = β2(T + tx(6−x) + U − c)
The equilibrium price level of the private provider is given by
p∗2 =2ktx[(4ktx− β2)(T + c) + 4kt2x2(2− x)− λβ2]− αµ
4ktx(4ktx− β2)− αβ2(8ktx− β2)(38)
where µ = β2[2ktx(T + U + tx(6− x)) + c(6ktx− β2)].
We are interested to find if the private provider has any relocation incentives
given the quality levels (q∗1, q∗2) and equilibrium price p∗2 . We evaluate this by
taking the partial derivative ∂π2∂x
and check the expression if it has a negative
or positive sign at x = 1. Without loss of generality, we assume no altruism
in order to simplify our interpretation
∂π2
∂x|x=1=
[8k2t3 − (c− T )(β4 + 2kt(4kt− 3β2))− β2λ(6kt− β2)][Ψ]
16kt2(4kt− β2)2≶ 0
(39)
where Ψ = β2λ+ (c− T )(4kt− β2)− 4kt2.
Proposition 12: If the public provider is a profit-maximizer, the private
provider has an incentive (disincentive) to relocate towards the competitor if
λ is sufficiently small (large) such that λ < (>)λ.
Proof: The sign in equation (39) depends on the sign of of the numerator.
We see that Ψ is monotonically increasing in λ. Setting λ = λ, yields Ψ = 0.
Thus, Ψ < 0 for all λ ∈ (λ, λ). Multiplying the first square bracket by the
negative sign yields −8k2t3 + (c − T )(β4 + 2kt(4kt − 3β2)) + β2λ(6kt − β2)
40
which is monotonically increasing in λ. Setting λ = c − T , reduces the
term to: −8k2t2(t − (c − T )) < 0. On other hand, setting λ = λ, yields
4kt (4kt− β2) (t− (c− T )) > 0. Thus, ∂π2∂x|x=1< 0 if λ is sufficiently small.
More explicitly, ∂π2∂x|x=1< (>)0 if
λ < (>) λ :=8k2t3 − (β4 − 2kt (3β2 − 4kt)) (c− T )
β2 (6kt− β2)
�
The intuition behind the result in Proposition 12 is as follows. If λ is suf-
ficiently large, it gives the public provider stronger incentives for quality
investments, which, in turn, leads to market share expansion. A higher λ is
more likely to yield a lower quality for the private provider (due to strategic
substitution, ∂q2∂q1
< 0). Obviously, this reduces the revenue gain from suffi-
ciently low market share. Hence, relocation choice of the private provider is
determined by the effects on revenues, which, in this case, opt not to move to-
wards the public provider and incur higher costs. The market share is mostly
skewed towards the public provider who offers a higher quality (q1 > q2).
On the other hand, if λ is sufficiently small, the public provider has weak
incentives to provide higher quality, because the profit margin is small. In
this case, the private provider is the high-quality provider (q2 > q1) and its
market share is sufficiently high. To maximize profits, the private provider
tends to relocate unilaterally towards the public provider and steal market
shares. The private provider’s relocation choice has a positive effect on the
intensity of quality competition, and a negative effect on the price level (the
private provider offers a lower price compared to maximum differentiation).
Although there are explicit costs attributed to unilateral relocation for the
private provider, guaranteeing a higher quality provision in a mixed duopoly
remains a policy challenge. Accordingly, the regulator can encourage uni-
41

lateral relocation incentives if and only if the public provider receives small
amount of state subsidy per consumer.
5.2 Policy-Induced Instrument: Direct Information Pro-
vision
State governments have been encouraging and, in some cases, requiring the
publication of qualitative information whether in education or healthcare
markets. In education, the publication of university rankings based on dif-
ferent individual measures of performance has become commonplace in the
UK, USA and elsewhere. In healthcare markets, the Care Quality Commis-
sion, which regulates UK National Health Service -NHS hospitals, actively
publicises its website which features comparative information on the quality
of hospitals.24 Hence, in both sectors, the government allocate resources to
collect information on quality indicators and ranking of institutions (league
tables). In a model related to informational settings, it was shown that
increased patient information is qualitatively equivalent to reduced trans-
portation costs (Brekke et al., 2007).
The main purpose of the publication of qualitative information is to make
demand more responsive to quality difference. Increasing disclosure of qual-
ity indicators and ranking institutions assist consumers in making choices
among services and providers. Thus, consumers are more conducive to select
the provider that displays a higher quality level. Although the informa-
tion available to consumers on providers in regulated markets can hardly be
considered complete (or even adequate) in many cases, the consumer cannot
easily correct the initial error by switching brands until he finds the best prod-
uct. For instance, in the higher education market, the student usually buys
24The Netherlands also has a “Kiesbeter” (“Choose better”) website with similar infor-mation
42
one college education. Accordingly, the policy maker can potentially pro-
vide better information on the providers to increase competition and thereby
drive up quality.
In this section, we depart from considering our spatial competition frame-
work and we sketch our analysis based on the demand function given by
Equation (2). Thus, we do not interpret β as the consumers’ willingness to
pay for quality. In this scenario, β reflects how much demand responds to
quality changes. The rationale behind this is that more direct information
provision facilitates consumers to observe and compare the data across the
providers. We examine the implication of a policy initiative by the regula-
tor and whether better information will increase the incentives for providers
to raise quality. Accordingly, we can analyse how the equilibrium levels
(q∗1, q∗2, p∗2) will react to more available information, namely β. For simplicity,
we consider that both providers seek profit maximisation.25 The effect of β
on the equilibrium quality and price are given by
∂q∗1∂β
=T + λ− c
4kt> 0 (40)
∂q∗2∂β
=−β2λ(12kt− β2) + 4kt2(4kt+ β2)− (c− T )(4kt− β2)2
4kt(β2 − 4kt)2≶ 0 (41)
∂p∗2∂β
= 4ktβ(t− λ)
(4kt− β2)2≶ 0 (42)
Proposition 13: If α = 0, (i) The quality of the public provider is mono-
tonically increasing in the direct information provision. (ii) More available
25In the Appendix, we provide a numerical example to tackle the effect of increasedpublic reporting on the average quality in the presence of altruism
43
information leads to higher (lower) private quality provision, if the state sub-
sidy is sufficiently small (large). (iii) The price of the private provider re-
sponds positively (negatively) to β if the product differentiation is relatively
large (small) to the state subsidy.
Proof : If α = 0, (i) it follows directly from (40) that the numerator is posi-
tive as p1 > c. (ii) The numerator in (41) is monotonically decreasing in λ.
Setting λ = λ the numerator reduces 4kt(β2+4kt)(T−c+t) which is positive.
On other hand, setting λ = λ, the numerator reduces −8kt(4kt−β2)(T−c+t)which is negative. Thus,
∂q∗2∂β
> (<)0 if λ is sufficiently small (large). There-
fore, the sign is ambiguous. (iii) It follows immediately from (42). �
The intuition for the results in Proposition 13 is as follows. More direct infor-
mation provision only has a direct positive effect on the quality of the public
provider. On the contrary, it has two side effects on the quality of the private
provider as it depends on the size of λ. The role of λ is through strategic
interaction. If λ is large, the public provider is the high-quality provider
(cf. Proposition 1). The larger (smaller) λ is, the stronger (weaker) is the
strategic (negative) effect on q2 due to ∂q2∂q1
< 0. In this case, the indirect
negative effect outweighs the direct effect and the private provider reacts to
an increase in β by reducing quality if λ is large (and vice versa in case of a
small λ).
In our model settings, the private provider favours the policy-induced step
towards disclosing the table leagues and published reports, if the public
provider received low state subsidy. However, in the presence of altruism,
as we have shown in the numerical example, under certain circumstances,
the public provider responds to increased public reporting by decreasing the
quality, if it is not highly motivated.
44
Under certain circumstances, we notice that more information does not al-
ways lead to higher quality and price for the private provider. Hence, it is
essential to evaluate the effect of more information on the average quality in
equilibrium. We differentiate the average quality in (16) with respect to β
(when both providers seek profit-orientation): 26
∂q
∂β=β4λ (11kt− β2) + kβ2λ2 (12kt+ β2) + 24k2t2λ (2kt− 3β2) + ρ
4kt (4kt− β2)3 (43)
where ρ = (c− T ) (4kt− β2) (kλ (4kt+ β2)− kt (20kt− 7β2)− β4)+4k2t3 (4kt+ 3β2)
Proposition 14: If the public provider seeks profit orientation, the average
quality provision unambiguously increases in response to more available in-
formation.
Proof : If α = 0, the numerator in (43) is monotonically increasing in λ if
β is sufficiently small (∂()∂λ
= k (c− T ) (4kt− β2) (4kt+ β2) + β4 (11kt− β2)
+ 2kβ2λ (12kt+ β2) + 24k2t2 (2kt− 3β2)). Otherwise, for sufficiently large
β, the numerator in (43) reduces to: −128k3t2(t − λ) ≶ 0. Setting λ = λ
reduces the numerator L to:
L = 4ktβ2 (4kt− β2)
2(T − c+ t) (4kt− β2 + 2k(t+ T − c)) > 0
Thus, ∂q∂β
> 0 if λ is sufficiently high. Similarly, setting λ = λ reduces the
numerator L to: 4k2t (3β2 + 4kt) (T − c+ t)2 > 0. Regardless if the numer-
ator is monotonically decreasing/increasing, L is positive. Thus, ∂q∂β> 0 for
all λ ∈ (λ, λ). �
26In the presence of altruism, we find a positive effect on average quality in response toincreased public reporting, check Appendix
45

The intuition is straightforward: more direct information provision (higher
β) leads to more average quality in equilibrium. Regardless of q1 ≶ q2,
increased available information has potentially small negative effect on the
private provider’s incentive quality provision if λ is large. In sum, this leads
to higher average quality in equilibrium.
6 Policy Implications and Concluding Remarks
This paper introduces the importance of state subsidies and co-payment fees
in mixed markets, where public and private providers coexist. In a setting
where the public provider faces a regulated market and is partly motivated
towards quality, we investigate the effect of competition on quality provision.
In addition, we explore the effects of changes in key policy instruments on
equilibrium outcomes. To this end, our analysis has been conducted within
a spatial competition framework as it is well-suited to study the relation-
ship between competition and quality provision in sectors like healthcare,
education, nursing homes and elderly care. We shed light on some of the
mechanisms that lead to the widespread phenomenon of variations in quality
differentiation in mixed markets.
Our theoretical analysis produces two main results. First, under certain
circumstances, increased competition leads to lower average quality in equi-
librium. This negative relationship also holds if the public provider is partly
motivated compared to a benchmark case where both providers seek profit-
maximisation. In our model, we find that increased competition has an am-
biguous effect on quality for the public provider. Policy measures aimed at
increasing competition between public and private provider may surprisingly
reduce quality provision. The reasons stem from the size of the funds trans-
ferred to the public provider by the government and the purchasing power of
consumers (i.e preferences towards higher quality). For example, it is widely
46

common among emerging countries (Lebanon, Bangladesh and Egypt) for
governments to allocate a small share of state subsidies to the public mar-
kets, which in turn, have weak incentives to provide higher quality due to its
small profit margin.
The second key finding is that the effects of higher co-payment fees or larger
state subsidies on average quality are also a priori ambiguous. More interest-
ingly, we explore the effects of a higher share of co-payment on equilibrium
outcomes (price and, more importantly, quality). The interests of policy-
makers in OECD in increasing co-payment fees as a possible solution for
cost pressures, did not lead to the expected results (higher quality). Our
analysis suggests that governments face trade off should they decide to in-
crease one of these policy instruments. Recent empirical studies highlight
the drawbacks of reducing spending and increasing co-payment fees on qual-
ity and consumer’s demand, respectively (Landsem and Magnussen, 2018;
Jakobsson and Svensson, 2016; Deming and Walters, 2017). However, these
studies are carried out either on public institutions or under price regula-
tion. Consequently, understanding the mechanisms of the payment system
is crucial to achieve the desired allocation of public market resources. Our
analysis can be evaluated empirically to examine how the provider’s quality
will respond to increased co-payment fees (or share of co-payment) and if the
private provider can compete on quality, in addition to the price.
Our study additionally characterises the incentives to the private provider
so as to relocate unilaterally towards the public provider. If the amount of
state subsidy received by the public provider is sufficiently small, the private
can maximise profits and steal market shares by relocating in the direction
of the public provider. Furthermore, we demonstrated the features that lead
to quality differentiation between the private and public providers in some
countries. More specifically, if the market entails a high level of horizontal
47
differentiation (diversity of services) relative to the state subsidy parameter,
the private is the high-quality provider in the market.
The paper ignored some important features of the healthcare and education
markets. Probably the most important limitation is that consumer prefer-
ences are not vertically differentiated. However, this feature would not ren-
der the current paper redundant as we highlighted the role of the consumers’
marginal willingness-to-pay for quality (WTP). If there is a possibility for
consumers to differ with respect to their WTP, how does this reflect on the
strategic interaction between the competing providers’ incentive for quality
differentiation in the presence of various shocks (degree of competition, size
(or share) of state subsidies and co-payment)? We will leave this for future
research. In addition, an analysis of optimal regulation would require a fully-
fledged welfare analysis, which lies beyond the scope of this paper.27
Appendix
Equilibrium Existence for Quality
q1 ≥ 0: The optimal quality for the public provider has to be always positive.
As the numerator in equation (9) is monotonically increasing in the state
subsidy λ, q1 ≥ 0 if we have the following threshold value:
λ ≥ λ := c− T + α[U(β2 − 4kt) + 4t(β2 − 3kt+ k(T − c))]
(4kt− β2)(44)
As the amount of state funds reaches the lowest threshold (limλ−→λ), then
q1 = 0 and the price for the private provider which is independent of altruism
27Our parametric framework is not well-suited for welfare analysis in the presence of fixedtotal demand. Indeed, in a profit-maximising duopoly, we concluded that both providerswill set p = c+ t, share half of the market share, and quality first-best is implemented.
48
level is:
p∗2 =c(2kt− β2) + 2kt(t+ T )
(4kt− β2)
q2 ≥ 0: The optimal quality for the private provider has to be strictly posi-
tive. As the numerator in equation (10) is always monotonically increasing
in the state subsidy, q∗2 ≥ 0 if we have the following threshold value:
λ ≤ λ :=(T − c)(4kt− β2) + 4kt2 − αβ2(5t+ T + U − c)
β2(45)
If we set λ at its highest level λ, then q∗2 = 0 as limλ−→λ then p∗2 = c.
Numerical Example
The purpose of our numerical example is to tackle the outcomes theoretically
unverified. Hence, we illustrate how quality provision and public reporting
respond to more competition in the presence of public provider altruism. We
consider consumers’ marginal willingness-to-pay, β, is sufficiently high such
that it is below the upper threshold, β := 4kt.
(α > 0): Table 1 highlights the case where β is sufficiently high (close to β)
and λ is sufficiently low (close to λ). We aim to extend Propositions 5 and
11. We have two scenarios here. First, if the public provider is not a highly
motivated agent (α = 0.05 or α = 0.12), increased competition induces the
public provider to reduce quality provision (∂q∗1∂t
> 0). This is explained in
Proposition 2, the public provider has weak incentives to increase quality
investments in the presence of low altruistic preferences. On the contrary,
the private provider is induced to offer more quality and increase the price
49
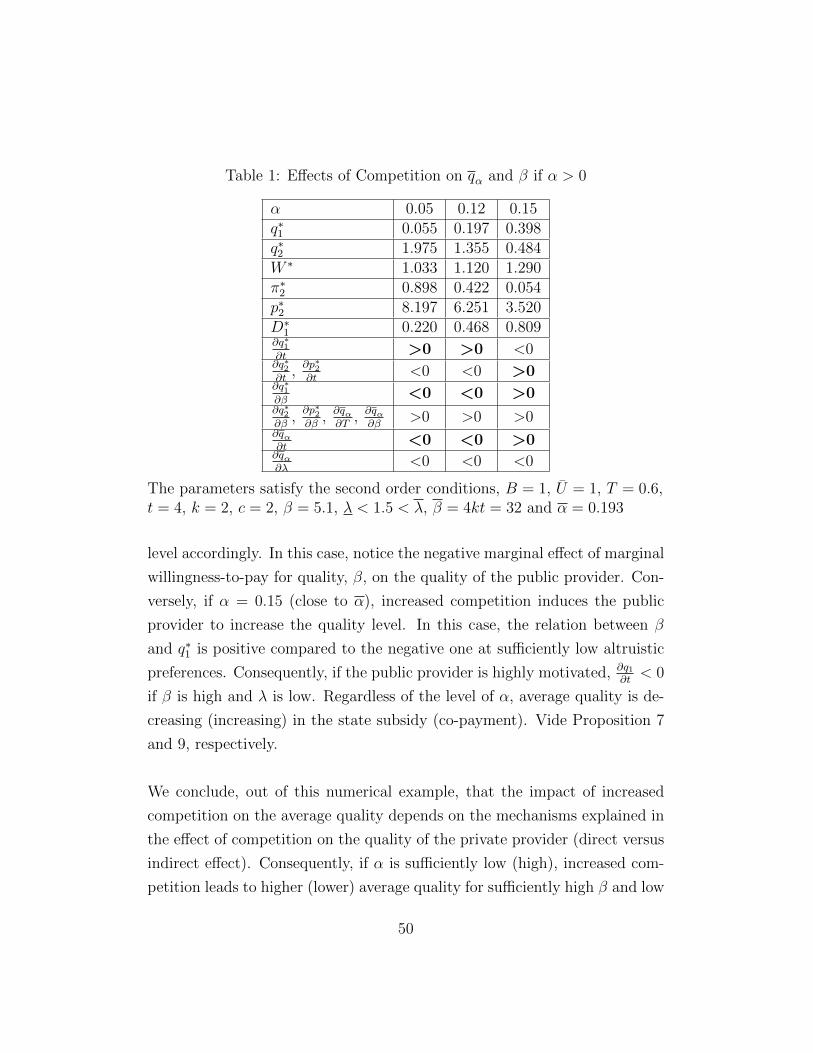
Table 1: Effects of Competition on qα and β if α > 0
α 0.05 0.12 0.15q∗1 0.055 0.197 0.398q∗2 1.975 1.355 0.484W ∗ 1.033 1.120 1.290π∗2 0.898 0.422 0.054p∗2 8.197 6.251 3.520D∗1 0.220 0.468 0.809∂q∗1∂t
>0 >0 <0∂q∗2∂t
,∂p∗2∂t
<0 <0 >0∂q∗1∂β
<0 <0 >0∂q∗2∂β
,∂p∗2∂β
, ∂qα∂T
, ∂qα∂β
>0 >0 >0∂qα∂t
<0 <0 >0∂qα∂λ
<0 <0 <0
The parameters satisfy the second order conditions, B = 1, U = 1, T = 0.6,t = 4, k = 2, c = 2, β = 5.1, λ < 1.5 < λ, β = 4kt = 32 and α = 0.193
level accordingly. In this case, notice the negative marginal effect of marginal
willingness-to-pay for quality, β, on the quality of the public provider. Con-
versely, if α = 0.15 (close to α), increased competition induces the public
provider to increase the quality level. In this case, the relation between β
and q∗1 is positive compared to the negative one at sufficiently low altruistic
preferences. Consequently, if the public provider is highly motivated, ∂q1∂t< 0
if β is high and λ is low. Regardless of the level of α, average quality is de-
creasing (increasing) in the state subsidy (co-payment). Vide Proposition 7
and 9, respectively.
We conclude, out of this numerical example, that the impact of increased
competition on the average quality depends on the mechanisms explained in
the effect of competition on the quality of the private provider (direct versus
indirect effect). Consequently, if α is sufficiently low (high), increased com-
petition leads to higher (lower) average quality for sufficiently high β and low
50
λ, where the direct (indirect) effect dominates. Furthermore, considering β
as a direct information provision parameter, increased public reporting re-
duces the quality of the public if it is not highly motivated for sufficiently low
λ. Nevertheless, average quality is increasing in response to more available
information on the providers operating in the market.
51
References
Amin, M. D., Badruddoza, S., and Rosenman, R. (2018). Quality Differenti-
ation Under Mixed Competition in Hospital Markets. Journal of Industry,
Competition and Trade, pages 1–12.
Bahr, P. R. (2014). The labor market return in earnings to community college
credits and credentials in California.
Barron, D. N. and West, E. (2017). The quasi-market for adult residential
care in the UK: Do for-profit, not-for-profit or public sector residential care
and nursing homes provide better quality care? Social Science & Medicine,
179:137–146.
Barros, P. and Martinez-Giralt, X. (2002). Public and Private Provision of
Health Care. Journal of Economics & Management Strategy, 11:109–133.
Baum, S., Ma, J., Bell, D. W., and Elliott, D. C. (2014). Trends in College
Pricing, 2014. Technical report, Trends in Higher Education Series. College
Board.
Bemo, B. (2013). Hospitals in Lebanon. Technical report, Asset Management
Unit, Beirut.
Bettinger, E. P. and Long, B. T. (2009). Addressing the needs of underpre-
pared students in higher education does college remediation work? Journal
of Human resources, 44(3):736–771.
Brekke, K. R., Nuscheler, R., and Rune Straume, O. (2006). Quality and
location choices under price regulation. Journal of Economics & Manage-
ment Strategy, 15(1):207–227.
Brekke, K. R., Nuscheler, R., and Straume, O. R. (2007). Gatekeeping in
health care. Journal of Health Economics, 26(1):149–170.
52
Brekke, K. R., Siciliani, L., and Straume, O. (2010). Price and quality in
spatial competition. Regional Science and Urban Economics, 40(6):471–
480.
Brekke, K. R., Siciliani, L., and Straume, O. (2011). Hospital Competition
and Quality with Regulated Price. The Scandinavian Journal of Eco-
nomics, 113(2):444–469.
Brekke, K. R., Siciliani, L., and Straume, O. R. (2017). Can competition
reduce quality? Journal of Institutional and Theoretical Economics.
Burgess, S., Propper, C., and Gossage, D. (2008). Competition and qual-
ity: evidence from the NHS internal market 1991-9. Economic Journal,
118:138–170.
Calem, P. and Rizzo, J. (1995). Competition and Specialization in the Hos-
pital Industry: An Application of Hotelling’s Location Model. Southern
Economic Journal, 61:1182–1198.
Cellini, R., Siciliani, L., and Straume, O. R. (2018). A dynamic model of
quality competition with endogenous prices. Journal of Economic Dynam-
ics and Control, 94:190–206.
Chiappori, P. A., Durand, F., and Geoffard, P. Y. (1998). Moral hazard
and the demand for physician services: First lessons from a French natural
experiment. European Economic Review, 42(3-5):499–511.
Cockx, B. and Brasseur, C. (2003). The demand for physician services: Evi-
dence from a natural experiment. Journal of Health Economics, 22(6):881–
913.
Cooper, Z., Gibbons, S., and Jones, S. (2011). Does hospital competition
save lives? Evidence from the English NHS patient choice reforms. The
Economic Journal, 121(554):F228–F260.
53
Cremer, H. and Maldonado, D. (2013). Mixed oligopoly in education.
D’Aspremont, C., Gabszewicz, J. J., and Thisse, J. F. (1979). On Hotelling’s
”Stability in competition”. Econometrica, 47:1145–1150.
De Fraja, G. and Iossa, E. (2002). Competition among universities and
the emergence of the Elite Institution. Bulletin of Economic Research,
54(3):275–294.
Dee, T. S. (1998). Competition and the quality of public schools. Economics
of Education Review, 17(4):419–427.
Deming, D. and Goldin, C. (2012). Does federal student aid raise tuition?
New evidence on for-profit colleges.
Deming, D., Goldin, C., and Katz, L. (2012). The for-profit postsecondary
school sector: nimble critters or agile predators? Journal of Economic
Perspectives, 26(1):139–164.
Deming, D. J. and Walters, C. R. (2017). The impact of price caps and spend-
ing cuts on US postsecondary attainment. National Bureau of Economic
Research, No. w23736.
Economides, N. (1989). Quality variations and maximal variety differentia-
tion. Regional Science and Urban Economics, 19(1):21–29.
Epple, D. and Romano, R. (1998). Competition between private and public
schools, vouchers, and peer-group effects. American Economic Review,
88:33–62.
Forder, J. and Allan, S. (2014). The impact of competition on quality and
prices in the English care homes market. Journal of Health Economics,
34:73–83.
Francois, P. and Vlassopoulos, M. (2008). Pro-social motivation and the
delivery of social services. CESifo Economic Studies, 54(1):2008.
54
Friedman, L., Avila, S., Friedman, D., and Meltzer, W. (2019). Association
between Type of Residence and Clinical Signs of Neglect in Older Adults.
Gerontology, 65(1):30–39.
Gaynor, M., Moreno-Serra, R., and Propper, C. (2013). Death by market
power: reform, competition, and patient outcomes in the National Health
Service. American Economic Journal: Economic Policy, 5(4):134–166.
Gaynor, M. and Town, R. J. (2011). Competition in Health Care Markets.
Grabowski, D. (2004). A longitudinal study of Medicaid payment, private-
pay price and nursing home quality. International Journal Health Care
Finance and Economics, 4:5–26.
Gravelle, H. (1999). Capitation contracts: access and quality. Journal of
Health Economics, 18(3):315–340.
Herr, A. (2011). Quality and Welfare in a Mixed Duopoly with Regulated
Prices: The Case of a Public and a Private Hospital. German Economic
Review, 12:422–437.
Hirth, R. A. (1997). Competition between for-profit and nonprofit health
care providers: Can it help achieve social goals? Medical Care Research
and Review, 54(4):414–438.
Hotelling, H. (1929). Stability in Competition. Economic Journal, 39:41–57.
Hoxby, C. (1994). Do private schools provide competition for public schools?
Jakobsson, N. and Svensson, M. (2016). Copayments and physicians visits: A
panel data study of swedish regions 2003–2012. Health Policy, 120(9):1095–
1099.
Jeurissen, P., Duran, A., and Saltman, R. (2016). Uncomfortable realities:
the challenge of creating real change in Europe’s consolidating hospital
sector. BMC Health Services Research, 16(2):16–23.
55
Kessler, D. and McClellan, M. (2000). Is hospital competition socially waste-
ful? Quarterly Journal of Economics, 115:577–615.
Klumpp, T. and Su, X. (2018). Price-Quality Competition in a Mixed
Duopoly.
Laine, L. T. and Ma, C. T. A. (2017). Quality and competition between
public and private firms. Journal of Economic Behavior & Organization,
140:336–353.
Landsem, M. M. and Magnussen, J. (2018). The effect of copayments on
the utilization of the GP service in Norway. Social Science & Medicine,
205:99–106.
Ma, C. T. A. and Burgess, J. F. (1993). Quality competition, welfare, and
regulation. Journal of Economics, 58(3):153–173.
Makris, M. (2009). Incentives for motivated agents under an administrative
constraint. Journal of Economic Behavior and Organization, 71(2):428–
440.
Matsumura, T. and Matsushima, N. (2007). Congestion-reducing invest-
ments and economic welfare in a Hotelling model. Economics Letters,
96(2):161–167.
OECD (2017). Choice, Competition and Markets: Education, Healthcare,
and Public Services. Technical report, OECD.
Pavel, M. S., Chakrabarty, S., and Gow, J. (2015). Assessing willingness to
pay for health care quality improvements. BMC health services research,
15(1):43.
Prendergast, C. (2007). The motivation and bias of bureaucrats. The Amer-
ican Economic Review, pages 180–196.
56
Propper, C., Burgess, S., and Green, K. (2004). Does competition between
hospitals improve the quality of care? Hospital death rates and the NHS
internal market. Journal of Public Economics, 88:1247–1272.
Romero, L. and Del Rey, E. (2004). Competition between public and private
universities: quality, prices and exams.
Sabik, L. and Gandhi, S. O. (2016). Copayments and emergency department
use among adult Medicaid enrollees. Health economics, 25(5):529–542.
Stenbacka, R. and Tombak, M. (2015). Competition between For-Profit and
Nonprofit Healthcare Suppliers and Quality.
Stenbacka, R. and Tombak, M. (2018). Optimal Reimbursement Policy in
Health Care: Competition, Ownership Structure and Quality Provision.
The BE Journal of Economic Analysis & Policy, 18(1).
Tay, A. (2003). Assessing competition in hospital care markets: the im-
portance of accounting for quality differentiation. The RAND Journal of
Economics, 34:786–814.
Tonin, M. and Vlassopoulos, M. (2010). Disentangling the sources of pro-
socially motivated effort: A field experiment. Journal of Public Economics,
94(11):1086–1092.
Wolinsky, A. (1997). Regulation of duopoly: managed competition vs
regulated monopolies. Journal of Economics & Management Strategy,
6(4):821–847.
57

Most Recent Working Paper NIPE WP 02/2019
Ghandour, Ziad R., "Public-Private Competition in Regulated Markets", 2019
NIPE WP 01/2019
Alexandre, Fernando e Miguel Portela, "A flatter life-cycle consumption profile", 2019
NIPE WP 21/2018
Veiga, Linda, Georgios Efthyvoulou e Atsuyoshi Morozumi, "Political Budget Cycles: Conditioning Factors and New Evidence", 2018
NIPE WP 20/2018
, Luigi Siciliani e Odd Rune Straume, "Dynamic Hospital Competition Under Rationing by Waiting Times", 2018
NIPE WP 19/2018
Brekke, Kurt R., Chiara Canta, Luigi Siciliani e Odd Rune Straume, "Hospital Competition in the National Health Service: Evidence from a Patient Choice Reform", 2018
NIPE WP 18/2018
Paulo Soares Esteves, Miguel Portela "Does domestic demand matter for firms' exports?", 2018
NIPE WP 17/2018
Alexandre, Fernando, Miguel Portela e Miguel Rodrigues, "Asymmetric regional dynamics: from bust to recovery", 2018
NIPE WP 16/2018
Sochirca, Elena e Pedro Cunha Neves, "Optimal policies, middle class development and human capital accumulation under elite rivalry", 2018
NIPE WP 15/2018
tical drivers of the duration of credit 2018
NIPE WP 14/2018
Arash Rezazadeh e Ana Carvalho, Towards a survival capabilities framework: Lessons from the Portuguese Textile and Clothing industry 2018
NIPE WP 13/2018
Areal, Nelson e Ana Carvalho Shoot-at-will: the effect of mass-shootings on US small gun manuf , 2018
NIPE WP 12/2018
Rezazadeh, Arash e Ana Carvalho A value-based approach to business model innovation: Defining the elements of the concept 2018
NIPE WP 11/2018
Carvalho, Ana e The Work Preferences of Portuguese Millennials - a Survey of University Students 2018
NIPE WP 10/2018
Souz e Ana Carvalho, "An Organizational Capacity model for wine cooperatives", 2018
NIPE WP 09/2018
e Odd Rune Straume, "How does the type of remuneration affect physician behaviour? Fixed salary versus fee-for-service", 2018
NIPE WP 08/2018
Martins, Susana e Cristina Amado, "Financial Market Contagion and the Sovereign Debt Crisis: A Smooth Transition Approach", 2018
NIPE WP 07/2018
Amado, Cristina, Annastiina Silvennoinen e svirta Models with Multiplicative Decomposition of Conditional Variances and Correlations
NIPE WP 06/2018
Lisi, Domenico, Luigi Siciliani e Odd Rune Straume, Hospital Competition under Pay-for-Performance: Quality, Mortality and Readmissions , 2018
NIPE WP 05/2018
r -Conraria, for Political Authorities , 2018
NIPE WP 04/2018
Aguiar-Conraria, , Manuel M. F. Martins e Maria Joana Soares Estimating the Taylor Rule in the Time-Frequency Domain
NIPE WP 03/2018
Sousa, Rita, Elsa Agante A model of efficienc
NIPE WP 02/2018
Sochirca, Elena e , 2018
NIPE WP 01/2018
Siciliani, Luigi e Odd Rune Straume, Competition and Equi 2018
NIPE WP 13/2017
Aguiar-Conraria, Maria Joana Soares e Rita Sousa, 2017
NIPE WP 12/2017
Mustapha Olalekan Ojo, -Conraria e Maria Joana Soares, "A time-frequency analysis of the Canadian macroeconomy and the yield curve", 2017.
NIPE WP 11/2017
Sousa, Rita Low-Emission Energy Outlook in a Small Island Developing States The case of Sao Tome And Principe
NIPE WP 10/2017
Vareiro, Laurentina, J. Cadima Ribeiro e Paula Remoaldosatisfaction in a cultural destination