Embed Size (px)
Citation preview

Copyright © 2010 Pearson Addison-Wesley. All rights reserved.
Chapter 18
Stabilization in an Integrated World Economy
Copyright © 2010 Pearson Addison-Wesley. All rights reserved.
18-2
Introduction
Late in the Spring of 2003, Fed officials worried that the annual inflation rate might be dropping too low, and they implemented expansionary monetary policy actions.
Actual inflation rose. So did expectations of future inflation. Fed officials concluded society might be better off accepting slightly higher inflation.
How do changes in actual inflation influence the public’s inflation expectations?
Copyright © 2010 Pearson Addison-Wesley. All rights reserved.
18-3
Learning Objectives
• Explain why the actual unemployment rate might depart from the natural rate of unemployment
• Describe why there may be an inverse relationship between the inflation rate and the unemployment rate, reflected by the Phillips curve
• Evaluate how expectations affect the actual relationship between the inflation rate and the unemployment rate

Copyright © 2010 Pearson Addison-Wesley. All rights reserved.
18-4
Learning Objectives (cont'd)
• Understand the rational expectations hypothesis and its implications for economic policymaking
• Distinguish among alternative modern approaches to strengthening the case for active policymaking
Copyright © 2010 Pearson Addison-Wesley. All rights reserved.
18-5
Chapter Outline
• Active Versus Passive Policymaking
• The Natural Rate of Unemployment
• Rational Expectations, the Policy Irrelevance Proposition, and Real Business Cycles
• Modern Approaches to Justifying Active Policymaking
• Is There a New Keynesian Phillips Curve?
• Summing Up: Economic Factors Favoring Active versus Passive Policymaking
Copyright © 2010 Pearson Addison-Wesley. All rights reserved.
18-6
Did You Know That...
• Between 1900 and 1945, a recession typically lasted 19 months, and since 1945 the average duration has fallen to 9 months.
• The average expansion between 1900 and 1945 lasted about 31 months and the average duration since has been 50 months.

Copyright © 2010 Pearson Addison-Wesley. All rights reserved.
18-7
Active Versus Passive Policymaking
• Active (Discretionary) Policymaking
– All actions on the part of monetary and fiscal policymakers that are undertaken in response to or in anticipation of some change in the overall economy
– Examples• Monetary and fiscal policy
Copyright © 2010 Pearson Addison-Wesley. All rights reserved.
18-8
Active VersusPassive Policymaking (cont'd)
• Passive (Nondiscretionary) Policymaking
– Policymaking that is carried out in response to a rule
– Examples• Monetary rule
• Balancing the budget over the business cycle
Copyright © 2010 Pearson Addison-Wesley. All rights reserved.
18-9
The Natural Rate of Unemployment
• Two components of the natural rate of unemployment
– Frictional unemployment
– Structural unemployment

Copyright © 2010 Pearson Addison-Wesley. All rights reserved.
18-10
The Natural Rate of Unemployment (cont’d)
• Frictional unemployment– Arises because individuals take the time to
search for the best job opportunities.– Much of the unemployment is of this type, except
when there is a recession or depression.
Copyright © 2010 Pearson Addison-Wesley. All rights reserved.
18-11
The Natural Rate of Unemployment (cont'd)
• Structural unemployment results from
1. Government-imposed minimum wage laws, laws restricting entry into occupations, and welfare and unemployment insurance benefits that reduce incentives to work
2. Union activity that sets wages above the equilibrium level and also restricts the mobility of labor
Copyright © 2010 Pearson Addison-Wesley. All rights reserved.
18-12
The Natural Rate of Unemployment (cont'd)
• Natural Rate of Unemployment
– The rate of unemployment that is estimated to prevail in long-run macroeconomic equilibrium
– When all workers and employers have fully adjusted to any changes in the economy

Copyright © 2010 Pearson Addison-Wesley. All rights reserved.
18-13
Example: The U.S. Natural Rate of Unemployment
• In 1950, the unemployment rate was about 5%.
• By the late 2000s, it was at this level once again.
• Figure 18-1 shows that the actual rate of unemployment has varied wildly over the decades.
• Why does the natural rate of unemployment differ from the actual rate of unemployment?
Copyright © 2010 Pearson Addison-Wesley. All rights reserved.
18-14Sources: Economic Report of the President; Economic Indicators, various issues.
Figure 18-1 Estimated Natural Rate of Unemployment in the United States
Copyright © 2010 Pearson Addison-Wesley. All rights reserved.
18-15
The Natural Rate of Unemployment (cont'd)
• Departures from the natural rate of unemployment
– Deviations of the actual from the natural rate are called cyclical unemployment.
– Deviations observed over the course of nationwide business fluctuations
Copyright © 2010 Pearson Addison-Wesley. All rights reserved.
18-16
Figure 18-2 Impact of an Increase in Aggregate Demand on Real GDP and Unemployment
Monetary or fiscal policy leads to increase in AD, and the unemployment rate falls below the natural rate
SRAS shifts, the price level is higher and the unemployment rate rises to the natural rate, real GDP returns to the LRAS level
Copyright © 2010 Pearson Addison-Wesley. All rights reserved.
18-17
Figure 18-3 Impact of a Decline in Aggregate Demand on Real GDP and Unemployment
Monetary or fiscal policy leads to decline in AD and the unemployment rate rises above the natural rate
SRAS shifts, the price level is lower, and the unemployment rate falls to the natural rate, the new equilibrium is reached
Copyright © 2010 Pearson Addison-Wesley. All rights reserved.
18-18
The Natural Rate of Unemployment (cont'd)
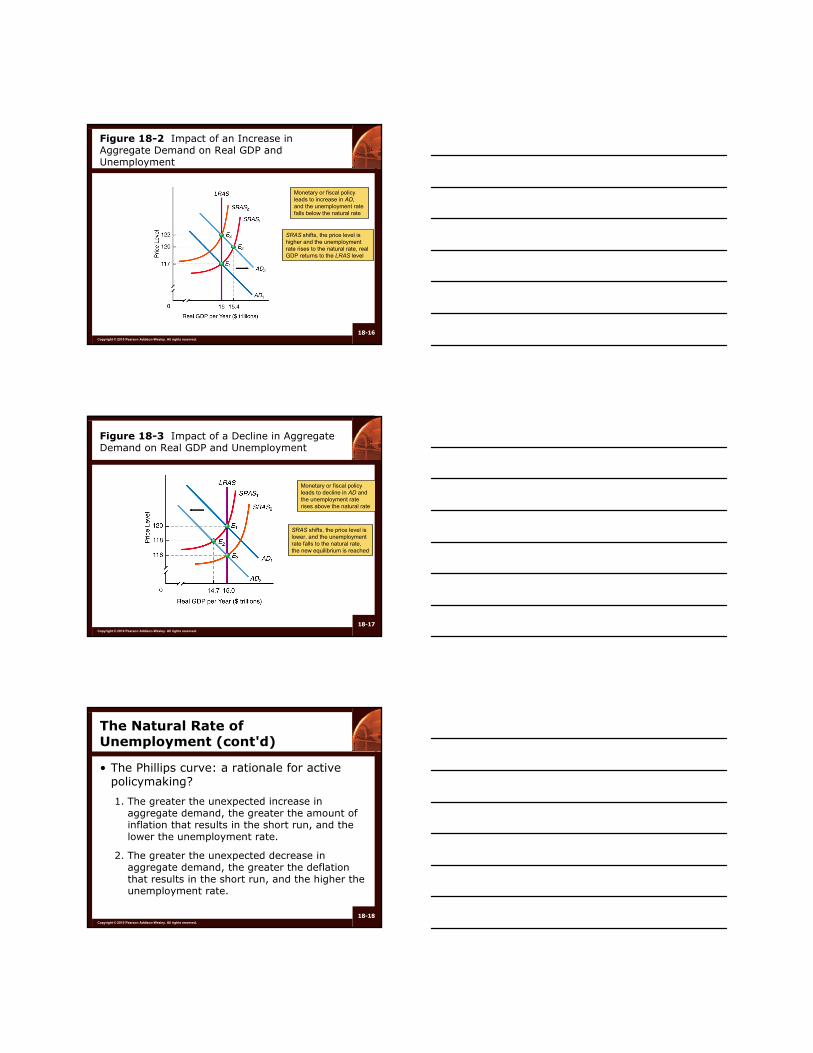
• The Phillips curve: a rationale for active policymaking?
1. The greater the unexpected increase in aggregate demand, the greater the amount of inflation that results in the short run, and the lower the unemployment rate.
2. The greater the unexpected decrease in aggregate demand, the greater the deflation that results in the short run, and the higher the unemployment rate.
Copyright © 2010 Pearson Addison-Wesley. All rights reserved.
18-19
The Natural Rate of Unemployment (cont'd)
• The Phillips Curve
– A curve showing the relationship between unemployment and changes in wages or prices
– It was long thought to reflect a trade-off between unemployment and inflation.
Copyright © 2010 Pearson Addison-Wesley. All rights reserved.
18-20
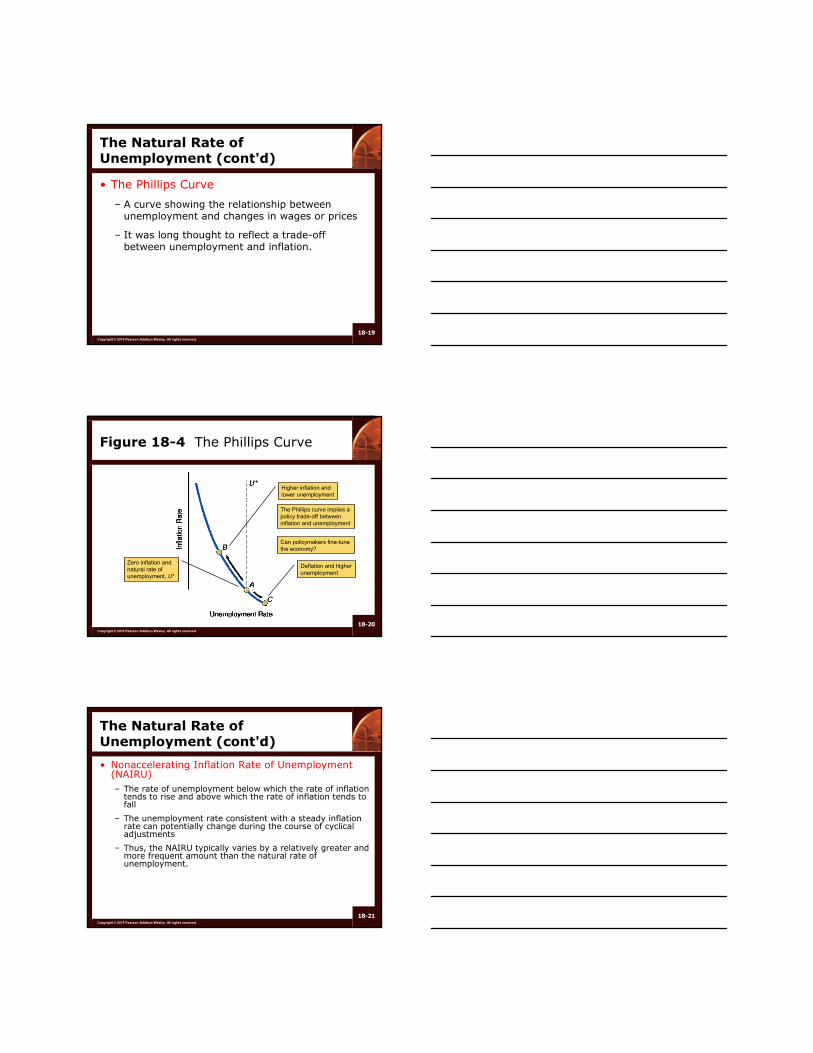
Figure 18-4 The Phillips Curve
Higher inflation and lower unemployment
Zero inflation and natural rate of unemployment, U*
Deflation and higher unemployment
The Phillips curve implies a policy trade-off between inflation and unemployment
Can policymakers fine-tune the economy?
Copyright © 2010 Pearson Addison-Wesley. All rights reserved.
18-21
The Natural Rate of Unemployment (cont'd)
• Nonaccelerating Inflation Rate of Unemployment (NAIRU)– The rate of unemployment below which the rate of inflation
tends to rise and above which the rate of inflation tends to fall
– The unemployment rate consistent with a steady inflation rate can potentially change during the course of cyclical adjustments
– Thus, the NAIRU typically varies by a relatively greater and more frequent amount than the natural rate of unemployment.

Copyright © 2010 Pearson Addison-Wesley. All rights reserved.
18-22
Figure 18-5 A Shift in the Phillips Curve
• PC0 shows expectations at zero inflation• PC5 reflects a higher expected
inflation rate, such as 5%
• There is a change in the expected inflation rate• The curve shifts to incorporate
new expectations
Copyright © 2010 Pearson Addison-Wesley. All rights reserved.
18-23
Policy Example: When It Comes to Inflation, the fed Keeps Its Eyes Off of the Headlines
• Even though media headlines focus on overall CPI inflation, during the 2000s Federal Reserve Policymakers have paid most attention to core PCE inflation.
• They prefer subtracting out food and energy prices because prices of these items tend to be more volatile than prices of other goods and services.
Copyright © 2010 Pearson Addison-Wesley. All rights reserved.
18-24
Policy Example: When It Comes to Inflation, the Fed Keeps Its Eyes Off of the Headlines (cont’d)
• Since the mid-2000s, the forecasting improvements from using current core PCE inflation to forecast future inflation rates have evaporated.
• The differential between overall inflation rates reported in media headlines and the core PCE inflation rate has been widening over time.
• If the public pays more attention to overall inflation rates reported in headlines than to the core PCE inflation rate that is the focus of Fed policy, which actual inflation rate will influence their expectations of future inflation?
Copyright © 2010 Pearson Addison-Wesley. All rights reserved.
18-25
Rational Expectations, the Policy Irrelevance Proposition, and Real Business Cycles
• Rational Expectations Hypothesis
1. Individuals base their forecasts (expectations) about the future values of economic variables on all available past and current information.
2. These expectations incorporate individuals’understanding about how the economy operates, including the operation of monetary and fiscal policy.
Copyright © 2010 Pearson Addison-Wesley. All rights reserved.
18-26
Rational Expectations, the Policy Irrelevance Proposition, and Real Business Cycles (cont’d)
• New classical approach
– A modern version of the classical model in which wages and prices are flexible
– There is pure competition in all markets.
– The rational expectations hypothesis is assumed to be working.
Copyright © 2010 Pearson Addison-Wesley. All rights reserved.
18-27
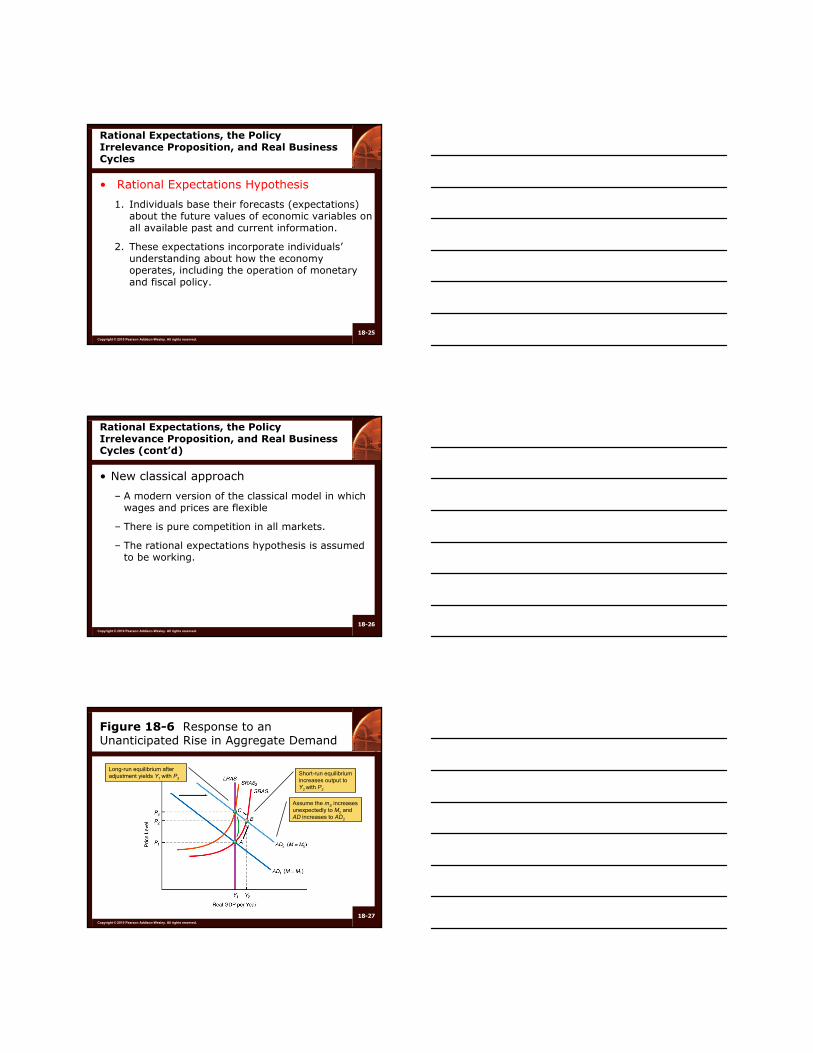
Assume the mS increases unexpectedly to M2 and AD increases to AD2
Short-run equilibrium increases output to Y2 with P2
Figure 18-6 Response to an Unanticipated Rise in Aggregate Demand
Long-run equilibrium after adjustment yields Y1 with P3

Copyright © 2010 Pearson Addison-Wesley. All rights reserved.
18-28
Rational Expectations, the Policy Irrelevance Proposition, and Real Business Cycles (cont’d)
• The response to anticipated policy
– If the increase in the money supply was anticipated• The higher price level would be anticipated
• Workers and suppliers would demand higher wages and prices immediately
Copyright © 2010 Pearson Addison-Wesley. All rights reserved.
18-29
Rational Expectations, the Policy Irrelevance Proposition, and Real Business Cycles (cont’d)
• Policy Irrelevance Proposition
– The conclusion that policy actions have no real effects in the short run if the policy actions are anticipated and none in the long run even if the policy actions are unanticipated
Copyright © 2010 Pearson Addison-Wesley. All rights reserved.
18-30
Rational Expectations, the Policy Irrelevance Proposition, and Real Business Cycles (cont’d)
• Under the assumption of rational expectations on the part of decision makers in the economy, anticipated monetary policy cannot alter either the rate of unemployment or the level of real GDP.

Copyright © 2010 Pearson Addison-Wesley. All rights reserved.
18-31
Rational Expectations, the Policy Irrelevance Proposition, and Real Business Cycles (cont’d)
• Regardless of the nature of the anticipated policy, the unemployment rate will equal the natural rate, and real GDP will be determined solely by the economy’s long-run aggregate supply curve.
Copyright © 2010 Pearson Addison-Wesley. All rights reserved.
18-32
Rational Expectations, the Policy Irrelevance Proposition, and Real Business Cycles (cont’d)
• Questions
– What must people know?
– What happens if they don’t know everything?
– What are the implications?
Copyright © 2010 Pearson Addison-Wesley. All rights reserved.
18-33
Rational Expectations, the Policy Irrelevance Proposition, and Real Business Cycles (cont’d)
• The policy dilemma
– Policy irrelevance proposition seems to suggest only mistakes have real effects
– Policymakers powerless to push real GDP and unemployment back to long-run levels when entering recessionary period
Copyright © 2010 Pearson Addison-Wesley. All rights reserved.
18-34
Figure 18-7 Effects of an Unanticipated Rise in Aggregate Demand, Panel (a)
Even with rational expectations, an unanticipated change in AD can affect real GDP in the short run
Copyright © 2010 Pearson Addison-Wesley. All rights reserved.
18-35
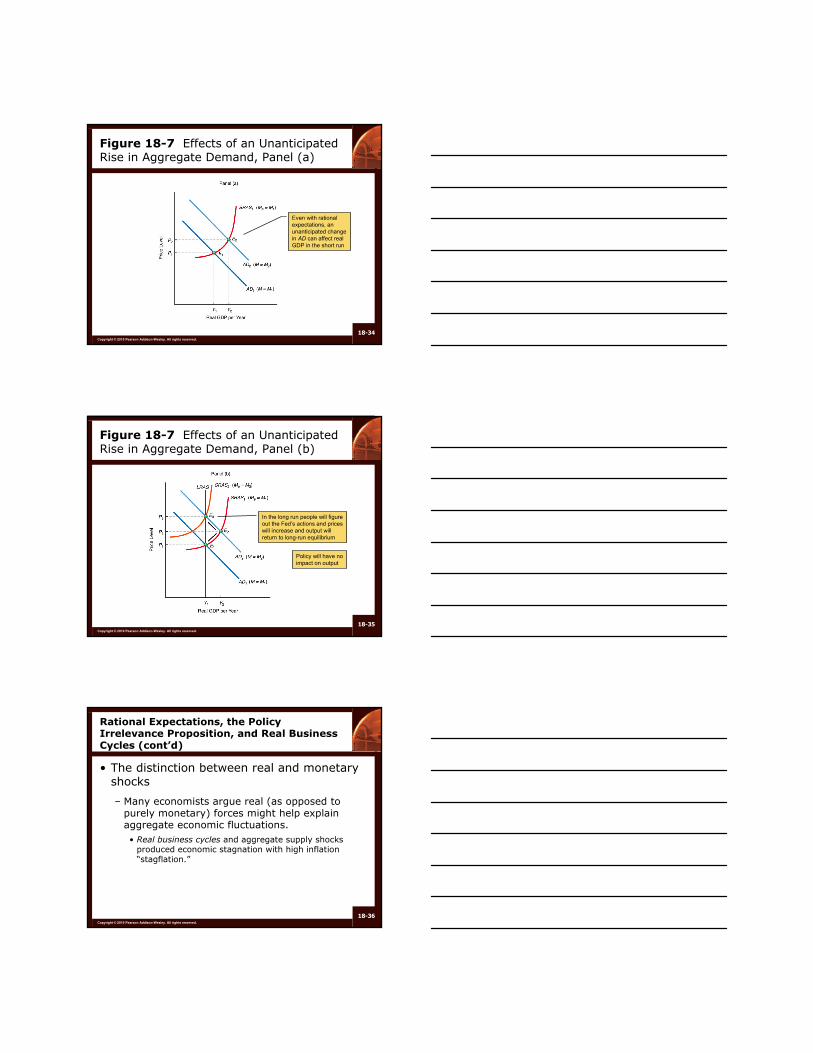
Figure 18-7 Effects of an Unanticipated Rise in Aggregate Demand, Panel (b)
In the long run people will figure out the Fed’s actions and prices will increase and output will return to long-run equilibrium
Policy will have no impact on output
Copyright © 2010 Pearson Addison-Wesley. All rights reserved.
18-36
Rational Expectations, the Policy Irrelevance Proposition, and Real Business Cycles (cont’d)
• The distinction between real and monetary shocks
– Many economists argue real (as opposed to purely monetary) forces might help explain aggregate economic fluctuations.• Real business cycles and aggregate supply shocks
produced economic stagnation with high inflation “stagflation.”
Copyright © 2010 Pearson Addison-Wesley. All rights reserved.
18-37
Rational Expectations, the Policy Irrelevance Proposition, and Real Business Cycles (cont’d)
• Questions regarding real business cycle theory
– What impact would an oil shock have on aggregate demand?
– Can we explain the Great Depression with the real business cycle theory?
– What about the apparent wage and price rigidity within the economy?
Copyright © 2010 Pearson Addison-Wesley. All rights reserved.
18-38
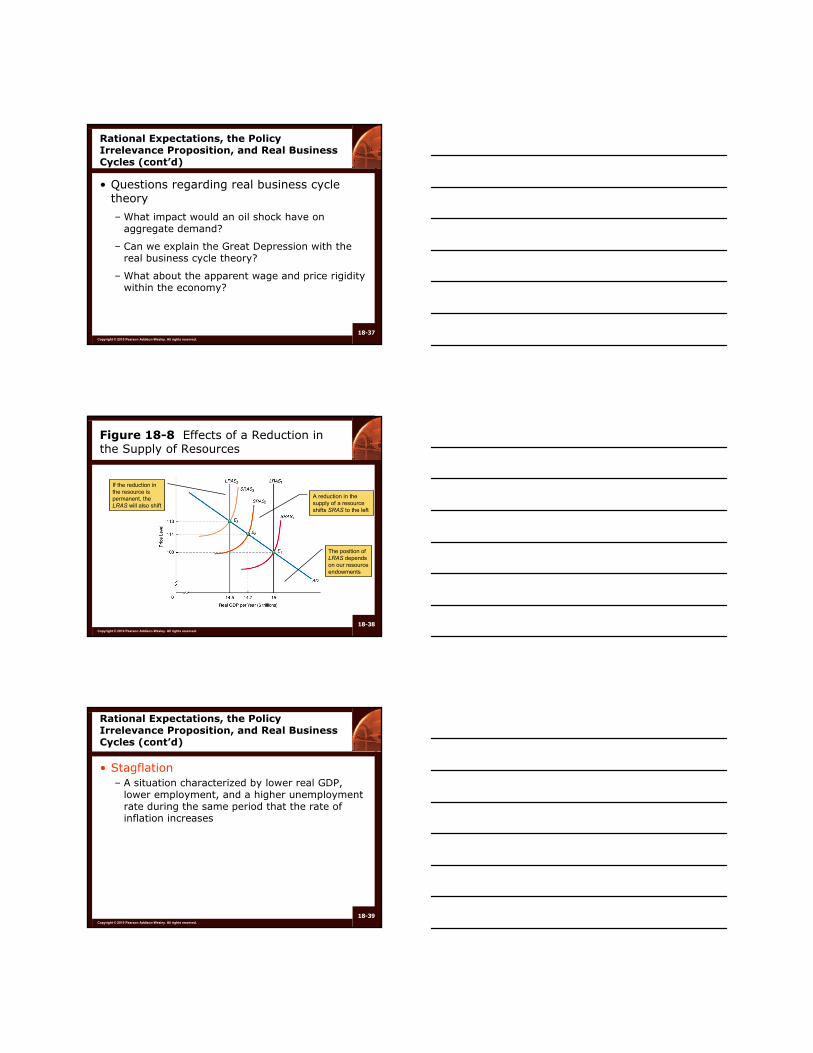
Figure 18-8 Effects of a Reduction in the Supply of Resources
If the reduction in the resource is permanent, the LRAS will also shift
A reduction in the supply of a resource shifts SRAS to the left
The position of LRAS depends on our resource endowments
Copyright © 2010 Pearson Addison-Wesley. All rights reserved.
18-39
Rational Expectations, the Policy Irrelevance Proposition, and Real Business Cycles (cont’d)
• Stagflation– A situation characterized by lower real GDP,
lower employment, and a higher unemployment rate during the same period that the rate of inflation increases

Copyright © 2010 Pearson Addison-Wesley. All rights reserved.
18-40
Modern Approaches to Justifying Active Policymaking
• Market clearing models of the economy may not fully explain business cycles.
• “Sticky” wages and prices remain important, some economists contend.
• New Keynesians have tried to refine the theory of aggregate supply.
Copyright © 2010 Pearson Addison-Wesley. All rights reserved.
18-41
Modern Approaches to Justifying Active Policymaking (cont'd)
• Small Menu Costs
– Costs that deter firms from changing prices in response to demand changes
– Examples—the costs of renegotiating contracts or printing new price lists
Copyright © 2010 Pearson Addison-Wesley. All rights reserved.
18-42
Modern Approaches to Rationalizing Active Policymaking (cont'd)
• New Keynesian Inflation Dynamics
– In new Keynesian theory, the pattern of inflation exhibited by an economy with growing aggregate demand—initial sluggish adjustment of the price level in response to increased aggregate demand followed by higher inflation later

Copyright © 2010 Pearson Addison-Wesley. All rights reserved.
18-43
Figure 18-9 Short- and Long-Run Adjustments in the New Keynesian Sticky-Price Theory, Panel (a)
Copyright © 2010 Pearson Addison-Wesley. All rights reserved.
18-44
Figure 18-9 Short- and Long-Run Adjustments in the New Keynesian Sticky-Price Theory,Panel (b)
Copyright © 2010 Pearson Addison-Wesley. All rights reserved.
18-45
Is there a New Keynesian Phillips Curve?
• The U.S. experience with the Phillips curve
– Economists Milton Friedman and E.S. Phelps published pioneering studies.
– The apparent trade-off suggested by the Phillips curve could not be exploited by activist policymakers.

Copyright © 2010 Pearson Addison-Wesley. All rights reserved.
18-46
Is there a New Keynesian Phillips Curve? (cont'd)
• The U.S. experience with the Phillips curve
– Attempts to reduce the unemployment rate by inflating the economy would be thwarted by higher inflation expectations.
– Activist policymaking would be offset; the trade-off between unemployment and inflation would disappear.
Copyright © 2010 Pearson Addison-Wesley. All rights reserved.
18-47
Figure 18-10 The Phillips Curve: Theory versus Data
Sources: Economic Report of the President; Economic Indicators, various issues.
Copyright © 2010 Pearson Addison-Wesley. All rights reserved.
18-48
Is there a New Keynesian Phillips Curve? (cont’d)
• New Keynesians say all that matters for is whether such a relationship between inflation and unemployment is exploitablein the near term.
• If so, policymakers can intervene as soon as unemployment and real GDP vary from their long-run levels, thusly dampening cyclical fluctuations and making them short-lived.

Copyright © 2010 Pearson Addison-Wesley. All rights reserved.
18-49
Is there a New Keynesian Phillips Curve? (cont’d)
• Two factors that affect inflation: – Anticipated future inflation– Average inflation-adjusted (real) per-unit costs
that firms incur in production
• Empirical evidence does indicate that these two factors are associated with higher observed rates of inflation.
Copyright © 2010 Pearson Addison-Wesley. All rights reserved.
18-50
Is there a New Keynesian Phillips Curve? (cont’d)
• Are New Keynesians correct? – Not all economists agree.– The new classical theory already indicates that
when prices are flexible, higher inflation expectations should reduce short-run aggregate supply and contribute to increased inflation.
– All macroeconomic theories suggest that various factors that push up firms’ production costs should have the same effect on short-run aggregate supply and inflation in a flexible-price economy.
– How often do firms really adjust their prices?
Copyright © 2010 Pearson Addison-Wesley. All rights reserved.
18-51
Summing Up: Economic Factors Favoring Active versus Passive Policymaking
• Most economists agree that active policymaking is unlikely to exert sizable long-run effects on any nation’s economy.
• Most agree that aggregate supply shocks contribute to business cycles.
• Some argue that monetary and fiscal policy actions can offset, at least in the short run and possibly in the long-run the effects that aggregate demand shocks would otherwise have on real GDP and unemployment.

Copyright © 2010 Pearson Addison-Wesley. All rights reserved.
18-52
Table 18-1 Issues That Must Be Assessed in Determining the Desirability of Active versus Passive Policymaking
Copyright © 2010 Pearson Addison-Wesley. All rights reserved.
18-53
Issues and Applications: Are U.S. Inflation Expectations Rising?
• New Keynesian inflation dynamics indicate that the public’s expectations of future inflation are a fundamental determinant of the current inflation rate.
• Thus, expectations of low inflation become self-fulfilling. Economists are concerned that the Fed may be tempted to exploit expectations of low future inflation, engage in inflationary policies, and thereby boost inflation expectations and then be difficult to bring back down.
Copyright © 2010 Pearson Addison-Wesley. All rights reserved.
18-54
Issues and Applications: Are U.S. Inflation Expectations Rising? (cont’d)
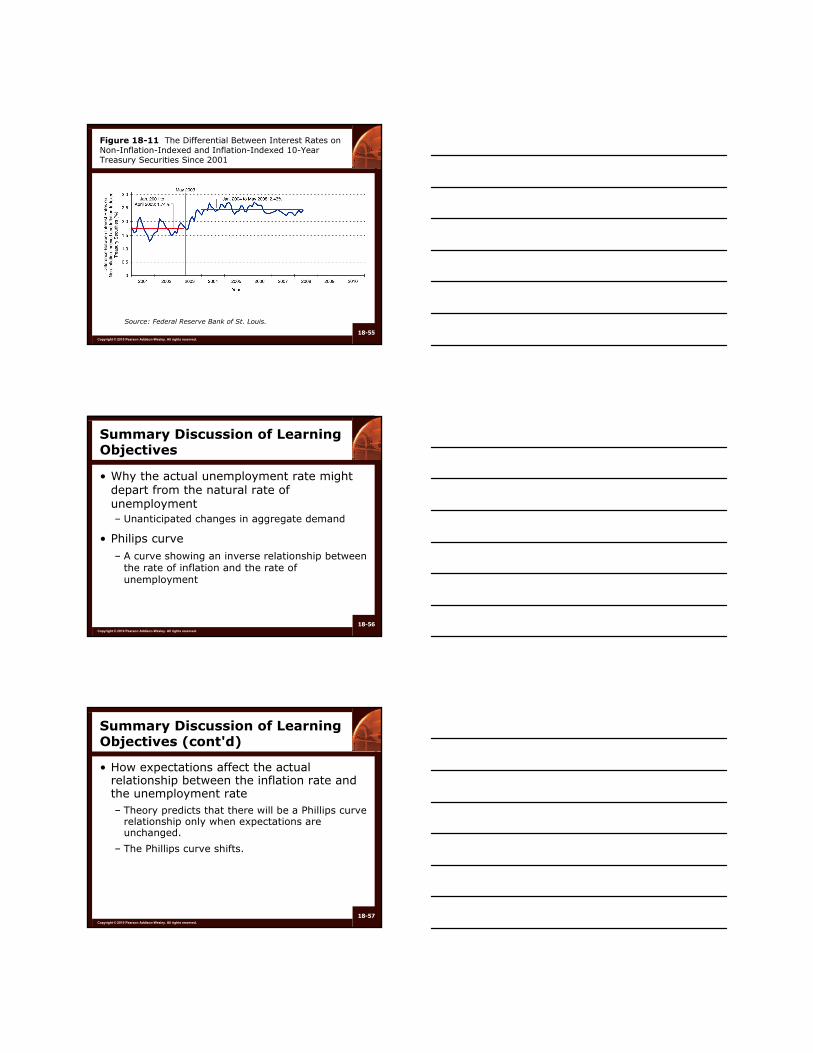
• Figure 18-11 provides evidence about how the Fed’s policy strategy following the spring of 2003 affected the public’s inflation expectations.
• Why do you suppose that some economists doubt the new Keynesian view that variations in inflation expectations and per-unit real production costs, rather than changes in money supply growth, are the main determinants of inflation?
Copyright © 2010 Pearson Addison-Wesley. All rights reserved.
18-55
Figure 18-11 The Differential Between Interest Rates on Non-Inflation-Indexed and Inflation-Indexed 10-Year Treasury Securities Since 2001
Source: Federal Reserve Bank of St. Louis.
Copyright © 2010 Pearson Addison-Wesley. All rights reserved.
18-56
Summary Discussion of Learning Objectives
• Why the actual unemployment rate might depart from the natural rate of unemployment– Unanticipated changes in aggregate demand
• Philips curve– A curve showing an inverse relationship between
the rate of inflation and the rate of unemployment
Copyright © 2010 Pearson Addison-Wesley. All rights reserved.
18-57
Summary Discussion of Learning Objectives (cont'd)
• How expectations affect the actual relationship between the inflation rate and the unemployment rate– Theory predicts that there will be a Phillips curve
relationship only when expectations are unchanged.
– The Phillips curve shifts.

Copyright © 2010 Pearson Addison-Wesley. All rights reserved.
18-58
Summary Discussion of Learning Objectives (cont'd)
• Rational expectations, policy ineffectiveness, and real-business-cycle theory– Rational expectations hypothesis
– Only unanticipated policy actions affect short-run real GDP
– Policy irrelevance theorem
– Technological changes and labor market shocks can induce business fluctuations, called real business cycles, which weaken the case for active policymaking
Copyright © 2010 Pearson Addison-Wesley. All rights reserved.
18-59
Summary Discussion of Learning Objectives (cont'd)
• Modern approaches to bolstering the case for active policymaking– New Keynesian approach suggests that firms facing
costs of adjusting their prices may be slow to change in the face of variations in demand
– Prices and wages are sufficiently inflexible in the short run that there is an exploitable relationship between inflation and real GDP
– Discretionary policy actions can stabilize real GDP in the short run