Embed Size (px)
Citation preview
PREPARED FOR THE U.S. DEPARTMENT OF ENERGY,UNDER CONTRACT DE-AC02-76CH03073
PRINCETON PLASMA PHYSICS LABORATORYPRINCETON UNIVERSITY, PRINCETON, NEW JERSEY
PPPL-3698 PPPL-3698UC-70
Thermal Response of Tritiated Codepositsfrom JET and TFTR to Transient Heat Pulses
by
C.H. Skinner, N. Bekris, J.P. Coad, C.A. Gentile,A. Hassanein, R. Reiswig, and S. Willms
May 2002
PPPL Reports Disclaimer
This report was prepared as an account of work sponsored by anagency of the United States Government. Neither the United StatesGovernment nor any agency thereof, nor any of their employees, makes anywarranty, express or implied, or assumes any legal liability orresponsibility for the accuracy, completeness, or usefulness of anyinformation, apparatus, product, or process disclosed, or represents that itsuse would not infringe privately owned rights. Reference herein to anyspecific commercial product, process, or service by trade name, trademark,manufacturer, or otherwise, does not necessarily constitute or imply itsendorsement, recommendation, or favoring by the United StatesGovernment or any agency thereof. The views and opinions of authorsexpressed herein do not necessarily state or reflect those of the UnitedStates Government or any agency thereof.
Availability
This report is posted on the U.S. Department of Energy’s PrincetonPlasma Physics Laboratory Publications and Reports web site in FiscalYear 2002. The home page for PPPL Reports and Publications is:http://www.pppl.gov/pub_report/
DOE and DOE Contractors can obtain copies of this report from:
U.S. Department of EnergyOffice of Scientific and Technical InformationDOE Technical Information Services (DTIS)P.O. Box 62Oak Ridge, TN 37831
Telephone: (865) 576-8401Fax: (865) 576-5728Email: [email protected]
This report is available to the general public from:
National Technical Information ServiceU.S. Department of Commerce5285 Port Royal RoadSpringfield, VA 22161
Telephone: 1-800-553-6847 or(703) 605-6000
Fax: (703) 321-8547Internet: http://www.ntis.gov/ordering.htm
International workshop on “Hydrogen Isotopes in Fusion Reactor Materials”
May 22-24, 2002, Sanjo-kaikan, Univ. Tokyo, Tokyo, Japan
Corresponding author: C. H. Skinner email address [email protected]
Thermal Response of Tritiated Codeposits from JET and TFTR to
Transient Heat Pulses.
C. H. Skinnera, N. Bekrisb, J. P. Coadc, C. A. Gentilea, A. Hassaneind , eR. Reiswig, and eS. Willms.
aPrinceton Plasma Physics Laboratory, Princeton, NJ, USA.bTritium Laboratory, Forschungszentrum Karlsruhe, Germany.cUKAEA Fusion, Culham Research Centre, Abingdon, Oxon, UK.dArgonne National Laboratory, Argonne, Illinois, USA.eLos Alamos National Laboratory, Los Alamos, NM 87545.
PAC: 44.10.+i 52.90.+z
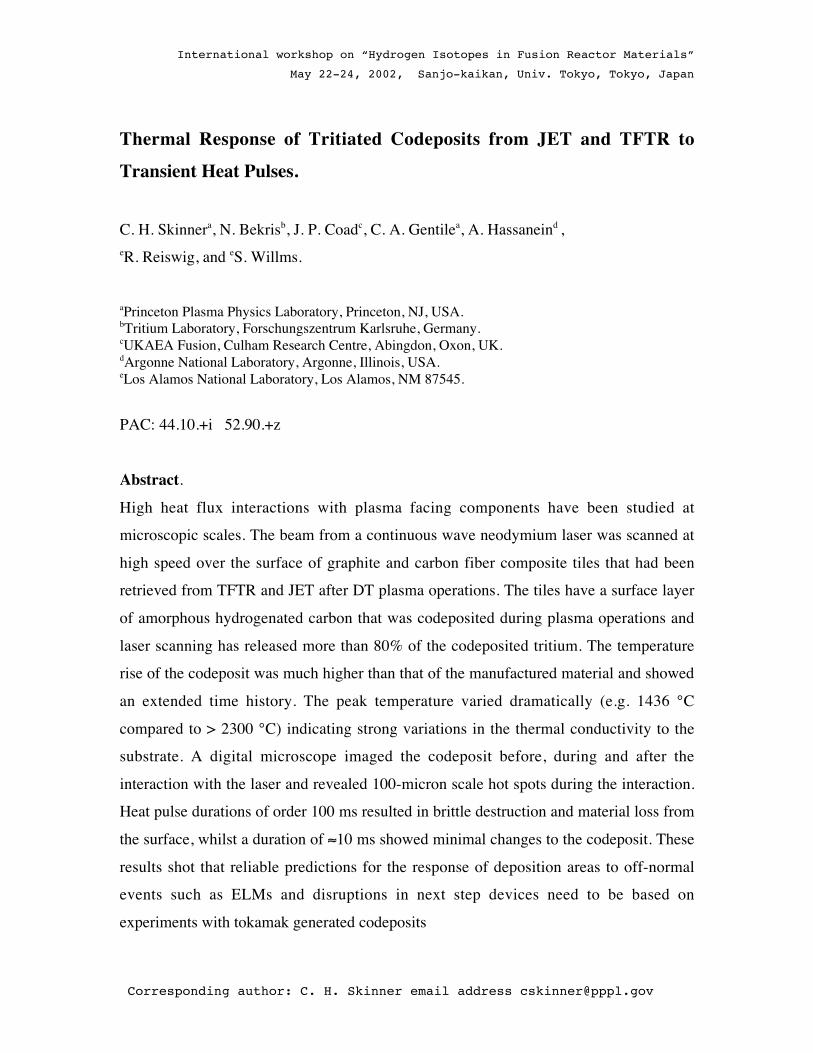
Abstract.
High heat flux interactions with plasma facing components have been studied at
microscopic scales. The beam from a continuous wave neodymium laser was scanned at
high speed over the surface of graphite and carbon fiber composite tiles that had been
retrieved from TFTR and JET after DT plasma operations. The tiles have a surface layer
of amorphous hydrogenated carbon that was codeposited during plasma operations and
laser scanning has released more than 80% of the codeposited tritium. The temperature
rise of the codeposit was much higher than that of the manufactured material and showed
an extended time history. The peak temperature varied dramatically (e.g. 1436 °C
compared to > 2300 °C) indicating strong variations in the thermal conductivity to the
substrate. A digital microscope imaged the codeposit before, during and after the
interaction with the laser and revealed 100-micron scale hot spots during the interaction.
Heat pulse durations of order 100 ms resulted in brittle destruction and material loss from
the surface, whilst a duration of ≈10 ms showed minimal changes to the codeposit. These
results shot that reliable predictions for the response of deposition areas to off-normal
events such as ELMs and disruptions in next step devices need to be based on
experiments with tokamak generated codeposits
C. H. Skinner Page 2 -
1. Introduction
The intense heat loads during ELMs and disruptions on plasma facing components in a
next step device is a major concern for their survivability and operational lifetime[1-3].
Very high heat flux will produce sublimation, heating and explosion of gases trapped in
the pores, and thermal stresses and fatigue in graphite and carbon-fiber-composite (CFC)
materials. These conditions cannot be duplicated in existing tokamaks because of the
large difference in energy stored in the plasma. Even measuring the power deposition
during ELMs in existing machines is challenging. Uncertainties in the thermal
conductivity of deposited surface layers can lead to factor 3 overestimates of the power
flux[4]. Carbon based materials have shown high erosion losses in disruption simulation
facilities that use electron beams[5], pulsed lasers[6], plasma guns [7] and other high
power devices[8]. Comprehensive modeling codes[9] have been used simulate the
conditions from the transport of the core plasma to the scrape-off-layer, the subsequent
generation of a vapor shield at the divertor, and the reduced divertor plate lifetime due to
melt layer loss and brittle destruction[10].
A scanning laser beam has been used to rapidly heat codeposited layers on tiles from
tokamaks and release hydrogen isotopes[11]. Up to 87% of the codeposited tritium has
been thermally desorbed from tile samples from the Joint European Torus (JET) and the
Tokamak Fusion Test Reactor (TFTR) in laboratory experiments[12]. The technique is
attractive for tritium removal in a next-step DT device since it avoids the use of
oxidation, the associated deconditioning of the plasma facing surfaces and expense of
processing large quantities of tritium oxide[13,14]. Although designed for tritium
removal, this approach offers an opportunity to study in microscopic detail the
thermomechanical response of tokamak generated codeposits to transient high heat
fluxes. The response is measured without the complications of vapor shielding, which
may attenuate the thermal flux in a tokamak. Laboratory experiments on codeposits on
JET and TFTR tiles showed that the temperature rise of the codeposit was significantly
higher than that of the manufactured tile material at the same heat flux (e.g. 1770 °C cf.
C. H. Skinner Page 3 -
1080 °C) indicating a much lower effective thermal conductivity for the codeposits[15].
In the present paper we focus on the thermal response to the laser heat flux and the
morphology of the codeposits. The tritium release aspects are reported in refs. [11,12].
2. Experimental setup
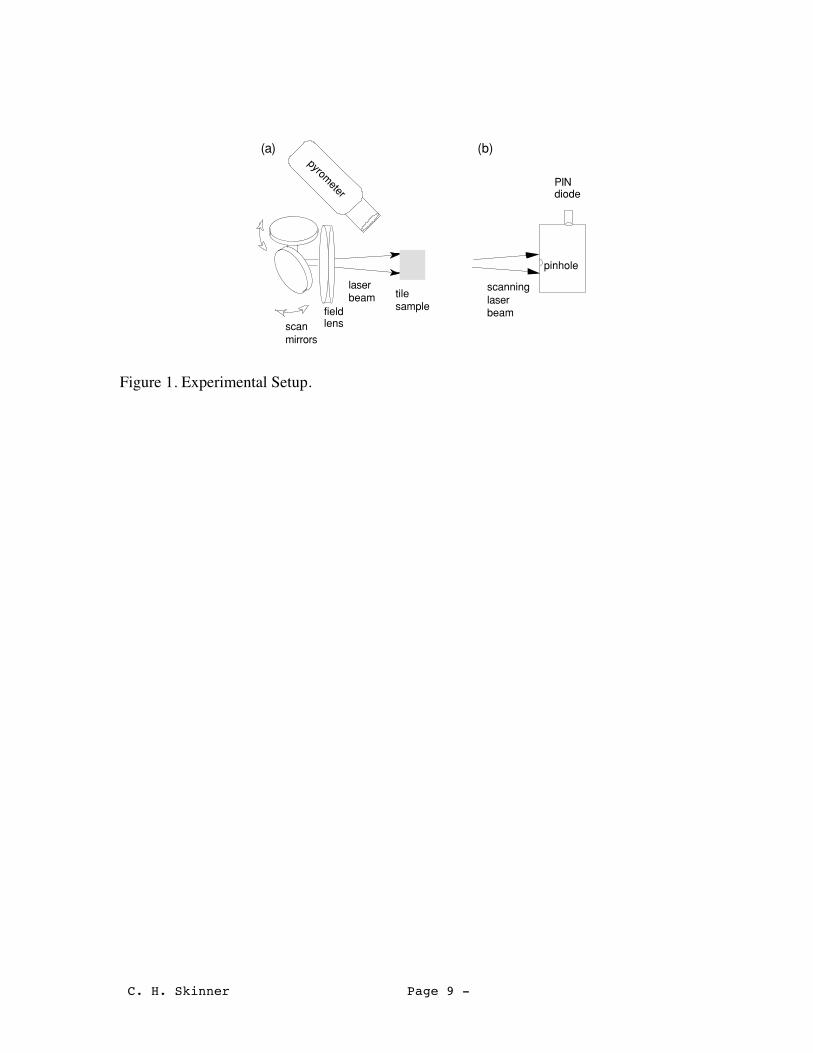
The experimental set up is shown in Fig. 1 and fully described in [11]. Briefly, a 325 W
continuous wave Nd laser beam is steered by two orthogonal mirrors and focused inside a
chamber containing a tile sample from either JET or TFTR. The laser spot can be scanned
over a field of 75 x 75 mm with a velocity of up to 2 m/s. The spot trajectory is defined
by programming the motion of the scan mirrors via a computer interface. Typically, a
serpentine raster pattern with line spacing 0.5 mm is used to cover the tile surface. The
complete laser spot extends over a few mm so a given location on the tile experiences
first the fringe of the laser spot, then the center, then the fringe in ≈ 6 successive passes.
A pyrometer measures surface temperatures in the range 500 – 2300 °C with 0.3 ms time
resolution, and averages over a 0.7 mm area on the tile surface. Before and after laser
irradiation the tile surface is photographed by a digital microscope to record any changes
in the surface. The atmosphere in the tile chamber was either argon or air. Released
tritium was circulated in a closed loop to an ion chamber that measured the tritium
concentration. Results from TFTR tiles showed a major fraction of the tritium was
desorbed with minimal changes to the tile surface at a laser intensity of 80 W/mm2 and
scan speeds of order 1 m/s[11].
The time dependence of the heat flux from the scanning laser spot was measured by
placing a 35-micron pinhole at the same position as used for the tile surface and
recording the transmitted laser light with a PIN diode (Fig. 1(b)). The laser system has
been recently upgraded with fiber optic coupling between the laser and scanner to mimic
the arrangement proposed for the tokamak applications and the focal spot was measured
in this configuration. The intensity profile was reconstructed from the laser intensity
transmitted through the pinhole during a typical raster scan at full power and speed 1 m/s.
The full width half maximum diameter was 1.6 mm similar to previous measurements of
C. H. Skinner Page 4 -
marks made by a stationary laser spot on a tile for both fiber coupled and direct coupled
cases. With fiber coupling the maximum laser intensity on the sample was 128 W/mm2.
3. Thermal response
The laser beam generated a brilliant incandescent spot, heating the codeposits to
temperatures from 1500 to above 2300 °C (the pyrometer operates in the region 500 –
2300 °C). In contrast the temperature rise for erosion areas or for the original
manufactured material was much lower (1000 °C to 1500 °C). Analytical modeling of a
semi-infinite, homogeneous solid under a constant heat flux indicated that the results for
the codeposit could be matched by arbitrarily reducing both the effective thermal
conductivity and density by a factor-of-two compared to the coefficients for the
manufactured materials[15]. However it is clear that the deposits are far from
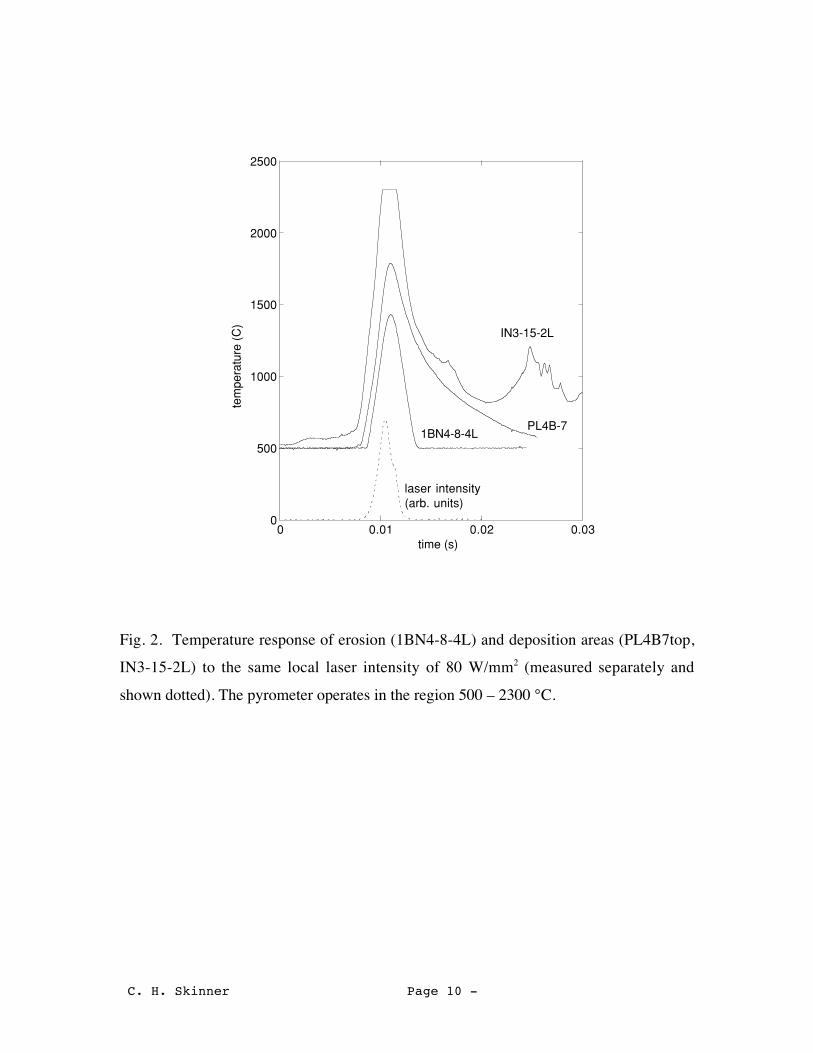
homogeneous. Figure 2 shows the time history of the temperature excursion of three
samples and the laser flux as transmitted by the 35-micron pinhole at the same scan speed
in a separate experiment. The laser heating pulse duration is 4 ms, scan speed 1 m/s, laser
intensity 80 W/mm2 and the samples are in argon. The JET sample 1BN4-8-4L reaches a
peak temperature of 1434 °C and remains above 500 °C for 5.3 ms. This sample is from
an erosion area on the base divertor tile 4 on JET. Sample PL4B7top is from a deposition
area on the JET poloidal limiter and the temperature response peaks at 1790 °C and
shows a longer cool down time or ‘tail’ in the time history due to lower conductivity or
poor thermal contact between the deposit and underlying tile. JET sample IN3-15-2L had
a particularly striking temperature response. This sample is from the lower edge of
divertor tile 3 (adjacent to the louvers) and the codeposit had the heaviest tritium
concentration of any analyzed JET or TFTR tile. Remarkably, the temperature increases
to above 2300 °C and then rises again after the laser pulse has passed (before the next
pass of the laser spot). This “ragged” character in the temperature time history was
evident on several samples with thick codeposits. Even though the ambient atmosphere is
argon, XPS analysis[16] has shown atomic concentrations of oxygen of up to 50%
(excluding H-isotopes) on these samples from the long exposure to humid air after
retrieval from the vessel. These oxides present can participate in chemical reactions and
C. H. Skinner Page 5 -
oxidation reactions are believed to account for the second temperature peak in the IN3-
15-2L trace in Fig. 2.
Non-linear behavior was seen in the variation of temperature with duration of heating.
For an idealized homogeneous material the temperature rise would increase with the
square root of the heat pulse duration. In contrast, the peak temperature of TFTR samples
did not increase much above 2000 °C even when the scan speed was decreased from
1000 mm/s to 25 mm/s[11].
4. Microscopy of the deposits.
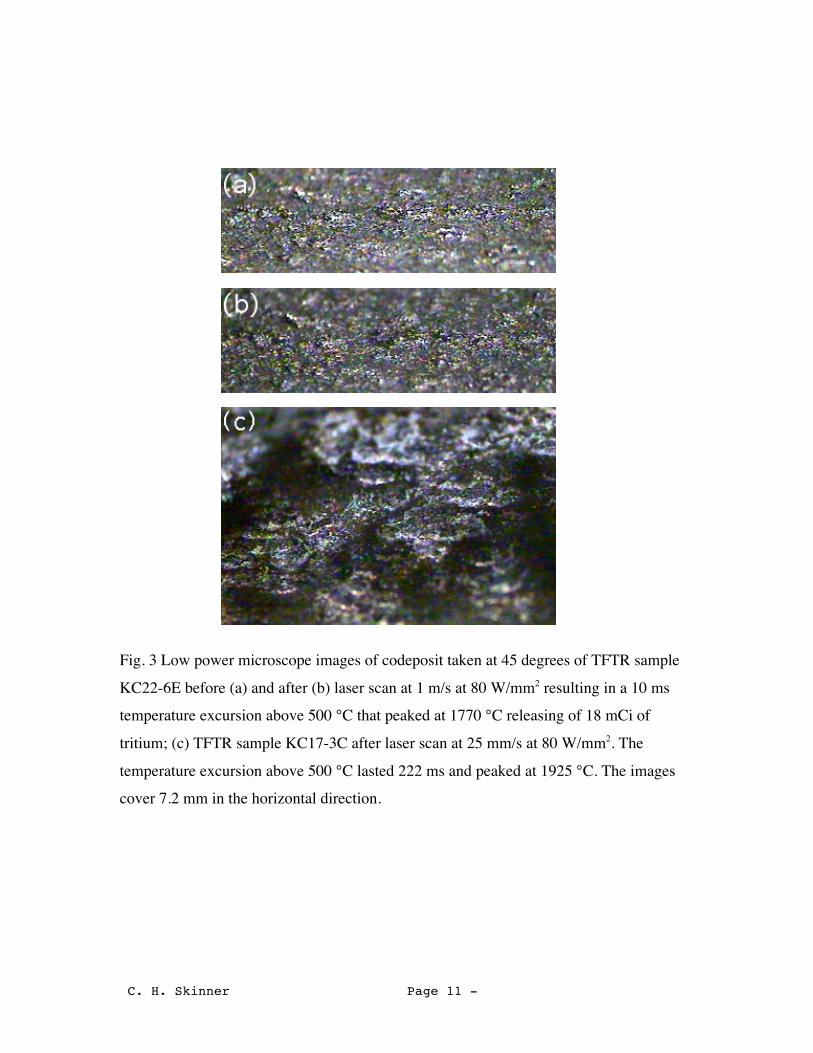
A low power digital microscope imaged the surface of the tile samples before, during,
and after the laser scan. The original codeposited surface exhibited granulation and
irregularities. At high scan speeds (≈ 1000 mm/s) the relatively short duration of the
heating pulse and shallow (≈ 100 micron) depth of the heat penetration [11] resulted in a
darkening of the surface but the codeposit appeared largely undisturbed (Fig. 3(b) and
ref. [12]). In contrast, at the slowest scan speeds (25 mm/s) severe surface damage was
observed, indicating that additional heat absorption mechanisms such as surface ablation
had become active (Fig. 3(c)).
Macroscopic erosion of carbon based materials depends on the net power flux to the
surface, exposure time and the threshold energy required for brittle destruction. This is
estimated from disruption simulation experiments using manufactured tile surfaces to be
≈ 10kJ/g, or 20 kJ/cm3. The present experiments indicate that this threshold is
significantly lower for codeposits because of their poor thermal contact with the
underlying tile. This may be inconsequential for the erosion lifetime of the underlying
plasma facing components but will cause impurity influx as the surface layers sublime at
high temperatures.
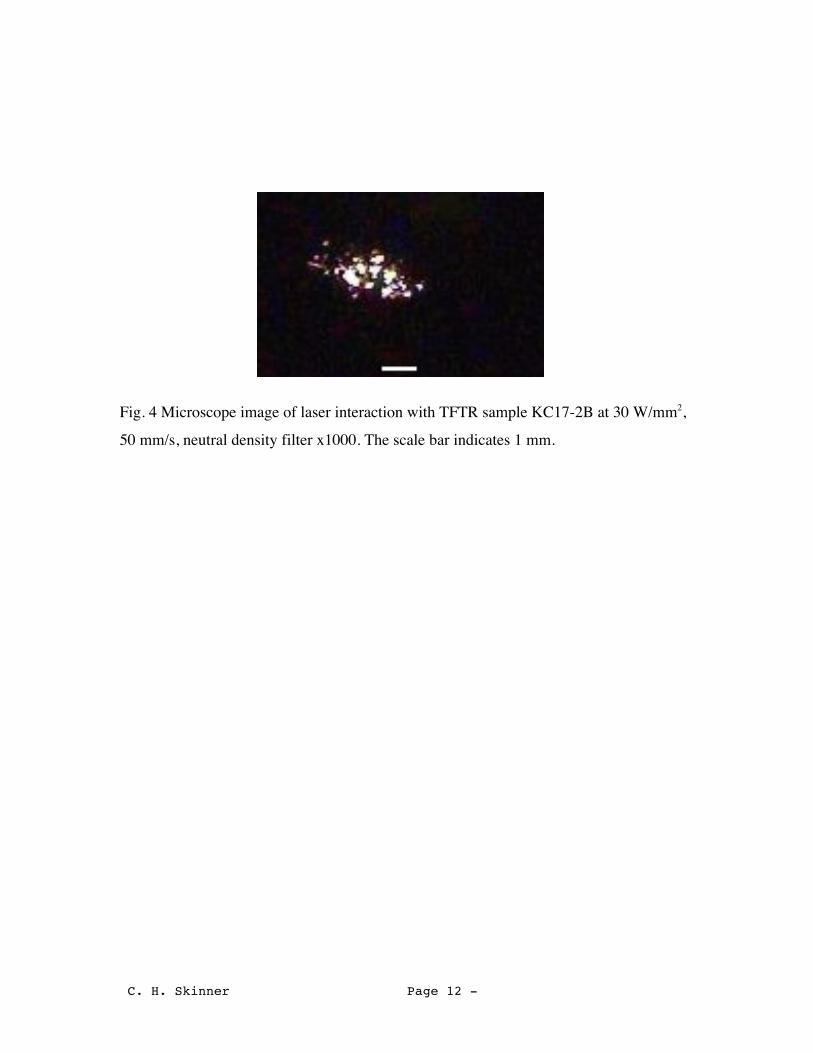
The microscope was used in video mode at 30 frames/s to image the tile surface during
the laser interaction. A still from the video is shown in Fig. 4. Micro ‘hotspots’ of 100-
micron scale are evident within the laser spot indicating that the temperature recorded
within the 0.7 mm diameter viewing area of the pyrometer is an average over these
features. It is clear that loosely attached microscopic particles, flakes and other features
C. H. Skinner Page 6 -
strongly modulate the surface thermal conductivity. Features that are poorly thermally
connected to the underlying material will experience higher temperature excursions. The
range from threshold to saturation of an 8-bit CCD camera signal corresponds to a factor
2-3 temperature change and it is likely that for a pyrometer temperature of 2000 °C some
of these particles sublime when the temperature locally reaches the sublimation threshold
3367 °C. The surface of JET sample IN3-16 had comparable Be and C concentrations[17]
from deposition and preferential erosion of carbon. This is a tokamak generated “mixed
material”. After laser exposure, a pattern of 100 µm beads appeared on the surface of this
sample.
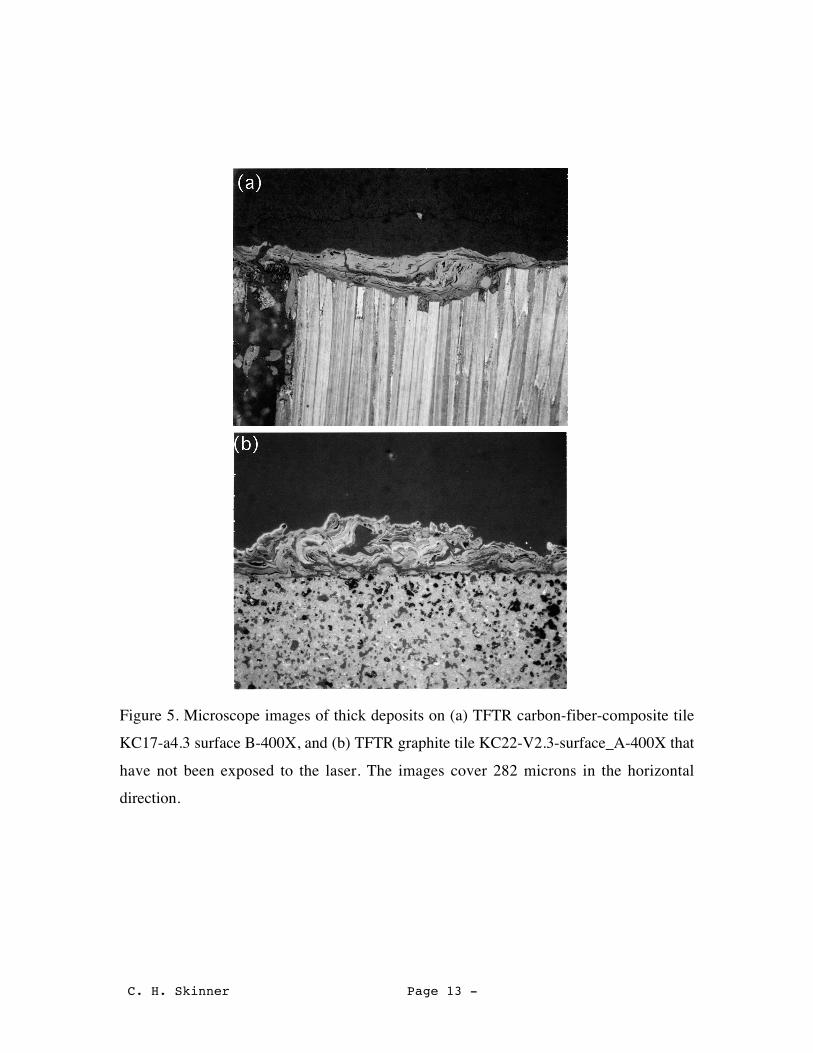
Some TFTR tile samples were imaged in a metallographic microscope(Fig. 5). These
specimens were not exposed to the laser and were mounted for grinding and polishing by
placing them in 3.2 cm diameter plastic cups. A mixture of epoxy resin and hardener was
poured over them, the assembly was pressurized to 500-800 psig with nitrogen and the
resin allowed to solidify overnight. The resin was post-cured at 60-70 °C for two hours to
increase its the hardness, and the samples were ground on rotating discs coated with fixed
diamond abrasive, (80, 120, and 220 grit), until the desired amount of material was taken
off, typically 1-10 mm. These samples were polished with 30 and 6-micron diamond flat
polishing pads with little nap (Struersf Pan), a 3 micron diamond Struers Mol pad (wool,
low nap) and a final polish on 1 micron diamond using Struers Nap cloth - a long nap
rayon. Water was the lubricant for all grinding and polishing steps. Microscope images
were recorded on Polaroid film, scanned to convert to digital format and the contrast
optimized.
The images show a remarkably convoluted structure with distinct strata and voids on
multiple spatial scales that is completely different to the manufactured graphite and CFC.
The structure reflects the complex history of the last years of plasma operations on
TFTR. Earlier images of TFTR codeposits also showed complex structures[18].
5. Summary
Laser scanning offers a convenient way to simulate the effect of high heat flux on
codeposited tile samples and study the effects on important microscopic scales. The high
C. H. Skinner Page 7 -
duty cycles planned for next-step tokamaks will inevitably increase the amount of erosion
and deposition by plasma wall interactions. When carbon is used as a plasma facing
material the surface of some plasma facing components will be covered by amorphous
hydrocarbon deposits with thermomechanical properties significantly different to the
manufactured material. The more open porous structure of a codeposit leads to a reduced
thermal conductivity and higher surface temperatures with increased duration in response
to a transient heat pulse. Microscopic features on the deposit cause spatial variations in
conductivity and temperature on a 100-micron scale. Expectations of the thermal
response based on the coefficients for manufactured materials will be unrealistic for such
deposits. A codeposited plasma facing surface may sublime and generate an impurity
influx under high heat flux even though the temperature excursion calculated for the
manufactured tile material remains much below the sublimation threshold. Reliable
predictions for the response of deposition areas to off-normal events such as ELMs and
disruptions need to be based on experiments with tokamak generated codeposits.
C. H. Skinner Page 8 -
Figure Captions:
Fig. 1 Experimental Setup.
Fig. 2 Temperature response of erosion (1BN4-8-4L) and deposition areas (PL4B7top,
IN3-15-2L) to the same local laser intensity of 80 W/mm2 (measured separately
and shown dotted). The pyrometer operates in the region 500 – 2300 °C.
Fig. 3 Low power microscope images of codeposit taken at 45 degrees of TFTR sample
KC22-6E before (a) and after (b) laser scan at 1 m/s at 80 W/mm2 resulting in a
10 ms temperature excursion above 500 °C that peaked at 1770 °C releasing of 18
mCi of tritium; (c) TFTR sample KC17-3C after laser scan at 25 mm/s at 80
W/mm2. The temperature excursion above 500 °C lasted 222 ms and peaked at
1925 °C. The images cover 7.2 mm in the horizontal direction.
Fig. 4 Microscope image of laser interaction with TFTR sample KC17-2B at 30 W/mm2,
50 mm/s, neutral density filter x1000. The scale bar indicates 1 mm.
Fig. 5 Microscope images of thick deposits on (a) TFTR carbon-fiber-composite tile
KC17-a4.3 surface B-400X, and (b) TFTR graphite tile KC22-V2.3-surface_A-
400X that have not been exposed to the laser. The images cover 282 microns in
the horizontal direction.
C. H. Skinner Page 9 -
Figure 1. Experimental Setup.
tilesample
laserbeam
pyrometer
scanmirrors
fieldlens
scanning laserbeam
pinhole
PINdiode
(a) (b)
C. H. Skinner Page 10 -
Fig. 2. Temperature response of erosion (1BN4-8-4L) and deposition areas (PL4B7top,
IN3-15-2L) to the same local laser intensity of 80 W/mm2 (measured separately and
shown dotted). The pyrometer operates in the region 500 – 2300 °C.
0
500
1000
1500
2000
2500
0 0.01 0.02 0.03
tem
pera
ture
(C
)
time (s)
IN3-15-2L
PL4B-71BN4-8-4L
laser intensity(arb. units)
C. H. Skinner Page 11 -
Fig. 3 Low power microscope images of codeposit taken at 45 degrees of TFTR sample
KC22-6E before (a) and after (b) laser scan at 1 m/s at 80 W/mm2 resulting in a 10 ms
temperature excursion above 500 °C that peaked at 1770 °C releasing of 18 mCi of
tritium; (c) TFTR sample KC17-3C after laser scan at 25 mm/s at 80 W/mm2. The
temperature excursion above 500 °C lasted 222 ms and peaked at 1925 °C. The images
cover 7.2 mm in the horizontal direction.
C. H. Skinner Page 12 -
Fig. 4 Microscope image of laser interaction with TFTR sample KC17-2B at 30 W/mm2,
50 mm/s, neutral density filter x1000. The scale bar indicates 1 mm.
C. H. Skinner Page 13 -
Figure 5. Microscope images of thick deposits on (a) TFTR carbon-fiber-composite tile
KC17-a4.3 surface B-400X, and (b) TFTR graphite tile KC22-V2.3-surface_A-400X that
have not been exposed to the laser. The images cover 282 microns in the horizontal
direction.

C. H. Skinner Page 14 -
Acknowledgement:
This work is partially funded under the European Fusion Development Agreement, by
the UK Department of Trade and Industry, and by U.S. DOE Contract Nos. DE-AC02-
76CH0307, and W-31-109-Eng-38.
C. H. Skinner Page 15 -
References
[1] G. Federici et al., Nucl. Fusion, 41, 1967, ( 2001).
[2] A. Hassanein and I. Konkasbaev, J. Nucl. Mater., 290-293, 1074 (2001).
[3] H. Wurz, S. Pestchanyi, B. Bazylev, I. Landman, F. Kappler, J. Nucl. Mater., 290-
293, 1138 (2001).
[4] S. Clement et al., J. Nucl. Mater., 266-269, 285 (1999).
[5] J. Linke et al., Fusion Technol., B. Keen, M. Huguet, and R. Hemsworth, eds.,
(1990) pp. 428-423.
[6] J. G. van der Laan, et al., J. Nucl. Mater., 196-198, 612 (1992).
[7] T. Burtseva, A. Hassanein, I. Ovchinnikov and V. Titov, J. Nucl. Mater., 290-293,
1059 (2001).
[8] A. V. Burdakov et al., J. Nucl. Mater. 233-237, 697-700 (1996)
[9] A. Hassanein and I. Konkashbaev, J. Nucl. Mater. 273, 326-333 (1999).
[10] M. I. Guseva et al., J. Nucl. Mater., 220-222, 957 (1995).
[11] C. H. Skinner et al., J. Nucl. Mater., 301 (2002) 98.
[12] C. H. Skinner, N. Bekris, J. P. Coad, C. A. Gentile, M. Glugla, Proceedings of the
Fifteenth International Conference on Plasma-Surface Interactions in Controlled
Fusion Devices, Gifu, Japan, May 27-31st, to be published in J. Nucl. Mater.
(2002).
[13] C. H. Skinner and G. Federici “Tritium Issues in Next-step Devices” Proceedings
of the International Conference on Advanced Diagnostics for Magnetic and
Inertial Fusion, Varenna, Italy, Italy Sept. 3-7th, 2001, Kluwer Academic/Plenum,
New York (2002)
[14] C. H. Skinner, et al., Proceedings of the 6th International Conference on Tritium
Science and Technology, Tsukuba City, Ibaraki, Japan, Nov 11-16th to be
published in Fusion Science and Technology (2002).
[15] C. H. Skinner, C. A. Gentile, and A. Hassanein, Proceedings of the 19th
IEEE/NPSS Symposium on Fusion Engineering (SOFE) Atlantic City, N.J.,
Jan.22-25th, 2002. IEEE, Piscataway, NJ, USA (2002)
C. H. Skinner Page 16 -
[16] M. T. Paffett, R. S. Willms, C. A. Gentile and C. H. Skinner, Proceedings of the
6th International Conference on Tritium Science and Technology, Tsukuba City,
Ibaraki, Japan, Nov 11-16th to be published in Fusion Science and Technology
(2002)
[17] J. P. Coad et al., J. Nucl. Mater., 290-293 (2001) 224.
[18] B. E. Mills, D. A. Buchenauer, A. E. Pontau and M. Ulrickson, J. Nucl. Mater.,
162-164, 343 (1989).
03/26/01
External Distribution
Plasma Research Laboratory, Australian National University, AustraliaProfessor I.R. Jones, Flinders University, AustraliaProfessor João Canalle, Instituto de Fisica DEQ/IF - UERJ, BrazilMr. Gerson O. Ludwig, Instituto Nacional de Pesquisas, BrazilDr. P.H. Sakanaka, Instituto Fisica, BrazilThe Librarian, Culham Laboratory, EnglandLibrary, R61, Rutherford Appleton Laboratory, EnglandMrs. S.A. Hutchinson, JET Library, EnglandProfessor M.N. Bussac, Ecole Polytechnique, FranceLibrarian, Max-Planck-Institut für Plasmaphysik, GermanyJolan Moldvai, Reports Library, MTA KFKI-ATKI, HungaryDr. P. Kaw, Institute for Plasma Research, IndiaMs. P.J. Pathak, Librarian, Insitute for Plasma Research, IndiaMs. Clelia De Palo, Associazione EURATOM-ENEA, ItalyDr. G. Grosso, Instituto di Fisica del Plasma, ItalyLibrarian, Naka Fusion Research Establishment, JAERI, JapanLibrary, Plasma Physics Laboratory, Kyoto University, JapanResearch Information Center, National Institute for Fusion Science, JapanDr. O. Mitarai, Kyushu Tokai University, JapanLibrary, Academia Sinica, Institute of Plasma Physics, People’s Republic of ChinaShih-Tung Tsai, Institute of Physics, Chinese Academy of Sciences, People’s Republic of ChinaDr. S. Mirnov, TRINITI, Troitsk, Russian Federation, RussiaDr. V.S. Strelkov, Kurchatov Institute, Russian Federation, RussiaProfessor Peter Lukac, Katedra Fyziky Plazmy MFF UK, Mlynska dolina F-2, Komenskeho
Univerzita, SK-842 15 Bratislava, SlovakiaDr. G.S. Lee, Korea Basic Science Institute, South KoreaMr. Dennis Bruggink, Fusion Library, University of Wisconsin, USAInstitute for Plasma Research, University of Maryland, USALibrarian, Fusion Energy Division, Oak Ridge National Laboratory, USALibrarian, Institute of Fusion Studies, University of Texas, USALibrarian, Magnetic Fusion Program, Lawrence Livermore National Laboratory, USALibrary, General Atomics, USAPlasma Physics Group, Fusion Energy Research Program, University of California at San
Diego, USAPlasma Physics Library, Columbia University, USAAlkesh Punjabi, Center for Fusion Research and Training, Hampton University, USADr. W.M. Stacey, Fusion Research Center, Georgia Institute of Technology, USADr. John Willis, U.S. Department of Energy, Office of Fusion Energy Sciences, USAMr. Paul H. Wright, Indianapolis, Indiana, USA
The Princeton Plasma Physics Laboratory is operatedby Princeton University under contract
with the U.S. Department of Energy.
Information ServicesPrinceton Plasma Physics Laboratory
P.O. Box 451Princeton, NJ 08543
Phone: 609-243-2750Fax: 609-243-2751
e-mail: [email protected] Address: http://www.pppl.gov