Embed Size (px)
Citation preview
1
PPC CIMERWAINVESTOR SITE VISIT
17 – 18 August 2015
Darryll Castle – CEO
Tryphosa Ramano – CFO
Pepe Meijer – MD International
Busi Legodi – CEO CIMERWA

22
ContextAbout Rwanda
About CIMERWA
Cement Manufacturing
Questions
Agenda

3
4
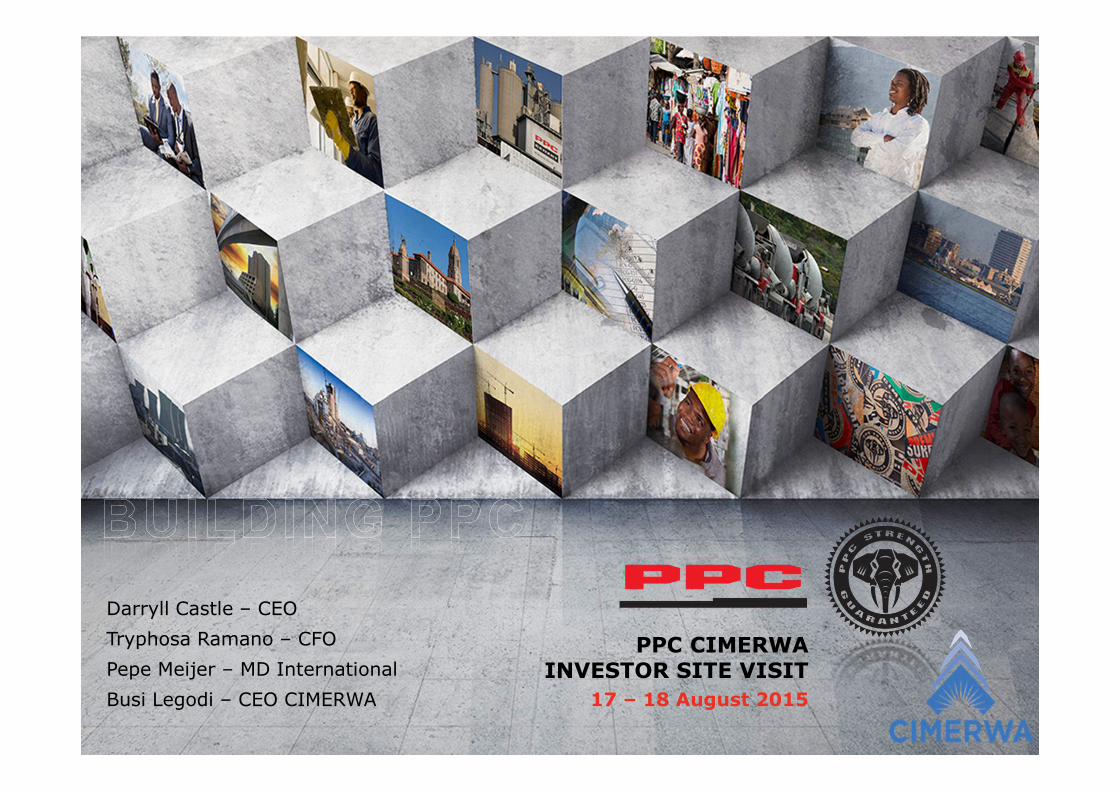
About Rwanda
Source: Rwanda Development Board
• Rwanda is a landlocked country situated in central Africa, known as ’the land of a thousand hills’
• Rwanda has five volcanoes, twenty-three lakes and numerous rivers, some forming the source of the River Nile
• The country lies 75 miles south of the equator in the Tropic of Capricorn, 880 miles ’as the crow flies’ west of the Indian Ocean and 1 250 miles east of the Atlantic Ocean - literally in the heart of Africa
• Rwanda is bordered by Uganda to the north, Tanzania to the east, Burundi to the south and the Democratic Republic of Congo to the west
• The Volcanoes National park is world famous for mountain gorillas, while Lake Kivu to the west offers beautiful beaches, jutting peninsulas and an archipelago of islands

5
About Rwanda
• Rwanda’s economy expanded by an average of 6.9% from 2010 - 2014
• The country is expected to grow at 7% - 8% p.a. in the medium term
• Agriculture accounts for a third of Rwanda’s GDP
• It constitutes the main economic activity for rural households (especially women) and remains their main source of income
• The sector meets 90% of the national food needs and contributes significantly to the country’s export revenues
• Rwanda came 32nd out of 189 countries in the 2014 Word Bank Doing Business Report
• It takes 6 working hours to register abusiness
• Rwanda is the most competitive place to do business in East Africa and 3rd in Africa (WEF-Global Competitiveness Index Report 2013-2014)
Source: NKC Research, Rwanda Development Board, National Bank of Rwanda, IMF
33%
2%
5%1%
8%14%
4%
7%
27%
Agriculture, Forestry & Fishing (33%) Mining & Quarrying (2%)
Manufacturing (5%) Industry (1%)
Construction (8%) Wholesale & retail trade (14%)
Transport (4%) Real Estate (7%)
Services (27%)
0.00%
2.00%
4.00%
6.00%
8.00%
10.00%
2010 2011 2012 2013 2014 2015f 2016f 2017f 2018f 2019f 2020f
Rwanda Gross Domestic Product

6
Imports (USD), 2013/2014
About Rwanda
• Rwanda has seen an increasing share of mining exports such as coltan (tantalite) and tin
• These have started surpassing traditional exports like coffee and tea
• Despite this, Rwanda continues to record a trade deficit of over $1.3 billion
• The country’s balance of payments is driven largely by the merchandise trade account as well as transfers (predominantly donor)
• In 2014, Rwanda recorded a current account deficit of ~10.5% of GDP
• This is expected to stabilise to ~4% of GDP in the medium term
• The deficit is expected to be comfortably financed by FDI, however the country's narrow export base and reliance on aid-flows does make it susceptible to external shocks
• Fitch and S&P both have the country’s credit rating at B+ with stable outlook Source: NKC Research, Rwanda Development Board, National Bank of Rwanda
Exports (USD), 2013/2014
-
100 000 000
200 000 000
300 000 000
400 000 000
500 000 000
600 000 000
700 000 000
Foodproducts
ConsumerGoods
IndustrialProducts
ConstructionMaterials
Fuel CapitalGoods
2013 2014
-
20 000 000
40 000 000
60 000 000
80 000 000
100 000 000
120 000 000
140 000 000
160 000 000
Coffee Tea Cassiterite (Tin) Coltan Other
2013 2014

7
About Rwanda
• The Human Development Index (HDI) is a summary measure for assessing long-term progress in three basic dimensions of human development: • a long and healthy life• access to knowledge • a decent standard of living
• Rwanda’s HDI value for 2013 is 0.506— which is in the low human development category—positioning the country at 151 out of 187 countries and territories
• Between 1980 and 2013, Rwanda’s HDI value increased from 0.291 to 0.506, an increase of 74%
• Rwanda’s 2013 HDI of 0.506 is above the average of 0.502 for countries in Sub-Saharan Africa
• In 2013, the average life expectancy in sub-Saharan Africa was 56.8 years with 9.7 years of expected schooling
Source: United Nations Development Programme, 2014
Human Development Index
Year Life expectancy at birth Expected years of schooling
GNI per capita (2011 PPP$)
HDI Value
1980 48.0 4.9 892 0.291
1985 49.4 5.5 899 0.312
1990 32.6 5.7 832 0.238
1995 31.3 6.3 682 0.230
2000 47.7 7.3 739 0.329
2005 55.2 8.3 959 0.391
2010 62.3 9.5 1 238 0.453
2013 64.1 13.2 1 403 0.506

8
About Rwanda
• Of the ~11 million population of Rwanda, 40% are youth (aged 14 – 35 years); 53% of the urban Kigali city population are youth (of which, 79% are migrants into Kigali)
• A larger share of urban than rural young people attended secondary school and obtained a higher level of education
• 84% of young people between 15 and 24 are literate• Youth unemployment is higher in urban areas (9%) than in rural areas (3%), and is at 4% country-wide
• Overall, the current percentage of the population living in urban settlements is about 15%, and this number is expected to increase to 35% by 2017
• More urban settlements will need to be developed as well as secondary cities in combination with Kigali
• An estimated 450 000 dwellings are required in Kigali (at an average 10 tons of cement per dwelling)
Source: Rwanda Development Board, National Institute of Statistics of Rwanda, 2014


10
About CIMERWA
• CIMERWA was commissioned in 1984 by governments of Rwanda and China
• In 2001, the plant’s capacity was increased from 50 000 to 100 000
• The business was privatised in 2006 and PPC purchased it’s 51% stake in 2013
• Construction on the new $170 million, 600 000 ton per annum plant commenced early in 2013
• By June 2015, civil construction, mechanical erection and electrical installations were complete
• Cold commissioning commenced in March 2015
• Hot commissioning of the limestone crusher was completed in April 2015
• Hot commissioning of the raw mill was completed in May 2015
• Kiln light-up was completed in mid-June 2015 with the first clinker produced at the end of June 2015
• The provisional acceptance certificate is expected by the end of August 2015
CIMERWA has successfully moved from running a 100 000 tpa, wet feed kiln system to a state-of-the-art, five stage preheater calcinerthat can produce 600 000 tpa of cement – Now, a regional player

11
About CIMERWA
• Key differences between typical SA and Rwanda costs
• Delivered product in SA (~25% of costs)
• Electricity over 2 times more expensive than typical SA plant
• Thermal energy about 6 times more expensive than typical SA plant – coal from Southern Africa via Mombasa (Kenya) to Rwanda
• Gypsum about 6 times more expensive than typical SA plant – brought in by road from Kenya, about 1500 km away
• Paper bags imported from North Africa
• Currently employing 215 permanent staff, set to rise to 220 permanent staff as new plant ramps up
• 23% of staff involved in cement operations – kilns and mills
• 21% involved in administration, HR as well as Sales and Marketing
• 20% of staff in the engineering department
• 10% of staff involved in mining and quarrying
• 8% of staff working in the laboratory
• 18% other involved in various functions
* Thermal energy is a combination of coal (50%), peat (40%), charcoal (5%) and heavy fuel oil (5%)
Key cost componentsFixed
Proportion of cost of sales
Depreciation 18%
Overheads 7%
Staff costs 5%
Key cost componentsVariable
Proportion ofcost of sales
Electricity 19%
Gypsum 9%
Maintenance 4%
Paper bags 9%
Thermal energy* 26%
Other 4%
Anticipated input costs: steady state

12
About CIMERWA
• Kiln heat consumption of 3.51 MJ/kg clinker
• Currently making use of generators provided by Rwanda Energy Group but will connect to national grid in the medium term
• Retail prices of cement: $240 - $290 per ton
• Retail price = Factory gate price
• + VAT (18%)
• + distribution costs (18%-22%)
• + retailer margin (~3%)
• EBITDA Margin guidance of 30% - 35%
• $94 million project funding consisting of US dollar (63%) and Rwandan francs (37%)
• The USD denominated debt bears interest at 650 basis points above LIBOR and is repayable over a ten year period (2+8)
• The RwF denominated debt is at a fixed interest rate of 16% p.a. and is repayable over a ten year period (2+8)
• Taxation:• Capital allowances – 50% allowance on first year of production, thereafter the balance over 20 years
• Import and customs duties – exemption of importation of plant and machinery; savings of ~5%
• Depreciation in line with PPC group policy

13
Route to market
• CIMERWA’s main target market is Rwanda, with Kigali the main consumption node accounting for approximately 55 – 65% of local demand
• Target export markets of Burundi as well as south Kivu and north Kivu in the eastern DRC
• We expect exports to contribute ~30% of total sales volume in the long-term
• Our local cement will initially be sold at the factory gate whilst we evaluate the business case for deliveries, mainly to Kigali
• For this purpose we will be implementing a management platform to control the planning and execution of logistics
• This platform will enable CIMERWA to effectively penetrate its main target market, and to optimise its cost to serve as well as inbound logistics
• A combination of contracted and ad-hoc vehicles will be used; this is an opportunity to capacitate the Rwanda transport industry
• All exports are expected to remain on a collect basis
• Whilst the current business model assumes bagged product sales only, we are excited about the near-future prospects of delivering a bulk solution to the industrial and construction segments in Kigali
6%
7%
8%
9%
300 000
400 000
500 000
600 000
700 000
800 000
900 000
2015 2016 2017 2018 2019 2020
Cement consumption (tpa) GDP growth % (rhs)
40
45
50
55
60
65
70
10 500 000
11 000 000
11 500 000
12 000 000
12 500 000
13 000 000
13 500 000
2015 2016 2017 2018 2019 2020
Population Cement consumption per capita (kg) - rhs
Source: IMF, Cemnet and PPC calculations
Cement consumption & GDP (forecasts)
Cement consumption per capita (forecasts)

14
Competitive landscape
Hima
(Lafarge
Holcim)
National (Simba)
Bamburi
(LafargeHolcim)
Mombasa
Savannah
EAPCC
ARM
Kilimanjaro
TPCC (Heidelberg)
Lake Cement
CIMERWA
Buceco
Mtwara
(Dangote)
ARM
Tanga (Afrisam)
ARM
Bamburi
(LafargeHolcim)
Mombasa
ARM
TororoKampala
Moroto Sanghi
Mbeya
(LafargeHolcim)
Interlacs
(Heidelberg)
Interlacs
(Heidelberg)

16
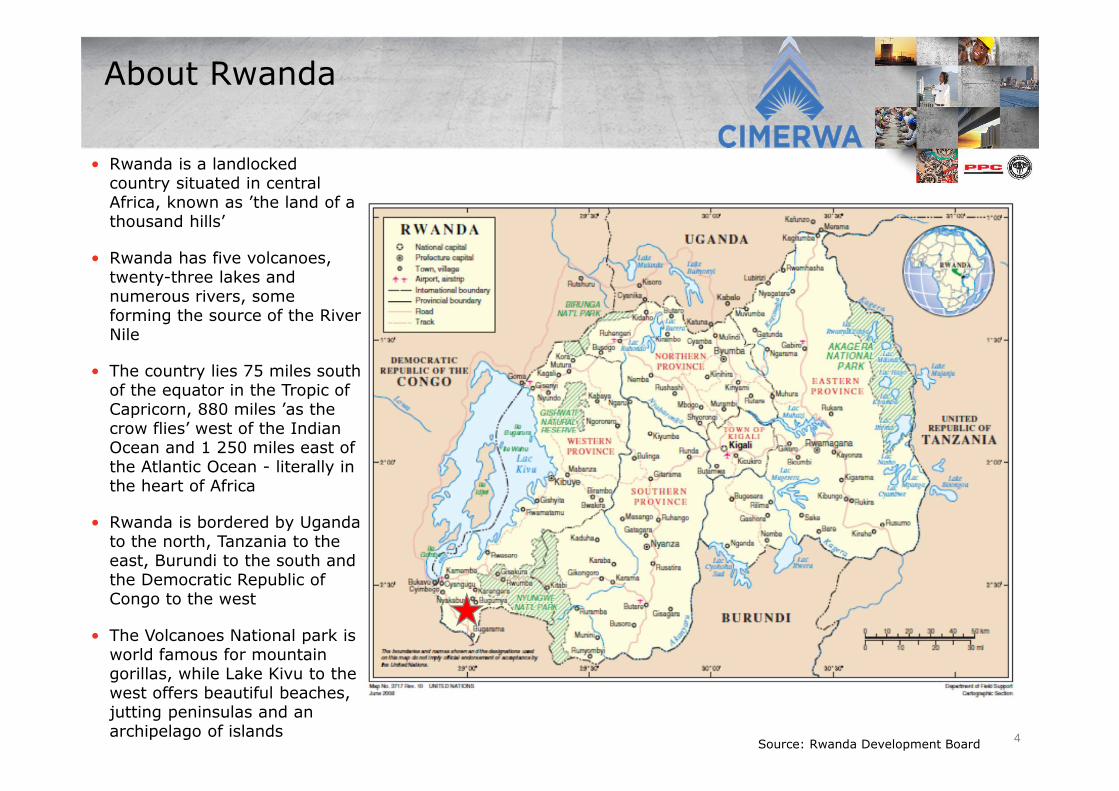
Cement manufacturing process

17
Cement manufacturing process
Oxide Source % kiln feed
CaO Limestone ~88%
SiO2 Sand/shale ~6%
Al2O3 Shale ~5%
Fe2O3 Iron ore ~1%
CALCINATION
As limestone is heated to approximately 850°C, it begins to ‘calcine’ or decarbonate → CO2 gas is driven off
CaCO3 → CaO (lime) + CO2 (gas)
In cement manufacture, CO2 is formed during
Calcination and
Coal combustion (Ccoal + O2 → CO2)
We can reduce CO2 emissions per ton of cement through
Improved efficiency (less coal burnt)
Greater extension of cements (lower clinker content)

18
Quarrying and crushing stage
• Primary raw material for cement manufacture is calcium carbonate (limestone)
• Obtained from the quarry • first, removal of overburden• then, rock is blasted• loaded into trucks and • transported to the crusher
• A multistage crushing process reduces the rock to stone less than 25mm in diameter
• About 1.5 tons of limestone is needed to produce one ton of cement

19
Blending and storage stage
• Crushed rock stored in stockpiles
• Controlled process of stacking and reclaiming across the stockpile
• Blending takes place and a uniform raw material is achieved
• Systematic sampling and laboratory testing monitor this process
• Shale, iron ore and sand also stored in stockpiles

20
Raw milling and homogenisation
• Measured quantities of the various raw materials are fed via raw mill silos
• Steel balls grind the material to fine powder called raw meal
• Homogenising silos are used to store the meal where it’s mixed thoroughly
• Kiln feed is uniform, which is the prerequisite for efficient functioning of the kiln and good quality clinker

21
Pre-heating & cooling stage
• Raw meal is fed into one end of the kiln, either directly or via a preheater system and pulverised coal is burnt at the other end
• Raw meal slowly cascades down the rotating inclined kiln towards the heat and temperature reaches 1 450 °C where a process called clinkering occurs
• Nodules of clinker drop into coolers and are taken away by conveyors to clinker storage silos
• Gas leaving the kiln is cleaned by electrostatic precipitators prior to discharge into the atmosphere
Why cool the clinker?
• To ‘freeze’ clinker minerals formed in the kiln
• Recover and return heat to the process →reduce overall energy consumption
• If very hot clinker enters finishing mills, gypsum overheating can occur → false setting of cement

22
Cement milling
• Cement mills use steel balls of various sizes to grind clinker together with a small quantity of gypsum to a fine powder which is cement
• Gypsum is required to control setting times
• Finished cement is stored in silos where further blending ensures consistency
• Thereafter, loading and dispatching occurs

23
Questions?

24
This document including, without limitation, those statements concerning the demandoutlook, PPC’s expansion projects and its capital resources and expenditure, contain certainforward-looking statements and views. By their nature, forward-looking statements involverisk and uncertainty and although PPC believes that the expectations reflected in suchforward-looking statements are reasonable, no assurance can be given that such expectationswill prove to be correct. Accordingly, results could differ materially from those set out in theforward-looking statements as a result of, among other factors, changes in economic andmarket conditions, success of business and operating initiatives, changes in the regulatoryenvironment, other government action and business and operational risk management.
Whilst PPC takes reasonable care to ensure the accuracy of the information presented, PPCaccepts no responsibility for any damages, be they consequential, indirect, special orincidental, whether foreseeable or unforeseeable, based on claims arising out ofmisrepresentation or negligence arising in connection with a forward-looking statement. Thisdocument is not intended to contain any profit forecasts or profit estimates, and theinformation published in this document is unaudited.
Disclaimer

25
CIMERWA Board of Directors
Tryphosa
Ramano
Board Member

26
CIMERWA Management Team

27
Azola Lowan Investor Relations
Vuyo Nombila Investor Relations
Tel. +27 11 386 9000www.ppc.co.za
Investor Contacts


![[PPC 2.0] - Netpeak.ua[PPC 2.0] [PPC 2.0] это уникальный продукт агентства Netpeak [PPC 2.0] = [Контекстная реклама настоящего]](https://img.dokumen.tips/doc/110x75/5ec6c856cbf7fc191035d24f/ppc-20-ppc-20-ppc-20-foe-f-.jpg)