Embed Size (px)
Citation preview

EFFECTS OF p,p’-DDE ON REPRODUCTION AND BIOMARKERS OF
ENDOCRINE DISRUPTION IN FATHEAD MINNOWS (Pimephales promelas)
By
ELIZABETH JORDAN RAY
A THESIS PRESENTED TO THE GRADUATE SCHOOL OF THE UNIVERSITY OF FLORIDA IN PARTIAL FULFILLMENT
OF THE REQUIREMENTS FOR THE DEGREE OF MASTER OF SCIENCE
UNIVERSITY OF FLORIDA
2006

Copyright 2006
by
Elizabeth Jordan Ray

This work is dedicated to the loving and cheerful spirit of my grandpa, Owen.

iv
ACKNOWLEDGMENTS
The completion of this project would not have been possible without input of
several people. First, I thank my advisor, Dr. David Barber, for his direction and
availability, without which I would not have had the opportunity to learn and do the
variety of skills required for the successful completion of this project. I also thank my
committee members, Dr. Nancy Denslow and Dr. Madan Oli, for all their input and
advice. My family and friends were an essential source of support throughout the course
of these years. There are also several lab members and co-workers at the Center for
Environmental and Human Toxicology and the Aquatic Toxicology Facility that I thank:
Kathy Childress and Kevin Kroll for their advice on fish care and handling, Greg
Robbins for assisting with fish care, Kathleen Jensen at the US EPA in Duluth for helping
with RIA validation, Scott Wasdo and Nancy Szabo for their chemical advice, Joe Griffitt
for help with gene analysis, and fellow lab members Alex McNally and Roxana Weil for
all the little things.

v
TABLE OF CONTENTS page
ACKNOWLEDGMENTS ................................................................................................. iv
LIST OF TABLES............................................................................................................ vii
LIST OF FIGURES ......................................................................................................... viii
INTRODUCTION ...............................................................................................................1
Endocrine Disruption in Teleosts .................................................................................2 Biomarkers of Endocrine Disruption............................................................................7 p,p’-DDE in the Environment.....................................................................................12 p,p’-DDE: An Endocrine Disruptor............................................................................14 Linking Biomarkers of Endocrine Disruption to Fish Populations ............................17
MATERIALS AND METHODS.......................................................................................21
General Methods.........................................................................................................21 Fish Holding Conditions......................................................................................21 Reproductive Measures .......................................................................................22 Plasma and Tissue Collection..............................................................................22 Determination of p,p’-DDE Content ...................................................................23 Determination of Plasma 17β-Estradiol ..............................................................24 Vitellogenin mRNA Quantification ....................................................................25
Experimental Set-Up ..................................................................................................26 Pilot Experiment ..................................................................................................26 p,p’-DDE Dose-Response Experiment I: Accumulation Rate and
Reproductive Output of Adults........................................................................27 Survival, Development, and Reproductive Output of Offspring.........................28 p,p’-DDE Dose-Response Experiment II: Collection of Biological Materials ...29
Statistical Analyses.....................................................................................................29
RESULTS ..........................................................................................................................31
Pilot Experiment .........................................................................................................31 p,p’-DDE Dose-Response Experiments I & II: Adult 17β-Estradiol, GSI, and
Reproduction..........................................................................................................32 Effects of in ovo Exposure on Survival, Development, and Reproduction ................34 Identification of Biomarkers.......................................................................................36

vi
DISCUSSION....................................................................................................................47
Effects of Adult Exposure to p,p’-DDE on Reproduction, 17β-Estradiol, and GSI...47 Effects of in ovo p,p’-DDE Exposure on Survival, Development, and
Reproduction..........................................................................................................52 Biomarkers..................................................................................................................55 Conclusions and Future Directions.............................................................................56
APPENDIX........................................................................................................................58
HORMONE DETERMINATION BY RIA................................................................58
REFERENCES ..................................................................................................................60
BIOGRAPHICAL SKETCH .............................................................................................68

vii
LIST OF TABLES
Tables page 1-1. Classes of endocrine disrupting compounds and examples.......................................20
2-1. Primer sequences used for quantitative real-time PCR. ............................................30
3-1. Survival probabilities for offspring spawned from adults fed p,p’-DDE..................37

viii
LIST OF FIGURES
Figures page 1-1. Schematic of basic signals within the hypothalamus-pituitary-gonad (HPG) axis. ....3
1-2. Active hormones found in fish. ..................................................................................5
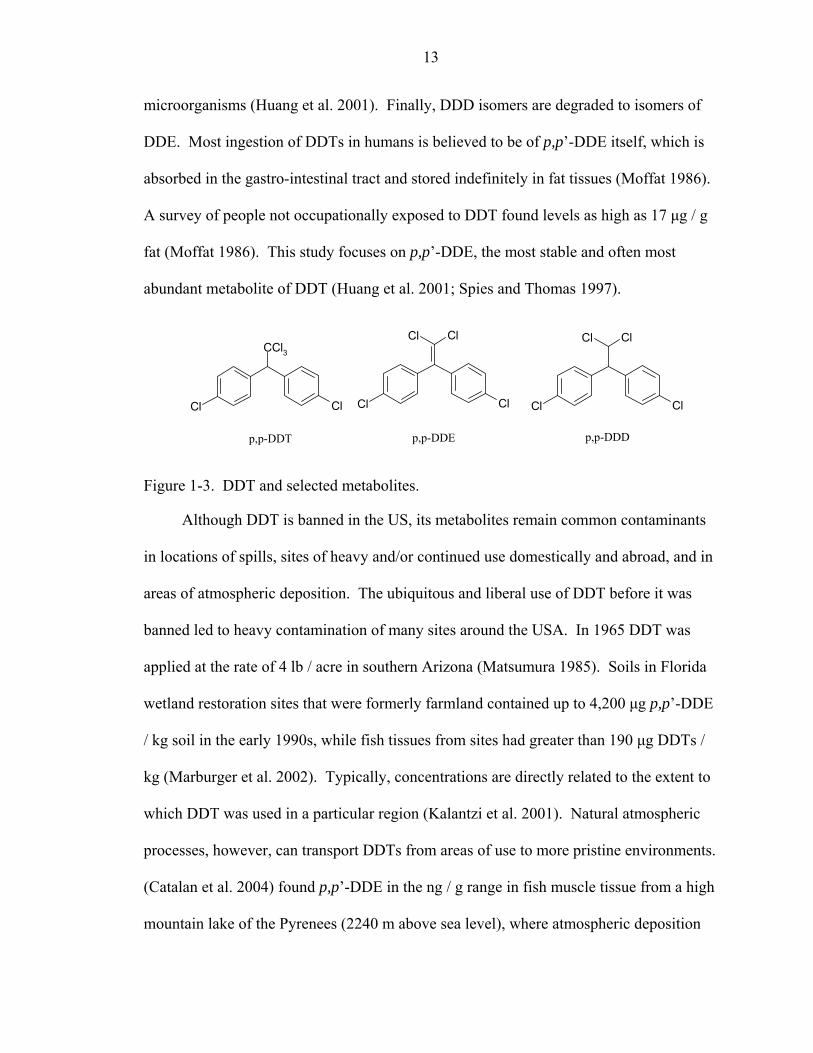
1-3. DDT and selected metabolites. .................................................................................13
3-1. The number of eggs produced per female before and after exposure to either p,p’-DDE of flutamide as compared to control........................................................37
3-2. Comparison of plasma 17β-estradiol levels in males and females within and among each treatment group.. ..................................................................................38
3-3. Mean p,p’-DDE muscle tissue concentration (μg p,p’-DDE / g wet weight muscle tissue). ..........................................................................................................38
3-4. Comparison of plasma 17β-estradiol levels in males and females from each treatment group ........................................................................................................39
3-5. Mean GSI values of adults treated with p,p’-DDE-contaminated feed....................39
3-6. Cumulative number of eggs produced per female in adults of each treatment group.........................................................................................................................40
3-7. Egg fertilization and hatch success...........................................................................40
3-8. Maternal transfer of p,p’-DDE to eggs.....................................................................41
3-9. Mean length (mm) and weight (g) ± S.E. of offspring at four months after hatch...41
3-10. The age when male characteristics or first reproduction was observed in offspring from each treatment group........................................................................42
3-11. Sex ratio of offspring in each treatment group .......................................................42
3-12. GSI values of offspring in each treatment group....................................................43
3-13. Cumulative egg production of offspring through nine months of age. ..................43

ix
3-14. Values of mean female plasma estradiol, mean female GSI, and the percent of eggs fertilized are given for each treatment group...................................................44
3-15. Values of mean plasma estradiol and the percent of eggs per female are given for each treatment group ..........................................................................................45
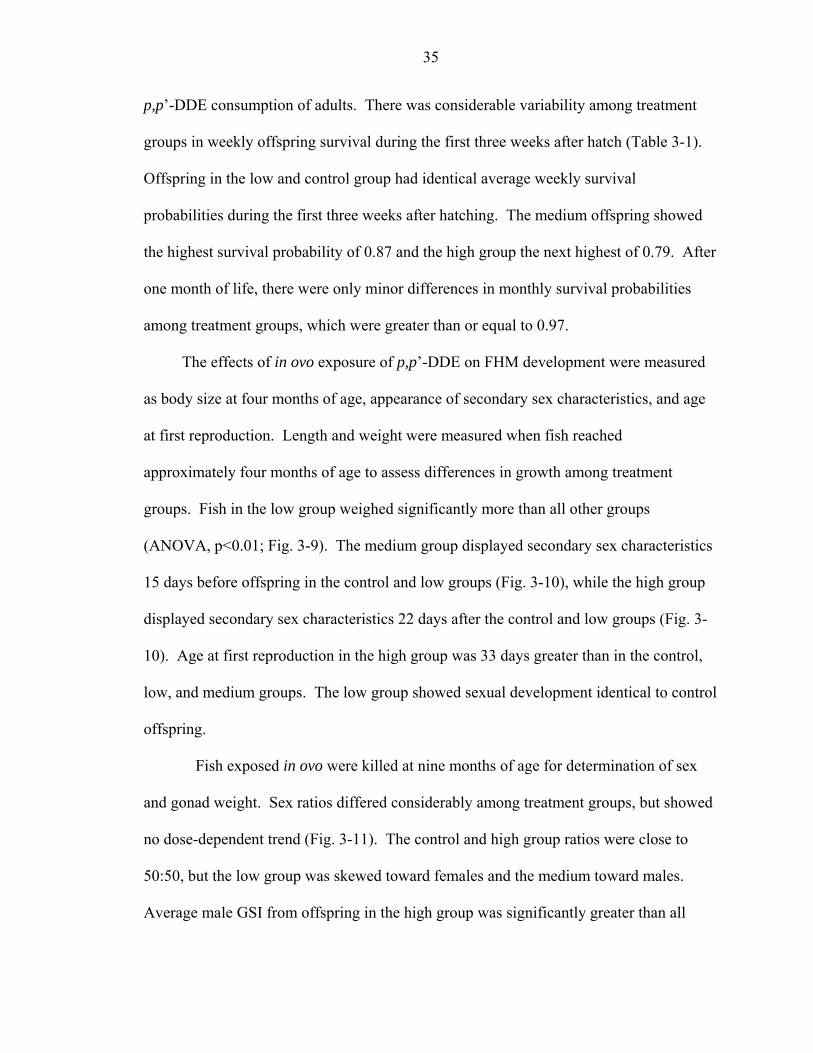
3-16. Values of mean adult female plasma estradiol and mean adult GSI for fish exposed as adults and for fish exposed in ovo are given for each treatment group.........................................................................................................................46

Abstract of Thesis Presented to the Graduate School of the University of Florida
in Partial Fulfillment of the Requirements for the Degree of Master of Science
EFFECTS OF p,p’-DDE ON REPRODUCTION AND BIOMARKERS OF
ENDOCRINE DISRUPTION IN FATHEAD MINNOWS (Pimephales promelas)
By
Elizabeth Jordan Ray
August 2006
Chair: David Barber Major Department: Interdisciplinary Ecology
The phenomenon of endocrine disruption, which includes impaired reproduction
and survival, has been widely researched over the past decade. However, few studies
have linked biomarkers of endocrine disruption to population-level outcomes. The most
stable metabolite of the organochlorine pesticide DDT is p,p’-DDE, a common
environmental contaminant. The objective of this experiment was to investigate the
effects of p,p’-DDE on biomarkers of endocrine disruption as they related to survival and
reproduction of fathead minnows (Pimephales promelas). Fish were exposed to 1.63,
11.48, 104.25, or 900 μg p,p’-DDE / g feed or 1208 μg flutamide / g feed in three
separate experiments. Reproductive output, 17β-estradiol, and gonadosomatic index
(GSI) were measured in adults exposed to p,p’-DDE via feed. Survival, development,
GSI and reproductive output were measured to nine months of age in eggs from those
adults to determine second-generation effects of p,p’-DDE exposure. Reproductive
output was impaired in fish exposed to 104.25 μg p,p’-DDE / g feed as well as their

offspring, but not in fish exposed to flutamide. 17β-estradiol as measured by enzyme-
linked immunosorbent assay (ELISA) was elevated in males exposed to flutamide and
1.63, 11.48, and 104.25 μg p,p’-DDE / g feed. p,p’-DDE and flutamide do not act by the
same mechanism at high doses (900 μg p,p’-DDE and 1208 μg flutamide / g feed).
Neither GSI nor 17β-estradiol levels were correlated to p,p’-DDE concentration in feed
or fish muscle tissue. The percent of eggs fertilized, GSI and 17β-estradiol measured
from adults exposed to p,p’-DDE through feed were directly related to each other and
inversely related to GSI of offspring. Male GSI of offspring of adults exposed to 104.25
μg / g feed was significantly higher than any other group. GSI in adult males was
inversely related to the number of eggs spawned per female. These data have important
implications for the effects of in ovo exposure to endocrine disrupting compounds.
Further, data such as these can be used to model the population growth rates and relate
them to biomarkers, such as GSI, of exposure to endocrine disrupting compound.
1
INTRODUCTION
Scientific and popular literature have reported on the effects of endocrine
disrupting compounds (EDCs) in fish for decades. Endocrine disrupting compounds are
those that affect the normal functioning of that system, typically resulting in adverse
effects on an organism, its progeny, and/or a population. Endocrine disruption has
caused widespread public concern regarding the sustainability of fish populations and
sparked copious scientific research in recent years. Laboratory and field studies have
shown reproductive dysfunction in animals and humans exposed to a variety of EDCs
(Cook et al. 2003; Gray et al. 2001; LeBlanc et al. 1997; Noaksson et al. 2003). Specific
groups of chemicals have been investigated for endocrine-disrupting effects, including
pesticides, therapeutic hormones administered to humans and mammals, and byproducts
of industrial processes. More specific types of these groups of compounds include
organochlorine and organophosphate pesticides, components of oral contraceptives,
plasticizers, fire retardants, and jet-fuel residues (Table 1-1).
The reproductive cycle of fish is controlled by the endocrine system. The
endocrine system is regulated by the hypothalamus, pituitary, and gonad, collectively
known as the HPG axis. By definition, EDCs alter the normal functioning of the HPG
axis. Disruptions of the HPG axis are most conspicuously manifested in gonads, which
unlike the hypothalamus and pituitary, undergo visible stages of reproductive
development in fathead minnows. Because the gonad is responsible for reproductive
output, it is the primary link between an altered endocrine system and demonstrated

2
reproductive dysfunction. Thus, gonadal function is an easily measured and relevant
marker of exposure to an EDC. Production of the female-specific egg yolk precursor
protein, vitellogenin, is also an important measure of endocrine disruption in males.
Measures of gonad health and vitellogenin are commonly used biomarkers of endocrine
disruption. Relationships between biomarkers of endocrine disruption measured in an
individual fish and population-level outcomes are currently poorly understood.
Endocrine Disruption in Teleosts
The teleostean endocrine system involves several organs and myriad molecular
signaling pathways. To understand endocrine disruption, one must first understand the
normal endocrine system. Environmental cues, such as photoperiod, temperature and
presence of other fish, trigger a cascade of signals that prepare teleosts for reproduction.
In teleosts, steroid hormones are typically considered the ultimate molecular factors
influencing reproductive development, maturity, and release of gametes.
The steroidogenic process is controlled by the HPG axis, beginning in the
hypothalamus when environmental cues stimulate the release of gonadotropin-releasing
hormone (GnRH; Fig. 1-1). Gonadotropin-releasing hormone begins a cascade of signals
to stimulate reproductive preparedness. The release of GnRH stimulates the pituitary to
secrete two types of gonadotropins, GtH I and GtH II that act on steroidogenic tissues
(Arcand-Hoy and Benson 2001; Hu et al. 2001). GtH I and GtH II are the teleostean
analogs of the mammalian follicle-stimulating hormone (FSH) and luteinizing hormone
(LH), respectively (Arcand-Hoy and Benson 2001). The steroidogenic process is
triggered when gonadotropins (GtH I and GtH II) reach the gonads and attach to
hormone-responsive cellular receptors in the cell membrane (Young et al. 2005). While
most research has focused on GtH I and GtH II., other hormones and factors may also

3
play a role in steroidogenesis in the gonad, but their potency and mechanism of action are
not well-described and hence, they are not addressed here (Van der Kraak et al. 1998).
Gonad17β-Estradiol
Testosterone
11-Ketotestosterone
Egg
Hypothalamus
Pituitary
Environmental Signals
Gonadotropin-releasing hormone(GnRH)
GTH I & GTH II
Liver
Vitellogenin
Day length
Temperature
Presence of other fishinhibit
Figure 1-1. Schematic of basic signals within the hypothalamus-pituitary-gonad (HPG) axis.
Each gonadotropin plays a specific role in the process of reproduction, which
includes oocyte development and ovulation. GtH I is primarily responsible for oocyte
development in females and spermiation in males. In females, GtH I binds to specific
receptors on the follicle, stimulating testosterone production and its subsequent
aromatization to estradiol. Estradiol then binds to the estrogen receptor in endocrine
active tissues, signaling a cascade of events that contribute to oocyte development,
including production of vitellogenin in the liver (Ding 2005). As oocytes and sperm
develop, the expression of GtH II increases relative to GtH I (Van der Kraak et al. 1998).
GtH II is primarily responsible for stimulating the production of progesterone, also
known as maturation-inducing hormone (MIH), which is believed to be responsible for

4
the final oocyte maturation and ovulation. Several hormones shown to have MIH effects
include progestens, cortisol, and deoxycorticosterone (Nagahama et al. 1994). The
outcomes produced by each gonadotropin, such as oocyte development and ovulation, are
a result of the amount of type of steroid produced.
Production of specific steroids is ultimately triggered by an increase in cAMP,
which occurs when gonadotropins attach to hormone-responsive receptors in cell
membranes of steroidogenic tissues (Hu et al. 2001). cAMP then binds to response
elements in the promoter regions of genes coding for factors involved in steroidogenesis,
thereby increasing the expression of those factors. Cholesterol is the initial substrate for
all steroid hormones, including estrogens, progesterones, and androgens. The first and
rate-limiting step of this process begins with production of steroidogenic acute regulatory
protein (StAR), which facilitates the transfer of cholesterol from the cytoplasm into
mitochondria (Young et al. 2005). In mitochondria P450 side-chain cleavage enzyme
(P450scc) catalyses the conversion of cholesterol into pregnenolone. Pregnenalone can
then be converted to a number of steroid hormones through several different pathways.
Progesterones are formed from pregnenolone in reactions catalyzed by P450c17, 3β-
hydroxysteroid dehydrogenase (3β-HSD), and 20β-hydorysteroid dehydrogenase (20β-
HSD). Androstenedione and androstenediol, which are formed from pregnenolone and
progesterones, are the substrates converted to testosterone. Testosterone can then be
converted to 17β-estradiol or 11-ketotestosterone by P450 aromatase or P45011β and
11β-HSD, respectively (Thibaut and Porte 2004; Young et al. 2005). In fish,

5
17β-estradiol is the active estrogen, but there is uncertainty regarding the roles of
testosterone or 11-ketotestosterone in androgenic activity (Kime 1995). Though the
process of steroidogenesis occurs only in specific tissues, they may have effects on other
systems.
Figure 1-2. Active hormones found in fish.
Once steroids are produced, they can remain in steroidogenic tissue or travel to
other organs where they undergo metabolism, cause feedback inhibition, or regulate a
variety of responses including, vitellogenesis, development of secondary sex
characteristics, or reproduction itself (Arcand-Hoy and Benson 2001). In a negative
feedback loop, steroids target the hypothalamus and pituitary and inhibit further signaling
of steroid production via GnRH or gonadotropins, respectively (Arcand-Hoy and Benson
2001; Young et al. 2005). Steroids are metabolized primarily in the liver, but can also be
metabolized in other tissues (Sonderfan et al. 1989). Phase I enzymes metabolize steroid
hormones by hydroxylation and dehydrogenation and Phase II enzymes, such as UDP-
glucuronosyltransferase and sulfotransferase, are responsible for steroid metabolism by
conjugation (Matsui et al. 1974; Waxman 1988).
When steroids reach target organs they bind to hormone receptors. There are
several steroid hormone receptors that regulate expression of a suite of target genes via
genomic interaction by binding to promoters in those target genes. Recent evidence
OH
O
Testosterone
OH
OH
17-ß-Estradiol
OH
O
O
11-keto-Testosterone

6
suggests that effects elicited by hormones may also arise via a non-genomic pathway
(Loomis and Thomas 2000). Most hormonal responses, however, are believed to be
mediated through receptors and genomic interaction, which is a common target for EDCs
(Filby and Tyler 2005). There are at least three forms of estrogen receptors in fish (ERα,
ERβ, ERγ) to which estradiol binds (Filby and Tyler 2005). In female teleosts, binding of
estradiol to ERs stimulates transcription and production of vitellogenin, an egg yolk
protein precursor important in egg development (Young et al. 2005). There are two
likely forms of androgen receptor in teleosts, which regulate androgen-controlled genes
(ARα and ARβ; Wilson et al. 2004). As hormones bind to these receptors, they regulate
expression of target genes through genomic interaction.
Endocrine disruption can occur when any part of the complex system of signals
within the HPG axis is altered. While disruption may occur at numerous targets, many
studies show EDCs act by interacting with hormone receptors (Kelce et al. 1995; Wilson
et al. 2004). A significant deviation of plasma hormone levels from normal is often an
indicator of endocrine disruption. Additionally, because males do not produce eggs, they
do not produce significant amounts of vitellogenin. Thus, an induction of vitellogenin in
male fish signifies endocrine disruption and, more specifically, exposure to estrogenic
compounds (Denslow et al. 1997; Nash et al. 2004). Estrogen and androgen receptors are
also likely targets of EDCs, where EDCs bind the receptor (Chedrese and Feyles 2001;
Kelce et al. 1995; Young et al. 2005). However, studies suggest that receptors’ binding
affinities may differ among species, which has important implications for species to
species extrapolations (Wilson et al. 2004).
7
Endocrine disrupting compounds may also affect offspring during oocyte
development or embryonic development. Adverse effects to offspring may occur if
estradiol and/or progesterone are altered during the reproductive cycle because of their
critical influence on egg yolk protein and timing of release of oocytes (Nimrod and
Benson 1997). Additionally, embryonic exposure of fish to EDCs may influence normal
sexual development and growth (Arcand-Hoy and Benson 2001). Fathead minnows
undergo a series of physiological changes as they develop into reproductive male or
female adults. Those changes, which include phenotypic sex determination and
development of secondary sex characteristics, are largely controlled by levels of steroid
hormones (von Hofsten and Olsson 2005). An alteration in those steroid hormones may
lead to developmental dysfunction.
There is also mounting evidence that exposure of an adult to an EDC can affect its
offspring through epigenetic mechanisms (Anway et al. 2005; Collas 1998). Recently,
studies have been published on the effects of exposure to EDCs during egg development,
or in ovo. A multiple-generation study of fish exposed to enthynylestradiol found
reproductive dysfunction in offspring exposed in ovo (Nash et al. 2004). That study
showed no change in fertilities of adults exposed, but a reduction in fertility of the second
generation, even after depuration. The connection between abnormal steroid hormone
and vitellogenin levels in adults and altered reproductive output of their offspring is not
well understood. Thus, this study focused on biomarkers of p,p’-DDE exposure in adults
as they relate to effects in reproductive output of those adults and their offspring.
Biomarkers of Endocrine Disruption
Biomarkers are defined as biological responses that deviate from normal as a result
of exposure to a given stimulus (Mayer et al. 1992). These responses can be measured at

8
different levels of biological organization and include changes in gene expression,
hormone concentrations, reproductive output, and from a broader perspective,
populations (Korte et al. 2000; Sepulveda et al. 2002). There are two groups of
biomarkers: those of exposure and those of effect. Biomarkers of exposure are those that
simply indicate that an organism has been exposed to an EDC at some level. Biomarkers
of effect are those that indicate a degree of exposure with an EDC sufficient to result in
an impact on a higher level of biological organization. The distinction between
biomarkers of effect and biomarkers of exposure is often dependent on the endpoint of
interest. Much effort has been placed towards developing biomarkers of exposure and
effect of EDCs in fish by correlating exposure to contaminants with altered gene
expressions, hormone concentrations, and reproductive output (Ankley et al. 2001; Foran
et al. 2002; Giesy et al. 2000). Connections among these factors tend to vary, but some
are conserved across species and compounds.
Population- and organism-level biomarkers of exposure to EDCs include skewed
sex ratio, gonadosomatic index (GSI), and age at first reproduction. A skewed sex ratio
is often used as an indicator of a wild population exposed to EDCs. Physiological
biomarkers such as GSI, inappropriate presence of intersex gonads or secondary sex
characteristics, and age at sexual maturity require some measure of individual fish
(Ankley et al. 2001; Monnosson et al. 1997; Sepulveda et al. 2002). Reduced GSI has
been found in fish exposed to estrogenic and anti-androgenic contaminants in the
laboratory and in fish inhabiting contaminated sites (Ankley et al. 2001; Panter et al.
1998; Sepulveda et al. 2002). GSI, however, can be unaffected by exposure to
compounds that exhibit other endocrine disrupting properties (Bayley et al. 2002). Few

9
studies of fathead minnows have observed intersex gonads, which is the presence of
characteristics of both ovaries and testes in the gonad (Mills and Chichester 2005). Age
at first maturity is not a common biomarker for EDC exposure, which is probably due to
the time and difficulty involved in making such a measurement. Nonetheless, studies on
population dynamics have shown that time of first reproduction can play an important
role in population growth rate (Levin et al. 1996).
Molecular and genetic biomarkers that indicate exposure to contaminants include
DNA adducts, steroid hormones, vitellogenin induction in males, tumors, and thinned
eggshells (Denslow et al. 1997). Genetic biomarkers for reproductive dysfunction in
fathead minnows include abnormal mRNA levels for ERα, AR, vitellogenin, the
steroidogenic enzyme cytochrome P450 17α–hydroxylase,17,20,lyase (P450c17), and
P450scc or aromatase (Denslow et al. 1997; Halm et al. 2003; Rolland et al. 1997;
Wilson et al. 2004). While mRNA expression is a useful biomarker that also elucidates
possible mechanisms of EDC action, abnormal steroid hormone and vitellogenin protein
levels are more common biomarkers of EDC exposure. In fish, the primary focus of
molecular biomarkers of exposure and effect has been on plasma vitellogenin, 17β-
estradiol, testosterone, and 11-ketotestosterone (Giesy et al. 2000; Mills and Chichester
2005; Sepulveda et al. 2002).
Steroid hormone levels as well as the ratio of estrogens to androgens are also
common biomarkers of exposure and effect. Appropriate levels of steroid hormones are
used as a biomarker because they can be indicative of adverse affects on normal
reproduction. Identification of abnormal hormone levels first requires knowledge of
normal hormone levels during the reproductive cycle of each sex of a species of fish.
10
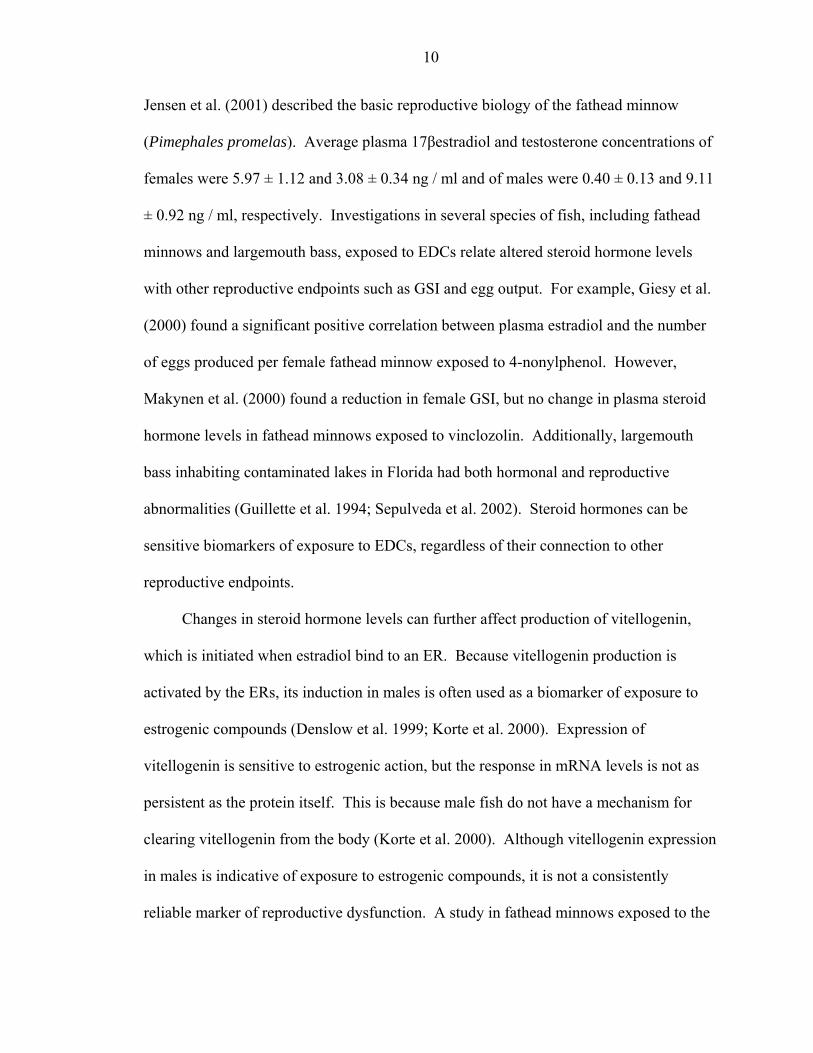
Jensen et al. (2001) described the basic reproductive biology of the fathead minnow
(Pimephales promelas). Average plasma 17βestradiol and testosterone concentrations of
females were 5.97 ± 1.12 and 3.08 ± 0.34 ng / ml and of males were 0.40 ± 0.13 and 9.11
± 0.92 ng / ml, respectively. Investigations in several species of fish, including fathead
minnows and largemouth bass, exposed to EDCs relate altered steroid hormone levels
with other reproductive endpoints such as GSI and egg output. For example, Giesy et al.
(2000) found a significant positive correlation between plasma estradiol and the number
of eggs produced per female fathead minnow exposed to 4-nonylphenol. However,
Makynen et al. (2000) found a reduction in female GSI, but no change in plasma steroid
hormone levels in fathead minnows exposed to vinclozolin. Additionally, largemouth
bass inhabiting contaminated lakes in Florida had both hormonal and reproductive
abnormalities (Guillette et al. 1994; Sepulveda et al. 2002). Steroid hormones can be
sensitive biomarkers of exposure to EDCs, regardless of their connection to other
reproductive endpoints.
Changes in steroid hormone levels can further affect production of vitellogenin,
which is initiated when estradiol bind to an ER. Because vitellogenin production is
activated by the ERs, its induction in males is often used as a biomarker of exposure to
estrogenic compounds (Denslow et al. 1999; Korte et al. 2000). Expression of
vitellogenin is sensitive to estrogenic action, but the response in mRNA levels is not as
persistent as the protein itself. This is because male fish do not have a mechanism for
clearing vitellogenin from the body (Korte et al. 2000). Although vitellogenin expression
in males is indicative of exposure to estrogenic compounds, it is not a consistently
reliable marker of reproductive dysfunction. A study in fathead minnows exposed to the

11
estrogenic compound 4-nonylphenol, found that correlations between vitellogenin and
estradiol differed when the study was repeated by the same investigator (Giesy et al.
2000). Additionally, plasma estradiol, but not vitellogenin was related to egg production
(Giesy et al. 2000). Further, studies show vitellogenin expression levels in females are
not necessarily correlated to hatching success of eggs from adults exposed to an
estrogenic compound during development (Cheek et al. 2001). Thus, transcript level of
vitellogenin is a good biomarker of recent exposure and vitellogenin protein level is a
better biomarker of exposure history to estrogenic compounds, but neither is necessarily
indicative of altered reproductive capacity.
The consequences of reproductive malfunctions caused by EDCs can be
detrimental to fish populations, which people depend upon for food and recreation (Cook
et al. 2003). Thus, it is important to understand how fish will respond to endocrine
disruptors to maintain healthy fish populations, especially in restoration (Bayley et al.
2002) sites. The present study measured a suite of biomarkers in fathead minnows
exposed to p,p’-DDE with the goal of providing a more comprehensive understanding of
the connections among them in the context of population level outcomes.
The fathead minnow is a small member of the minnow family, Cyprinidae, that is
easily raised in the laboratory and commonly used in toxicity assays. This species
reaches sexual maturity at 4-5 months and lives up to 4 years in the wild, where it feeds
primarily on invertebrates. Spawning activity can be induced by environmental
conditions such as photoperiod and water temperature. In a study of the basic
reproductive biology of fathead minnows, females spawned approximately 85 eggs every
four days (Jensen et al. 2001). Steroid hormones and GSI varies at each point in the
12
spawning cycle of females, but not males (Jensen et al. 2001). Vitellogenin is
occasionally detected in male fish not exposed to EDCs and is at a relatively constant
level throughout the spawning cycle in females (Jensen et al. 2001). The fathead minnow
is a good model for endocrine disruption studies because it is easy to work with in a
laboratory setting and there is considerable information on its basic reproductive biology.
p,p’-DDE in the Environment
Organochlorine pesticides (OCPs) are banned in most industrialized countries, but
their use continues in developing countries because they are relatively inexpensive,
effective, and easily manufactured. OCPs include compounds commonly known as
DDT, toxaphene, chlordane, methoxychlor, vinclozolin, and dieldrin. Because of
massive volumes used, atmospheric processes, and their persistence, they remain
common environmental contaminants (Kalantzi et al. 2001; Matsumura 1985).
Specifically, dichlorodiphenyltrichlorethane (DDT) is an organochlorine insecticide and
persistent environmental pollutant which is banned in the United States. DDT was
widely used as an insecticide in the US from the time it was discovered by Peter Müller
in 1939 until it was banned in 1972 (Carr and Chambers 2001). Detectable levels of
DDTs have been found in biological, geological, and atmospheric samples since the
1960s.
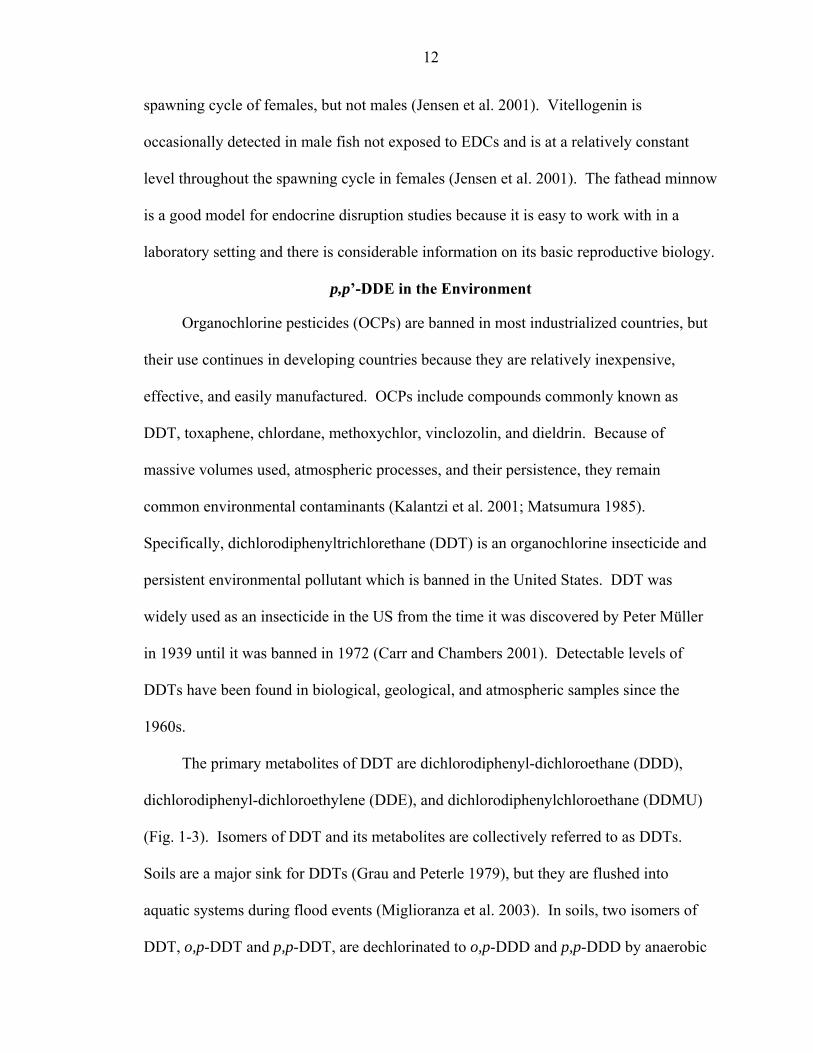
The primary metabolites of DDT are dichlorodiphenyl-dichloroethane (DDD),
dichlorodiphenyl-dichloroethylene (DDE), and dichlorodiphenylchloroethane (DDMU)
(Fig. 1-3). Isomers of DDT and its metabolites are collectively referred to as DDTs.
Soils are a major sink for DDTs (Grau and Peterle 1979), but they are flushed into
aquatic systems during flood events (Miglioranza et al. 2003). In soils, two isomers of
DDT, o,p-DDT and p,p-DDT, are dechlorinated to o,p-DDD and p,p-DDD by anaerobic
13
microorganisms (Huang et al. 2001). Finally, DDD isomers are degraded to isomers of
DDE. Most ingestion of DDTs in humans is believed to be of p,p’-DDE itself, which is
absorbed in the gastro-intestinal tract and stored indefinitely in fat tissues (Moffat 1986).
A survey of people not occupationally exposed to DDT found levels as high as 17 μg / g
fat (Moffat 1986). This study focuses on p,p’-DDE, the most stable and often most
abundant metabolite of DDT (Huang et al. 2001; Spies and Thomas 1997).
Figure 1-3. DDT and selected metabolites.
Although DDT is banned in the US, its metabolites remain common contaminants
in locations of spills, sites of heavy and/or continued use domestically and abroad, and in
areas of atmospheric deposition. The ubiquitous and liberal use of DDT before it was
banned led to heavy contamination of many sites around the USA. In 1965 DDT was
applied at the rate of 4 lb / acre in southern Arizona (Matsumura 1985). Soils in Florida
wetland restoration sites that were formerly farmland contained up to 4,200 μg p,p’-DDE
/ kg soil in the early 1990s, while fish tissues from sites had greater than 190 μg DDTs /
kg (Marburger et al. 2002). Typically, concentrations are directly related to the extent to
which DDT was used in a particular region (Kalantzi et al. 2001). Natural atmospheric
processes, however, can transport DDTs from areas of use to more pristine environments.
(Catalan et al. 2004) found p,p’-DDE in the ng / g range in fish muscle tissue from a high
mountain lake of the Pyrenees (2240 m above sea level), where atmospheric deposition
Cl Cl
ClCl
Cl Cl
ClCl
p,p-DDE p,p-DDD
CCl3
Cl Cl
p,p-DDT

14
was the sole source of OCPs. Microorganisms that degrade DDT into p,p’-DDE were
found in soils where the parent compound was never applied (Miglioranza et al. 2003).
The concentration of total OCPs in those soils was 656 ng / g dry weight. Though DDT
has been banned in many places, its continued use and physical properties are potentially
problematic in several regions of the world.
Studies analyzing DDTs from different levels of biological organization
demonstrate the abundance of p,p’-DDE in the environment, as well as its propensity to
bioaccumulate. A study of DDTs and other chlorinated compounds found p,p’-DDE was
the most prevalent and abundant contaminant in fish tissues from Latvian freshwaters
(Valters et al. 1999). p,p’-DDE concentrations were found as high as 20 μg / g in fish
ovaries (Marburger et al. 2002) and 5.8 μg / g in alligator eggs (Guillette et al. 1994)
from heavily contaminated sites in Florida. Additionally, kelp bass in coastal waters of
California had average liver concentrations of 3.43 μg / g DDTs, of which greater than
97% was p,p’-DDE (Spies and Thomas 1997). p,p’-DDE (log Kow = 6.5) is a highly
lipophilic compound prone to bioaccumulation. Fish muscle tissue concentrations of
p,p’-DDE can be as much greater than concentrations found in water. For example, in a
site where lake water contained 7.4 pg p,p’-DDE / L (parts per trillion), invertebrates
averaged 40.06 ng p,p’-DDE / g (parts per million), and brown trout (Salmo trutta) had
57.23 ng p,p’-DDE / g (Catalan et al. 2004). In California sea otters (Enhydra lutris)
DDTs were as high as 5,900 ng / g in liver and 4,600 ng / g in kidney of, while prey
concentrations ranged from 0.08 to 12.9 ng / g (Kannan et al. 2004).
p,p’-DDE: An Endocrine Disruptor
Initial studies on DDTs in wildlife focused on egg shell-thinning effects in birds,
especially raptors. The fist study of DDT on fish and wildlife was conducted in 1946 by

15
Cottom and Higgins. p,p’-DDE was shown to cause reproductive malfunctions in avian
species as far back as the 1960s (Heath et al. 1969). Additional observations and
investigations suggested DDTs contribute to endocrine disruption in fish (Macek 1968).
In past studies, the reproductive capacity of fishes was adversely affected by p,p’-
dichlorodiphenyldichloro-ethylene (DDE), the most persistent metabolite of DDT
(Bayley et al. 2002; Mills et al. 2001). There is significant evidence suggesting p,p’-
DDE adversely affects fish reproduction and populations. Surveys in Lake Michigan
showed a likely connection between a skewed sex ratio in bloater (Coregonus hoyi)
populations and p,p’-DDE concentration. The percent of female bloaters in Lake
Michigan returned to normal as fish p,p’-DDE concentrations decreased from
approximately 3.5 μg / g in 1969 to 0.75 μg / g in the early 1980s (Monnosson et al.
1997).
Several authors suggest that OCPs affect hormone homeostasis through steroid
synthetic and metabolic pathways (Hornung et al. 2004; Spies and Thomas 1997; Thibaut
and Porte 2004). Spies and Thomas (1997) found plasma estradiol levels in fish
decreased with concentration of DDTs. On a more mechanistic level, p,p’-DDE inhibited
steroid synthesis in mammalian ovary cells at 10 μM (Chedrese and Feyles 2001), but
enhanced steroid synthesis in fish testicular cells at 100 μM (Thibaut and Porte 2004).
Reproductive abnormalities were observed in male guppies exposed to p,p’-DDE during
sexual differentiation, a time susceptible to the effects of endocrine disruption (Bayley et
al. 2002).
In mammals, p,p’-DDE affects transcription of androgen-controlled genes by
binding to the androgen receptor. In vitro studies in mammalian cells found 200 nM
16
p,p’-DDE inhibited half the androgenic transcriptional activity induced by a testosterone
(Kelce et al. 1995). Those same in vitro studies also suggest p,p’-DDE binds the AR,
allowing it to enter the nucleus, but preventing the AR from inducing androgen-
dependent genes. Kelce et al. (1995) found p,p’-DDE acts as an androgen inhibitor with
potency similar to that of hydroxyflutamide (200 nM = IC50) in mammalian cell lines. In
fathead minnows, p,p’-DDE had a binding affinity for AR similar to dihydrotestosterone,
at concentrations of 20 and 22 nM, respectively (Wilson et al. 2004). However, activity
of the bound AR was not measured in that study. Consequently, there is no confirmation
that p,p’-DDE bound to the AR actually inhibits transcription of androgen-dependent
genes in fathead minnows.
Environmental concentrations of p,p’-DDE have been found at 80 times the
concentrations that cause these anti-androgenic effects in vitro (Guillette et al. 1995;
Kelce et al. 1995; Monnosson et al. 1997). Other in vitro studies suggest that p,p’-DDE
may increase granulosa cell growth by stimulating progesterone synthesis, but not
progesterone synthesis stimulated by 17β-estradiol (Chedrese and Feyles 2001; Crellin et
al. 1999). It is, therefore, likely that p,p’-DDE does not disrupt hormone homeostasis by
interfering at the ER, but with another component of the steroidogenic pathway. p,p’-
DDE has also been shown to increase granulosa cell growth similar to, but less potently
than, 17β-estradiol in mammalian cells (Chedrese and Feyles 2001). From that same
study, Chedrese and Feyles (2001) found that p,p’-DDE decreased progesterone, a
hormone required for normal ovulation. Although those studies were conducted in
mammalian cells, they indicate that p,p’-DDE may not be acting at the estrogen-receptor.
Extrapolating the anti-androgenic or estrogenic activity found in those mammalian
17
studies to fish may be invalid. Several in vitro studies suggest there may be differences
in binding of contaminants to ARs among mammals and teleosts, between species of
teleosts, and between tissues of a single species (Bayley et al. 2002; Makynen et al. 2000;
Wells and Van Der Kraak 2000).
Given the uncertainty in the link between AR binding in vitro and in vivo activity,
Bayley et al. (2002) concluded that sex characteristics and reproduction themselves were
the best measure of reproductive dysfunction. Male guppies (Poecilia reticulata)
exposed to10 μg / g p,p’-DDE during sexual development had a sex ratio skewed toward
females, increased time to male development, and altered secondary sex characteristics
and sperm count (Bayley et al. 2002). A captive population of trout exposed to 10, 40, or
80 μg / g p,p’-DDE in ovo did not have altered sex ratio or reproductive dysfunction upon
reaching sexual maturity (Carlson et al. 2000). Several other reproductive endpoints,
including gonodosomatic index (GSI), egg production, and fertilization success, were
also not affected in trout exposed to p,p’-DDE in ovo (Carlson et al. 2000). Increased
mortality was, however, observed in progeny spawned from males treated with p,p’-DDE
in ovo and uncontaminated females. As those studies show, the effects of p,p’-DDE on
fish can vary greatly among species and can depend on the life-stage at the time of
exposure.
Linking Biomarkers of Endocrine Disruption to Fish Populations
Reproductive effects of EDCs have been observed extensively at biochemical and
physiological levels of biological organization in fishes. Linking biomarkers measured in
individual fish to population-level outcomes has only recently been attempted (Grist et al.
2003) and links between biomarkers and real population-level effects have yet to be
confirmed (Mills and Chichester 2005; Segner 2005). Most studies investigating the

18
effects of EDCs on population parameters and demographic changes have been on
invertebrates because they have shorter generation times and are easier to raise in the
laboratory than fishes (Barata et al. 2002; Mauri et al. 2003; Raimondo and McKenney
2005). Much of the concern and research of EDCs, however, is related to fish because
humans depend on them for nutrition and income. Consequently, there is a disparity
between the knowledge of population-level outcomes and the amount of data on
biomarkers endocrine disruption in fish.
A limited number of recent studies have attempted to link adult exposure of fishes
to EDCs with changes in population growth rate. A study by Miller and Ankley (2004)
computed the effects of a synthetic androgen on density-dependent population growth
rates of fathead minnows. Grist et al. (2003) investigated the contributions of
demographic parameters to changes in population growth rate of fathead minnows
exposed to ethynylestradiol during development. They found fertilities contributed more
than survival probabilities to the highly significant correlation between ethynylestradiol
concentration and population growth rate. Those studies do not, however, account for
effects of in ovo exposure on the survival probabilities and fertilities.
Few investigations on multi-generational effects of contaminant have been made.
Demographic parameters of offspring exposed to EDCs maternally may be of great
importance. Nash et al. (2004) exposed two generations of fathead minnows to
environmentally relevant concentrations of the potent estrogen, ethynylestradiol. That
study showed no change in fertilities of exposed adults, but a reduction in fertility of the
second generation, even after depuration. As Nash et al. (2004) concluded, those
findings carry major implications for population-level impacts of long-term exposure of

19
fish to EDCs. Therefore, it is important to investigate second-generation effects of EDC
exposure.
Ankley et al. (2001) developed a protocol for measuring reproductive effects of
sub-chronic exposure to EDCs of fathead minnows, a species commonly used in such
assays. That and other studies call for a deeper knowledge of the connection between
contaminant tissue burdens, reproductive dysfunction, and population effects (Chedrese
and Feyles 2001; Foster et al. 2001; Gray et al. 2002; Orlando et al. 1999). Employing an
exposure methodology similar to that described by Ankley et al. (2001), I investigated the
effects of parental exposure to p,p’-DDE on a suite of biomarker and population
parameters of fathead minnows. Because EDCs act on the reproductive system by
definition, I expected fertilities to change more than survival among treatment groups.
Feed concentrations of p,p’-DDE were chosen to represent environmentally
relevant p,p’-DDE body burdens (Marburger et al. 2002; Muller 2003). In this case, the
stimulus for altered biological responses is exposure to various concentrations of p,p’-
DDE through the diet. This study had three overall goals: to assess the effects of p,p’-
DDE on reproduction and endocrinology of fathead minnows, to assess the effect of in
ovo exposure to p,p’-DDE on survival and development, and to link those effects with
biomarkers of exposure. To this end, I conducted a pilot experiment in which fish were
exposed to high levels of p,p’-DDE and the anti-androgen flutamide. Then, I conducted a
dose-response experiment, from which the effects of in ovo exposure were assessed.
Finally, the dose-response experiment was repeated to obtain additional biological
materials to use for measuring biomarkers.

20
Table 1-1. Classes of endocrine disrupting compounds and examples. Compound class Type Examples
organochlorine pesticides (OCPs) DDT, methoxychlor, toxaphene
organophosphate pesticides (OPs) TEPP, chlorpyrifos, malathion Pesticides
pyrethrins extracts of Chrysanthemum flowers
polycyclic aromatic hydrocarbons (PAHs) benzo(A)pyrene, aflatoxin
plasticizers di(n-butyl)pthalate Industrial byproducts
polychlorinated biphenyls (PCBs) Aroclor 1254 Hormonal therapeutics birth control pills, hormone therapy ethynylestradiol
Natural hormone estradiol, testosterone (Cook et al. 2003; Macek 1968; Miller and Ankley 2004; Mills et al. 2001; Nash et al. 2004; Thompson et al. 2004; Valters et al. 1999)

21
MATERIALS AND METHODS
Three in vivo experiments were conducted on fathead minnows (Pimephales
promelas). Each experiment was designed to optimize collection of the endpoint of
interest. The focus of the initial pilot experiment was to assess if p,p’-DDE caused
reproductive dysfunction similar to the anti-androgen flutamide. Upon observing
reproductive dysfunction in fish administered a high level of p,p’-DDE, a dose-response
experiment to determine a no observed effect level (NOEL) was conducted. During that
second experiment fish were fed one of three environmentally plausible p,p’-DDE
concentrations. That experiment focused on the accumulation rate of p,p’-DDE in adults
and survival, development, and reproduction of offspring spawned from those adults. In
a third experiment, p,p’-DDE was administered to fish similar to the second experiment
to obtain additional biological materials for hormone and gene analyses. All experiments
were conducted at the University of Florida Aquatic Toxicology Facility under the same
general environmental conditions in accordance with IACUC protocols. Differences in
experimental conditions are described below. Methods for determination of p,p’-DDE
content, plasma 17β-estradiol levels, and mRNA expression were identical across
experiments unless otherwise noted.
General Methods
Fish Holding Conditions
Fish were housed in flow-through tanks supplied with dechlorinated water and kept
on a 16 hours light: 8 hours dark schedule. Fish were exposed to p,p’-DDE through

22
contaminated Silvercup Trout Chow (Zeigler Brothers, Inc.). Food was stored at 4 °C.
Water temperature was measured daily, while dissolved oxygen (DO), pH, hardness
measured as CaCO3, and total ammonia were monitored weekly. Water quality
parameters were as follows for flow-through tanks: DO was 8.5-8.9 mg/L; pH was 8.7 ±
1; hardness was 40 ± 2 mg CaCO3/L; and total unionized ammonia was always less than
0.5 mg/L in flow-through tanks.
Reproductive Measures
Reproductive output was measured as the number of eggs produced, percentage of
eggs fertilized, and percentage of fertilized eggs that hatched. One spawning substrate
(3-inch sections of 3-inch diameter polyvinyl chloride pipe) per male fish was kept in
each tank at all times. Spawning substrates were checked for eggs each afternoon. If
eggs were present, the spawning substrate was removed, eggs counted, and placed in an
aerated 2 L glass beaker filled with approximately 1.75 L dechlorinated water and 25 ml
blackwater extract (Aquatic Ecosystems, Inc.). Blackwater extract was used to prevent
fungal infection on eggs, which was determined the best method for preventing fungal
infection. The number of eggs fertilized was determined by counting eggs that developed
eyes 2-3 days post spawn (dps). Water within the beaker was changed when fertilization
was determined. Digital overhead photographs were used to count the number of eggs
that hatched 5-8 dps, depending on when eggs were no longer present on the substrate.
Plasma and Tissue Collection
At the end of each exposure period adult fish were anesthetized with MS-222
(100mg/L buffered with 200 mg NaHCO3/L), killed by decapitation, bled, and tissue
collected (Ankley et al. 2001). Blood was collected from the caudal sinus in heparinized
micro-hematocrit capillary tubes (Fisher Scientific Company), centrifuged at 1,500 X g

23
for 10 minutes, and plasma was removed and frozen at -80 °C. Gonads were excised,
weighed for determination of the gonadosomatic index (GSI = [gonad weight / body
weight] × 100), and flash frozen in liquid nitrogen. Liver and brain were removed, flash
frozen, and stored at -80 °C. Carcasses were eviscerated and stored at -20 °C until
analyzed for p,p’-DDE content.
Determination of p,p’-DDE Content
Fish were analyzed for muscle tissue or egg p,p’-DDE concentration (wet weight)
by gas chromatography / mass spectrometry by the method described in (Glesleichter et
al. 2005) and modified as follows. One gram or 2.5 g were sectioned from the
eviscerated carcass posterior of the opercle of each female and male fish, respectively.
The fish tissue was homogenized by a Tekman Tissumizer (Tekman Company) with 3 μg
d10-phenanthrene as an internal standard (Protocol Analytical, LLC), 2.5 times tissue
weight of Na2SO4 (A.C.S. Grade, Fisher Scientific Company), and 7 ml n-hexanes
(A.C.S. Gade, Fisher Scientific Company), vortexed, and centrifuged for 15 minutes at
approximately 100 X g. The supernatant was decanted and the homogenate was
extracted twice more with 3 ml n-hexanes. Extracts were combined to yield a total
extracted volume of 13 ml for each tissue sample. The extract was dried under a stream
of nitrogen at 35 °C. The dried extract was reconstituted in 3 ml acetonitrile (Optima
Grade, Fisher Scientific) and eluted through a pre-conditioned SPE-C18 cartridge
(Agilent Technologies), which was repeated once. The cartridge was rinsed with 1 ml
acetonitrile. The eluate was then passed through an SPE-NH2 cartridge (Varian, Inc.)
and the glass tube containing the eluate was rinsed with 1 ml acetonitrile, which was also
placed over the SPE-NH2 cartridge. The final eluate was dried under a stream of

24
nitrogen at 35 °C and reconstituted in 1 ml 3 μg d10-pyrene / ml cyclohexane (Ultra
Scientific).
A Shimadzu 17A gas chromatograph (Shimadzu Scientific Instruments) with HP-
5MS column dimensions of 29 m × 0.25 mm coupled with a Shimadzu QP-5000 were
used for analyte separation and detection. One microliter of reconstituted extract was
injected into a splitless inlet at 275 °C. Analytes were separated using the following
program: initial oven temperature was 100 °C held for 2.5 min. Temperature was ramped
to 190 °C at 15 °C / min, then to 250 °C at 5 °C/min and finally to 290°C at 20°C/min,
which was held for 5 min. Initial carrier flow was 1.4 ml/min. This was reduced to 1
ml/min at 2.5 min for the remainder of the program. Interface temperature was
maintained at 280°C. Mass spectrometer was operated in selected ion monitoring (SIM)
mode and m/z 246 and 317 were used for p,p’-DDE and m/z 188 was collected for d10-
phenanthrene. Quantitation was performed using the ratio of area of m/z 246 to m/z 188
for each p,p’-DDE concentration.
Determination of Plasma 17β-Estradiol
Hormone levels were determined by enzyme immunoassay (EIA) after plasma was
extracted with organic solvent. Briefly, 180 μl EIA buffer was added to 10 μl plasma to
increase aqueous volume. The plasma and buffer mixture was then extracted twice with
0.75 ml ethyl ether (Pesticide Grade, Fisher Scientific Company). The ethyl ether extract
was evaporated under a gentle stream of nitrogen in a water bath at 30 °C. The extract
was reconstituted in 200 μl EIA buffer, mixed by vortex, and placed on an orbital shaker
at 4 °C overnight. This method of extraction and reconstitution was validated by
counting a known amount of extracted and reconstituted 3H-estradiol stock solution and
comparing it with a known amount of unadulterated stock solution. The efficiency of the

25
extraction and resuspension was greater than 90 percent. Estradiol standards were
prepared by bringing 10μl of each 15 ng/ml, 10 ng/ml, 5 ng/ml, 2.5 ng/ml, 1.25 ng/ml,
0.625 ng/ml, 0.312 ng/ml, 0.156 ng/ml, 0.078 ng/ml, and 0.039 ng/ml to a total volume of
200 μl in EIA buffer, mixed by vortex, and placed on an orbital shaker at 4 °C overnight.
Standards and reconstituted sample were mixed by vortex immediately prior to 17β-
estradiol determination. Each standard and sample was measured for estradiol in
duplicate according to protocol for estradiol EIA kit (Cayman Chemical Company). The
quantifiable range for this assay was from 0.156 to 15 ng estradiol / ml plasma. An effort
to analyze estradiol in small volumes of plasma by radioimmunoassay was made, but
acceptable validation was not achieved (see Appendix).
Vitellogenin mRNA Quantification
RNA was isolated from liver using Trizol (Invitrogen), following the
manufacturer’s instructions and reconstituted in RNA Secure (Ambion). RNA quality
was verified on ethidium bromide-stained 1.5% formaldehyde-agarose electrophoresis
gels. RNA was considered to have acceptable purity when the A260 nm/A280 nm ratios
were greater than 1.8, as determined on a spectrophotometer (NanoDrop Technologies).
cDNA was made by reverse transcription-polymerase chain reaction (PCR) using random
decamer primers and 2 μg DNA-free RNA according to manufacturer’s instructions for
the RETRO-Script Kit (Ambion). The quality of cDNA was verified by gel
electrophoresis of products from the following PCR program using 18S primers: the
reaction was held at 94 °C for 2 min, then 35 cycles of 30 sec at each 94 °C, 55 °C, and
72 °C, and a final extension of 5min at 72 °C. Real time-PCR was conducted using pairs
of oligonucleotide primer sequences for vitellogenin (Table 1), using 18S as the
housekeeping gene (Filby and Tyler 2005).

26
Experimental Set-Up
Pilot Experiment
The goal of the pilot experiment was to determine if p,p’-DDE affected
reproductive output and 17β-estradiol levels of fathead minnows similar to the anti-
androgen flutamide. To meet this objective, adult fathead minnows (7-10 months old)
were obtained from a local fish breeder (Fish Soup, Newberry, FL. One male and two
females were housed in 5-gallon flow-through tanks. There were six replicate tanks
within each treatment group, totaling 18 tanks for the entire experiment. Mean water
temperature was 22 ± 2 °C. Treatment groups included a control group (vehicle only
feed), a positive control group (1208 μg flutamide / g feed), and a p,p’-DDE group (900
μg p,p’-DDE / g feed). Contaminant concentrations were measured by the Analytical
Toxicology Core Laboratory at the University of Florida. Fish feed was coated with
menhaden oil and acetone containing the appropriate chemical concentrations, mixed,
and placed under a fume hood overnight. p,p’-DDE (2,2-bis(4-chlorophenyl)-1,1-
dichloroethylene, 99.4% purity) was obtained from Aldrich Chemical Company. Fathead
minnows housed at the facility consumed menhaden oil-coated feed without
discrimination.
Adult survival and reproductive output were measured for 21 days prior to
chemical exposure. During that pre-exposure period fish were fed approximately 0.5 g
feed twice and live brine shrimp, Artemia (Great Lake Artemia) once daily. Once egg
production was established during the pre-exposure period, the 26-day exposure period
immediately followed the pre-exposure period. During the exposure period fish were fed
~ 2 g p,p’-DDE -contaminated feed twice daily and no brine shrimp. For this experiment,
the total number of eggs per female was used as the sole measure of reproductive output.

27
At the conclusion of the exposure period fish were sacrificed and plasma 17β-estradiol
levels were determined as described above.
p,p’-DDE Dose-Response Experiment I: Accumulation Rate and Reproductive Output of Adults
Adult fathead minnows (5-7 months old) were obtained from Aquatic Biosystems,
Inc. (Fort Collins, CO). Each treatment group consisted of four males and eight females
housed in 30-gallon flow-through tanks. Water temperature for experiment two was 25 ±
1 °C in flow-through tanks and 25 ± 2 °C in egg-housing beakers. p,p’-DDE was
dissolved in acetone, sprayed onto fish food, mixed for several minutes, and placed under
a fume hood to allow the acetone to evaporate overnight to obtain nominal concentrations
of 2.5 μg/g, 25 μg/g, and 250 μg/g. Actual feed concentrations of p,p’-DDE were 0.03 μg
/ g, 1.63 μg / g, 11.48 μg / g, and 104.25 μg / g, which will be referred to as control, low,
medium, and high groups, respectively. Each tank was fed approximately 2 g of food at
both 10 AM and 6 PM daily for 29 days. Fathead minnows housed at the facility
consumed vehicle only feed without discrimination.
Reproductive output measured daily throughout the exposure period, as described
above. Upon determining sex at sacrifice, it was evident that each treatment group did
not have the same number of females throughout the experiment. This is due to the fact
that some males did not display secondary sex characteristics and therefore were
mistaken for females when allocated to each tank at the outset of the experiment.
Consequently, the number of eggs produced in each treatment group was calculated on a
per female basis.
One male and two females from each treatment group were killed and tissues
collected as described above on days 7, 14, 21, and 29 of exposure to p,p’-DDE -

28
contaminated feed. Body burden was determined by gas chromatography / mass
spectrometry as described above. Reproductive output was monitored as described above
during the 28-day exposure period. Eggs collected during the 28-day exposure period
were grouped into four clutches based on the day they were spawned: clutch one was
spawned from 2 d to 9 d; clutch two was spawned from 10 d to 16 d; clutch three was
spawned from 17 d to 23 d; clutch four was spawned from 24 d to 29 d. Clutch three and
four were used to study the effects of in ovo p,p’-DDE exposure, as described in the
following section.
Survival, Development, and Reproductive Output of Offspring
Offspring studies were conducted on eggs spawned from the p,p’-DDE dose-
response response experiment of control adults or adults exposed to low, medium, and
high doses of p,p’-DDE. Offspring for each treatment group were pooled based on day
spawned into a 2.5-gallon flow-through tank. Survival of offspring was measured weekly
for three weeks post-hatch by counting fish in digital overhead photographs taken of each
beaker. During those three weeks offspring were kept in 2 L flow-through tanks and fed
live Artemia, hatched in artificial sea water. After four weeks, 100 offspring (juveniles)
from clutch four were taken from each treatment group and placed in 5-gallon flow-
through tanks with spawning substrates. Offspring from the low treatment group were
taken from clutch three because adults did not spawn during the final six days of the
experiment. All further studies on offspring were conducted on these 100 fish. Survival
of these fish was measured monthly. Secondary sex characteristics and first spawn where
monitored approximately every other day after four months post-spawn. The offspring
were transferred to 30 gal flow-through tanks and provided spawning substrates at 3.5
months of age. Reproductive output of offspring was measured, as described above, for

29
one week each month after the group initiated spawning. Offspring length and weight
were measured approximately four months post-spawn and killed for tissue collection
and measurement at approximately nine months of age. These fish were not analyzed for
p,p’-DDE content, estradiol or gene expression.
p,p’-DDE Dose-Response Experiment II: Collection of Biological Materials
Fathead minnows were bred in-house from fish received from Fish Soup
(Newberry, FL). At the time of use the fish were 12-15 months old. A fresh batch of
p,p’-DDE -contaminated feed was prepared to achieve concentrations similar to those in
the first p,p’-DDE dose-response experiment. Actual p,p’-DDE concentrations for this
batch of feed were 0.03 μg / g, 1.38 μg / g, 15.58 μg / g, and 104.73 μg / g, which was fed
to the control, low, medium, and high groups, respectively. Reproductive output was not
measured during this experiment. Plasma and tissues from this experiment were used to
determine 17β-estradiol levels, p,p’-DDE tissue concentration, and vitellogenin mRNA
expression in fish with body burdens similar to those achieved in the first p,p’-DDE dose-
response experiment.
Statistical Analyses
Analysis of variance (ANOVA) followed by post-hoc comparisons using Tukey’s
HSD were used to test for significant differences among treatment groups. Data were
log-transformed to meet the assumption of normality as necessary. Two-tailed Pearson’s
correlations of measures taken in the same fish were computed. Values are reported as
the mean ± standard error of the mean (S.E.). Significance was set at p<0.05. All
statistical analyses were conducted in SPSS 13.0 for Windows (SPSS, Chicago, IL,
USA).

30
Two-tailed Pearson’s correlation of p,p’-DDE concentration (control, low, medium,
or high) to biomarkers in fish exposed through feed (i.e. GSI and plasma) estradiol and
fish exposed in ovo (i.e. GSI) and population-level effects (i.e. survival and measures of
reproduction) to identify biomarkers of multi-generational effects. Because there were no
replicates, these correlations are not robust, and therefore only simple relationships were
further investigated and displayed.
Table 2-1. Primer sequences used for quantitative real-time PCR. Gene Forward Primer Reverse Primer
Vitellogenin 5’-GCT GCT GCT CCA TTT CAA AAG-3’
5’-GTG AGA GTG CAC CTC AAC GC-3’

31
RESULTS
Pilot Experiment
Egg output was measured in treatment and control groups during a pre-exposure
and exposure period. Fish in each tank demonstrated a capability for spawning during
the pre-exposure period. Fish in the p,p’-DDE group ceased spawning activity after just
three days of exposure to the p,p’-DDE, while fish in the control and flutamide groups
continued to spawn during the exposure period (Fig. 3-1). During the exposure period
the p,p’-DDE group spawned less than 16 eggs per female, while the control group
spawned 195 eggs per female and the flutamide group spawned 240 eggs per female.
Plasma 17β-estradiol (estradiol) was measured in control fish and fish treated with
p,p’-DDE or flutamide to elucidate whether the two compounds act by the same
mechanism in the fathead minnow. Mean plasma estradiol in males from the flutamide
group was 4.0 ± 0.56 ng / ml, which was significantly greater than 2.02 ± 0.35 ng / ml in
the control group and 1.88 ± 0.27 ng / ml in the p,p’-DDE group (ANOVA, p<0.01; Fig.
3-2). There were no significant differences in estradiol levels in females among
treatment groups (ANOVA, p=0.29). The mean estradiol level in females in the p,p’-
DDE group (4.82 ± 2.65 ng / ml) was, however, approximately half of the mean levels
measured in both the control (8.96 ±1.72 ng / ml) and flutamide (10.50 ± 2.75 ng / ml)
groups. Plasma estradiol levels were significantly different between males and females
of the control group (p=0.01), but not the p,p’-DDE or flutamide groups (ANOVA,
p=0.63 and p=0.12, respectively). Although plasma estradiol levels were much greater in

32
females (10.51 ± 2.75 ng / ml) than males (4.01 ± 0.58 ng / ml) in the flutamide group,
the difference between the two sexes was not statistically significant (ANOVA, p=0.12).
p,p’-DDE Dose-Response Experiments I & II: Adult 17β-Estradiol, GSI, and Reproduction
p,p’-DDE accumulation rates in fish tissue and reproductive output of adults were
measured from fish in the p,p’-DDE dose-response experiment I. Biomarkers including
adult GSI, plasma 17β-estradiol, and vitellogenin gene expression reported here were
measured from fish from p,p’-DDE dose-response experiment II. Survival of adult fish
was not affected in any of the treatment groups.
Concentration of p,p’-DDE in adult muscle tissues was quantified in three fish at
seven-day intervals during the exposure period. p,p’-DDE tissue concentrations appeared
to approach, but not at reach steady state by the end of the experiment (29 days; Fig. 3-3
A and Fig. 3-3 B). Fish taken at the end of the exposure achieved p,p’-DDE muscle
tissue concentrations (wet weight) of 0.38 ± 0.05 μg /g, 3.11 ± 0.57 μg / g, and 21.14 ±
2.72 μg / g in the low, medium, and high dose groups, respectively. The concentration of
p,p’-DDE in control fish, 0.12 ± 0.10 μg / g (n=6), was used as the concentration on day
one for each group.
Plasma from these fish was used to determine 17β-estradiol levels. Plasma
estradiol levels, as measured by EIA, differed among treatment groups. Females in the
high group had mean plasma estradiol level of 6.70 ± 2.53 ng/ml (n=5), which was lower
than the control, low, and medium groups with average levels of 9.38 ± 1.09 ng/ml (n=5),
10.82 ± 2.04 (n=5), and 10.48 ± 2.13 (n=5), respectively. There were no significant
differences in female estradiol levels among treatment groups (Fig. 3-4; ANOVA,
p=0.51). Plasma estradiol in females was not significantly correlated to p,p’-DDE

33
muscle tissue concentration or GSI (R2 =-0.34, p=0.35 and R2 =-0.49, p=0.60 ,
respectively). Males in the low, medium and high p,p’-DDE groups had mean plasma
estradiol levels of 7.72 ± 2.85 ng/ml (n=5), 3.85 ± 0.38 ng/ml (n=4), 5.58 ± 2.63 ng/ml
(n=4), whereas 0.37 ± 0.12 ng/ml (n=6) was the mean in the control group. Males in all
p,p’-DDE groups had significantly higher plasma estradiol levels than males in the
control group (Fig. 3-4; ANOVA, p<0.01). Plasma estradiol in males was not
significantly correlated to p,p’-DDE muscle tissue concentration or GSI (R2 =-0.26,
p=0.82 and R2 =-0.19, p=0.68, respectively). Plasma estradiol was significantly different
between males and females in the control (ANOVA, p<0.01) and medium groups only
(ANOVA, p=0.03).
While there were no significant differences of either sex among treatment groups,
the high groups tended to have noticeably lower GSI than control (Fig. 3-5). GSI in
males was 1.34 ± 0.23 (n=6) in the control group, 1.16 ± 0.26 (n=6) in the low group,
1.15 ± 0.29 (n=6) in the medium group, and 0.97 ± 0.13 (n=4) in the high group
(ANOVA, p=0.81; Fig 3-5 A). In females GSI was 7.96 ± 0.73 (n=6) in the control
group, 9.32 ± 1.53 (n=6) in the low group, 8.36 ± 1.27 (n=6) in the medium group, and
5.67 ± 0.98 (n=7) in the high group (ANOVA, p=0.16; Fig 3-5 B). GSI was not
significantly correlated to p,p’-DDE muscle tissue concentrations in males or females
(p=0.56 and p=0.13, respectively).
No adverse effect of p,p’-DDE treatment was observed in reproductive output in
fish from the low and medium p,p’-DDE groups. Fish in the high group, however,
spawned 77 percent fewer eggs than the control group at the conclusion of the experiment
(Fig. 3-6). The percent of eggs successfully fertilized was at least 90 percent in the
34
control, low and medium groups, but only 65 percent in the high group (Fig. 3-7 A).
Similar to fertilization success, the percent of fertilized eggs that hatched did not show a
dose-related response (Fig. 3-7 B). Percent hatch in the low group was 68 percent, but in
all other groups percent hatch exceeded 93 percent.
Frozen tissue samples of liver were used to compare expression of vitellogenin in
treated fish to control fish. Results for this analysis were not definitive due to
amplification of multiple products by primers for the housekeeping gene, 18S. Because
multiple products were amplified, 18S could not be used to normalize and quantify the
relative expression of the gene of interest, vitellogenin. To troubleshoot this problem, I
used a new stock of the 18S primer, which also amplified multiple products. I tried
amplifying other housekeeping genes, including L8 and β-actin, but had no success.
Effects of in ovo Exposure on Survival, Development, and Reproduction
Concentration of p,p’-DDE was measured in eggs spawned from adults p,p’-DDE
dose-response experiment II. p,p’-DDE in eggs spawned from the control group was
below the limit of detection. The concentration of p,p’-DDE in the eggs from the
medium and high groups was approximately 30 percent of the concentration found in
adult females in the medium and high p,p’-DDE groups (Fig. 3-8). Eggs from the
medium group contained 1.40 μg p,p’-DDE /g (n=1) and adults contained 3.11 ± 0.37 μg
p,p’-DDE /g muscle tissue (n=3). In the high group, eggs contained 7.60 μg p,p’-DDE /g
(n=1) and adult muscle tissue had 21.14 ± 2.72 (n=3). Eggs spawned from the low group
were not available for p,p’-DDE analysis.
All measurements of offspring are from eggs spawned in the p,p’-DDE
accumulation and reproductive output of adults experiment. Weekly survival was
measured for the first three weeks of life to assess early life-stage mortality related to
35
p,p’-DDE consumption of adults. There was considerable variability among treatment
groups in weekly offspring survival during the first three weeks after hatch (Table 3-1).
Offspring in the low and control group had identical average weekly survival
probabilities during the first three weeks after hatching. The medium offspring showed
the highest survival probability of 0.87 and the high group the next highest of 0.79. After
one month of life, there were only minor differences in monthly survival probabilities
among treatment groups, which were greater than or equal to 0.97.
The effects of in ovo exposure of p,p’-DDE on FHM development were measured
as body size at four months of age, appearance of secondary sex characteristics, and age
at first reproduction. Length and weight were measured when fish reached
approximately four months of age to assess differences in growth among treatment
groups. Fish in the low group weighed significantly more than all other groups
(ANOVA, p<0.01; Fig. 3-9). The medium group displayed secondary sex characteristics
15 days before offspring in the control and low groups (Fig. 3-10), while the high group
displayed secondary sex characteristics 22 days after the control and low groups (Fig. 3-
10). Age at first reproduction in the high group was 33 days greater than in the control,
low, and medium groups. The low group showed sexual development identical to control
offspring.
Fish exposed in ovo were killed at nine months of age for determination of sex
and gonad weight. Sex ratios differed considerably among treatment groups, but showed
no dose-dependent trend (Fig. 3-11). The control and high group ratios were close to
50:50, but the low group was skewed toward females and the medium toward males.
Average male GSI from offspring in the high group was significantly greater than all
36
other groups (ANOVA, p<0.01; Fig. 3-12 A). Females GSI did not differ significantly
among treatment groups (ANOVA, p=0.07; Fig. 3-12 B).
Reproductive output of fish exposed in ovo did not show the same pattern among
treatment groups as either sex ratio or GSI. The total number of eggs produced in each
group over nine months from greatest to least was from the low, medium, control, and
high groups (Fig. 3-13 A). Cumulative egg production was also calculated on a per
female basis, where sex ratio was used to estimate the number of females in each
treatment group during each collection period. On a per female basis, the number of eggs
per female from greatest to least was from the medium, low, control, and high groups
(Fig. 3-13 A). By both measurements of egg production, the high group produced
considerably less eggs than all other treatment groups.
Identification of Biomarkers
Correlations of among average measure of biomarkers and reproductive effects
were conducted using each treatment group (n=4). Biomarkers and reproductive effects
that were related were graphed for visual representation. Among adults, average female
estradiol and GSI were directly related to the percent of eggs fertilized and average male
estradiol was related to the number of eggs per female (Fig. 3-14 and Fig. 3-15).
Average female estradiol and GSI were inversely related to GSI in both sexes of their
offspring (Fig. 3-16).

37
Table 3-1. Survival probabilities for offspring spawned from adults fed p,p’-DDE during days 23-29. Survival probabilities were measured weekly for the first three weeks and monthly from one month through eight months post-hatch. Sample sizes are in parentheses next to each survival probability for 1-3 weeks post-hatch. After one month, fish populations were normalized to 100 offspring in each treatment group.
Average Survival Probabilities by Treatment Group
Control Low Medium High
Mean weekly survival for three weeks post hatch
0.69 (n=254)
0.69 (n=288)
0.87 (n=645)
0.79 (n=152)
Mean monthly survival for 1-8 months post hatch
0.99 0.99 0.97 0.98
0
50
100
150
200
250
300
350
400
-25 -15 -5 5 15 25
Time (days)
# eg
gs /
# fe
mal
es
Control900 ppm DDE 1208 ppm flutamide
Figure 3-1. The number of eggs produced per female before and after exposure to either
p,p’-DDE of flutamide as compared to control. Eggs per female during the pre-exposure period is shown to the left of the y-axis and eggs per female after fish were administered contaminated feed is shown to the right of the y-axis. There were 10 females in the control group, 7 in the p,p’-DDE group, and 12 in the flutamide group.

38
Treatment Group
Control DDE Flutamide
Mea
n P
lasm
a 17
ß-Es
tradi
ol (n
g/m
l)
0
2
4
6
8
10
12
14Male Female
a a
b
*
6 10 7 5 6 12
Figure 3-2. Comparison of plasma 17β-estradiol levels in males and females within and
among each treatment group. Values represent mean ± S.E. Significant differences among males among treatment groups are indicated by different letters (p<0.05). Significant differences between males and females within a treatment group are indicated by * (p<0.05).
Study Day
0 7 14 21 28
DD
E Ti
ssue
Con
cent
ratio
n (µ
g/g)
0
5
10
15
20
25
30
Low Medium High
Study Day
0 7 14 21 28
DD
E T
issu
e C
once
ntra
tion
(µg/
g)
0.0
0.1
0.2
0.3
0.4
0.5
Low
A B
Study Day
0 7 14 21 28
DD
E Ti
ssue
Con
cent
ratio
n (µ
g/g)
0
5
10
15
20
25
30
Low Medium High
Study Day
0 7 14 21 28
DD
E T
issu
e C
once
ntra
tion
(µg/
g)
0.0
0.1
0.2
0.3
0.4
0.5
Low
Study Day
0 7 14 21 28
DD
E Ti
ssue
Con
cent
ratio
n (µ
g/g)
0
5
10
15
20
25
30
Low Medium High
Study Day
0 7 14 21 28
DD
E T
issu
e C
once
ntra
tion
(µg/
g)
0.0
0.1
0.2
0.3
0.4
0.5
Low
A B
Figure 3-3. Mean p,p’-DDE muscle tissue concentration (μg p,p’-DDE / g wet weight
muscle tissue). A) p,p’-DDE measured in three fish from each treatment group every seven days during exposure. B) Expanded view of mean p,p’-DDE tissue concentrations measured in three fish from the low dose group every seven days during exposure. The concentration of three control fish represents the starting p,p’-DDE body burden for all treatment groups. Values are the mean ± S.E.

39
Treatment Group
Control Low Medium High
Mea
n Pl
asm
a 17
ß-es
tradi
ol (n
g/m
l)
0
2
4
6
8
10
12
14
Male Female
a
*
b
b
b
*
Figure 3-4. Comparison of plasma 17β-estradiol levels in males and females from each
treatment group. Values represent mean ± S.E. Significant differences between males and females within a treatment group are indicated by * (p<0.05). Different letters indicate statistically significant differences of the same sex among treatment groups (p<0.05). The number males in each treatment group were n=6 (control), n=5 (low), n=4 (medium), and n=4 (high). The number females in each treatment group were n=6 (control), n=5 (low), n=5 (medium), and n=5 (high).
Figure 3-6. Mean GSI values of male adults treated with DDE-contaminated feed. Error bars represent one standard error. Sample size is six for the control, low, medium groups and five for the high group. Figure 3-7. Mean GSI values of female adults treated with DDE-contaminated feed. Error bars represent one standard error. Sample size is six for the control, low, medium groups and seven for the high group.
Figure 3-5. Mean GSI values of adults treated with p,p’-DDE-contaminated feed. A) Male GSI. B) Female GSI. Error bars represent one standard error. Sample size is six for the control, low, medium groups and five for the high group.
Treatment Group
Control Low Medium High
Mea
n G
SI +
/- S.
E.
0.0
0.2
0.4
0.6
0.8
1.0
1.2
1.4
1.6
1.8controllowmediumhigh
Treatment Group
Control Low Medium High
Mea
n G
SI +
/- S
.E.
0
2
4
6
8
10
12
A Males B Females
Treatment Group
Control Low Medium High
Mea
n G
SI +
/- S.
E.
0.0
0.2
0.4
0.6
0.8
1.0
1.2
1.4
1.6
1.8controllowmediumhigh
Treatment Group
Control Low Medium High
Mea
n G
SI +
/- S
.E.
0
2
4
6
8
10
12
A Males B Females

40
Exposure Day
0 5 10 15 20 25 30
Num
ber o
f Egg
s pe
r Fem
ale
0
100
200
300
400
500Control Low Medium High
Figure 3-6. Cumulative number of eggs produced per female in adults of each treatment
group The number of females in each treatment group were n=7 (control), n=4 (low), n=7 (medium), and n=8 (high).
Per
cent
of E
ggs
Ferti
lized
0
20
40
60
80
100
120Control Low Medium High
Per
cent
of F
ertil
ized
Hat
ched
0
20
40
60
80
100A B
Per
cent
of E
ggs
Ferti
lized
0
20
40
60
80
100
120Control Low Medium High
Per
cent
of F
ertil
ized
Hat
ched
0
20
40
60
80
100A B
Figure 3-7. Egg fertilization and hatch success. A) The percent of eggs fertilized in
each treatment group. B) The percent of fertilized eggs that hatched in each treatment group. The number of eggs in each treatment group were n=307 (control), n=457 (low), n=645 (medium), and n=234 (high).

41
Treatment Group
Control Low Medium High
DD
E (µ
g /g
)
0
5
10
15
20
25
Adult Body Burden Egg Burden
Figure 3-8. Maternal transfer of p,p’-DDE to eggs.
Treatment GroupControl Low Medium High
Leng
th (m
m)
0
10
20
30
40
50
Wei
ght (
g)
0.0
0.2
0.4
0.6
0.8
1.0
1.2
1.4
1.6
1.8mean lengthmean weight
a
b
a
a
cdc
dcd
Figure 3-9. Mean length (mm) and weight (g) ± S.E. of offspring at four months after
hatch (n=50 for each treatment group). Error bars represent one standard error. Different letters above each bar indicate a significant difference between treatment groups (p<0.05).

42
Treatment Group
Control Low Medium High
Age
of O
ffspr
ing
(day
s)
80
100
120
140
160
180Male Characteristics First Reproduction
Figure 3-10. The age when male characteristics or first reproduction was observed in
offspring from each treatment group.
Treatment Group
Control Low Medium High
% fe
mal
e or
% m
ale
0
20
40
60
80
% female % male
Figure 3-11. Sex ratio of offspring in each treatment group (n=50 for each group).

43
Treatment Group
Control Low Medium High
Mea
n G
SI ±
S.E
.
0
2
4
6
8
10
12 controllowmediumhigh
Treatment Group
Control Low Medium High
Mea
n G
SI ±
S.E
.
0
5
10
15
20A Males B Females
a a a
b
Treatment Group
Control Low Medium High
Mea
n G
SI ±
S.E
.
0
2
4
6
8
10
12 controllowmediumhigh
Treatment Group
Control Low Medium High
Mea
n G
SI ±
S.E
.
0
5
10
15
20A Males B Females
a a a
b
Figure 3-12. GSI values of offspring in each treatment group. A) Mean male GSI. B) female GSI. Error bars represent one standard error. Significantly different values (p<0.05) are indicated by different letters above each bar.
Control Low Medium High
cum
ulat
ive
eggs
0
100
200
300
400
500
600
700
Control Low Medium High
cum
ulat
ive
eggs
/ fe
mal
e
0
5
10
15
20
25A B
Control Low Medium High
cum
ulat
ive
eggs
0
100
200
300
400
500
600
700
Control Low Medium High
cum
ulat
ive
eggs
/ fe
mal
e
0
5
10
15
20
25A B
Figure 3-13. Cumulative egg production of offspring through nine months of age. A) Cumulative number of eggs produced from offspring. B) Cumulative number of eggs produced per female from offspring.

44
Treatment Group
Control Low Medium High
Fem
ale
17ß-
estra
diol
and
GS
I
0
2
4
6
8
10
12
% E
ggs
ferti
lized
60
70
80
90
100
110
female GSIfemale estradiol (ng / ml)% eggs fertilized
Figure 3-14. Values of mean female plasma estradiol, mean female GSI, and the percent
of eggs fertilized are given for each treatment group to show relationships among the variables. Estradiol and GSI values are on the left y-axis and the percent of eggs fertilized is on the right y-axis.

45
Treatment Group
Control Low Medium High
Mal
e 17
ß-es
tradi
ol
0
2
4
6
8
Egg
s pe
r fem
ale
0
10
20
30
40
50
60adult male estradiol (ng / ml)#eggs / female
Figure 3-15. Values of mean plasma estradiol and the percent of eggs per female are
given for each treatment group to show relationships among the variables. Estradiol values are on the left y-axis and the number of eggs per female is on the right y-axis.
46
Treatment Group
Control Low Medium High
Fem
ale
17ß-
estra
diol
and
GS
I
0
2
4
6
8
10
12
% E
ggs
ferti
lized
60
70
80
90
100
110
female GSIfemale estradiol (ng / ml)% eggs fertilized
Figure 3-16. Values of mean adult female plasma estradiol and mean adult GSI for fish
exposed as adults and for fish exposed in ovo are given for each treatment group to show relationships among the variables. Estradiol and GSI values are on the left y-axis.

47
DISCUSSION
Effects of Adult Exposure to p,p’-DDE on Reproduction, 17β-Estradiol, and GSI
One of the primary goals of the dose-response experiments was to achieve a
relatively constant body burden which resembled that of wild fish from previous studies.
Fish in the low and medium p,p’-DDE groups achieved a muscle tissue concentration of
approximately 30 percent and the high group achieved approximately 20 percent of the
feed concentration of p,p’-DDE. Largemouth bass accumulated greater than 30 percent
of p,p’-DDE in the diet after 30 days of exposure to 3.6 μg / g feed (Muller 2003), which
is similar to the accumulation rate of fathead minnows in this study. Thus, the doses in
the low and medium groups of the dose response experiments are environmentally
relevant, but the doses in the high group and the pilot study are probably out of the range
of environmental relevance.
In terms of population level parameters, survival probabilities were identical in
adults in the dose response experiments because there were no mortalities at any dose.
However, the number of eggs laid per female was considerably reduced in the high p,p’-
DDE group. This suggests that the no observed effect level (NOEL) under these
experimental conditions is between 10 μg / g and 100 μg / g in the feed. Egg production
in the high group did not differ from other groups until about day 14 of p,p’-DDE
exposure. It was between days 7 and 14 that p,p’-DDE muscle tissue concentration in the
high group increased rapidly from 7.26 ± 0.46 to 8.54 ± 6.82 μg / g. Because there was
no discernable difference in eggs per female before day 14 in the high group and

48
reproduction was not affected in the medium group at any point during the study, it is
likely that the NOEL is between the day 29 p,p’-DDE muscle concentration in the
medium group (3.0 ± 0.57 μg / g) and the day 14 p,p’-DDE muscle tissue concentration
in the high group (8.54 ± 6.82 μg / g).
The percent of eggs that were fertilized and that hatched were measured to isolate
which sex might be responsible for any reproductive dysfunction observed. The percent
of eggs fertilized in the high group was much lower than any other group. This type of
response have previously been observed in guppies exposed to 100 μg p,p’-DDE / g feed,
which had a marked decrease in sperm count (Bayley et al. 2002). Alternatively,
fertilization success of male trout injected with p,p’-DDE was not altered. The percent of
fertilized eggs that hatched in the low group was also much lower than any other group,
which indicates a problem with egg rather than sperm quality. Along with data from
other studies, my results suggest there may be a problem with fertilization in the high
group, in which males had significantly elevated estradiol. Without replication, however,
these results are inconclusive.
The pilot experiment demonstrated that p,p’-DDE impairs reproduction and does
not have the same effect as the mammalian anti-androgen, flutamide, at similar doses in
feed. Fathead minnows treated with p,p’-DDE stopped spawning after just three days of
exposure, while those treated with flutamide spawned at a relatively constant rate
throughout the pre-exposure and exposure periods. In other studies, waterborne
flutamide reduced fecundity of fathead minnows (Jensen et al. 2004). The route of
exposure is a likely factor that contributed to the difference in effect of flutamide and
p,p’-DDE on reproductive output: fish in this study were administered p,p’-DDE and

49
flutamide via feed and fish other studies were exposed to waterborne flutamide. The
control group seemed to have a lower spawning rate during the final ten days of the
experiment, but the rate of spawning in p,p’-DDE treated fish was zero throughout the
final 25 days of exposure. Thus, p,p’-DDE caused reproductive impairment because
exposed fish completely stopped spawning before the spawning rate of control fish
declined.
Plasma 17β-estradiol (estradiol) levels were measured in fathead minnows from the
pilot experiment to investigate if p,p’-DDE acted by a similar mechanism as the
antiandrogen flutamide. The high dose of p,p’-DDE in the pilot experiment (900 μg p,p’-
DDE / g feed) decreased estradiol in females, though not significantly, but flutamide
significantly increased estradiol in males, the same result of a study where fathead
minnows were exposed to waterborne flutamide (Jensen et al. 2004). p,p’-DDE did not
affect estradiol in male fish in the pilot experiment, which had estradiol values almost
identical to the control group. Despite the fact that males treated with flutamide had
plasma estradiol levels twice that of control, no effect on reproductive output was
observed. In other studies, reproductive out was adversely affected in fish treated with
waterborne flutamide (Jensen et al. 2004).
The first experiment proved that p,p’-DDE can cause reproductive dysfunction in
fathead minnows, albeit at a relatively high dose. In that experiment estradiol levels were
also considerably reduced in females treated with p,p’-DDE. At the lower and
environmentally relevant levels of p,p’-DDE in the dose response experiment, female
estradiol levels were unaffected and male plasma estradiol levels increased as a result of
p,p’-DDE treatment. Similar to the result in males of the pilot study, trout injected with

50
p,p’-DDE (30 μg / g) did not have increased vitellogenin, which is a response of
exposure to estrogens (Donohoe and Curtis 1996). Thus, p,p’-DDE was not acting as an
estrogen in that study. The dose in that study on trout was much greater than the
concentration found in the ovary in fathead minnow administered 104 μg p,p’-DDE / g
feed in this study. The lack of an estrogenic response to a high dose of p,p’-DDE in trout
coincides with no statistically significant changes in estradiol in the pilot experiment,
where fish also received a very high dose (900 μg / g feed). A compensatory mechanism
may explain the difference in responses observed at very high versus environmentally
relevant doses.
Hormone receptors are common targets of endocrine disruptors (Young et al.
2005). In other studies, p,p’-DDE and flutamide had similar effects on mammalian
hormone receptor binding (Kelce et al. 1995) and on secondary sex characteristics in
guppies, a viviparous fish (Bayley et al. 2002). However, in studies on oviparous fish
cells, including other cyprinids, flutamide did not bind the AR, but p,p’-DDE did (Wells
and Van Der Kraak 2000). Additionally, when investigating AR binding in brain,
ovarian, and testicular tissues from goldfish (Curassius auratus) and rainbow trout
(Oncorhynchus mykiss), Wells and Van der Kraak (2000) found that p,p’-DDE bound
only to AR from goldfish testes. The difference in AR binding affinities among species,
in conjunction with different changes in estradiol, suggests that p,p’-DDE and flutamide
do not act solely by similar anti-androgenic mechanisms in fatheads minnows. In this
experiment, estradiol levels in fish treated with p,p’-DDE or flutamide were not similarly
altered, which contradicts findings of these two compounds in some other species. The

51
data here corroborate evidence that an EDC’s mode of action may differ greatly among
species.
Steroid synthetic and metabolic pathways are another possible target of the
endocrine disruption caused by p,p’-DDE in this study. Although a very high dose of
p,p’-DDE did not cause the same affect on reproduction or estradiol as flutamide, fish
responded to lower doses of p,p’-DDE in a manner consistent with flutamide in the pilot
study: estradiol was elevated in males treated with flutamide and in males from all p,p’-
DDE groups in the dose response study. Thibaut and Porte (2004) found that p,p’-DDE
(200 μM) increased synthesis of maturation inducing hormones (MIH), specifically
pregnenolone, in carp ovarian cells by increasing 20β-HSD activity. An overall increase
in pregnenolone is likely to result in higher levels of hormones, as was seen in p,p’-DDE
-treated fish in the dose response experiment, because it is the substrate from which sex
steroid hormones are made. Largemouth bass exposed to p,p’-DDE under laboratory
conditions (Muller, unpublished data) and in kelp bass (Paralabrax clathratus) from sites
contaminated with DDTs had decreased steroid hormone levels (Spies and Thomas
1997), which is the opposite response of fathead minnows in this study. Again, this
suggests species specific responses to EDCs.
The fact that there was no change in estradiol in females at environmentally
relevant doses, but there was a change in males indicates that there is a sex specific target
of p,p’-DDE or that the target of p,p’-DDE is more sensitive in males. Two potential
targets of p,p’-DDE that might cause increased estradiol in males are P450aromatase and
Phase II enzymes (e.g. UDP-glucuronosyltransferase and sulfotranserfase). If
P450aromatase activity is stimulated, more testosterone would be converted to estradiol.

52
Alternatively, if Phase II enzymes were inhibited, estradiol would not be metabolized and
subsequently excreted (Thibaut and Porte 2004). An increase in estradiol production
would result in p,p’-DDE binding to factors that inhibit the release of GtH I, which is a
stimulant of estradiol and testosterone production (Arcand-Hoy and Benson 2001).
Plasma GtH I was decreased in fish from a site contaminated with DDTs and PCBs
(Spies and Thomas 1997), indicating that chlorinated compounds such as p,p’-DDE, may
be disrupting the endocrine system in the hypothalamus and pituitary, not just the steroid
synthetic or metabolic pathways in the gonad. Speculating the target enzyme or factor in
the HPG axis that increases estradiol in males is risky without those additional data on
other hormones and enzyme activity.
Gonadosomatic index is often used as an indicator of endocrine status in fish
(Jensen et al. 2001; Mills et al. 2001; Noaksson et al. 2003). Gonadosomatic index did
not differ significantly among treatment groups nor correlate with p,p’-DDE content or
estradiol levels. However, both males and females in the high group of the dose response
experiment showed a trend toward decreased GSI. Mills et al. (2001) found that none of
the measures of endocrine status including GSI, hepatosomatic index, estradiol,
vitellogenin, and gonadal development changed in juvenile summer flounder
(Paralichthys dentatus) exposed to p,p’-DDE intravenously. Bayley et al. (2002) found
similar results in guppies, where GSI was the only androgen controlled characteristic not
affected by p,p’-DDE. Similarly, in this study GSI was not an indicator of adult exposure
to p,p’-DDE.
Effects of in ovo p,p’-DDE Exposure on Survival, Development, and Reproduction
The concentration p,p’-DDE in fish was not changing significantly during the
collection of eggs used for survival and development studies. A relatively stable level of
53
p,p’-DDE in adults was achieved by allowing adult fish to accumulate p,p’-DDE for at
least 17 days before collecting eggs. Egg concentration of p,p’-DDE in the medium
group (1.40 μg / g) was comparable to total DDTs found in largemouth bass ovaries in
site contaminated with p,p’-DDE in Florida (2.82 ± 0.49 μg / g; (Marburger et al. 2002).
Survival, development, and reproduction were monitored for nine months in eggs
spawned from adults exposed to p,p’-DDE. Eighty-nine percent of eggs in the control
group were successfully fertilized and 93% of those fertilized eggs hatched. The hatch
rates in this study are comparable to that of control fish in other studies, where
hatchability is greater than 90 percent (Ankley et al. 2001). These rates indicate that fry
rearing conditions were amenable to successful development.
Survival probabilities are important parameters for projecting population growth
rates (Caswell 2001). In this study, early survival of fathead minnows exposed to p,p’-
DDE in ovo was not directly dependent on dose. Fish in the low group had early survival
probabilities identical to the control group. Because estradiol was not affected in
females, one would not expect a change in offspring survival caused by altered egg
quality, which is largely controlled by estrogen during oocyte development (Arcand-Hoy
and Benson 2001). However, Cheek et al. (2000) found dose-dependent survival of eggs
exposed to an estrogenic compound, which was not a result observed in the present study.
It is imperative to understand differences in sexual maturity among groups because
age at first reproduction can be an important determinant of population growth rate
(Levin et al. 1996). Fish in the low group had identical survival and sexual development
as the control group, though they were larger at four months of age. In Cheek et al.
(2000), fish exposed to the estrogen o,p’-DDT during development were also
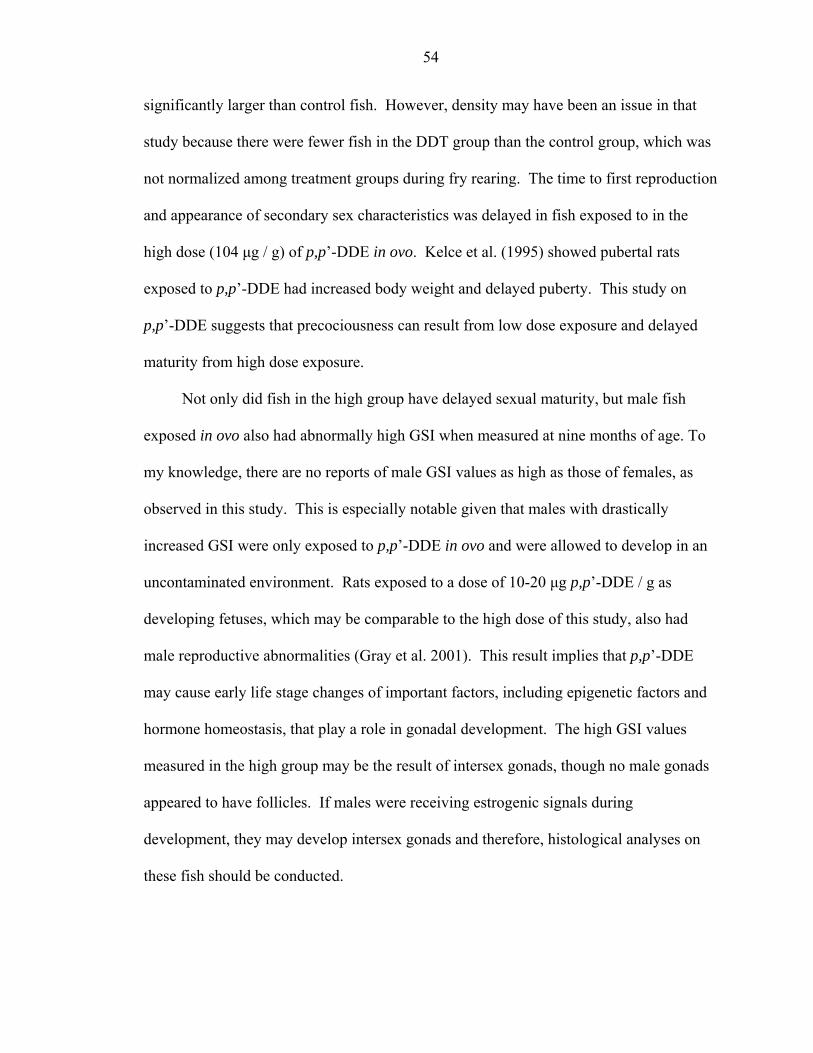
54
significantly larger than control fish. However, density may have been an issue in that
study because there were fewer fish in the DDT group than the control group, which was
not normalized among treatment groups during fry rearing. The time to first reproduction
and appearance of secondary sex characteristics was delayed in fish exposed to in the
high dose (104 μg / g) of p,p’-DDE in ovo. Kelce et al. (1995) showed pubertal rats
exposed to p,p’-DDE had increased body weight and delayed puberty. This study on
p,p’-DDE suggests that precociousness can result from low dose exposure and delayed
maturity from high dose exposure.
Not only did fish in the high group have delayed sexual maturity, but male fish
exposed in ovo also had abnormally high GSI when measured at nine months of age. To
my knowledge, there are no reports of male GSI values as high as those of females, as
observed in this study. This is especially notable given that males with drastically
increased GSI were only exposed to p,p’-DDE in ovo and were allowed to develop in an
uncontaminated environment. Rats exposed to a dose of 10-20 μg p,p’-DDE / g as
developing fetuses, which may be comparable to the high dose of this study, also had
male reproductive abnormalities (Gray et al. 2001). This result implies that p,p’-DDE
may cause early life stage changes of important factors, including epigenetic factors and
hormone homeostasis, that play a role in gonadal development. The high GSI values
measured in the high group may be the result of intersex gonads, though no male gonads
appeared to have follicles. If males were receiving estrogenic signals during
development, they may develop intersex gonads and therefore, histological analyses on
these fish should be conducted.

55
Reproductive output of fish exposed in ovo varied among treatment groups. When
measured as total egg output, the low group produced more eggs over nine months than
any other group. Measured as eggs per female, however, the medium group produced
more eggs than all other groups. The disparity in these two measures can be attributed to
a skewed sex ratio toward females in the low group and males in the medium group. The
high group spawned considerably fewer eggs throughout the experiment and fewer eggs
per female, a finding that cannot be attributed to a skewed sex ratio, which was close to
50:50 in the high group.
Biomarkers
A correlation matrix of average values of biomarkers and reproductive output was
produced to identify potential relationships. Biomarkers and reproductive measures that
were significantly correlated were then graphed for visual representation of the
relationship because no statistical tests could be conducted on parameters for which there
was no replication for each treatment group (i.e. number of eggs per female, percent of
eggs fertilized, etc.).
Female GSI and estradiol of adults exposed to p,p’-DDE via feed were related to
one another and the percent of eggs fertilized. There was no significant relationship
between female GSI and estradiol when correlated using individual data, which is
probably due to the fact that GSI remains relatively constant but estradiol changes
throughout the spawning cycle of fathead minnows (Jensen et al. 2001). Additionally,
the percent of eggs fertilized was also directly related to adult female GSI and estradiol.
This is interesting because few studies investigate fertilization success, which was related
to GSI and estradiol in this study. GSI and estradiol are typically related to egg output,
which was not the case in this study (Jensen et al. 2001).
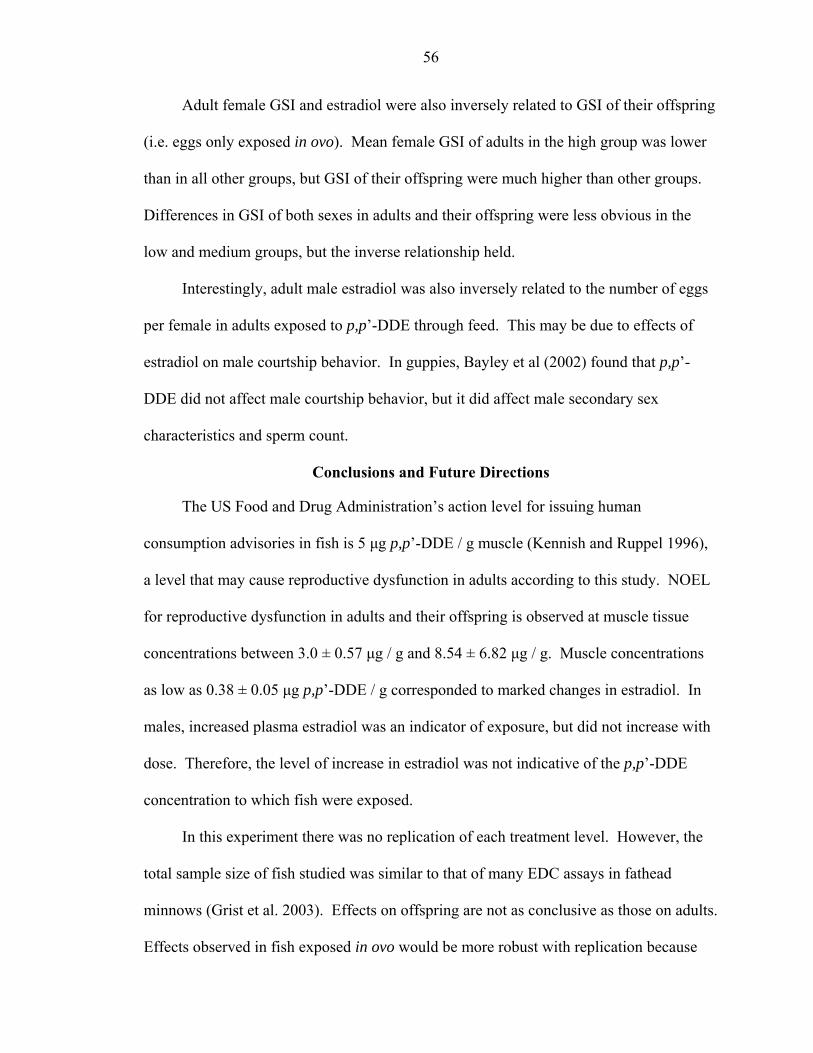
56
Adult female GSI and estradiol were also inversely related to GSI of their offspring
(i.e. eggs only exposed in ovo). Mean female GSI of adults in the high group was lower
than in all other groups, but GSI of their offspring were much higher than other groups.
Differences in GSI of both sexes in adults and their offspring were less obvious in the
low and medium groups, but the inverse relationship held.
Interestingly, adult male estradiol was also inversely related to the number of eggs
per female in adults exposed to p,p’-DDE through feed. This may be due to effects of
estradiol on male courtship behavior. In guppies, Bayley et al (2002) found that p,p’-
DDE did not affect male courtship behavior, but it did affect male secondary sex
characteristics and sperm count.
Conclusions and Future Directions
The US Food and Drug Administration’s action level for issuing human
consumption advisories in fish is 5 μg p,p’-DDE / g muscle (Kennish and Ruppel 1996),
a level that may cause reproductive dysfunction in adults according to this study. NOEL
for reproductive dysfunction in adults and their offspring is observed at muscle tissue
concentrations between 3.0 ± 0.57 μg / g and 8.54 ± 6.82 μg / g. Muscle concentrations
as low as 0.38 ± 0.05 μg p,p’-DDE / g corresponded to marked changes in estradiol. In
males, increased plasma estradiol was an indicator of exposure, but did not increase with
dose. Therefore, the level of increase in estradiol was not indicative of the p,p’-DDE
concentration to which fish were exposed.
In this experiment there was no replication of each treatment level. However, the
total sample size of fish studied was similar to that of many EDC assays in fathead
minnows (Grist et al. 2003). Effects on offspring are not as conclusive as those on adults.
Effects observed in fish exposed in ovo would be more robust with replication because

57
differences in low and medium groups were subtle (e.g. female GSI) or without variation
(e.g. egg production).
This study has preliminarily linked biomarkers, such as adult GSI and offspring
GSI, to population parameters such as viable eggs, which can be used to develop matrix
population models. Modeling populations of treated fish would better define actual
population outcomes that may result from p,p’-DDE treatment. The population level data
collected in this study, including survival probabilities and fertilities, should be used to
project population growth rates under each treatment and/or combinations of treatments.
58
APPENDIX HORMONE DETERMINATION BY RIA
Plasma hormone concentrations of 17β-estradiol and testosterone were determined
by radioimmunoassay, as previously described (Jensen et al. 2001; Kagawa et al. 1981).
The assays were optimized for the antibodies and 3H-hormones used. The assay is
described as follows: plasma was diluted 1:5 for females and 1:4 for males with 0.1 M
PBS (pH 7.6). One-hundred fifty microliters 0.1 M PBS were added to 6 μl of diluted
plasma. The diluted plasma was extracted twice with 1.5 ml ethyl ether, the extract was
evaporated, and reconstituted in 120 μl assay buffer (0.01 M PBS with 1% BSA, pH 7.4).
One hundred microliters of reconstituted extract or 17β-estradiol standard, 100 μl
estradiol antibody (Fitzgerald Industries International, Inc.; catalogue number 20-ER06;
1:16,000 final dilution), and 100 μl of 0.05 μCi/ml 3H-17β-estradiol (Amersham
Biosciences; catalogue number 125-250UCI) were added to a microcentrifuge tube and
incubated for two hours at 25 °C, then placed in an ice-water bath for 15 minutes. Four-
hundred microliters of Dextran-coated charcoal solution (1.5 g activated charcoal, 0.15 g
Dextran (Sigma-Aldrich; catalogue numbers C-3345 and D-4751, respectively), and 300
ml of 0.1 M PBS, pH 7.6) were added to each tube and the tubes were returned to the ice-
water bath for another 15 minutes. The tubes were centrifuged at 3,000 rpm for 30
minutes at 4 °C, 0.5 ml of the supernatant was placed into a scintillation vial to which 4.5
ml of scintillation fluid were added (Fisher Scientific, catalogue numbers SX18-4).
Tritium was counted for two minutes for each sample on a scintillation counter (Beckman
Coulter LS 6000 IC).

59
The estradiol RIA method described above could not be validated. Values
calculated were artificially high. After several troubleshooting experiments as well as
sending samples to another lab, I determined the antibody binds to multiple components
in the extract. This may be remedied by using ether with higher purity. However, I
believe the root of the problem lies with the specificity of the antibody.

60
REFERENCES
Ankley GT, Jensen KM, Kahl MD, Korte JJ, Makynen EA. 2001. Description and evaluation of a short-term reproduction test with the fathead minnow (Pimephales promelas). Environ Toxicol Chem 20(6):1276-1290.
Anway MD, Cupp AS, Uzumcu M, Skinner MK. 2005. Epigenetic transgenerational
actions of endocrine disruptors and male fertility. Science 308(5727):1466-1469. Arcand-Hoy LD, Benson WH. 2001. Toxic responses of the reproductive system. In:
Taget Organ Toxicity in Marine and Freshwater Teleosts (Schlenk D, Baatrup E, eds). New York:Taylor and Francis, 175-202.
Barata C, Baird D, Soares A. 2002. Demographic responses of a tropical cladoceran to
cadmium: Effects of food supply and density. Ecol Appl 12(2):552-564. Bayley M, Junge M, Baatrup E. 2002. Exposure of juvenile guppies to three
antiandrogens causes demasculinization and a reduced sperm count in adult males. Aquat Toxicol 56(4):227-239.
Carlson DB, Curtis LR, Williams DE. 2000. Salmonid sexual development is not
consistently altered by embryonic exposure to endocrine-active chemicals. Environ Health Perspect 108(3):249-255.
Carr RL, Chambers JE. 2001. Toxic responses of the nervous system. In: Target Organ
Toxicity Marine and Freshwater Teleosts (Schlenk D, Benson W, eds). New York:Taylor and Francis, 26-95.
Caswell H. 2001. Matrix Population Models. Sunderland:Sinauer Associates, Inc. Catalan J, Ventura M, Vives I, Grimalt JO. 2004. The roles of food and water in the
bioaccumulation of organochlorine compounds in high mountain lake fish. Environ Sci Technol 38(16):4269-4275.
Chedrese PJ, Feyles F. 2001. The diverse mechanism of action of
dichlorodiphenyldichloroethylene (DDE) and methoxychlor in ovarian cells in vitro. Reprod Toxicol 15(6):693-698.
Cheek A, Brouwer T, Carroll S, Manning S, McLachlan J, Brouwer M. 2001.
Experimental evaluation of vitellogenin as a predictive biomarker for reproductive disruption. Environ Health Perspect 109(7):681-690.

61
Collas P. 1998. Modulation of plasmid DNA methylation and expression in zebrafish
embryos. Nucleic Acids Res 26(19):4454-4461. Cook PM, Robbins JA, Endicott DD, Lodge KB, Guiney PD, Walker MK, et al. 2003.
Effects of aryl hydrocarbon receptor-mediated early life stage toxicity on lake trout populations in Lake Ontario during the 20th century. Environ Sci Technol 37(17):3864-3877.
Crellin NK, Rodway MR, Swan CL, Gillio-Meina C, Chedrese PJ. 1999.
Dichlorodiphenyldichloroethylene potentiates the effect of protein kinase A pathway activators on progesterone synthesis in cultured porcine granulosa cells. Biol Reprod 61(4):1099-1103.
Denslow ND, Chow M, Chow MM, Bonomelli LCF, Heppell SA, Sullivan CV. 1997.
Development of biomarkers for environmental contaminants affecting fish. In: Chemically Induced Alterations in Functional Development and Reproduction of Fishes (Rolland RM, Gilbertson M, Peterson RE, eds). Pensacola, FL:SETAC Press, 73-86.
Denslow ND, Chow MC, Kroll KJ, Green L. 1999. Vitellogenin as a biomarker for
estrogen and estrogen mimics. Ecotoxicology 8:385-398. Ding LD. 2005. Vitellogenesis and Vitellogenin Uptake into Oocytes. In: Hormones and
their Receptors in Fish Reproduction (Melamed P, Sherwood N, eds). Hackensack, NJ:World Scientific Publishing Co. Pte. Ltd., 254-276.
Donohoe R, Curtis LR. 1996. Estrogenic activity of chlordecone, o,p'-DDT, o,p'-DDE in
juvenile rainbow trout: induction of vitellogenesis and interaction with hepatic estrogen binding sites. Aquatic Toxicol 36:31-52.
Filby AL, Tyler CR. 2005. Molecular characterization of estrogen receptors 1, 2a, and 2b
and their tissue and ontogenic expression profiles in fathead minnow (Pimephales promelas). Biol Reprod 73(4):648-662.
Foran C, Peterson B, Benson W. 2002. Influence of parental and developmental cadmium
exposure on endocrine and reproductive function in Japanese medaka (Oryzias latipes). Comp Biochem Phys C 133(3):345-354.
Foster EP, Fitzpatrick MS, Feist GW, Schreck CB, Yates J. 2001. Gonad organochlorine
concentrations and plasma steroid levels in White sturgeon (Acipenser transmontanus) from the Columbia River, USA. Bull Environ Contam Toxicol 67(2):239-245.

62
Glesleichter J, Manire CA, Szabo NJ, Cortes E, Carlson J, Lombardi-Carlson L. 2005. Organochlorine concentrations in bonnethead sharks (Sphyrna tiburo) from Four Florida Estuaries. Arch Environ Contam Toxicol 48(4):474-483.
Giesy J, Pierens S, Snyder E, Miles-Richardson S, Kramer V, Snyder S, et al. 2000.
Effects of 4-nonylphenol on fecundity and biomarkers of estrogenicity in fathead minnows (Pimephales promelas). Environ Toxicol Chem 19(5):1368-1377.
Grau BL, Peterle TJ. 1979. Compartmentalization of 14C-DDT in an experimental old-
field plot. Bull Environ Contam Toxicol 22(6):846-853. Gray LE, Jr., Ostby J, Wilson V, Lambright C, Bobseine K, Hartig P, et al. 2002.
Xenoendocrine disrupters-tiered screening and testing: filling key data gaps. Toxicology 181-182:371-382.
Gray LE, Ostby J, Furr J, Wolf CJ, Lambright C, Parks L, et al. 2001. Effects of
environmental antiandrogens on reproductive development in experimental animals. Human Reproduction Update 7(3):248-264.
Grist E, Wells N, Whitehouse P, Brighty G, Crane M. 2003. Estimating the effects of 17
alpha-ethinylestradiol on populations of the fathead minnow Pimephales promelas: Are conventional toxicological endpoints adequate? Environ Sci Technol 37(8):1609-1616.
Guillette LJ, Jr., Gross TS, Gross DA, Rooney AA, Percival HF. 1995. Gonadal
steroidogenesis in vitro from juvenile alligators obtained from contaminated or control lakes. Environ Health Perspect 103 Suppl 4:31-36.
Guillette LJ, Jr., Gross TS, Masson GR, Matter JM, Percival HF, Woodward AR. 1994.
Developmental abnormalities of the gonad and abnormal sex hormone concentrations in juvenile alligators from contaminated and control lakes in Florida. Environ Health Perspect 102(8):680-688.
Halm S, Kwon JY, Rand-Weaver M, Sumpter JP, Pounds N, Hutchinson TH, et al. 2003.
Cloning and gene expression of P450 17alpha-hydroxylase,17,20-lyase cDNA in the gonads and brain of the fathead minnow Pimephales promelas. Gen Comp Endocrinol 130(3):256-266.
Heath R, Spann J, Kreitzer J. 1969. Marked DDE impairment of mallard reproduction in
controlled studies. Nature 224(5214):47-&. Hornung MW, Jensen KM, Korte JJ, Kahl MD, Durhan EJ, Denny JS, et al. 2004.
Mechanistic basis for estrogenic effects in fathead minnow (Pimephales promelas) following exposure to the androgen 17alpha-methyltestosterone: conversion of 17alpha-methyltestosterone to 17alpha-methylestradiol. Aquatic Toxicol 66(1):15-23.

63
Hu M, Chiang E, Tong S, Lai W, Hsu N, Wang L, et al. 2001. Regulation of
steroidogenesis in transgenic mice and zebrafish. Molecular and Cellular Endocrinol 171(1-2):9-14.
Huang HJ, Liu SM, Kuo CE. 2001. Anaerobic biodegradation of DDT residues (DDT,
DDD, and DDE) in estuarine sediment. J Environ Sci Health B 36(3):273-288. Jensen KM, Kahl MD, Makynen EA, Korte JJ, Leino RL, Butterworth BC, et al. 2004.
Characterization of responses to the antiandrogen flutamide in a short-term reproduction assay with the fathead minnow. Aquat Toxicol 70(2):99-110.
Jensen KM, Korte JJ, Kahl MD, Pasha MS, Ankley GT. 2001. Aspects of basic
reproductive biology and endocrinology in the fathead minnow (Pimephales promelas). Comp Biochem Physiol C 128(1):127-141.
Kagawa H, Takano K, Nagahama Y. 1981. Correlation of plasma estradiol-17 beta and
progesterone levels with ultrastructure and histochemistry of ovarian follicles in the white-spotted char, Salvelinus leucomaenis. Cell Tissue Res 218(2):315-329.
Kalantzi OI, Alcock RE, Johnston PA, Santillo D, Stringer RL, Thomas GO, et al. 2001.
The global distribution of PCBs and organochlorine pesticides in butter. Environ Sci Technol 35(6):1013-1018.
Kannan K, Kajiwara N, Watanabe M, Nakata H, Thomas N, Stephenson M, et al. 2004.
Profiles of polychlorinated biphenyl congeners, organochlorine pesticides, and butyltins in southern sea otters and their prey. Environ Toxicol Chem 23(1):49-56.
Kelce WR, Stone CR, Laws SC, Gray LE, Kemppainen JA, Wilson EM. 1995. Persistent
DDT metabolite p,p'-DDE is a potent androgen receptor antagonist. Nature 375(6532):581-585.
Kennish MJ, Ruppel BE. 1996. DDT contamination in selected estuarine and coastal
marine finfish and shellfish of New Jersey. Arch Environ Contam Toxicol 31(2):256-262.
Kime D. 1995. The effect of reproduction on fish. Rev Fish Biol Fisher 5(1):52-95. Korte J, Kahl M, Jensen K, Pasha M, Parks L, LeBlanc G, et al. 2000. Fathead minnow
vitellogenin: Complementary DNA sequence and messenger RNA and protein expression after 17 beta-estradiol treatment. Environ Toxicol Chem 19(4):972-981.
LeBlanc GA, Bain LJ, Wilson VS. 1997. Pesticides: multiple mechanisms of
demasculinization. Mol Cell Endocrinol 126(1):1-5.

64
Levin L, Caswell H, Bridges T, DiBacco C, Cabrera D, Plaia G. 1996. Demographic
responses of estuarine polychaetes to pollutants: Life table response experiments. Ecol Appl 6(4):1295-1313.
Loomis AK, Thomas P. 2000. Effects of estrogens and xenoestrogens on androgen
production by Atlantic croaker testes in vitro: evidence for a nongenomic action mediated by an estrogen membrane receptor. Biol Reprod 62(4):995-1004.
Macek K. 1968. Reproduction in brook trout (Salvelinus fontinalis) fed sublethal
concentrations of DDT. J Fish Res Board Can 25(9):1787-&. Makynen EA, Kahl MD, Jensen KM, Tietge JE, Wells KL, Van Der Kraak G, et al. 2000.
Effects of the mammalian antiandrogen vinclozolin on development and reproduction of the fathead minnow (Pimephales promelas). Aquatic Toxicol 48(4):461-475.
Marburger J, Johnson W, Gross T, Douglas D, Di J. 2002. Residual organochlorine
pesticides in soils and fish from wetland restoration areas in central Florida, USA. Wetlands 22(4):705-711.
Matsui M, Kinuyama Y, Hakozaki M. 1974. Biliary metabolites of testosterone and
testosterone glucosiduronate in the rat. Steroids 24(4):557-573. Matsumura F. 1985. Toxicology of Insecticides. New York:Plenum Press. Mauri M, Baraldi E, Simonini R. 2003. Effects of zinc exposure on the polychaete
Dinophilus gyrociliatus: a life-table response experiment. Aquatic Toxicol 65(1):93-100.
Mayer FL, Versteeg DJ, McKee MJ, Folmar LC, Graney RL, McCume DC, et al. 1992.
Physiological and nonspecific biomarkers. In: Biomarkers: Biochemical, Physiological, and Histological Markers of Anothropogenic Stress (Huggett RL, Kimble RA, Mehrle PM, Bergman HL, eds). Boca Raton:Lewis, 5-86.
Miglioranza KS, Aizpun de Moreno JE, Moreno VJ. 2003. Dynamics of organochlorine
pesticides in soils from a southeastern region of Argentina. Environ Toxicol Chem 22(4):712-717.
Miller DH, Ankley GT. 2004. Modeling impacts on populations: fathead minnow
(Pimephales promelas) exposure to the endocrine disruptor 17beta-trenbolone as a case study. Ecotoxicol Environ Saf 59(1):1-9.
Mills L, Chichester C. 2005. Review of evidence: Are endocrine-disrupting chemicals in
the aquatic environment impacting fish populations? Sci Total Environ 343(1-3):1-34.

65
Mills LJ, Gutjahr-Gobell RE, Haebler RA, Horowitz DJ, Jayaraman S, Pruell RJ, et al. 2001. Effects of estrogenic (o,p'-DDT; octylphenol) and anti-androgenic (p,p'-DDE) chemicals on indicators of endocrine status in juvenile male summer flounder (Paralichthys dentatus). Aquat Toxicol 52(2):157-176.
Moffat AC, ed. 1986. Clarke's isolation and identification of durgs in pharmeceuticals,
body fluids, and post-mortem material. London:The Pharmeceutical Press. Monnosson E, Kelce WR, Mac M, Gray LE. 1997. Environmental antiandrogens:
potential effects on fish reproduction and development. In: Chemically Induced Alterations in Functional Development and Reproduction of Fishes (Rolland RM, Gilbertson M, Peterson RE, eds). Pensacola, FL:SETAC Press, 53-60.
Muller JK. 2003. An evaluation of dosing methods and effects of p,p'-DDE and dieldrin
in Florida largemouth bass (Micropterus salmiodes floridanus). Gainesville, Fla.:University of Florida. Available: http://purl.fcla.edu/fcla/etd/UFE0001107.
Nagahama Y, Yoshikuni M, Yamashita M, Tanaka M. 1994. Molecular endocrinology of
fish. In: Fish Physiology (Sherwood N, Hew CL, eds). San Diego:Academic Press.
Nash JP, Kime DE, Van der Ven LT, Wester PW, Brion F, Maack G, et al. 2004. Long-
term exposure to environmental concentrations of the pharmaceutical ethynylestradiol causes reproductive failure in fish. Environ Health Perspect 112(17):1725-1733.
Nimrod AC, Benson WH. 1997. Assessment of estrogenic activity in fish. In: Chemically
Induced Alterations in Functional Development and Reproduction of Fishes (Rolland RM, Gilbertson M, Peterson RE, eds). Pensacola, FL:SETAC Press.
Noaksson E, Linderoth M, Bosveld AT, Balk L. 2003. Altered steroid metabolism in
several teleost species exposed to endocrine disrupting substances in refuse dump leachate. Gen Comp Endocrinol 134(3):273-284.
Orlando EF, Denslow ND, Folmar LC, Guillette LJ, Jr. 1999. A comparison of the
reproductive physiology of largemouth bass, Micropterus salmoides, collected from the Escambia and Blackwater Rivers in Florida. Environ Health Perspect 107(3):199-204.
Panter GH, Thompson RS, Sumpter JP. 1998. Adverse reproductive effects in male
fathead minnows exposed to environmentally relevant concentrations of the natural oestrogens, oestradiol, and oestrone. Aquatic Toxicol 42:243-253.
Raimondo S, McKenney CL, Jr. 2005. Projected population-level effects of thiobencarb
exposure on the mysid, Americamysis bahia, and extinction probability in a concentration-decay exposure system. Environ Toxicol Chem 24(3):564-572.

66
Rolland RM, Gilbertson M, Peterson RE, eds. 1997. Chemically Induced Alterations in Functional Develoment and Reproduction of Fishes. Racine:SETAC Press.
Segner H. 2005. Developmental, reproductive, and demographic alterations in aquatic
wildlife: Establishing causality between exposure to endocrine-active compounds (EACs) and Effects. Acta Hydrochimica Hydrobiologia 33(1):17-26.
Sepulveda M, Johnson W, Higman J, Denslow N, Schoeb T, Gross T. 2002. An
evaluation of biomarkers of reproductive function and potential contaminant effects in Florida largemouth bass (Micropterus salmoides floridanus) sampled from the St. Johns River. Sci Total Environ 289(1-3):133-144.
Sonderfan AJ, Arlotto MP, Parkinson A. 1989. Identification of the cytochrome P-450
isozymes responsible for testosterone oxidation in rat lung, kidney, and testis: evidence that cytochrome P-450a (P450IIA1) is the physiologically important testosterone 7 alpha-hydroxylase in rat testis. Endocrinology 125(2):857-866.
Spies RB, Thomas P. 1997. Reproductive and endocrine status of female kelp bass from a
contaminated site in the Southern California Bight and estrogen receptor binding of DDTs. In: Chemically Induced Alterations in Functional Development and Reproduction of Fishes (Rolland RM, Gilbertson M, Peterson RE, eds). Pensacola, FL:SETAC Press, 113-133.
Thibaut R, Porte C. 2004. Effects of endocrine disrupters on sex steroid synthesis and
metabolism pathways in fish. J Steroid Biochem Mol Biol 92(5):485-494. Thompson CJ, Ross SM, Gaido KW. 2004. Di(n-butyl) phthalate impairs cholesterol
transport and steroidogenesis in the fetal rat testis through a rapid and reversible mechanism. Endocrinol 145(3):1227-1237.
Valters K, Olsson A, Asplund L, Bergman A. 1999. Polychlorinated biphenyls and some
pesticides in perch (Perca fluviatilis) from inland waters of Latvia. Chemosphere 38(9):2053-2064.
Van der Kraak G, Chang JP, Janz DM. 1998. Reproduction. In: The Physiology of Fishes
(Evans DH, ed). Boca Raton, FL:CRC Press, LLC, 465-490. von Hofsten J, Olsson PE. 2005. Zebrafish sex determination and differentiation:
involvement of FTZ-F1 genes. Reprod Biol Endocrinol 3:63. Waxman DJ. 1988. Interactions of hepatic cytochromes P-450 with steroid hormones.
Regioselectivity and stereospecificity of steroid metabolism and hormonal regulation of rat P-450 enzyme expression. Biochem Pharmacol 37(1):71-84.

67
Wells K, Van Der Kraak G. 2000. Differential binding of endogenous steroids and chemicals to androgen receptors in rainbow trout and goldfish. Environ Toxicol Chem 19(8):2059-2065.
Wilson VS, Cardon MC, Thornton J, Korte JJ, Ankley GT, Welch J, et al. 2004. Cloning
and in vitro expression and characterization of the androgen receptor and isolation of estrogen receptor alpha from the fathead minnow (Pimephales promelas). Environ Sci Technol 38(23):6314-6321.
Young G, Kusakabe M, Nakamura I, Lokman PM, Goetz FW. 2005. Gonadal
Steroidogenesis in Teleost Fish. In: Hormones and Their Receptors in Fish Reproduction (Melamed P, Sherwood N, eds). Hackensack, NJ:World Scientific Publishing Co. Pte. Ltd., 155-223.

68
BIOGRAPHICAL SKETCH
Liza J. Ray was born to a farmer and swim instructor in Southern California where
she lived until attending the University of Michigan. While at Michigan, she studied and
loved the wetland environments of that region. After being cold for four years, she was
given the opportunity to enter graduate school in the Interdisciplinary Ecology program at
the University of Florida School of Natural Resources and Environment. She is finally
starting to overcome her fear of alligators (Alligator mississippiensis).