Embed Size (px)
Citation preview

| |
Company PresentationMay 2018

| |
Legal Disclaimer
May 2018 2Company Presentation
This presentation contains forward-looking statements within the meaning of the federal
securities laws. All statements other than statements of historical facts contained in this
presentation, including statements regarding our future results of operations and
financial position, business strategy and plans and objectives of management for future
operations, are forward-looking statements. In many cases, you can identify forward-
looking statements by terms such as “may,” “should,” “expects,” “plans,” “anticipates,”
“could,” “intends,” “target,” “projects,” “contemplates,” “believes,” “estimates,” “predicts,”
“potential” or “continue” or the negative of these terms or other similar words. Forward-
looking statements contained in this presentation include, but are not limited to,
statements about (i) growth of the wind energy market and our addressable market; (ii)
the potential impact of the increasing prevalence of auction-based tenders in the wind
energy market and increased competition from solar energy on our gross margins and
overall financial performance; (iii) our ability to successfully expand our transportation
business and execute upon our strategy of entering new markets outside of wind
energy; (iv) our future financial performance, including our net sales, cost of goods sold,
gross profit or gross margin, operating expenses, ability to generate positive cash flow,
and ability to achieve or maintain profitability; (v) the potential impact of GE’s acquisition
of LM Wind Power upon our business; (vi) the sufficiency of our cash and cash
equivalents to meet our liquidity needs; (vii) our ability to attract and retain customers for
our products, and to optimize product pricing; (viii) our ability to effectively manage our
growth strategy and future expenses, including startup and transition costs; (ix)
competition from other wind blade turbine manufacturers; (x) the discovery of defects in
our products; (xi) our ability to successfully expand in our existing wind energy markets
and into new international wind energy markets; (xii) worldwide economic conditions
and their impact on customer demand; (xiii) our ability to maintain, protect and enhance
our intellectual property; (xiv) our ability to comply with existing, modified or new laws
and regulations applying to our business, including the imposition of new taxes, duties
or similar assessments on our products; (xv) the attraction and retention of qualified
employees and key personnel; and (xvi) changes in domestic or international
government or regulatory policy, including without limitation, changes in trade policy.
These forward-looking statements are only predictions. These statements relate to
future events or our future financial performance and involve known and unknown risks,
uncertainties and other important factors that may cause our actual results, levels of
activity, performance or achievements to materially differ from any future results, levels
of activity, performance or achievements expressed or implied by these forward-looking
statements. Because forward-looking statements are inherently subject to risks and
uncertainties, some of which cannot be predicted or quantified, you should not rely on
these forward-looking statements as guarantees of future events. Further information on
the factors, risks and uncertainties that could affect our financial results and the forward-
looking statements in this presentation are included in our filings with the Securities and
Exchange Commission and will be included in subsequent periodic and current reports
we make with the Securities and Exchange Commission from time to time, including in
our Annual Report on Form 10-K for the year ended December 31, 2017.
The forward-looking statements in this presentation represent our views as of the date
of this presentation. We anticipate that subsequent events and developments will cause
our views to change. However, while we may elect to update these forward-looking
statements at some point in the future, we undertake no obligation to update any
forward-looking statement to reflect events or developments after the date on which the
statement is made or to reflect the occurrence of unanticipated events except to the
extent required by applicable law. You should, therefore, not rely on these forward-
looking statements as representing our views as of any date after the date of this
presentation. Our forward-looking statements do not reflect the potential impact of any
future acquisitions, mergers, dispositions, joint ventures, or investments we may make.
This presentation includes unaudited non-GAAP financial measures including total
billings, EBITDA, adjusted EBITDA, net cash (debt) and free cash flow. We define total
billings as the total amounts we have invoiced our customers for products and services
for which we are entitled to payment under the terms of our long-term supply
agreements or other contractual agreements. We define EBITDA as net income (loss)
attributable to the Company plus interest expense (including losses on the
extinguishment of debt and net of interest income), income taxes and depreciation and
amortization. We define Adjusted EBITDA as EBITDA plus any share-based
compensation expense, plus or minus any gains or losses from foreign currency
remeasurement. We define net cash (debt) as the total principal amount of debt
outstanding less unrestricted cash and cash equivalents. We define free cash flow as
net cash flow generated from operating activities less capital expenditures. We present
non-GAAP measures when we believe that the additional information is useful and
meaningful to investors. Non-GAAP financial measures do not have any standardized
meaning and are therefore unlikely to be comparable to similar measures presented by
other companies. The presentation of non-GAAP financial measures is not intended to
be a substitute for, and should not be considered in isolation from, the financial
measures reported in accordance with GAAP. See the appendix for the reconciliations
of certain non-GAAP financial measures to the comparable GAAP measures.
This presentation also contains estimates and other information concerning our industry
that are based on industry publications, surveys and forecasts. This information involves
a number of assumptions and limitations, and we have not independently verified the
accuracy or completeness of the information.

| |
Investment Thesis
May 2018 3Company Presentation
Capitalizing on Wind Market Growth, Blade Outsourcing and Improving Economics
Only Independent Blade Manufacturer with a Global Footprint
Advanced Composite Technology and Production Expertise Provide Barrier to Entry
Collaborative Dedicated Supplier Model to Share Gain and Drive Down LCOE
Long-Term Supply Agreements Provide Significant Revenue Visibility
Compelling Return on Invested Capital
Seasoned Management Team with Significant Global Growth Experience
• Renewables and wind energy are mainstream, large, growing, competitive and desired by customers.
• Emerging markets around the world are growing faster than mature markets.
• Blades are being outsourced to access emerging growth markets, drive cost and efficiently utilize capital.
• Same competitive dynamics in place today that put us in business.
• We’ve made good choices – customers, locations and markets.
• Our factories are low cost, world class hubs that serve large, diverse and growing addressable markets, reducing the effect of individual market fluctuations.
• TPI holds important IP that is difficult to replicate (materials, process, tooling, inspection and DFM)
• >300 engineers and growing, opening new Denmark office to attract even more talent
• 60-70 meter blades, larger than 787 wing span, with tolerances measured in millimeters
• Our business model helps TPI customers to gain market share in a cost effective and capital efficient manner by sharing the investment, spreading overhead, driving down material cost, improving productivity and sharing a large portion of that benefit with our customers.
• Current agreements provide up to $6.2B in potential revenue through 2023
• Volume based pricing and shared investment motivate both parties to keep plants full
• Shared gain/pain protects our margins
• Shared capital investment results in a “capital-light” model for TPI and our customers
• New investments target an initial average five-year ROIC hurdle rate of 25%
• Consolidated ROIC continuing to trend up from ~18% in 2014 to 31% in 2017
• TPI has become a destination for top talent. Pleased with the exceptional leaders and managers that have joined the TPI team

| |
Key Messages
• Applying our advanced composites technology to major growth trends including the decarbonization of
the electric sector and clean transportation systems
• BNEF estimates that $10 trillion will be invested in new power generation capacity through 2040 and of
this, 72% will be renewables and $3.3 trillion will be wind
• BNEF estimates that by 2040 annual global EV sales will reach 65 million units
• MarketsandMarkets projects the aerospace composites market to grow from $24.5 billion in 2016 to
$43 billion by 2022, or a CAGR of 9.85% between 2017 and 2022
• Wind industry and market dynamics are rationalizing. Large global players are competing
• TPI is a large global player with 13% global share, ~22% ex-China and ~43% ex-China outsourced and
a strong global reach
• TPI has executed really well delivering revenue growth, market share growth, cost reduction,
operational improvements and profit expansion
• After four years of 44% annual revenue growth, 2018 will be an investment year (10% - 12% growth),
positioning us for strong growth in 2019 and 2020
• Will continue to advance TPI technology, further expand global footprint, and drive world class cost to
differentiate and win
• Will utilize deep partnership business model to provide capacity flexibility and share gain to help our
customers increase market share while we maintain and grow our profit
• TPI strategy of strong and diversified growth will continue to build shareholder value
May 2018 4Company Presentation
| |
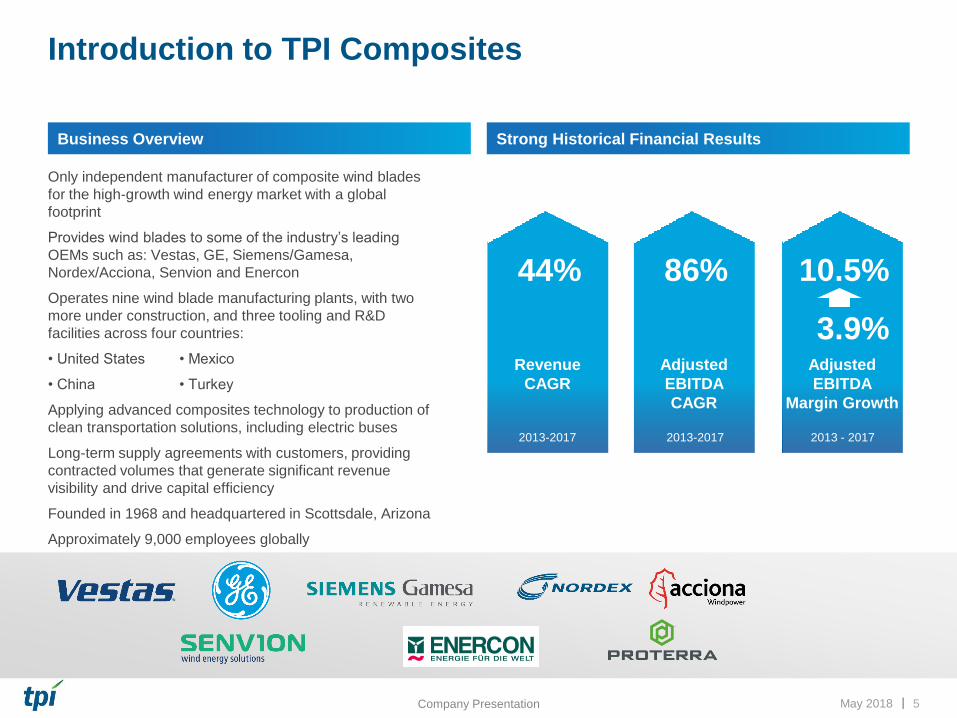
Introduction to TPI Composites
Only independent manufacturer of composite wind blades
for the high-growth wind energy market with a global
footprint
Provides wind blades to some of the industry’s leading
OEMs such as: Vestas, GE, Siemens/Gamesa,
Nordex/Acciona, Senvion and Enercon
Operates nine wind blade manufacturing plants, with two
more under construction, and three tooling and R&D
facilities across four countries:
• United States • Mexico
• China • Turkey
Applying advanced composites technology to production of
clean transportation solutions, including electric buses
Long-term supply agreements with customers, providing
contracted volumes that generate significant revenue
visibility and drive capital efficiency
Founded in 1968 and headquartered in Scottsdale, Arizona
Approximately 9,000 employees globally
May 2018 5Company Presentation
Business Overview Strong Historical Financial Results
Revenue
CAGR
44%
2013-2017
Adjusted
EBITDA
CAGR
86%
2013-2017
Adjusted
EBITDA
Margin Growth
10.5%
2013 - 2017
3.9%

| |
TPI’s customers account for 99.8% of the U.S. onshore wind market and 54% of the global onshore
market
Current Customer Mix – 50 Dedicated Lines
Strong Customer Base of Industry Leaders
May 2018 6Company Presentation
= TPI Customer
Global Onshore Wind Global Onshore Wind exc.
China
Rank OEM
2015–2017
Share(1) Rank OEM
2015–2017
Share(1)
1 Vestas 15% Vestas 25%
2 SGRE(2) 13% SGRE(2) 21%
3 Goldwind 12% GE Wind 19%
4 GE Wind 11% Enercon 10%
5 Enercon 6% Nordex Group 10%
6 Nordex Group 6% Senvion 5%
7 United Power 5% Suzlon 3%
8 Envision 5% INOX 2%
9 Mingyang 4% Goldwind <1%
Senvion 3% Regen Powertech <1%
TPI Customer
Market Share ~54%
TPI Customer
Market Share~90%
1
2
4
5
7
3
6
8
9
= Chinese Players
1
2
5
6
3
4
9
7
8
10
Source: MAKE
1. Figures are rounded to nearest whole percent
2. Figures for Siemens/Gamesa are pro forma for the Apri l 2017 merger of Gamesa Corporatión Tecnológica and Siemens W ind Power
36%
16%14%
26%
4%4%
Key Customers with Significant Market Share
10

| | May 2018 7Company Presentation
Existing Contracts Provide for ~$6.2 Billion in Revenue through
2023(1)
Minimum Volume
Visibility Mitigates
Downside Risk
Minimum Volume Obligations (MVOs) in place for
47 out of 50 dedicated lines requiring the customer
to take an agreed upon percentage of total
production capacity or pay TPI its equivalent gross
margin and operating costs associated with the
MVO
Incentivized
Maximum
Customer Volume
Pricing mechanisms encourage customers to
purchase 100% of the contract volume, as prices
progressively increase as volumes decrease
Customers fund the molds for each production line
incentivizing them to maximize TPI’s production
capability to amortize their fixed cost
Attractive
Contract
Negotiation
Dynamic
TPI typically renegotiates and extends contracts
more than a year in advance of expiration in
conjunction with blade model transitions
Termination provisions generally provide for
adequate time to replace a customer if a contract is
not extended
Demand in locations where TPI already has a
foothold (China, Turkey, Mexico) provides a
substantial opportunity for synergies in the
construction of new facilities
TPI continues to expand its manufacturing facilities
globally to meet increased demand
2017 2018 2019 2020 2021 2022 2023
Iowa
Turkey
Mexico
China
Note: Our contracts with some of our customers are subject to termination or reduction on short notice, generally with substantial penalties, and contain liquidated damages provisions, which may require us to make
unanticipated payments to our customers or our customers to make payments to us
(1) This chart depicts the term of the longest contract in each location
Long-term supply agreements provide for estimated
minimum aggregate volume commitments from our customers
of ~$4.3 billion and encourage our customers to purchase
additional volume up to, in the aggregate, an estimated total
contract value ~$6.2 billion through the end of 2023(1)
Key Contract Terms Long-term Supply Agreements (1)
Long-term contracts with minimum volume obligations provide strong revenue visibility

| |
Prioritized Pipeline
May 2018 8Company Presentation
Annual Revenue Potential – Wind Only > $1.9 Billion Pipeline Opportunities
Prioritized Pipeline represents those opportunities
we have prioritized to close in the next twenty-four
months
Prioritized Pipeline – 17 lines
• 60-70m+ blades, >$35M/yr/line
• New and Existing Customers
• New and Existing Geographies
• Onshore and Offshore
Long-term
Revenue
Potential
Size of Total
Addressable
Market
OEM(s)
Share
(1) Annual revenue potential based on 2018 wind blade revenue guidance plus impact of new contracts with Vestas and
Enercon announced in 2018
(2) Annual revenue potential based on $35 million per line per year and that all lines are in full production
$0.0
$0.2
$0.4
$0.6
$0.8
$1.0
$1.2
$1.4
$1.6
$1.8
$2.0
2018 2018-2019
$ B
illio
ns
LinesUnder
Contract48
PrioritizedPipeline
17
2020 (2)
Lines Under Contract50
Prioritized Pipeline
15
(1)
$1.40 - $1.45
$.525
| |
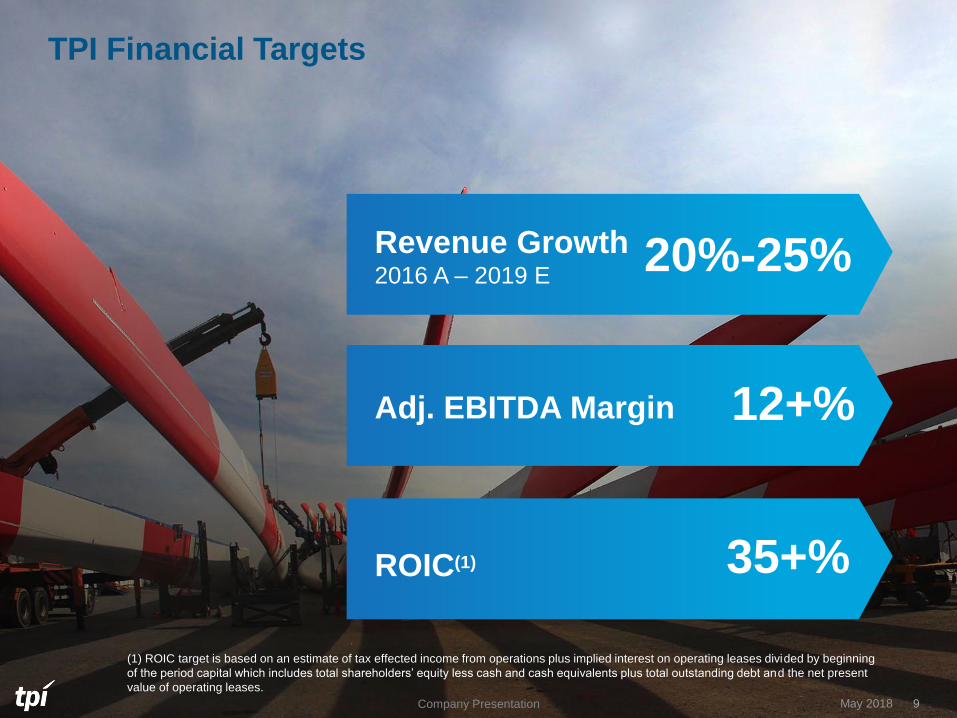
TPI Financial Targets
May 2018 9Company Presentation
20%-25%Revenue Growth2016 A – 2019 E
12+%Adj. EBITDA Margin
35+%ROIC(1)
.
(1) ROIC target is based on an estimate of tax effected income from operations plus implied interest on operating leases divided by beginning
of the period capital which includes total shareholders’ equity less cash and cash equivalents plus total outstanding debt and the net present
value of operating leases.

| | May 2018 10Company Presentation
Global Cumulative Installed Wind Capacity – 2000-2017 (GW)(1)
Rapid growth driven by:
Increasing cost
competitiveness through
technological advancement
Supportive global policy
initiatives
Global population growth
and electricity demand
Increasing C&I and utility
demand
Coal/nuclear
decommissioning
Repowering
EV trends
From 2008 to 2017, the cumulative global power generating capacity of wind turbine installations has gone up more than 4.5 times, with compound annual growth in cumulative global installed wind capacity of 24% since 2000
Wind Power Generation Has Grown Rapidly and
Expanded Globally in Recent Years
Source: Bloomberg New Energy Finance
(1) Regional onshore and worldwide offshore figures presented for 2017 only
EMEA onshore
Americas onshore
Asia and rest of the world
onshore
Offshore
166
122
232
18
15 22 29 36 44 5469
89116
155
191
232
279
312
361
423
477
538
2000 2001 2002 2003 2004 2005 2006 2007 2008 2009 2010 2011 2012 2013 2014 2015 2016 2017
Wind energy is a large and rapidly growing worldwide business

| |
Onshore Global Market Growth
May 2018 11Company Presentation
39.1 40.2 46.5 48.5
44.7 41.5 40.0 42.1 40.3 42.9 45.8
5.0 9.6
13.8 13.0
12.0 11.6 12.9
13.6 16.1 14.9 17.444.1 49.8
60.361.5 56.7
53.1 52.9 55.7 56.457.8
63.3
2017A 2018E 2019E 2020E 2021E 2022E 2023E 2024E 2025E 2026E 2027E
Developing wind markets
Mature wind markets
Annual installed global wind capacity (GW): 2017 – 2027E
Source: MAKE Q1 2018 Global W ind Power Market Outlook Update
Note: Developing wind markets defined as fewer than 6 GW of 2016 instal led capacity
13.3%CAGR
1.6%CAGR
Developing Markets Share
11.4% 19.2% 22.8% 21.1% 21.2% 21.9% 24.4% 24.4% 28.5% 25.8% 25.5%
Mature Markets Share88.6% 80.1% 77.2% 78.9% 78.8% 78.1% 75.6% 75.6% 71.5% 74.2% 74.5%
Annual installed wind capacity growth is propelled by an uptick in developing wind markets,
including Turkey and Mexico where TPI Composites is well positioned to succeed.
| |
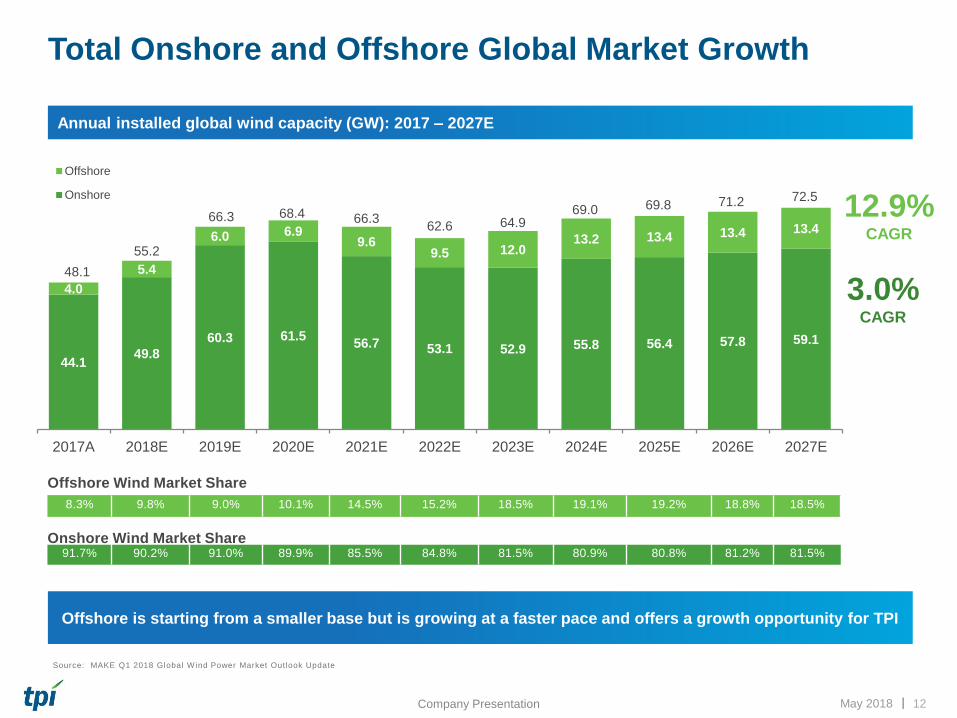
Total Onshore and Offshore Global Market Growth
May 2018 12Company Presentation
Annual installed global wind capacity (GW): 2017 – 2027E
Source: MAKE Q1 2018 Global W ind Power Market Outlook Update
Offshore is starting from a smaller base but is growing at a faster pace and offers a growth opportunity for TPI
17.2%CAGR
44.1 49.8
60.3 61.5 56.7 53.1 52.9 55.8 56.4 57.8 59.1
4.0
5.4
6.0 6.9 9.6
9.5 12.0 13.2 13.4 13.4 13.4
48.1
55.2
66.3 68.4 66.362.6 64.9
69.0 69.8 71.2 72.5
2017A 2018E 2019E 2020E 2021E 2022E 2023E 2024E 2025E 2026E 2027E
Offshore
Onshore
3.0%CAGR
Offshore Wind Market Share
8.3% 9.8% 9.0% 10.1% 14.5% 15.2% 18.5% 19.1% 19.2% 18.8% 18.5%
Onshore Wind Market Share91.7% 90.2% 91.0% 89.9% 85.5% 84.8% 81.5% 80.9% 80.8% 81.2% 81.5%
12.9%CAGR

| | May 2018
U.S. Forecast2017 – 2027
13Company Presentation
Source: Average of MAKE United States W ind Energy Market Outlook dated May 8, 2018 and BNEF Outlook for U.S. W ind Bui ld date d May 18, 2018
6.8
8.3
10.6
12.1
6.1
3.4 3.7 3.3 3.5 3.84.4
0.0
2.0
4.0
6.0
8.0
10.0
12.0
14.0
2017 2018 2019 2020 2021 2022 2023 2024 2025 2026 2027
GW
• Economics of Onshore Wind
• Corporate and Industrial Buyers
• Utilities
• Decarbonization
• Economics of Offshore Wind
• Repowering
• Vehicle Electrification
Demand Drivers

| |
Declining LCOEAllows Wind Energy to be More Competitive with Conventional Power
Generation
May 2018 14Company Presentation
Source: Lazard Level ized Cost of Energy Analysis (version 11.0).
(1) Costs are on an unsubsidized basis. Ranges reflect di fferences in resources, geography, fuel costs and cost of capital , among other factors.
(2) U.S. Department of Energy National Renewable Energy Laboratory (NREL)
$169
$148
$92 $95 $95
$81$77
$62 $60
$101 $99
$50 $48 $45$37 $32 $32 $30
$0
$63
$125
$188
$250
2009 2010 2011 2012 2013 2014 2015 2016 2017
Onshore wind
LCOE Mean
Onshore wind
LCOE Range
Global Onshore Wind LCOE Over Time(1)
— ($/MWh)
67%Eight year percentage
decrease
$0
$50
$100
$150
$200
$250
Onshorewind
Solar PVutility
CCGTgas
Bioenergy Geo-thermal
Coal Solarthermal
w/storage
Axis
Title
Fossil Fuels
Onshore Wind
Global LCOE for onshore wind generation has become increasingly competitive and is now on par with new combined cycle
gas turbines with an additional 50% decline expected by 2030(2)
Unsubsidized Global Levelized Cost of Power
Generation Ranges by Technology(1)
— ($/MWh)
Global LCOE for onshore wind generation has become increasingly competitive and is now on par with new
combined cycle gas turbines, unsubsidized, with an additional 50% decline expected by 2030(2)

| | May 2018 15Company Presentation
U.S.
Policy
Initiatives
Global Policy Support Coupled with Corporate Initiatives and
Repowering Expected to Drive Additional Growth
U.S. policy expected to support continued
domestic wind capacity installation
• Extension of the Wind Production Tax Credit
(PTC) through 2019 for both new turbines
and repowering of existing turbines along
with IRS clarifications that expand PTC
eligibility allowing developers 100% PTC
benefit as late as 2021
• Renewable Portfolio Standards
1
Increasing focus in board rooms regarding
the economic and social benefits of adopting
low-cost wind energy
• As of 2014 nearly 50% of Fortune 500
companies have set sustainability goals
• Furthermore, more than 130 leading
multinationals such as GM, Nike, Walmart,
IKEA, BMW, Coca Cola and Proctor &
Gamble have taken the RE100 pledge,
organized by the Climate Group, to transition
to 100% renewable energy
Corporate
and Utility
Procurement
2
International
Policy
Initiatives
Recent global initiatives aimed at
promoting the growth of renewable energy
including wind
• Large European Union members have
implemented renewable energy targets for
2020 of between 13% and 49% of all energy
use derived from renewable energy sources
• China is targeting 210 GW of grid-
connected wind capacity by 2020
3
COP21
Paris
Climate
Talks
Paris Agreement is a landmark deal marking
a significant commitment by the
international community to further reduce
fossil fuel consumption
• Effective in 2020, took effect on November 4,
2016, thirty days after the date on which at
least 55 parties accounting in total for at least
an estimated 55% of the total greenhouse gas
ratified the agreement
• 170 countries have ratified the agreement
4
Source: Bloomberg New Energy Finance, China National Development and Reform Commission, RE100
Longer term policy visibility and an increase in corporate and utility procurement is expected to drive additional
growth over the next decade

| | May 2018 16Company Presentation
The Industry is Shifting to a Predominantly Outsourced Wind Blade
Manufacturing Model
(1) Source: MAKE – based on % of MW
(2) TPI’s market share based on TPI MW relative to MAKE OEM total onshore MW for 2013, 2016 and 2017
38%51%
62%49%
0%
20%
40%
60%
80%
100%
2009 2017
Outsourced Insourced
Vertically integrated OEMs have begun to outsource wind blade
manufacturing due to:
• global talent constraints
• the need for efficient capital allocation
• the need to accelerate access to emerging markets
• the need for supply chain optimization
Some have sold or shuttered in-house tower and blade manufacturing
facilities in favor of an outsourced manufacturer
Geographically distributed, high precision blade manufacturing is more cost
effective when performed by diversified, specialized manufacturers
TPI is the only independent manufacturer of composite wind blades with a
global footprint and is well positioned to capitalize on global industry trends
Expected to continue to outsource a significant
percentage of blade needs notwithstanding
acquisition of LM Wind Power
TPI selected as manufacturer of Vestas-
designed blades in China, Mexico and Turkey
Currently outsources to TPI in two facilities in
Mexico and one in Turkey after expanding
operations in late 2016 and early 2017
3%
9%
13%
2013 2016 2017
TPI Share Increase:
~4X
Future market share increases
expected to be driven by:
Continuation of
outsourcing
LM Wind Power customer
attrition
Advantages from global
footprint
Several of the wind industry’s largest participants have chosen TPI as their leading outsourced blade manufacturer
Outsourcing Trends Global Wind Blade Manufacturing: Outsourced vs. Insourced (1)
TPI Global Wind Blade Market Share 2013 – 2017 (2)

| | May 2018 17Company Presentation
A typical wind turbine consists of many
components, the most important being the
wind blades, gear box, electric generator and
tower
When the wind blows, the combination of the
lift and drag of the air pressure on the wind
blades rotate the rotor, which drives the gear-
box and generator to create electricity
A Typical Wind Turbine
Blades and pitch systems remain the most
important elements in reducing LCOE driven
by ongoing improvements in aerodynamic
efficiency, load controls and cost reductions
29%
22%13%
10%
6%
4%3%
8%
Blades Tower
Gearbox Hub & Pitch
Converter Bearing & Shaft
Generator Bedplate
Balance of Nacelle
TPI is Well Positioned to Take Advantage of the Market Movement
Towards Larger Blades
The trend toward larger wind blades indicates
the potential phase out of smaller wind blades,
as larger blades have the greatest impact on
energy efficiency and LCOE reduction
Global Blade Length Breakdown
22%23%
29%23%
22%28%
13%20%
8%
2016A 2021E
<45.0m
45.0 – 49.9m
50.0 – 54.9m
55.0 – 59.9m
60.0 – 69.9m
>70.0m7%
Wind Turbine & Blade Overview Turbine Cost by Component Movement Towards Larger Blade Lengths
Turbine Cost Breakdown
by Component (1)
Source: MAKE, American Wind Energy Association
(1) Costs included in turbine cost breakdown represent 77% of total installed turbine costs. Remaining 23% not represented in chart
Wind blades represent ~22% of total installed
turbine costs
787 aircraft,
60m
On par with the movement toward larger wind
blades, TPI blades are generally 50-60m in
length
Blade length and air foil shape contribute to
efficiency in turning kinetic energy from the
rotor into electricity
1. Rotor Blade
2. Pitch drive
3. Nacelle
4. Brake
5. Low-speed shaft
6. Gear box
7. High-speed shaft
8. Generator
9. Heat exchanger
10. Controller
11. Anemometer
12. Wind vane
13. Yaw drive
14. Tower
5%
5%

| | May 2018 18Company Presentation
Strong Barriers to Entry Will Allow TPI to Capture
Additional Market ShareWind blades are a critical component of our customers’ strategy and, along with supply chain optimization, plays an integral role bringing
down LCOE
We believe that our extensive experience and track-record in delivering high quality wind blades combined with our established global scale
and strong customer relationships creates a significant barrier to entry and is the foundation of our leadership position
Strong track record of delivering
high quality wind blades to
diverse, global markets, and of
developing replicable and
scalable manufacturing facilities
and processes
Extensive Expertise Reputation for Reliability
Established Global Scale Customer Stickiness
Nearly 40,000 wind blades
produced since 2001, with an
excellent field performance
record in a market where
reliability is critical to our
customers’ success
We expand our manufacturing
footprint in coordination with our
customers’ needs, scaling our
capacity to meet demand in
markets across the globe
Dedicated capacity and
collaborative approach of
manufacturing wind blades to
meet customer specifications
promotes significant customer
loyalty and creates higher
switching costs
TPI’s ability to capitalize on recent growth trends in the wind energy market and outsourcing trends has allowed it to grow its
revenue by 333% from 2013 to 2017 while expanding its global manufacturing footprint over the same period

| | May 2018 19Company Presentation
Global Footprint Strategically Optimized for Regional Industry
Demand
Source: MAKE Q1 2018 Global Wind Power Market Outlook - Onshore
.
TPI has strategically built a strong global footprint that takes advantage of proximity to large existing regional
markets, adjacent new markets and seaports for global export
Headquarters: Scottsdale, AZ Wind Blade Manufacturing Facilities Tooling / Engineering / R&D Facilities
Europe, the Middle East and
Africa 2016 Capacity: 155 GW
Proj. Install ’18-’20 – 45 GW
CAGR: 4%
United States2017 Capacity: 81 GW
Proj. Install ’18-’20 – 32 GW
CAGR: 26%
Asia and rest of the world2016 Capacity: 182 GW
Proj. Install ’18-’20 – 80 GW
CAGR: 12%
Demonstrated ability of global
expansion
▪ TPI has developed a strong
process to enter new markets,
with an excellent track record
of ramping and operating new
facilities
▪ Significant “know how” in
creating replicable and
scalable manufacturing
processes for ramping
facilities globally
▪ Has successfully reduced
costs and operational risks
through the utilization of
existing teams that have
personally led similar startup
processes
TPI’s operational expertise
provides for a crucial competitive
advantage as it continues to
ramp new facilities in 2018 and
beyond
LATAM (ex-Brazil)2016 Capacity: 8 GW
Proj. Install ’18-’20 – 8 GW
CAGR: 43%
14 manufacturing facilities in 4 countries; over 4.9 million square feet of manufacturing facilities
Transportation Manufacturing Facility

| |
TPI Technology
Advanced Technology
Collaborative Space
May 2018 20Company Presentation
Customer Technology
Aero DesignDesign of external shape (airfoil)
Structural DesignDesign of internal
structure
Material TechnologyDevelop new materials to
reduce weight and cost
Prototype BuildManufacture of zero
series blades
Tooling DesignAdvanced tooling
design to manufacture
bladesProcess TechnologyDevelop manufacturing
process technology to
enable manufacture
Design for Manufacturing
Technical Due Diligence

| |
Customer Technology
Aero DesignDesign of external shape (airfoil)
TPI Technology
Tooling DesignAdvanced tooling
design to manufacture
blades
Prototype BuildManufacture of zero
series blades
Material TechnologyDevelop new materials to
reduce weight and cost
Advanced Technology
May 2018 21Company Presentation
Structural DesignDesign of internal
structure
Process TechnologyDevelop manufacturing
process technology to
enable manufacture
Enhanced TPI Customer
Collaboration
• Technology Partnership built on long-term
relationships and mutual dependency
• ‘True’ Partnerships with customers in
their New Product Development process
• Move upstream - Collaborative due
diligence on Design for Manufacturing and
Risk Mitigation
• Customer Intimacy - Joint prototyping of
blades with customers in customer facilities
Design for Manufacturing
Technical Due Diligence
Collaborative Space
Structural DesignDesign of internal
structure
Material TechnologyDevelop new materials to
reduce weight and cost
Process TechnologyDevelop manufacturing
process technology to
enable manufacture
Design for Manufacturing
Technical Due Diligence

| |
Expanding Technology Development Footprint
May 2018 22Company Presentation
Rhode Island, US
•Deep historical partnerships
with U.S. Gov’t agencies to
advance composite
manufacturing technologies
•Pilot projects to demonstrate
new technologies like
thermoplastics
Kolding, Denmark
•Establishing Advanced
Engineering Center to
enhance capabilities to
serve European customer
base
•Expand technical resource
base to enable growth
Izmir, Turkey
•Established AR-GE
program to leverage
Turkish Gov’t R&D
Funding
•R&D programs in tooling
and process engineering
Taicang, China
•Accredited materials lab
•Significant process and
tooling development
•Tooling transition process
expertise
Applied Development at all Manufacturing Sites Over 300 engineers globally. TPI is a destination for top talent.

| |
Industrialization
Approach• Standard Stage Gate Model
• Clearly defined metrics and deliverables
• Consistent processes based on lessons learned
• Core team with functional expertise
May 2018 23Company Presentation
Objective: Create replicable and scalable processes to launch new sites,
new blades and transition technology
Results IN DAYS
0
5
10
15
20
25
30
2015 2017
FlexibilityTooling Transition / Existing Facility
27
14
48%REDUCTION
0
50
100
150
200
250
2015 2017
SpeedRamp up / Existing Facility
210
95
55%REDUCTION
0
50
100
150
200
250
300
350
400
2015 2017
SpeedRamp up / New Facility
365
180
51%REDUCTION
Benefits • Consistency, repeatability and scalability
• Speed – time to market
• Flexibility in dynamic environment
• Reduction in start-up and transition costs

| | May 2018 24Company Presentation
Dedicated Supplier Model Encourages Stable Long-Term Customers
Build-to-spec blades
Dedicated TPI capacity provides
outsourced volume that customers can
depend upon
Joint investment in manufacturing with
tooling funded by customers
Long-term agreements with incentives for
maximum volumes
Strong visibility into next fiscal year
volumes
Shared pain/gain on increases and
decreases of material costs and some
production costs
Cooperative manufacturing and design
efforts optimize performance,
quality and cost
Global presence enables customers to
repeat models in new markets
Dedicated capacity
Industry leading field performance
High quality, low cost
Global operations
RENEWABLE ENERGY
Deeply Integrated Partnership Model High Customer Value Proposition Strong Customer Base of Leading OEMs

| |
Multiple development programs in:
• Passenger automotive
• EVs
• Commercial vehicles
Growing with Proterra
Diversification Strategy
May 2018 25Company Presentation
CLEAN TRANSPORTATION: In EVs, lighter weight equates to longer range or
fewer batteries which drives cost

| |
Diversification Strategy
May 2018 26Company Presentation
• Founded in 2004
• Offices and manufacturing in CA and SC
• 350+ employees, strong executive management team
• Backed by industry-leading VC and corporate investors
• >67 customers; >545 vehicles sold
• >150 vehicles delivered; >4,500,000 service miles
• >27,000,000 pounds of CO2 emissions avoided
• Demonstrated >1,100 miles on single charge
Proterra’s MissionAdvancing electric vehicle technology to deliver the world’s best-performing transit vehicles
Strong Executive Team
Solid Financial Backing
Source: Proterra Inc.

| |
Large Market Opportunity
• Addresses large opportunity given
mission-critical nature of transit
• Cusp of wide-spread adoption
• Technology applicable everywhere
• Compelling growth potential
May 2018 27Company Presentation
20 50150
270
525
1,000
1,600
2,140
2015 2016 2017 2018 2019 2020 2021 2022
0% 1% 3% 5% 8% 16% 24% 31%
% share of total transit
North American Electric Bus Market (Units)
Source: Frost & Sul l ivan, HD Transi t Bus Market – Global Analysis, March 2016
95%CAGR

| |
Diversification Strategy
$24.5B per year composites market growing to $43.0B
by 2022 – CAGR of 9.85%(1)
• Replacing aluminum and other more expensive composites (e.g.,
carbon) with TPI’s solutions
May 2018 28Company Presentation
AEROSPACE
(1) MarketsandMarkets – November 2017.

| |
Asia ~ 2,100
US ~ 1,400
Mexico ~ 3,400
EMEA~ 2,100
High Quality Management Team, Board and Workforce
May 2018 29Company Presentation
Steve Lockard
President & Chief
Executive Officer
Joined TPI in 1999. Prior to TPI, served as the Vice President of Satloc and was a founding officer of ADFlex solutions, a NASDAQ listed company
Current Board Member and Co-Chair of the Policy Committee for the American Wind Energy Association (AWEA)
30+ years of experience building high-growth, technology related manufacturing companies
Bill Siwek
Chief Financial
Officer
Joined TPI in 2013. Prior to TPI, was CFO for T.W. Lewis Company, EVP of Talisker Inc., President & CFO of Lyle Anderson Company and was a Partner at Arthur Andersen in both Audit and Business Consulting
Mark McFeely
Chief Operating
Officer
Joined TPI in 2015. Prior to TPI, was SVP and COO of Remy International, VP – Operations of Meggitt Safety Systems, Inc. and held various leadership positions with Danaher Corporation and Honeywell International, Inc.
Joe Kishkill
Chief Commercial
Officer
Joined TPI in 2017. Prior to TPI was President, International and Chief Commercial Officer of First Solar, Inc., President, Eastern Hemisphere and Latin America for Exterran Holdings
T.J. Castle
Senior Vice
President – N.A.
Wind and Global
OpEx
Joined TPI in 2015. Prior to TPI, held a number of positions with Honeywell including most recently VP of Integrated Supply Chain and prior to that was Global VP of the Honeywell Operating System for Aerospace
Ramesh
Gopalakrishnan
Senior Vice
President –
Technology &
Industrialization
Joined TPI in 2016. Prior to TPI, was EVP of Global Manufacturing for Senvion Wind Energy. Prior to that he was COO of Suzlon Energy Composites, Inc. and has also spent time at Haliburton Corp. and GE
Name Affiliation
Steve Lockard• President, Chief Executive Officer and Director
• Board Member of AWEA
Stephen Bransfield• Director
• Previously VP, General Electric
Michael L. DeRosa• Director
• MD, Element Partners
Jayshree Desai• Director
• Chief Operating Officer, Clean Line Energy Partners, LLC
Philip J. Deutch• Director
• MP, NGP Energy Technology Partners
Paul G.
Giovacchini
• Director and Chairman of the Board
• Independent consulting advisor to Landmark Partners
Jack A. Henry• Director
• MD, Sierra Blanca Ventures
James A. Hughes• Director
• Former CEO and board member of First Solar, Inc.
Daniel G. Weiss• Director
• MP, Angeleno Group
~9,000
employees
worldwide
Management Team Board of Directors
Employees at a Glance

| |
Company Timeline
| Company Presentation May 2018 30

| |
FINANCIAL SUMMARY

| |
Financial Results
May 2018 32Company Presentation
$14
$39
$66
$100
($0)
$20
$40
$60
$80
$100
$120
2014 2015 2016 2017
$321
$586
$755
$955
$363
$600
$764
$942
$0
$200
$400
$600
$800
$1,000
$1,200
2014 2015 2016 2017
Sales Billings
1. Total bi l l ings refers to the total amounts we have invoiced our customers for products and services for which we are enti t led to payment under the terms of our long-term
supply agreements or other contractual agreements
2. See appendix for reconci l iations of non-GAAP financial data
3. 2017 as restated per the Company’s retroactive adoption of ASC 606 and is unaudited.
GAAP Net Sales and Total Billings ($ in millions) (1) (2) (3) Adjusted EBITDA ($ in millions) (2) (3)
44%’13–’17 CAGR
86%’13–’17 CAGR
4.2% 6.7% 8.8% 10.5%Margin

| |
Q1 2018 Highlights
May 2018 33
Q1 2018 Highlights and Recent Company News
• Operating results and year-over-year increases compared to
2017
• Net sales were up 21.7% to $254.0 million for the
quarter
• Net income for the quarter improved to $8.6 million
compared to $5.2 million in 2017
• Adjusted EBITDA for the quarter increased by 55.6% to
$27.4 million
• Adjusted EBITDA margin for the quarter was up 240 bps
to 10.8%
• Signed a new multiyear supply agreement with Vestas for
four lines in a new plant in Yangzhou, China; added a third
line to our existing supply agreement in Turkey
• Vestas exercised an option under an existing, multiyear
supply agreement for two additional blade manufacturing
lines at Company’s new manufacturing facility in
Matamoros, Mexico
• Signed a multiyear supply agreement with Enercon for two
lines from our manufacturing hub in Izmir, Turkey
• Entered into an agreement with Navistar to design and
develop a Class 8 truck comprised of a composite tractor
and frame rails
$209
$254
$18$27
$0
$200
$400
Q1 '17 Q1 '18 Q1 '17 Q1 '18
Sets
invoiced636 569
Est. MW 1,460 1,464
Dedicated
lines(1) 44 46
Lines
installed(2) 39 38
(1) Number of wind blade manufacturing lines dedicated to our customers under long-term supply
agreements. Includes 7 lines under supply agreements for Q1 2017 that ended on December 31,
2017.
(2) Number of wind blade manufacturing lines installed that are either in operation, startup or
transition
21.7%
55.6%
Net Sales and Adjusted EBITDA ($ in millions)
Company Presentation

| |
Q1 and Full Year 2017 Financial Highlights(unaudited)
May 2018 34Company Presentation
(1) See pages 54 – 56 for reconciliations of non-GAAP financial data
(2) Based on net income attributable to common stockholders
(3) 2017 as restated per the Company’s retroactive adoption of ASC 606 and is unaudited.
($ in millions, except per share data and KPIs) Q1 ’18 Q1 ’17 ∆Full Year
’17 (3)
Full Year
’16∆
Select Financial Data
Net Sales $ 254.0 $ 208.6 21.7% $ 955.2 $ 754.9 23.2%
Total Billings (1) $ 223.7 $ 211.4 5.8% $ 941.6 $ 764.4 23.2%
Net Income $ 8.6 $ 5.2 65.9% $ 39.5 $ 13.8 215.6%
Diluted Earnings Per Share $ 0.24 $ 0.15 $ 0.09 $ 1.13 $ 0.48 $ 0.65
Adjusted EBITDA (1) $ 27.4 $ 17.6 55.6% $ 100.1 $ 66.2 53.5%
Adjusted EBITDA Margin 10.8% 8.4% 240 bps 10.5% 8.8% 170 bps
Net Cash (Debt) (1) $ 11.1 $ (7.1) $ 18.2 $ 24.6 $ (6.4) $ 30.9
Free Cash Flow (1) $ (14.7) $ (7.0) $ (7.8) $ 37.8 $ 23.3 $ 14.5
Capital Expenditures $ 11.7 $ 16.9 $ (5.2) $ 44.8 $ 30.5 $ 14.3
Key Performance Indicators (KPIs)
Sets Invoiced 569 636 (67) 2,736 2,154 582
Estimated Megawatts 1,464 1,460 4 6,602 4,920 1,682
Dedicated Wind Blade Manufacturing Lines 46 44 2 lines 48 44 4 lines
Wind Blade Manufacturing Lines Installed 38 39 1 line 41 33 8 lines
Wind Blade Manufacturing Lines in Startup 10 9 1 line 9 3 6 lines
Wind Blade Manufacturing Lines in Transition 4 — 4 lines — 3 3 lines

| |
Income Statement Summary (1)
(unaudited)
May 2018 35Company Presentation
(1) 2017 as restated per the Company’s retroactive adoption of ASC 606 and is unaudited.
(2) See pages 54 – 56 for reconciliations of Non-GAAP financial data
2018 2017 $ % 2017 2016 $ %
($ in thousands, except per share amounts)
Net sales 253,981$ 208,615$ 45,366$ 21.7% 955,199$ 754,877$ 200,322$ 26.5%
Cost of sales 210,988$ 182,538$ 28,450$ 15.6% 804,099$ 659,745$ 144,354$ 21.9%
Startup and transition costs 14,735$ 6,159$ 8,576$ 139.2% 40,628$ 18,127$ 22,501$ 124.1%
Total cost of goods sold 225,723$ 188,697$ 37,026$ 19.6% 844,727$ 677,872$ 166,855$ 24.6%
Cost of goods sold % 88.9% 90.5% -160 bps 88.4% 89.8% -140 bps
Gross profit 28,258$ 19,918$ 8,340$ 41.9% 110,472$ 77,005$ 33,467$ 43.5%
Gross profit % 11.1% 9.5% 160 bps 11.6% 10.2% 140 bps
General and administrative expenses 11,163$ 8,306$ 2,857$ 34.4% 40,373$ 33,892$ 6,481$ 19.1%
General and administrative expenses % 4.4% 4.0% 40 bps 4.2% 4.5% -30 bps
Income from operations 17,095$ 11,612$ 5,483$ 47.2% 70,099$ 43,113$ 26,986$ 62.6%
Income before income taxes 10,605$ 7,544$ 3,061$ 40.6% 15,019$ 20,837$ (5,818)$ -27.9%
Net income 8,648$ 5,213$ 3,435$ 65.9% 39,514$ 13,842$ 25,672$ 185.5%
Weighted-average common shares outstanding:
Basic 34,049 33,737 33,844 17,530
Diluted 35,479 33,827 34,862 17,616
Net income per common share:
Basic 0.25$ 0.15$ 0.10$ 1.17$ 0.48$ 0.69$
Diluted 0.24$ 0.15$ 0.09$ 1.13$ 0.48$ 0.65$
Non-GAAP Metrics
Total billings (2)223,701$ 211,360$ 12,341$ 5.8% 941,565$ 764,424$ 177,141$ 23.2%
EBITDA (2)20,974$ 14,502$ 6,472$ 44.6% 88,516$ 55,491$ 33,025$ 59.5%
EBITDA margin 8.3% 7.0% 130 bps 9.3% 7.4% 190 bps
Adjusted EBITDA (2)27,373$ 17,590$ 9,783$ 55.6% 100,111$ 66,150$ 33,961$ 51.3%
Adjusted EBITDA margin 10.8% 8.4% 240 bps 10.5% 8.8% 170 bps
Three Months Ended
March 31, Change
Year Ended
December 31, Change

| |
Key Balance Sheet and Cash Flow Data (1)
(unaudited)
May 2018 36Company Presentation
See page 56 for a reconciliation of net debt and free cash flow
(1) 2017 as restated per the Company’s retroactive adoption of ASC 606 and is unaudited.
March 31, December 31,
($ in thousands) 2018 2017
Balance Sheet Data:
Cash and cash equivalents 138,841$ 148,113$
Restricted cash 3,251$ 3,849$
Accounts receivable 117,950$ 121,576$
Contract assets 130,015$ 105,619$
Total debt-current and noncurrent, net 125,743$ 121,385$
Net cash (1)
11,108$ 24,557$
($ in thousands) 2018 2017 2017 2016
Cash Flow Data:
Net cash provided by (used in) operating activities (3,032)$ 9,938$ 74,600$ 53,841$
Capital expenditures 11,714$ 16,922$ 44,828$ 30,507$
Free cash flow (1)
(14,746)$ (6,984)$ 29,772$ 23,334$
Three Months Ended
March 31,
Year Ended
December 31,

| |
GUIDANCE FOR 2018
AND TARGETS FOR 2019

| |
Key Drivers for 2018 and 2019 Performance
• Cash flow from operations will continue to largely
fund our growth
• Significant investment in 2018 will drive value
creation and growth in 2019 and beyond
• Operational improvements will continue to drive
profitability – Lean mindset globally
• Continued conversion of pipeline opportunities
• Improved speed and efficiency of startups and
transitions
• Significant number of transitions and startups in
2018 (~14 transitions and ~12 startups) - short-
term impact that drives long-term growth – longer
blades equate to higher ASP and operational
improvements drive throughput so revenue per
line per year increases significantly
• Additional potential from diversified markets not
reflected
• Startups in 2018 and 2019 – include new plants
(Mexico 4 and potential new plant openings), new
& existing customers and offshore opportunities
• Loss of revenue from GE lines not renewed will
not be fully replaced until 2019
• Margin pressure in the industry driven by auction-
based systems in many parts of the world, U.S.
market demand shifts driven by the current PTC
cycle and increased competition from solar will
put pressure on our pricing for new deals and
may require us to share more gain from cost outs
and productivity improvements
• Market uncertainty for some OEMs resulting in
longer decision cycles
• Uncertainty around U.S. demand due to tax
reform during Q4 has been resolved. Tax reform
is very beneficial for TPI given our structure.
May 2018 38Company Presentation

| | May 2018 39Company Presentation
Note: All reference to lines is to wind blade manufacturing lines.
(1) We have not reconciled our total expected billings for 2018 to expected net sales under GAAP because we have not yet finalized calculations necessary to provide the
reconciliation and as such the reconciliation is not possible without unreasonable efforts.
Key Guidance Metrics

| | May 2018 40Company Presentation
Note: References to “lines” relate to wind blade manufacturing lines
Sets and Startup & Transition Costs Guidance Metrics

| |
Total Billings(1) (2)
Strong Financial Performance and Outlook
May 2018 41Company Presentation
22%Three-year
CAGR
$363
$600
$764
$942
$1,025
$1,400
$0
$200
$400
$600
$800
$1,000
$1,200
$1,400
$1,600
2014A 2015A 2016A 2017A 2018E 2019E
Adjusted EBITDA(1) (2) (3)
$14
$39
$66
$100
$78
$145
$0
$20
$40
$60
$80
$100
$120
$140
$160
2014A 2015A 2016A 2017A 2018E 2019E
Note: Dollars in millions
(1) Estimates for 2018 – 2019 are shown at the midpoint of ranges provided. See appendix for reconciliation of non-GAAP financial data.
(2) We have not reconciled our total expected billings for 2018 - 2019 to expected net sales under GAAP or 2019 expected Adjusted EBITDA to expected Net Income because we have not yet
finalized calculations necessary to provide the reconciliation, including expected changes in deferred revenue, and as such the reconciliations are not possible without unreasonable efforts.
(3) 2017 as restated per the Company’s retroactive adoption of ASC 606 and is unaudited.
30%Three-year
CAGR
Margin % 4.2% 6.7% 8.8% 10.5% 7.5% 10.4%

| |
Total Billings Bridge
May 2018 42Company Presentation
Note: Dol lars in mi l l ions.
$1,025
$1,400
$86
$10
$942
$153
$16
$369
$16
$500
$600
$700
$800
$900
$1,000
$1,100
$1,200
$1,300
$1,400
$1,500
2017 Billings Net Volume Net ASP Impact Other 2018 Billings Net Volume Net ASP Impact Other 2019 Billings

| |
Adjusted EBITDA Bridge
May 2018 43Company Presentation
.
Note: Dol lars in mi l l ions. 2017 as restated per the Company’s retroactive adoption of ASC 606 and is unaudited.
$77.0
$20.0
$30.0
$100.1
0.0
20.0
40.0
60.0
80.0
100.0
120.0
140.0
160.0
180.0
2017 Increase inS&T Costs
GE VolumeReductions
Growth andOperational
Improvement
2018 Change in S&TCosts
Growth andOperational
Improvement
Other 2019
$M
illio
ns
$27.0
$52.0
$7.0
$145.0$27.0
~ 10.5%
~ 7.5%
~ 10.4%

| |
Pro Forma Adjusted EBITDA Walk
May 2018 44Company Presentation
2017 (3) 2018E 2019E
Adjusted EBITDA (1) $ 100.1M $ 77.0M $145.0M
Add: Startup and Transition costs $ 40.0M $ 60.0M $33.0M
Pro forma Adjusted EBITDA $ 140.1M $ 137.0M $178.0M
Impact of GE non-renewal ($30.0M) - -
Pro forma Adjusted EBITDA $ 110.1M $ 137.0M $178.0M
Pro forma Adjusted EBITDA Margin 11.5%(2) 13.4%(1) 12.7%(1)
(1) Based on mid-point of guidance and target
(2) Based on mid-point of total bi l l ings guidance reduced by GE revenue in Turkey and China
(3) 2017 as restated per the Company’s retroactive adoption of ASC 606 and is unaudited

| |
Margin Evolution
2014 2015 2016 2017 2018E 2019E
Gross Margin (GM) % 4.6% 7.1% 10.2% 12.1% 8.3% 12.0%
GM% before S&T 9.7% 9.8% 12.6% 16.5% 14.1% 14.6%
GM% before S&T at CC 8.0% 9.1% 10.5% 15.1% 14.1% 14.6%
May 2018 45Company Presentation

| |
Free Cash Flow and Capital Expenditures
May 2018 46Company Presentation
.
Note: Dol lars in mi l l ions.
(1) Free Cash Flow defined as operating cash flow less capital expenditures.
Free Cash Flow (1) Capital Expenditures
($52)
$5
$23
$30
($15)
$60
($60)
($40)
($20)
$0
$20
$40
$60
$80
2014A 2015A 2016A 2017A 2018E 2019E
$1
$8 $11 $11$15
$3
$24
$22
$33
$74
$40
$19 $26
$31
$44
$55
$0
$10
$20
$30
$40
$50
$60
$70
2014A 2015A 2016A 2017A 2018E 2019E
Maintenance Growth
$85
| |
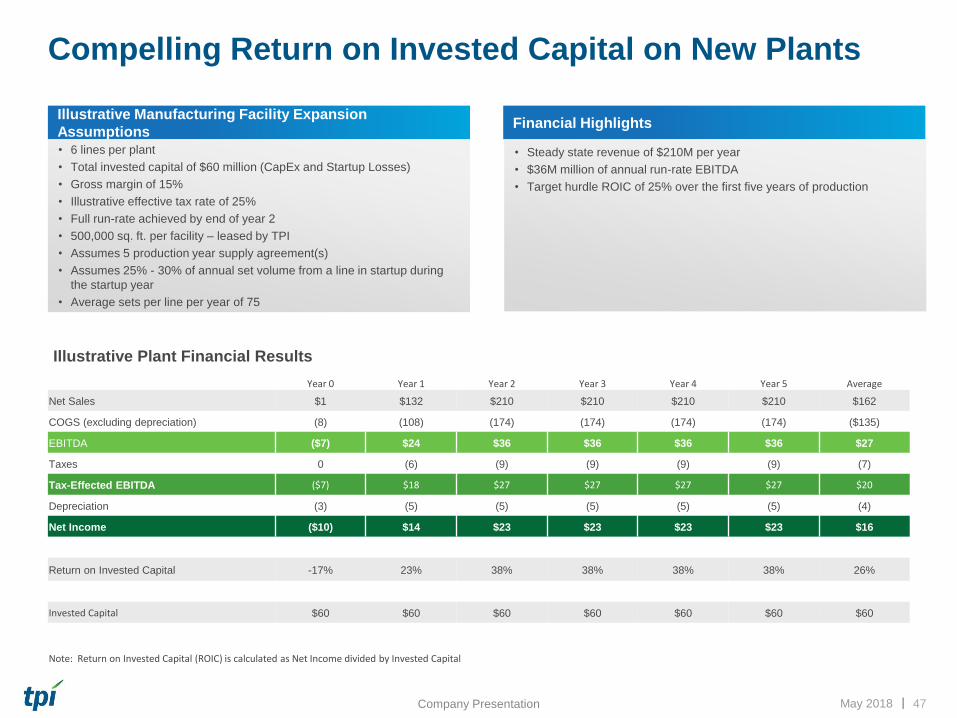
Illustrative Manufacturing Facility Expansion
Assumptions
Compelling Return on Invested Capital on New Plants
May 2018 47Company Presentation
Illustrative Plant Financial Results
Year 0 Year 1 Year 2 Year 3 Year 4 Year 5 Average
Net Sales $1 $132 $210 $210 $210 $210 $162
COGS (excluding depreciation) (8) (108) (174) (174) (174) (174) ($135)
EBITDA ($7) $24 $36 $36 $36 $36 $27
Taxes 0 (6) (9) (9) (9) (9) (7)
Tax-Effected EBITDA ($7) $18 $27 $27 $27 $27 $20
Depreciation (3) (5) (5) (5) (5) (5) (4)
Net Income ($10) $14 $23 $23 $23 $23 $16
Return on Invested Capital -17% 23% 38% 38% 38% 38% 26%
Invested Capital $60 $60 $60 $60 $60 $60 $60
Note: Return on Invested Capital (ROIC) is calculated as Net Income divided by Invested Capital
Financial Highlights
• 6 lines per plant
• Total invested capital of $60 million (CapEx and Startup Losses)
• Gross margin of 15%
• Illustrative effective tax rate of 25%
• Full run-rate achieved by end of year 2
• 500,000 sq. ft. per facility – leased by TPI
• Assumes 5 production year supply agreement(s)
• Assumes 25% - 30% of annual set volume from a line in startup during
the startup year
• Average sets per line per year of 75
• Steady state revenue of $210M per year
• $36M million of annual run-rate EBITDA
• Target hurdle ROIC of 25% over the first five years of production

| |
APPENDIX

| |
Balance Sheets
May 2018 49Company Presentation
December 31 March 31
($ in thousands) 2015 2016 2017 2018
Assets
Current assets:
Cash and cash equivalents $45,917 $119,066 $148,113 $138,841
Restricted cash 1,760 2,259 3,849 3,251
Accounts receivable 72,913 67,842 121,576 117,950
Inventories 50,841 53,095 4,112 4,205
Contract assets – – 105,619 130,015
Inventories held for customer orders 49,594 52,308 – –
Prepaid expenses and other current assets 31,337 30,657 27,507 35,718
Total current assets 252,362 325,227 410,776 429,980
Noncurrent assets:
Property, plant, and equipment, net 67,732 91,166 123,480 126,860
Goodwill and other intangible assets, net 3,226 3,072 3,915 5,175
Other noncurrent assets 6,600 17,741 18,391 17,849
Total assets $329,920 $437,206 $556,562 $579,864
Liabilities and Stockholders' Equity
Current liabilities:
Accounts payable and accrued expenses $101,108 $112,281 $166,743 $168,405
Accrued warranty 13,596 19,912 30,419 32,670
Current maturities of long-term debt 52,065 33,403 35,506 43,085
Deferred revenue 65,520 69,568 – –
Contract liabilities – – 2,763 4,449
Customer deposits and customer advances 8,905 1,390 432 774
Total current liabilities 241,194 236,554 235,863 249,383
Noncurrent liabilities:
Long-term debt 77,281 89,752 85,879 82,658
Other noncurrent liabilities 3,812 4,393 4,938 4,791
Total liabilities 322,287 330,699 326,680 336,832
Convertible and senior redeemable preferred shares and warrants
198,830 – – –
Total stockholders' equity (deficit) (191,197) 106,507 229,882 243,032
Total liabilities and stockholders' equity (deficit) $329,920 $437,206 $556,562 $579,864
Non-GAAP Metric:
Net cash (debt) $(90,667) $(6,379) $24,557 $11,108
Source: Year end 2015 through 2016 audited financial statements. 2017 as restated per the Company’s retroactive adoption of A SC 606 and is unaudited. 2018 interim financial
statements are unaudited.

| |
Income Statements
May 2018 50Company Presentation
Year Ended December 31 Three Months Ended March 31
($ in thousands) 2015 2016 2017 2018 2017
Net sales $585,852 754,877 $955,199 $253,981 $208,615
Cost of sales 528,247 659,745 804,099 210,988 182,538
Startup and transition costs 15,860 18,127 40,628 14,735 6,159
Total cost of goods sold 544,107 677,872 844,727 225,723 188,697
Gross profit 41,745 77,005 110,472 28,258 19,918
General and administrative expenses 14,126 33,892 40,373 11,163 8,306
Income from operations 27,619 43,113 70,099 17,095 11,612
Other income (expense):
Interest income 161 344 95 41 19
Interest expense (14,565) (17,614) (12,381) (3,338) (3,026)
Loss on extinguishment of debt – (4,487) – – –
Realized loss on foreign currency remeasurement (1,802) (757) (4,471) (4,011) (1,381)
Miscellaneous income 246 238 1,191 818 320
Total other expense (15,960) (22,276) (15,566) (6,490) (4,068)
Income before income taxes 11,659 20,837 54,533 10,605 7,544
Income tax provision (3,977) (6,995) (15,019) (1,957) (2,331)
Net income 7,682 13,842 39,514 8,648 5,213
Net income attributable to preferred stockholders 9,423 5,471 – – –
Net income (loss) attributable to common stockholders ($1,741) $8,371 $39,514 $8,648 $5,213
Non-GAAP Metrics:
Total billings $600,107 $764,424 $941,565 $223,701 $211,360
Adjusted EBITDA $39,281 $66,150 $100,111 $27,373 $17,590
Source: Year end 2015 through 2016 audited financial statements. 2017 as restated per the Company’s retroactive adoption of A SC 606 and is unaudited. 2018 interim financial
statements are unaudited.

| |
Cash Flow Statements
May 2018 51Company Presentation
Year Ended December 31Three Months Ended
March 31
($ in thousands) 2015 2016 2017 2018 2017
Cash flows from operating activities
Net income $7,682 $13,842 $39,514 $8,648 5,213
Depreciation and amortization 11,416 12,897 21,697 7,072 3,952
Share-based compensation expense – 9,902 7,124 2,388 1,707
Amortization of debt issuance costs and debt discount 4,319 4,681 573 181 143
Loss on extinguishment of debt – 4,487 – – –
Loss on disposal of property and equipment 187 2 334 – –
Deferred income taxes (765) (2,782) (1,068) – –
Changes in assets and liabilities 8,454 10,812 6,426 (21,321) (1,077)
Net cash provided by (used in) operating activities 31,293 53,841 74,600 (3,032) 9,938
Cash flows from investing activities
Purchases of property, plant and equipment (26,361) (30,507) (44,828) (11,714) (16,922)
Proceeds from sale of assets 146 – 850 – –
Net cash used in investing activities (26,215) (30,507) (43,978) (11,714) (16,922)
Cash flows from financing activities
Proceeds from issuance of common stock – 67,199 – – –
Net proceeds from (repayments of) debt 1,554 (15,370) (8,095) 4,177 (2,809)
Debt issuance costs (1,113) – (454) – –
Payment on acquisition of noncontrolling interest (1,875) – – – –
Proceeds from exercise of stock options – – 1,430 585 –
Repurchase of common stock including shares withheld in lieu of income taxes
– – (1,264) (272) –
Restricted cash (989) (499) – – –
Net cash provided by (used in) financing activities (2,423) 51,330 (8,383) 4,490 (2,809)
Impact of foreign exchange rates on cash and cash equivalents (330) (1,515) 335 386 (63)
Net change in cash and cash equivalents 2,325 73,149 22,574 (9,870) (9,856)
Cash and cash equivalents, beginning of year 43,592 45,917 129,863 152,437 129,863
Cash and cash equivalents, end of year $45,917 $119,066 $152437 $142,567 $120,007
Non-GAAP Metric:
Free cash flow $4,932 $23,334 $37,835 $(14,746) $(6,984)
Source: Year end 2015 through 2016 audited financial statements. 2017 as restated per the Company’s retroactive adoption of A SC 606 and is unaudited. 2018 interim financial
statements are unaudited.

| |
Non-GAAP Reconciliations
Net sales is reconciled to total billings as follows:
May 2018 52Company Presentation
Year Ended December 31 Three Months Ended March 31
($ in thousands) 2015 2016 2017 2018 2017
Net sales $585,852 $754,877 $955,199 $253,981 $208,615
Blade-related deferred revenue at beginning of year(1) (59,476) (65,520) (6,499) – –
Blade-related deferred revenue at end of year(1) 65,520 69,568 – – –
Change in contract assets – – – (24,396) (2,738)
Foreign exchange impact (2) 8,211 5,499 (7,135) (5,884) 5,483
Total billings $600,107 $764,424 $941,565 $223,701 $211,360
Year Ended December 31 Three Months Ended March 31
($ in thousands) 2015 2016 2017 2018 2017
Net income $7,682 $13,842 $39,514 $8,648 $5,213
Adjustments:
Depreciation and amortization 11,416 12,897 21,697 7,072 3,951
Interest expense (net of interest income) 14,404 17,270 12,286 3,297 3,007
Income tax provision 3,977 6,995 15,019 1,957 2,331
Realized loss on foreign currency remeasurement 1,802 757 4,471 4,011 1,381
Share-based compensation expense – 9,902 7,124 2,388 1,707
Loss on extinguishment of debt – 4,487 – – –
Adjusted EBITDA $39,281 $66,150 $100,111 $27,373 $17,590
Source: Year end 2015 through 2016 audited financial statements. 2017 as restated per the Company’s retroactive adoption of A SC 606 and is unaudited. 2018 interim financial
statements are unaudited.
Note: Footnote references are on the fol lowing page.
Net income is reconciled to adjusted EBITDA as follows:

| |
Non-GAAP Reconciliations (Continued)
May 2018 53Company Presentation
1. Total billings is reconciled using the blade-related deferred revenue amounts at the beginning and the end of the year as follows:
Year Ended December 31
($ in thousands) 2015 2016 2017
Blade-related deferred revenue at beginning of year $59,476 $65,520 $69,568
Non-blade related deferred revenue at beginning of year – – –
Total current and noncurrent deferred revenue at beginning of year $59,476 $65,520 $69,568
Blade-related deferred revenue at end of year $65,520 $69,568 $81,048
Non-blade related deferred revenue at end of year – – –
Total current and noncurrent deferred revenue at end of year $65,520 $69,568 $81,048
Source: Year end 2015 through 2017 audited financial statements and interim March 2018 and 2017 unaudited financial statement s.
2. Represents the effect of the difference between the exchange rate used by our various foreign subsidiaries on the invoice dat e
versus the exchange rate used at the period-end balance sheet date.
December 31 March 31
($ in thousands) 2015 2016 2017 2018 2017
Cash and cash equivalents $45,917 $119,066 $148,113 $138,841 $115,541
Less total debt, net of debt issuance costs &
discount
(129,346) (123,155) (121,385) (125,743) (120,489)
Less debt issuance costs & discount (7,238) (2,290) (2,171) (1,990) (2,147)
Net cash (debt) $(90,667) $(6,379) $24,557 $11,108 $(7,095)
Net cash (debt) is reconciled as follows:

| |
Non-GAAP Reconciliations(Continued)
May 2018 54Company Presentation
Year Ended December 31Three Months Ended
March 31
($ in thousands) 2015 2016 2017 2018 2017
Net cash provided by operating activities $31,293 $53,841 $74,600 $(3,032) $9,938
Less capital expenditures (26,361) (30,507) (44,828) (11,714) (16,922)
Free cash flow $4,932 $23,334 $29,772 $(14,746) $(6,984)
(1) Source: Year end 2015 through 2016 audited financial statements. 2017 as restated per the Company’s retroactive adopti on of ASC 606 and is unaudited and interim
March 2018 and 2017 unaudited financial statements.
(2) Figures presented are projected estimates for the ful l year ending December 31, 2018.
Free cash flow is reconciled as follows(1):
A reconciliation of projected adjusted EBITDA to the projected low end and high end ranges
of projected net income is as follows(2):
2018 Adjusted EBITDA
Guidance Range
($ in thousands) Low End High End
Projected net income $7,900 $10,890
Adjustments:
Projected depreciation and amortization 32,500 32,500
Projected interest expense (net of interest income) 12,000 12,000
Projected loss on extinguishment of debt 2,800 2,850
Projected income tax provision 5,300 7,260
Projected share-based compensation expense 10,500 10,500
Projected realized loss on foreign currency remeasurement 4,000 4,000
Projected Adjusted EBITDA $75,000 $80,000