Embed Size (px)
Citation preview

0
Investor Presentation June 2017
1
1
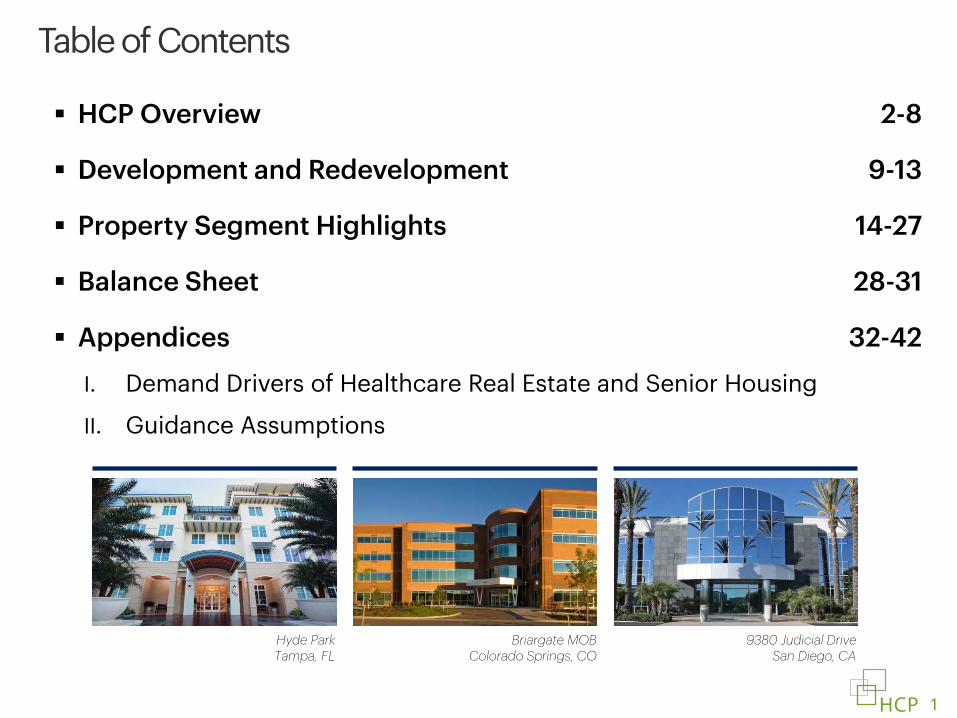
Table of Contents
HCP Overview
Development and Redevelopment
Property Segment Highlights
Balance Sheet
Appendices
I. Demand Drivers of Healthcare Real Estate and Senior Housing
II. Guidance Assumptions
Hyde Park Tampa, FL
Briargate MOB Colorado Springs, CO
9380 Judicial Drive San Diego, CA
2-8
9-13
14-27
28-31
32-42

2
HCP Overview
Oyster Point II South San Francisco, CA
3
3
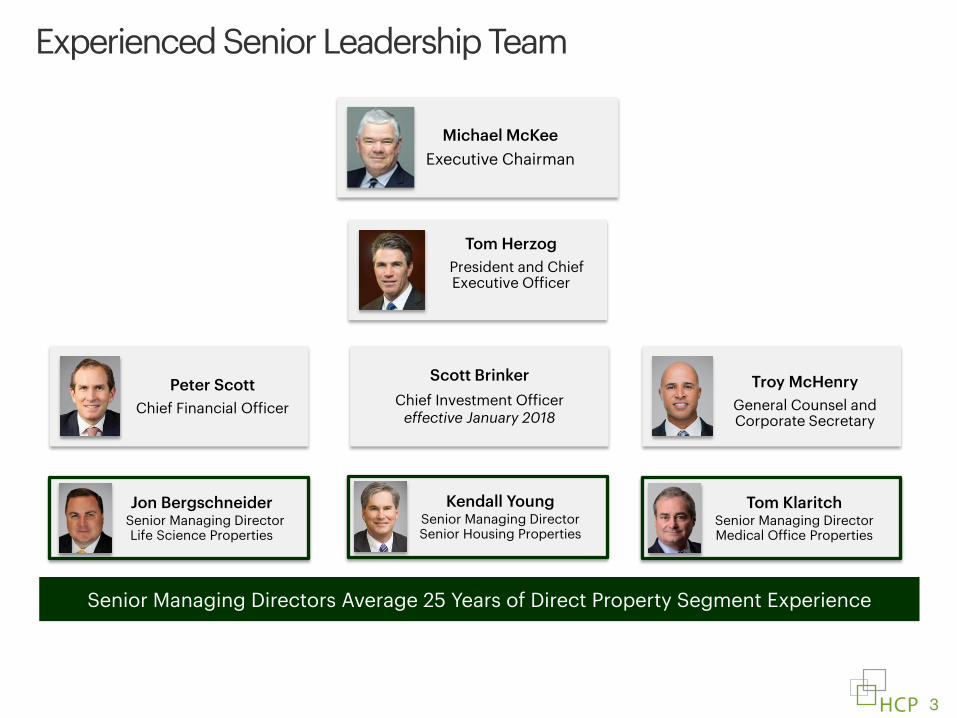
Experienced Senior Leadership Team
Michael McKee Executive Chairman
Kendall Young Senior Managing Director Senior Housing Properties
Troy McHenry General Counsel and Corporate Secretary
Tom Klaritch Senior Managing Director Medical Office Properties
Jon Bergschneider Senior Managing Director
Life Science Properties
Senior Managing Directors Average 25 Years of Direct Property Segment Experience
Tom Herzog President and Chief
Executive Officer
Peter Scott
Chief Financial Officer
Scott Brinker Chief Investment Officer
effective January 2018

4
4
Strategic Priorities and Recent Progress
Improve Portfolio Quality
Strengthen Balance Sheet
Accretive Acquisitions in Our Core Segments
Priorities Strategic Progress
• Sold 64 triple-net assets leased to Brookdale for $1.125 billion • Sold a 40% interest in our RIDEA II JV generating proceeds of $480 million • Divested our Four Seasons loan investments for $136 million • Continue to evaluate additional capital recycling activities to further
improve portfolio quality over time
• Post spin-off, repaid $3.1 billion of debt • Minimal debt maturities until 2019 • On-track to achieve balance sheet targets of Net Debt/EBITDA in low to mid-
6x and leverage to 43-44% by year-end
Invest in Our Development and Redevelopment
Pipeline
• Our current cost of capital is competitive and allows us to go back on offense
• Growing pipeline of acquisition opportunities across all three property types
Establish Core Executive Team
• Appointed Pete Scott as CFO in February 2017
• Announced hiring of Scott Brinker as CIO, effective January 2018
• $830 million development pipeline with expected yields above our initial underwriting
• $230 million land bank with entitlements to build 1.8 million rentable sq. ft. creating a shadow development pipeline in excess of $1 billion

5
5
What Differentiates HCP
Strong and improving investment grade balance sheet with ample liquidity and no signif
Diversified senior housing portfolio: triple-net leases are well covered and 65% independent-living in our SHOP assets
Premier Life Science portfolios in San Francisco and San Diego
82% on-campus MOB portfolio with stable and consistent performance
$880 million development and redevelopment pipeline with an additional 1.8 million square feet of entitlements
Smaller investment base from which to grow Senior Housing - The Solana Preserve Houston, TX
East Mesa MOB Mesa, AZ
High-quality, 95% private-pay portfolio with a balanced emphasis on Senior Housing, Medical Office, and Life Science real estate Strong and improving investment grade balance sheet with ample liquidity and no significant debt maturities until 2019
Investment plan emphasizing prudent capital allocation and accretive growth objectives
Best-in-class disclosures and transparency
Global leader in sustainability
6
6
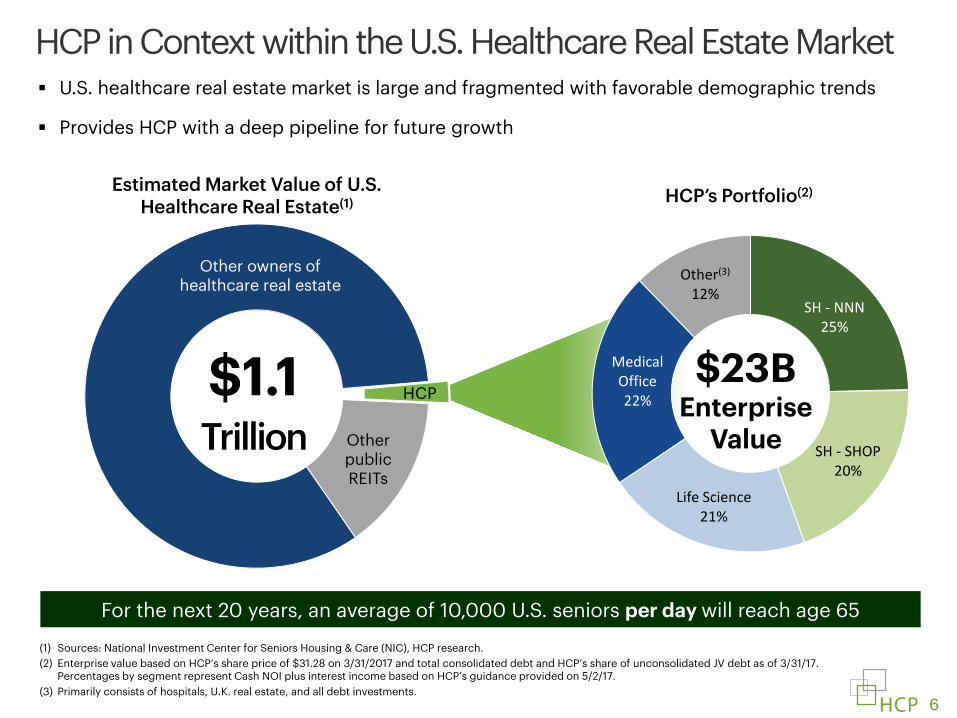
SH - NNN 25%
SH - SHOP 20%
Life Science 21%
Medical Office 22%
Other(3) 12%
(1) Sources: National Investment Center for Seniors Housing & Care (NIC), HCP research. (2) Enterprise value based on HCP’s share price of $31.28 on 3/31/2017 and total consolidated debt and HCP’s share of unconsolidated JV debt as of 3/31/17.
Percentages by segment represent Cash NOI plus interest income based on HCP’s guidance provided on 5/2/17. (3) Primarily consists of hospitals, U.K. real estate, and all debt investments.
$23B Enterprise
Value
HCP’s Portfolio(2)
$1.1 Trillion Other
public REITs
HCP
HCP in Context within the U.S. Healthcare Real Estate Market U.S. healthcare real estate market is large and fragmented with favorable demographic trends
Provides HCP with a deep pipeline for future growth
Other owners of healthcare real estate
Estimated Market Value of U.S. Healthcare Real Estate(1)
For the next 20 years, an average of 10,000 U.S. seniors per day will reach age 65
7
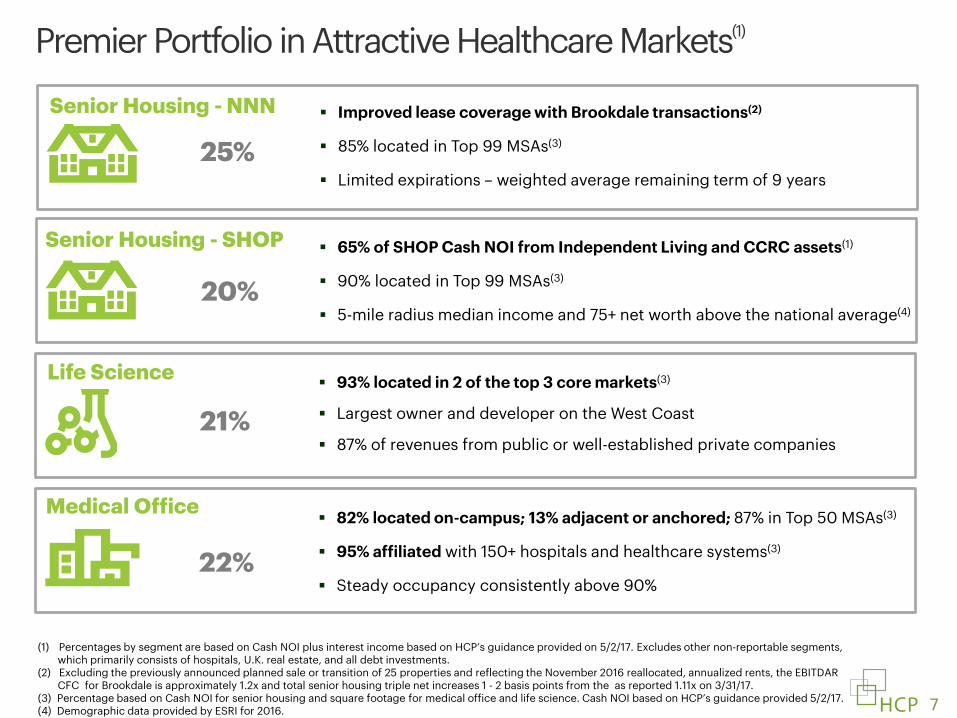
Premier Portfolio in Attractive Healthcare Markets(1)
(1) Percentages by segment are based on Cash NOI plus interest income based on HCP’s guidance provided on 5/2/17. Excludes other non-reportable segments, which primarily consists of hospitals, U.K. real estate, and all debt investments. (2) Excluding the previously announced planned sale or transition of 25 properties and reflecting the November 2016 reallocated, annualized rents, the EBITDAR CFC for Brookdale is approximately 1.2x and total senior housing triple net increases 1 - 2 basis points from the as reported 1.11x on 3/31/17. (3) Percentage based on Cash NOI for senior housing and square footage for medical office and life science. Cash NOI based on HCP’s guidance provided 5/2/17. (4) Demographic data provided by ESRI for 2016.
82% located on-campus; 13% adjacent or anchored; 87% in Top 50 MSAs(3)
95% affiliated with 150+ hospitals and healthcare systems(3)
Steady occupancy consistently above 90%
Medical Office
22%
93% located in 2 of the top 3 core markets(3)
Largest owner and developer on the West Coast
87% of revenues from public or well-established private companies
Life Science
21%
65% of SHOP Cash NOI from Independent Living and CCRC assets(1)
90% located in Top 99 MSAs(3)
5-mile radius median income and 75+ net worth above the national average(4) 20%
Senior Housing - SHOP
Improved lease coverage with Brookdale transactions(2)
85% located in Top 99 MSAs(3)
Limited expirations – weighted average remaining term of 9 years
25%
Senior Housing - NNN

8
8
Investment focus on nationally-recognized top-tier research clusters
Shortened decision making window of LS companies supports selective speculative activity
Where We Plan to Grow
Overview
Aging population is increasing demand for healthcare services
Value-based healthcare driving consolidation and efficiencies
Continued shift from acute towards outpatient setting
Senior Housing Medical Office
Parker Adventist Denver, CO
Fragmented ownership - only ~15% owned by public REITs
Undercapitalized operators value lower-cost REIT capital
~55% IL and 45% AL per NIC
The Solana Preserve Houston, TX
Investable Universe(1) ~$360 billion ~$250 billion
(1) Sources: NIC and HCP research.
Life Science
The Cove South San Francisco, CA
Pharma and biotech addressing “patent cliff” with research and development of new products
Historically high investment in LS companies by VCs, public markets and established biotech/LS companies in ’14-’16
~$50 billion
Growth Priorities
Focus on a select group of quality operating partners with high-growth potential
NNN acquisition opportunities are currently limited; SHOP-structures offer better alignment
Preference for on-campus and/or assets located in elite clusters with a critical mass of primary care doctors, specialists and diagnostic testing

9
Development and Redevelopment
The Cove at Oyster Point South San Francisco, CA
10
82% 18%
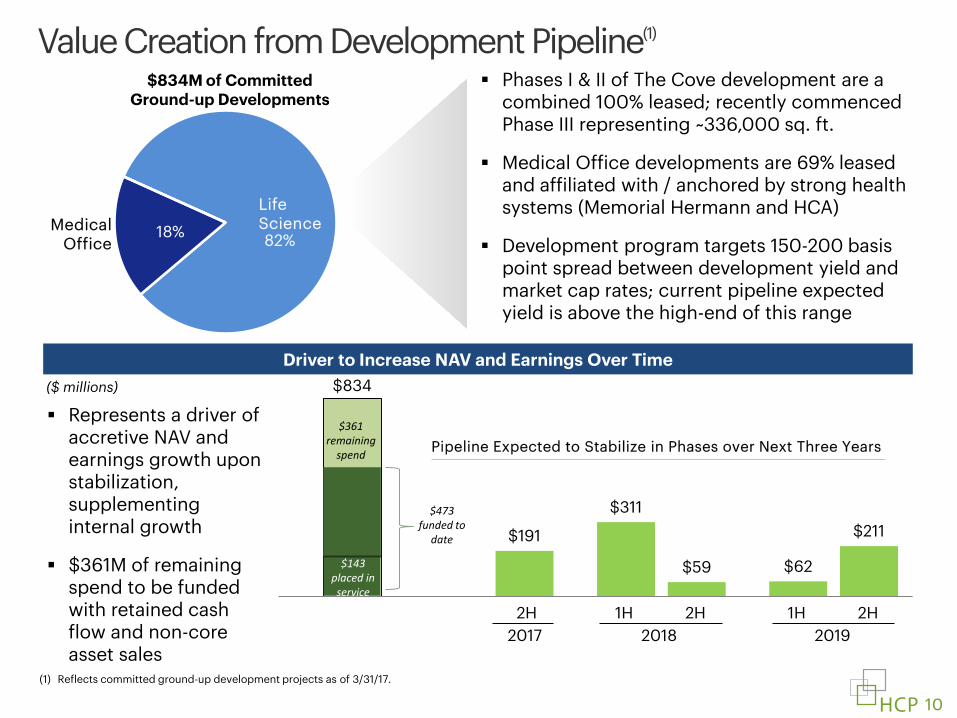
Value Creation from Development Pipeline(1)
(1) Reflects committed ground-up development projects as of 3/31/17.
Phases I & II of The Cove development are a combined 100% leased; recently commenced Phase III representing ~336,000 sq. ft.
Medical Office developments are 69% leased and affiliated with / anchored by strong health systems (Memorial Hermann and HCA)
Development program targets 150-200 basis point spread between development yield and market cap rates; current pipeline expected yield is above the high-end of this range
$834M of Committed Ground-up Developments
Life Science Medical
Office
$311
$62
$834
$191
$59
$211
2016 2017 2018 2019
Driver to Increase NAV and Earnings Over Time
Pipeline Expected to Stabilize in Phases over Next Three Years
($ millions)
Represents a driver of accretive NAV and earnings growth upon stabilization, supplementing internal growth
$361M of remaining spend to be funded with retained cash flow and non-core asset sales
2H 2017
1H 2H 2018
1H 2H 2019
$361 remaining
spend
$143 placed in service
$473 funded to
date

11
The Cove at Oyster Point Development
Can we get an in process pic?
Premier $720M, ~1M sq. ft. Class A Life Science development project at the gateway to South San Francisco
$620 million delivered or in-process; 164,000 sq. ft. of remaining entitlements
Phase I & II: 478,000 sq. ft.; 100% leased
Commencing Phase III; 336,000 sq. ft. in two buildings; anticipated delivery 4Q 2018
LEED Silver campus with rich amenity profile, including food service, fitness, meeting space, hotel & retail

12
Sierra Point Life Science Development Site Overview
Sierra Point
The Cove
SF Bay
Premier 23 acre waterfront development site with entitlements to develop approximately 600,000 sq. ft. over time in a flexible, highly-amenitized design(1)
Targeting a Phase I start in mid-’18 with returns ~150 to 200 basis points above market cap rates
San Francisco Bay
(1) Estimated square footage for Sierra Point will range between 540,000-615,000.
13
13
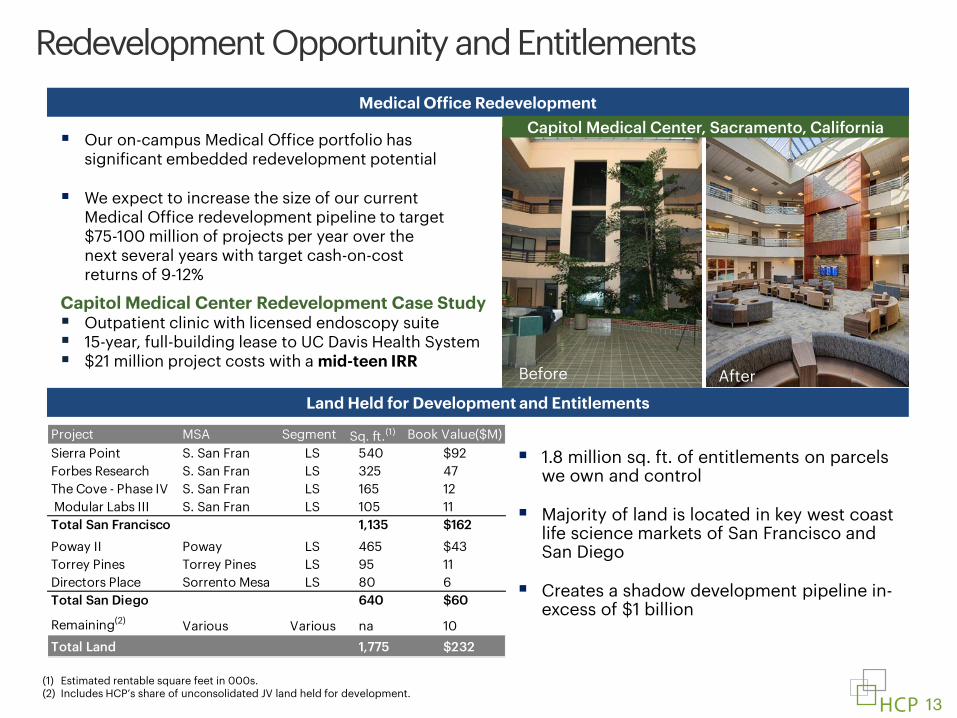
1.8 million sq. ft. of entitlements on parcels we own and control
Majority of land is located in key west coast life science markets of San Francisco and San Diego
Creates a shadow development pipeline in-excess of $1 billion
Redevelopment Opportunity and Entitlements
Our on-campus Medical Office portfolio has significant embedded redevelopment potential
We expect to increase the size of our current Medical Office redevelopment pipeline to target $75-100 million of projects per year over the next several years with target cash-on-cost returns of 9-12%
Medical Office Redevelopment
Land Held for Development and Entitlements
Before
Before After
Capitol Medical Center Redevelopment Case Study Outpatient clinic with licensed endoscopy suite 15-year, full-building lease to UC Davis Health System $21 million project costs with a mid-teen IRR
(1) Estimated rentable square feet in 000s. (2) Includes HCP’s share of unconsolidated JV land held for development.
Capitol Medical Center, Sacramento, California
Project MSA Segment Sq. ft.(1) Book Value($M)Sierra Point S. San Fran LS 540 $92Forbes Research S. San Fran LS 325 47The Cove - Phase IV S. San Fran LS 165 12 Modular Labs III S. San Fran LS 105 11Total San Francisco 1,135 $162
Poway II Poway LS 465 $43Torrey Pines Torrey Pines LS 95 11Directors Place Sorrento Mesa LS 80 6Total San Diego 640 $60
Remaining(2) Various Various na 10Total Land 1,775 $232
14
Property Segment Highlights
Soledad Life Science San Diego, CA

15
Diversified Senior Housing Portfolio Balanced mix of well-covered triple-net lease (55% of NOI)(1) and SHOP assets (45%)
5-mile median income and net worth above the national average(2)
(1) Represents Cash NOI based on HCP’s guidance provided on 5/2/17. (2) Demographic data provided by ESRI for 2016.
290
Properties
87%
NOI from the Top-99 MSAs
46,000
Units
NNN assets SHOP assets
16
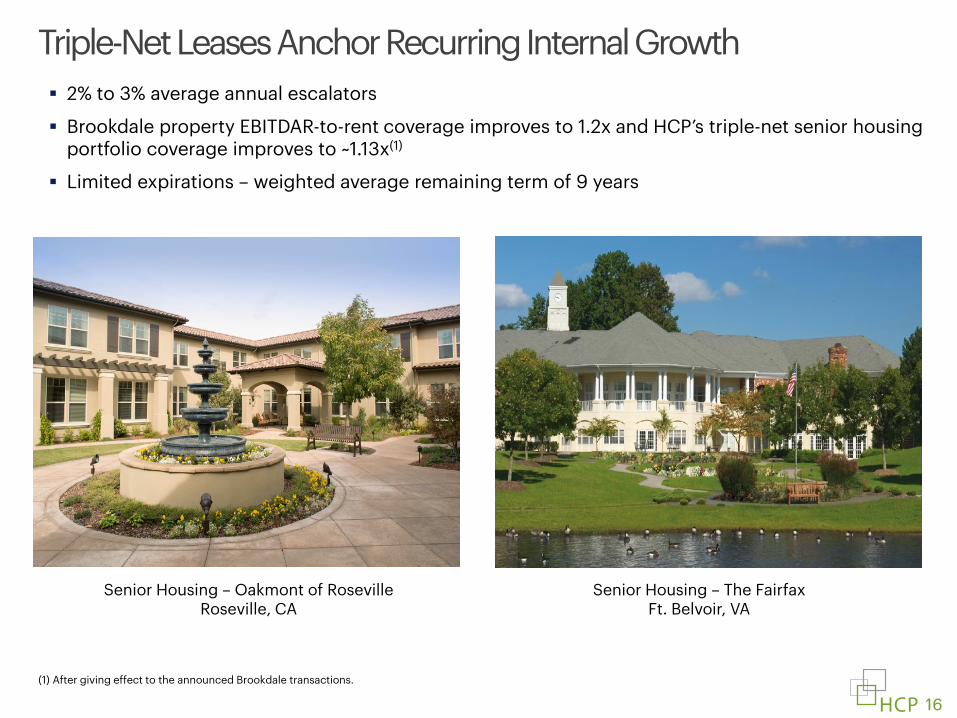
Triple-Net Leases Anchor Recurring Internal Growth
Assisted Living
Independent Living
Memory Care
(1) After giving effect to the announced Brookdale transactions.
Senior Housing – Oakmont of Roseville Roseville, CA
Senior Housing – The Fairfax Ft. Belvoir, VA
2% to 3% average annual escalators
Brookdale property EBITDAR-to-rent coverage improves to 1.2x and HCP’s triple-net senior housing portfolio coverage improves to ~1.13x(1)
Limited expirations – weighted average remaining term of 9 years

17
SHOP Portfolio Mix by Cash NOI(2)
High mix of independent living, which has been less impacted by new supply in our markets
12 years average affordability(1)
SHOP Portfolio is Well-Positioned
0%
2%
4%
6%
2010 2011 2012 2013 2014 2015 2016 2017E 2018E
Annual Inventory Growth(3)
Assisted Living
Independent Living(4)
(1) Affordability represents the number of years an individual can support the cost of residing in a senior housing facility. Affordability is calculated using the median net worth for individuals ages 75 and older, divided by the annualized revenue per occupied room (REVPOR) less the median income for individuals ages 75 and older. Markets with median income in excess of REVPOR reflect an Affordability metric of greater than (>) 15 years. (2) Represents Cash NOI based on HCP’s guidance provided on 5/2/17. (3) Supply data from NIC. (4) Includes CCRC.
Assisted Living 35%
Independent Living (4)
65%
65% of supply growth over next 12 months is Assisted Living - HCP’s portfolio is 65% Independent Living
18
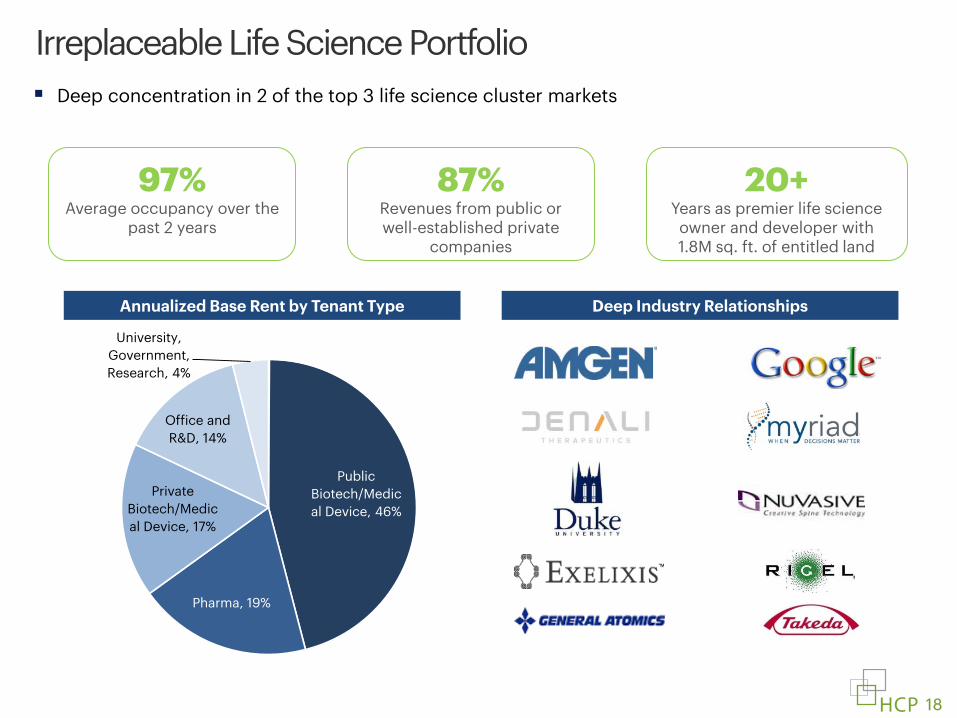
Deep concentration in 2 of the top 3 life science cluster markets
Irreplaceable Life Science Portfolio
Annualized Base Rent by Tenant Type Deep Industry Relationships
97% Average occupancy over the
past 2 years
20+ Years as premier life science owner and developer with 1.8M sq. ft. of entitled land
87% Revenues from public or well-established private
companies
Public Biotech/Medical Device, 46%
Pharma, 19%
Private Biotech/Medical Device, 17%
Office and R&D, 14%
University, Government, Research, 4%
19
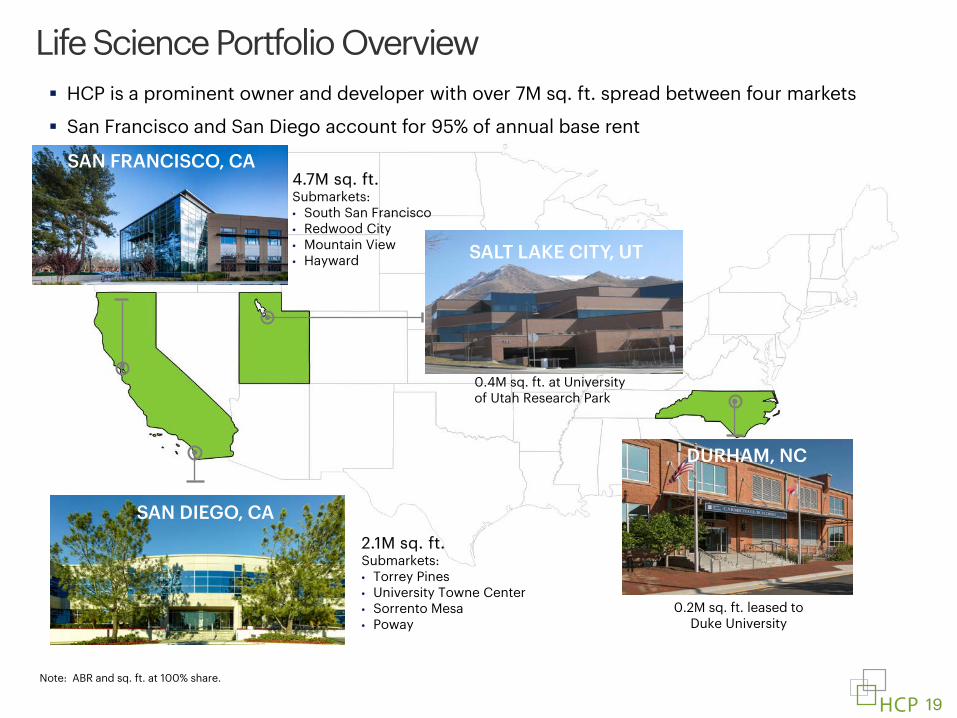
4.7M sq. ft. Submarkets: • South San Francisco • Redwood City • Mountain View • Hayward
Note: ABR and sq. ft. at 100% share.
2.1M sq. ft. Submarkets: • Torrey Pines • University Towne Center • Sorrento Mesa • Poway
0.4M sq. ft. at University of Utah Research Park
SALT LAKE CITY, UT
0.2M sq. ft. leased to Duke University
Life Science Portfolio Overview HCP is a prominent owner and developer with over 7M sq. ft. spread between four markets
San Francisco and San Diego account for 95% of annual base rent
SAN FRANCISCO, CA
SAN DIEGO, CA
DURHAM, NC
20
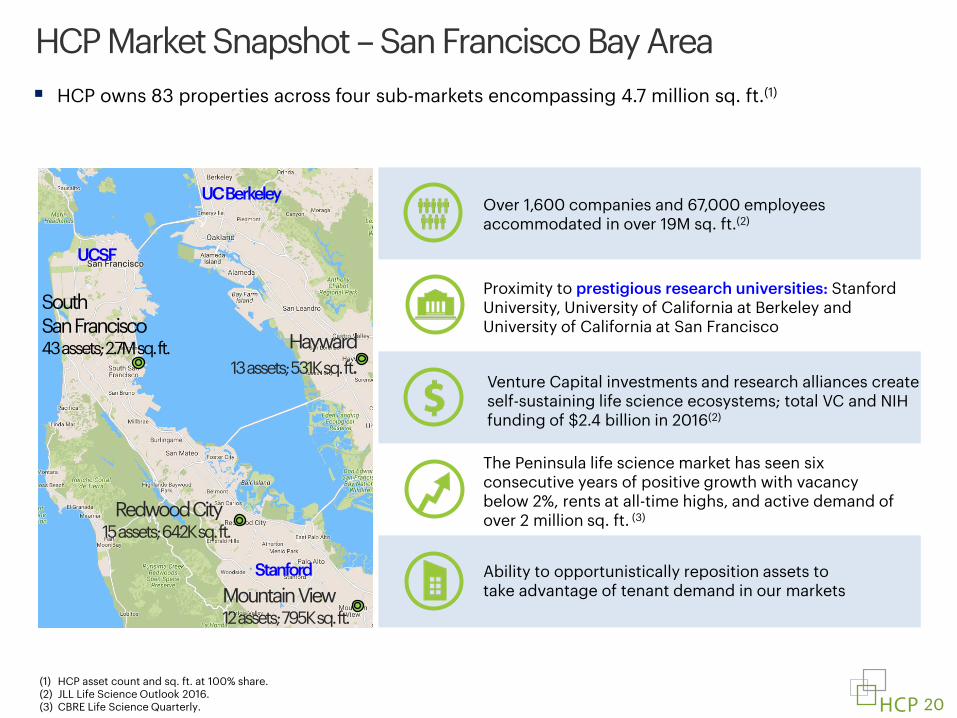
Over 1,600 companies and 67,000 employees accommodated in over 19M sq. ft.(2)
Proximity to prestigious research universities: Stanford University, University of California at Berkeley and University of California at San Francisco
Venture Capital investments and research alliances create self-sustaining life science ecosystems; total VC and NIH funding of $2.4 billion in 2016(2)
Ability to opportunistically reposition assets to take advantage of tenant demand in our markets
HCP Market Snapshot – San Francisco Bay Area HCP owns 83 properties across four sub-markets encompassing 4.7 million sq. ft.(1)
UCSF
UC Berkeley
Stanford
Hayward 13 assets; 531K sq. ft.
Redwood City 15 assets; 642K sq. ft.
The Peninsula life science market has seen six consecutive years of positive growth with vacancy below 2%, rents at all-time highs, and active demand of over 2 million sq. ft. (3)
(1) HCP asset count and sq. ft. at 100% share. (2) JLL Life Science Outlook 2016. (3) CBRE Life Science Quarterly.
Mountain View 12 assets; 795K sq. ft.
South San Francisco 43 assets; 2.7M sq. ft.
21
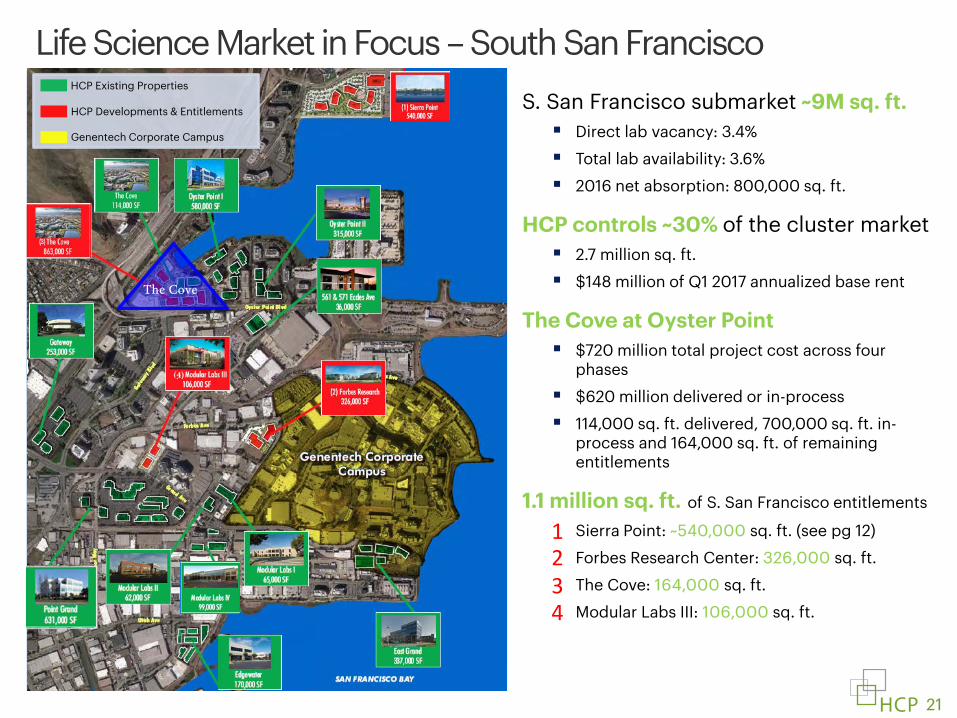
S. San Francisco submarket ~9M sq. ft. Direct lab vacancy: 3.4%
Total lab availability: 3.6%
2016 net absorption: 800,000 sq. ft.
HCP controls ~30% of the cluster market 2.7 million sq. ft.
$148 million of Q1 2017 annualized base rent
The Cove at Oyster Point $720 million total project cost across four
phases
$620 million delivered or in-process
114,000 sq. ft. delivered, 700,000 sq. ft. in-process and 164,000 sq. ft. of remaining entitlements
1.1 million sq. ft. of S. San Francisco entitlements
Sierra Point: ~540,000 sq. ft. (see pg 12)
Forbes Research Center: 326,000 sq. ft.
The Cove: 164,000 sq. ft.
Modular Labs III: 106,000 sq. ft.
Life Science Market in Focus – South San Francisco
HCP Existing Properties HCP Developments
1
2
2
1
3
3 4
HCP Existing Properties HCP Developments & Entitlements Genentech Corporate Campus
The Cove
4

22
Over 1,400 life science companies and 65,000 jobs accommodated in 12M sq. ft.(2)
Proximity to 80 research institutes and universities including: Scripps, Sanford Burnham, University of California at San Diego, Salk, and University of San Diego
Venture Capital and NIH investments in life sciences totaled more than $1.2 billion in 2016(2)
Incubator operators such as BioLabs and JLabs have increasingly helped fund start-ups, generating tenant demand for 5-15k sq. ft. life science space
Proven ability to opportunistically buy and re-position assets to take advantage of market fundamentals
HCP Market Snapshot – San Diego HCP owns 29 properties across four sub-markets encompassing 2.1 million sq. ft.(1)
(1) HCP asset count and sq. ft. at 100% share. (2) JLL Life Science Outlook 2016.
Burnham Institute
Salk Institute
Scripps Institute
UCSD
J. Craig Venter
Poway (20 miles east) 3 assets; 397K sq. ft.
Torrey Pines 14 assets; 983K sq. ft.
UTC 3 assets; 155K sq. ft.
Sorrento Mesa 7 assets; 521K sq. ft.
23
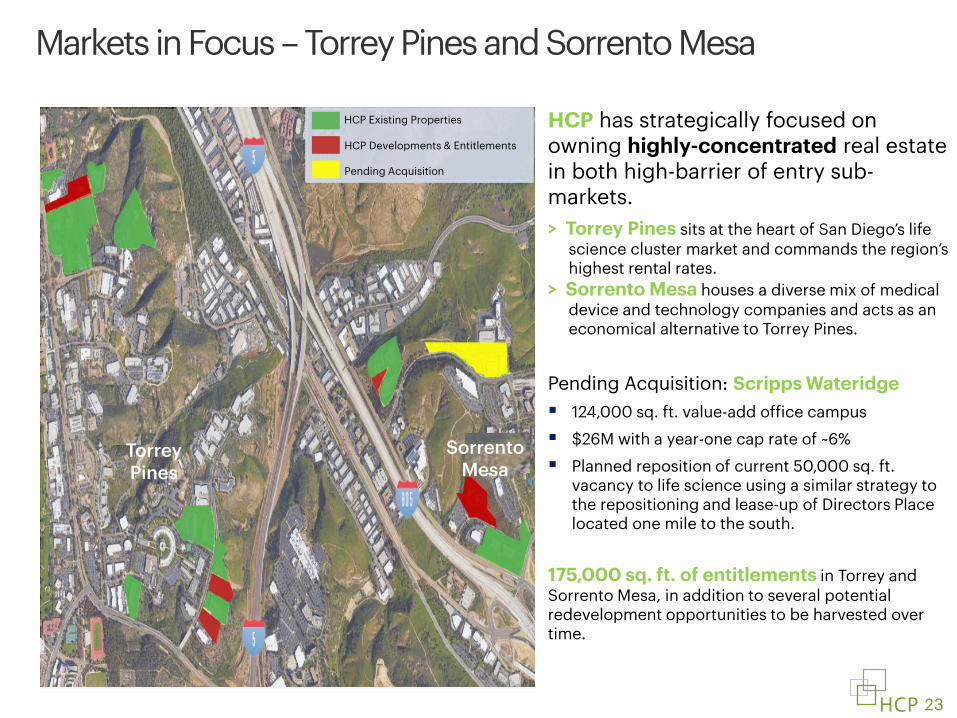
HCP has strategically focused on owning highly-concentrated real estate in both high-barrier of entry sub-markets. > Torrey Pines sits at the heart of San Diego’s life science cluster market and commands the region’s highest rental rates. > Sorrento Mesa houses a diverse mix of medical device and technology companies and acts as an economical alternative to Torrey Pines.
Pending Acquisition: Scripps Wateridge 124,000 sq. ft. value-add office campus
$26M with a year-one cap rate of ~6%
Planned reposition of current 50,000 sq. ft. vacancy to life science using a similar strategy to the repositioning and lease-up of Directors Place located one mile to the south.
175,000 sq. ft. of entitlements in Torrey and Sorrento Mesa, in addition to several potential redevelopment opportunities to be harvested over time.
Markets in Focus – Torrey Pines and Sorrento Mesa
HCP Existing Properties HCP Developments & Entitlements Pending Acquisition
Torrey Pines
Sorrento Mesa

24
Market Density (sq. ft.) 500K+ 100K – 250K 250K- 500K under 100K SF
Medical Office: Industry-Leading On-Campus Portfolio 239 properties encompassing 18 million sq. ft.
90%+ Consistently Occupied
82% On-Campus
~80% Average retention rate
last five years
National Portfolio is 95% Affiliated with Top Hospitals and Healthcare Systems

25
Strong Retention
70%
80%
90%
100%
2012 2013 2014 2015 2016
Consistent Leader in Tenant Satisfaction(1) Stable Same Property Cash NOI Growth
50%
60%
70%
80%
2012 2013 2014 2015 2016
Medical Office Internal Growth: Strong, Steady, Stable
4.16 4.19 4.24
4.20
4.34
4.09
4.15 4.13 4.13 4.13
3.8
4.0
4.2
4.4
2012 2013 2014 2015 2016HCP Kingsley Index
(1) Kingsley Associates’ tenant survey measuring tenant satisfaction with medical office landlords on a 0 to 5 scale, with 5 representing the highest level of tenant satisfaction.
.
Steady Occupancy
0%
1%
2%
3%
4%
2012 2013 2014 2015 2016

26
HCP’s Nashville portfolio is anchored by the 100% leased, seven-building, 615,000 sq. ft. on-campus cluster on HCA’s Centennial Medical Center
Centennial campus is made up of three hospitals with ~650 beds and ~30,000 admissions/yr
Example of On-Campus Strategy: Centennial Medical Center
A: Physician’s Park
Strategically Located Portfolio in Nashville CBD Driving Above-Market Fundamentals
B: Parkview C: Atrium D: Medical Plaza
GLA: 197,500 sq. ft. Occupancy: 100%
HCP owned MOBs not pictured: E: 2222 State, 18,300 sq. ft., occupancy 100%; F: Building C, 8,700 sq. ft., occupancy 100%; G:Tace 10,000 sq. ft., occupancy 100%. Occupancy data as of 3/31/17.
GLA: 188,800 sq. ft. Occupancy: 100%
GLA: 95,800 sq. ft. Occupancy: 100%
GLA: 95,500 sq. ft. Occupancy: 100%

27
27
$531M investment dollars, 14 properties and 2,100 beds
NNN leases with 1.5%-2.5% average annual rent escalators
Key relationships: HCA, Hoag, HealthSouth
Hospital and International Portfolio
Hospital International
$493M debt investments dollars(2) and $374M real estate investment dollars, 61 properties and 3,200 beds
NNN leases with 1.5%-2.5% average annual rent escalators
Deep partnerships with top U.K. operators HC-One and Maria Mallaband
Fresno Surgical Hospital Fresno, CA
(1) EBITDAR lease coverage is for the trailing 12-months ended December 31, 2016. (2) Includes $138 million bridge loan to Maria Mallaband which HCP has the option to convert to fee ownership through the exercise of a call option in mid-2017.
HC- One - Greenfield Park Glasgow, Scotland
6.2x
EBITDAR lease coverage(1)
71%
Cash NOI from acute-care hospitals
1.3x
EBITDAR lease coverage(1)
93%
Occupancy

28
Balance Sheet
Aurora Medical Office Aurora, CO
29
29
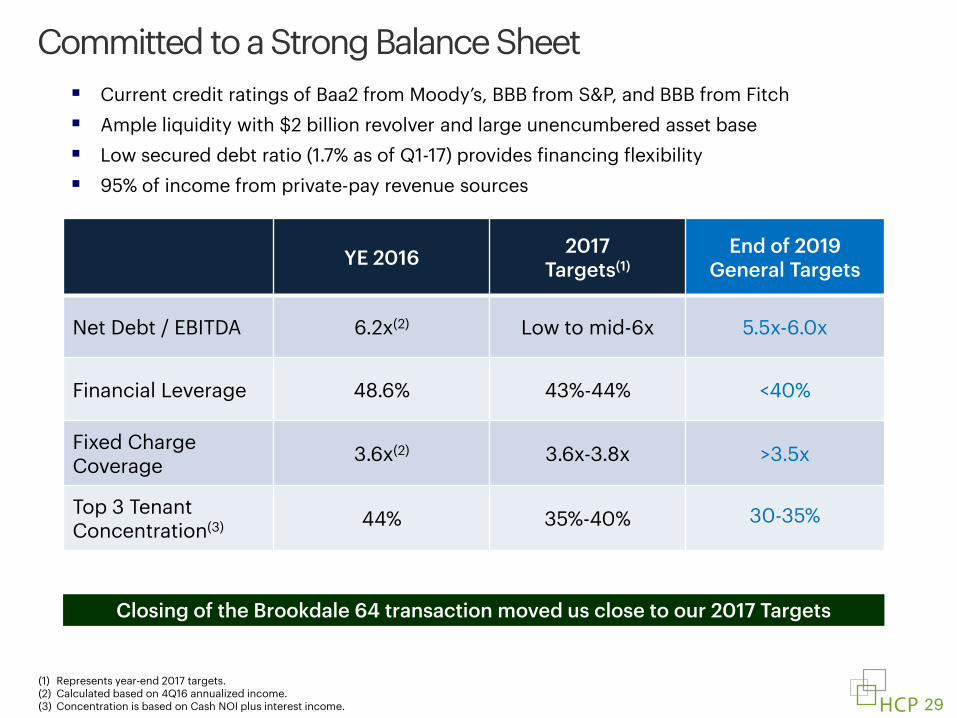
Committed to a Strong Balance Sheet
YE 2016 2017 Targets(1)
End of 2019 General Targets
Net Debt / EBITDA 6.2x(2) Low to mid-6x 5.5x-6.0x
Financial Leverage 48.6% 43%-44% <40%
Fixed Charge Coverage 3.6x(2) 3.6x-3.8x >3.5x
Top 3 Tenant Concentration(3) 44% 35%-40% 30-35%
(1) Represents year-end 2017 targets. (2) Calculated based on 4Q16 annualized income. (3) Concentration is based on Cash NOI plus interest income.
Closing of the Brookdale 64 transaction moved us close to our 2017 Targets
Current credit ratings of Baa2 from Moody’s, BBB from S&P, and BBB from Fitch Ample liquidity with $2 billion revolver and large unencumbered asset base Low secured debt ratio (1.7% as of Q1-17) provides financing flexibility 95% of income from private-pay revenue sources

30
30
$36 $32
$745 $815
$1,251
$918
$806
$1,153
$1,371
$3
$404
$0
$400
$800
$1,200
$1,600
$2,000
2017 2018 2019 2020 2021 2022 2023 2024 2025 2026 Thereafter
Senior Unsecured Notes Secured Debt (incl/ pro rata JV) Unsecured Term Loan
Debt Maturity Schedule(1)
$7.5 billion of total debt 4.2% weighted average interest rate 6.4 years weighted average maturity
($ in millions)
Substantially all debt maturities through the end of 2018 already addressed
(1) As of 3/31/17, excluding revolving credit facility and other debt, and pro forma for $250 million May’17 bond paid off at maturity.
(natural hedge for UK investments)
No meaningful near-term debt
maturities

31
Well-Managed Debt Profile(1)
(1) Q1’17 is pro forma for $250 million May’17 bond paid off at maturity and $131 million revolver pay down in early April.
Weighted average interest rate is 210 bps lower since 2010
Weighted average maturity increased to 6.2 years
Limited exposure to floating rate debt
4.1%
3.0%
4.0%
5.0%
6.0%
7.0%
2010 2011 2012 2013 2014 2015 2016 Q1'17
Weighted Average Interest Rate
4.5
5.0
5.5
6.0
6.5
7.0
2010 2011 2012 2013 2014 2015 2016 Q1'17
Weighted Average Maturity
Weighted Average Interest Rate Weighted Average Maturity
Percentage of Fixed Rate Debt
6.2 yrs.
95%
80%
85%
90%
95%
100%
2010 2011 2012 2013 2014 2015 2016 Q1'17

32 Hoag Hospital
Irvine, CA
Appendix I: Demand Drivers of Healthcare Real Estate and Senior Housing

33
0%
2%
4%
6%
8%
10%
12%
1980 1990 2000 2010 2020E 2030E 2040E 2050E
% o
f U.S
. Pop
ulat
ion
Last Decade
This Decade
Approaching Senior Demographic Tsunami
Source: US Census Bureau.
The first wave of Baby Boomers start to reach age 75 in 2020.
From 2020-2030, the 75+ population is expect to grow by 11 million people, representing a 50% increase in this segment of the population.
Percent of U.S. Population Age 75+
34
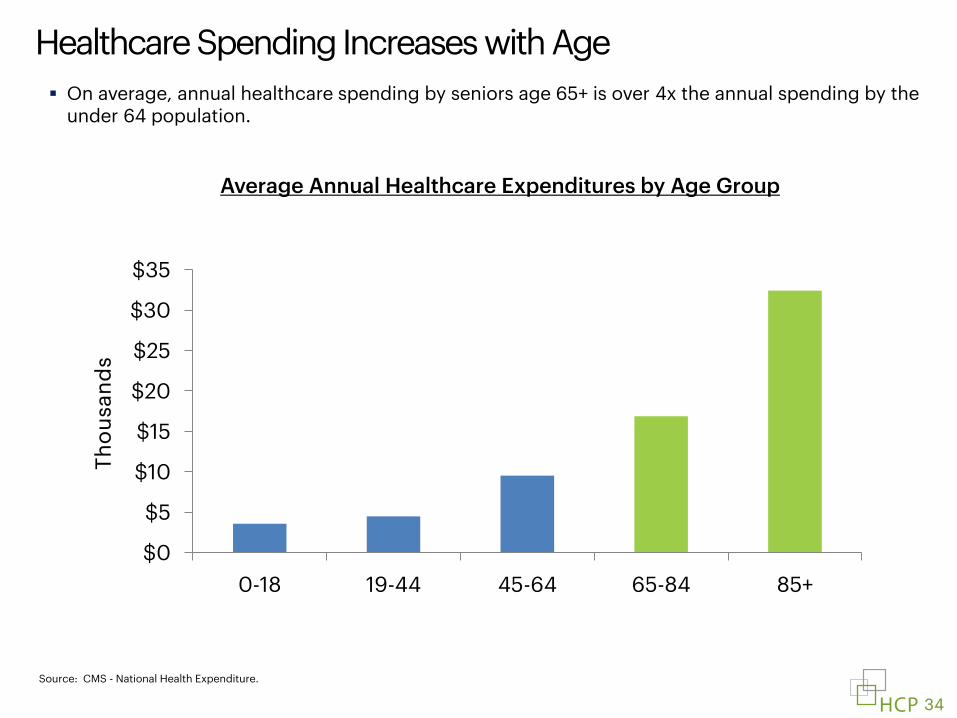
Source: CMS - National Health Expenditure.
Healthcare Spending Increases with Age
Average Annual Healthcare Expenditures by Age Group
$0
$5
$10
$15
$20
$25
$30
$35
0-18 19-44 45-64 65-84 85+
Thou
sand
s
On average, annual healthcare spending by seniors age 65+ is over 4x the annual spending by the
under 64 population.

35
$5.5 Trillion
$3.2 Trillion
15%
16%
17%
18%
19%
20%
21%
Projection
Perc
ent o
f GDP
Healthcare Expenditures Expected to Grow
Source: CMS.
Healthcare spending as a percentage of U.S. GDP is expected to increase to roughly 20% in the coming decade. CMS projects a $2 trillion increase in spending during this period which will likely provide abundant opportunities in our three core segments.
Healthcare Expenditures as a Percentage of U.S. GDP

36
MOBs Benefit from Increased Outpatient Visits
Sources: American Hospital Association, US Census Bureau, US Centers for Disease Control and Prevention.
Acute services moving from hospitals to lower-cost outpatient settings continues to be a tailwind for medical office real estate fundamentals.
Over the coming years, demographic trends will likely drive additional demand as, on average, seniors make over 2x the number of annual physician visits compared to the under 65 population.
207 198 180
383
572
693
1994 2004 2014Inpatient Outpatient
Inpatient Days and Outpatient Visits (in millions)
37
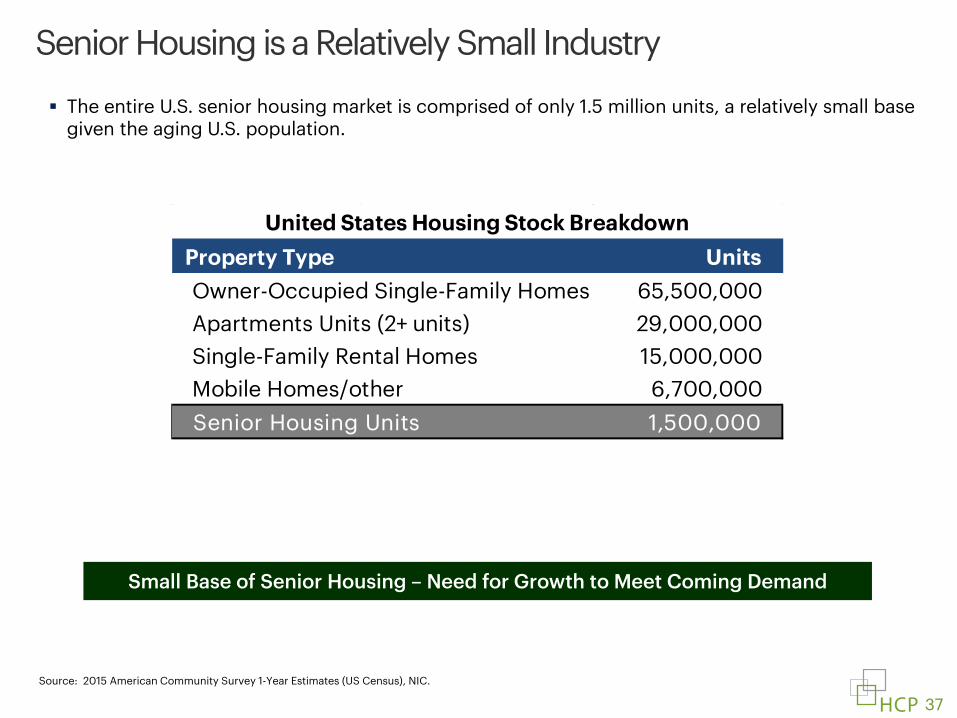
Small Base of Senior Housing – Need for Growth to Meet Coming Demand
Source: 2015 American Community Survey 1-Year Estimates (US Census), NIC.
Senior Housing is a Relatively Small Industry
The entire U.S. senior housing market is comprised of only 1.5 million units, a relatively small base given the aging U.S. population.
Property Type UnitsOwner-Occupied Single-Family Homes 65,500,000Apartments Units (2+ units) 29,000,000Single-Family Rental Homes 15,000,000Mobile Homes/other 6,700,000Senior Housing Units 1,500,000
United States Housing Stock Breakdown

38
-
10
20
30
40
50
60
2011-2015 2016-2020 2021-2025 2026-2030
Uni
ts (0
00
s)
Top NIC 99 Markets
Projected Actual
Population Growth Should Lead to Increased Demand Demand for additional senior housing in the NIC top-99 markets is expected to grow by more than
600,000 units over the next 15 years.
This demand represents an ~70% increase over the current senior housing inventory of ~900,000 units in NIC top-99 markets.
Demand estimate based on current senior housing penetration rate of 7% and forecasted population growth.
Estimated Annual Senior Housing Demand Growth

39
Life Science Funding in Our Markets Remains Strong
Sources: JLL Life Science Outlook 2016, FiercePharma, EvaluatePharma.
Venture Capital (VC) funding for life sciences in San Francisco and San Diego saw a nearly 50% increase from 2014 to 2016. Funding from the National Institutes of Health (NIH) continues to support early stage companies and research.
Overall industry funding is led by pharmaceutical companies looking to invest in life science via M&A, research funding, collaborations, and licensing to help backfill lost revenue as major drugs come off patent. Our strategy is to own real estate in cluster locations where the funding is flowing.
$1,370 $2,004
$1,659
$1,672
2014 2016NIH Funding VC Funding
San Francisco and San Diego Life Science Funding By Source
(in millions)
Top Drugs Coming Off Patent in 2017
Product Company2016 US
Sales ($m)Copazone Teva $3,500Cialis Eli Lilly 1,500Viagra Pfizer 1,100Velcade Takeda 1,100Sustiva Bristol-Myers 900Sandostatin Novartis 850SimpleXx Novo Nordisk 650Viread Gilead 600Pristiq Pfizer 575Strattera Eli Lilly 530
$3,028
$3,675
40
Appendix II: Guidance Assumptions
Oakmont of Chino Hills Chino Hills, CA
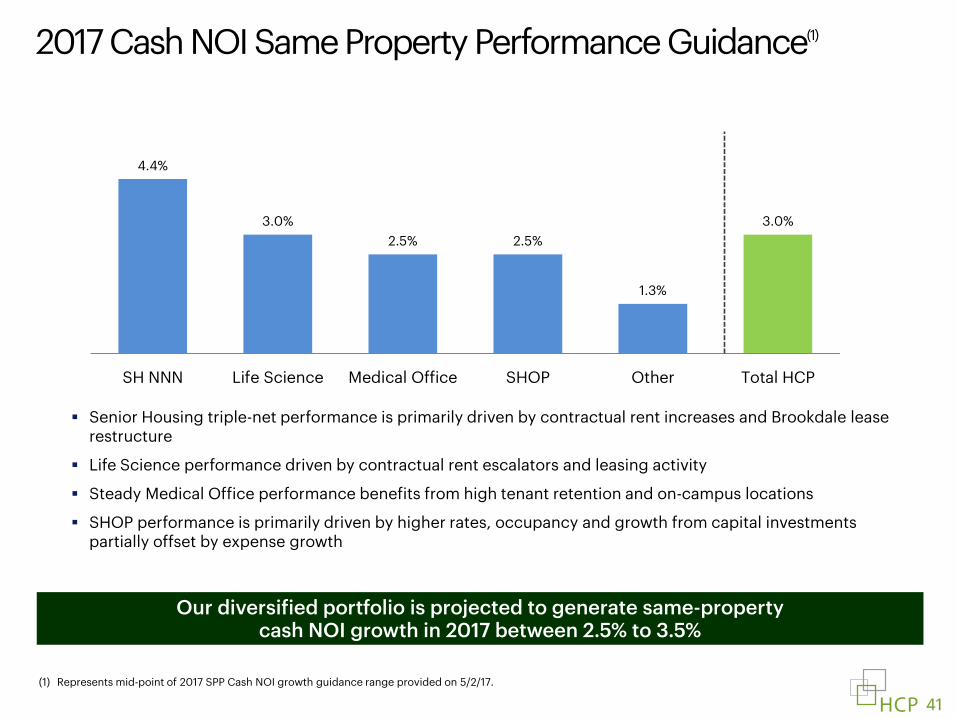
41
4.4%
3.0% 2.5% 2.5%
1.3%
3.0%
SH NNN Life Science Medical Office SHOP Other Total HCP
2017 Cash NOI Same Property Performance Guidance(1)
Our diversified portfolio is projected to generate same-property cash NOI growth in 2017 between 2.5% to 3.5%
Senior Housing triple-net performance is primarily driven by contractual rent increases and Brookdale lease restructure
Life Science performance driven by contractual rent escalators and leasing activity
Steady Medical Office performance benefits from high tenant retention and on-campus locations
SHOP performance is primarily driven by higher rates, occupancy and growth from capital investments partially offset by expense growth
(1) Represents mid-point of 2017 SPP Cash NOI growth guidance range provided on 5/2/17.

42
Assumptions for 2017 Guidance
2017 Guidance
YoY Cash NOI SPP Growth 2.5%-3.5%
YoY NOI SPP Growth 1.2%-2.2%
G&A Expense $83M-$87M
Interest Expense $310M-$320M
Net Dispositions(1) $1.7B-$2.2B @ 7.8%
Recurring CapEx / 2nd Generation(2) $108M-$115M
1st Gen TIs/ICE and Revenue Enhancing(2) $112M-$127M
Re/Development Spend(2) $345M-$400M
Diluted FFO as Adjusted per Share $1.89-$1.95
Dividend per Share $1.48
Fully Diluted FFO as Adj. Wtd. Avg. Share Count 476M
(1) Includes $1.125 billion related to Brookdale 64 and $480 million related to the sale of a 40% interest in and refinancing of the RIDEA II JV that occurred in Q1 2017; proceeds were used to pay down debt. (2) Includes HCP’s share of unconsolidated joint ventures.
43
This presentation is being presented solely for your information, is subject to change and speaks only as of the date hereof. This presentation and comments made by management do not constitute an offer to sell or the solicitation of an offer to buy any securities of HCP or any investment interest in any business ventures of HCP. This presentation is not complete and is only a summary of the more detailed information included elsewhere, including in HCP’s Securities and Exchange Commission filings. No representation or warranty, expressed or implied is made and no reliance should be placed on the accuracy, fairness or completeness of the information presented. HCP, its affiliates, advisers and representatives accept no liability whatsoever for any losses arising from any information contained in this presentation. FORWARD-LOOKING STATEMENTS Statements in this presentation, as well as statements made by management, that are not historical factual statements are “forward-looking statements” within the meaning of Section 27A of the Securities Act of 1933, as amended, and Section 21E of the Securities Exchange Act of 1934, as amended. Forward-looking statements include, without limitation, our statements regarding demographic, industry, market and segment forecasts, our planned or pending transactions, our developments, our planned or pending transactions, our future business strategies, our financing plans, our prospects, and our economic guidance, outlook and expectations. All forward-looking statements are made as of the date hereof, are not guarantees of future performance and are subject to known and unknown risks, uncertainties, assumptions and other factors—many of which are out of our and our management's control and difficult to forecast—that could cause actual results to differ materially from those set forth in or implied by such forward-looking statements. These risks and uncertainties include, but are not limited to: our reliance on a concentration of a small number of tenants and operators for a significant percentage of our revenues, with our concentration in Brookdale increasing as a result of the consummation of the spin-off of QCP on October 31, 2016; the financial condition of our existing and future tenants, operators and borrowers, including potential bankruptcies and downturns in their businesses, and their legal and regulatory proceedings, which results in uncertainties regarding our ability to continue to realize the full benefit of such tenants' and operators' leases and borrowers' loans; the ability of our existing and future tenants, operators and borrowers to conduct their respective businesses in a manner sufficient to maintain or increase their revenues and to generate sufficient income to make rent and loan payments to us and our ability to recover investments made, if applicable, in their operations; competition for tenants and operators, including with respect to new leases and mortgages and the renewal or rollover of existing leases; our concentration in the healthcare property sector, particularly in life sciences, medical office buildings and hospitals, which makes our profitability more vulnerable to a downturn in a specific sector than if we were investing in multiple industries; availability of suitable properties to acquire at favorable prices, the competition for the acquisition and financing of those properties, and the costs of associated property development; our ability to negotiate the same or better terms with new tenants or operators if existing leases are not renewed or we exercise our right to foreclose on loan collateral or replace an existing tenant or operator upon default; the risks associated with our investments in joint ventures and unconsolidated entities, including our lack of sole decision making authority and our reliance on our partners' financial condition and continued cooperation; our ability to achieve the benefits of acquisitions and other investments within expected time frames or at all, or within expected cost projections; operational risks associated with third party management contracts, including the additional regulation and liabilities of our RIDEA lease structures; the potential impact on us and our tenants, operators and borrowers from current and future litigation matters, including the possibility of larger than expected litigation costs, adverse results and related developments; the effect on our tenants and operators of legislation, executive orders and other legal requirements, including the Affordable Care Act and licensure, certification and inspection requirements, as well as laws addressing entitlement programs and related services, including Medicare and Medicaid, which may result in future reductions in reimbursements; changes in federal, state or local laws and regulations, including those affecting the healthcare industry that affect our costs of compliance or increase the costs, or otherwise affect the operations, of our tenants and operators; volatility or uncertainty in the capital markets, the availability and cost of capital as impacted by interest rates, changes in our credit ratings, and the value of our common stock, and other conditions that may adversely impact our ability to fund our obligations or consummate transactions, or reduce the earnings from potential transactions; changes in global, national and local economic or other conditions, including currency exchange rates; our ability to manage our indebtedness level and changes in the terms of such indebtedness; competition for skilled management and other key personnel; the ability to maintain our qualification as a real estate investment trust; and other risks and uncertainties described from time to time in our filings with the Securities and Exchange Commission. We caution investors not to place undue reliance on any forward-looking statements. We assume no, and hereby disclaim any, obligation to update any of the foregoing or any other forward-looking statements as a result of new information or new or future developments, except as otherwise required by law. MARKET AND INDUSTRY DATA This presentation also includes market and industry data that HCP has obtained from market research, publicly available information and industry publications. The accuracy and completeness of such information are not guaranteed. Such data is often based on industry surveys and preparers’ experience in the industry. Similarly, although HCP believes that the surveys and market research that others have performed are reliable, HCP has not independently verified this information. NON-GAAP FINANCIAL MEASURES This presentation contains certain supplemental non-GAAP financial measures. While HCP believes that non-GAAP financial measures are helpful in evaluating its operating performance, the use of non-GAAP financial measures in this presentation should not be considered in isolation from, or as an alternative for, a measure of financial or operating performance as defined by GAAP. You are cautioned that there are inherent limitations associated with the use of each of these supplemental non-GAAP financial measures as an analytical tool. Additionally, HCP’s computation of non-GAAP financial measures may not be comparable to those reported by other REITs. Reconciliations of the non‐GAAP financial measures to the most directly comparable GAAP financial measures are found in the “1Q 2017 Discussion and Reconciliation of Non-GAAP Financial Measures” which can be found on the Investor Relations session of HCP’s website at www.hcpi.com.
Disclaimer
43

![Finale 2002 - [Noite Feliz] bb n nn# nnn nnn nnn nnn n nn# nnn n nn# nnn nnn nnn nnn# nnn# n bb n bb n bb n nn# Flauta (C) Requinta (Eb) I Clarinete (Bb) II Clarinete (Bb) III Clarinete](https://img.dokumen.tips/doc/110x75/5b0ad3357f8b9a45518ce2fc/finale-2002-noite-feliz-bb-n-nn-nnn-nnn-nnn-nnn-n-nn-nnn-n-nn-nnn-nnn-nnn.jpg)


![!)L&fi? DDaonnle,nnn anlli~U Maan DSw waonn€¦ · !)L&fi? br,I DDaonnle,nnn anlli~UU: Maan ,' W Untere Oenkmalbehörde -3.A. 65 -[Fotols] 65 155 Cö.82 BLN 4 I n S Stra3sc IRr](https://img.dokumen.tips/doc/110x75/60606688c01f602ed92c8009/lfi-ddaonnlennn-anlliu-maan-dsw-waonn-lfi-bri-ddaonnlennn-anlliuu.jpg)