Embed Size (px)
Citation preview

CAN
CBA.0001.0049.1198

2 of 41 CAN
Vision and Strategy
Target Methodology
Sales Target Methodology
What’s New
People Leadership Changes
Frontline KPI Matrix
Leadership KPI Matrix
Site Support Roles
Definitions and Targets
Sales Performance Reporting and Targets
My Notes
My Action Plan
CBA.0001.0049.1199

stands for our key focus areas in Direct Banking to uphold the banks vision and meet the RBS strategy.
WE BELIEVE TO EXCEL AT SECURING AND
ENHANCING THE FINANCIAL WELLBEING
OF BUSINESSES, COMMUNITIES AND
PEOPLE
WE CAN EXCEL AT SATISFYING CUSTOMER
NEEDS IN MORE WAYS THROUGH
PERSONAL RELATIONSHIPS AND WORLD
CLASS TECHNOLOGY.
THE KEY TO SUCCESS IS FOR YOU TO
LIVE AND BREATHE OUR 5 COMMBANK
VALUES:
The three priorities in Direct Banking are underpinned by the 6 RBS strategic pillars.
TEN - Customers at the centre of everything we do. 10/10 in customer satisfaction.
CAN
FIVE – A vibrant and diverse workforce who live the 5 CommBank values.
ONE – One CommBank - meet more customer needs by simplifying our business.
CBA.0001.0049.1200

4 of 41 CAN
CBA.0001.0049.1201

5 of 41
Gen Sales Other
Online PL Other
CAN
CBA.0001.0049.1202

6 of 41
• We need to continue to secure and enhance the financial wellbeing of our customers, by being risk aware and adhering to Bank policies and procedures.
• These changes continue to embed the right behaviours in our business and encourages excellence and continuous improvement.
• The gate opener will now be measured using a 3 rating scale; met, partially met and not met. A partially met, or not met rating may impact your overall KPI outcomes.
Proactively identifies issues (e.g. complaints/incidents/risks) and
escalates in a timely manner
Call monitoring completed to the required level and timeliness
Adheres to scripting/processes. No major errors/repeat errors
Quality and timely CSA testing requirements completed
• Over the past few years, our focus on the customer has been the key to the outstanding customer satisfaction results we have achieved.
• Changing the way we measure CES as a KPI will help us continue to exceed our customers’ expectations.
• Focusing the business on Direct Banking’s overall performance, highlights the importance of collaboration. It encourages us to keep the customer at the front of our mind, and ensures that we effectively support each other across skill sets and sites.
• Through this focus, we continue to place the customer at the centre of everything we do.
CCRU Team Note: This change will provide consistency within the Direct Channels Business, to ensure that our HL Retention and CCRU businesses' KPI’s are aligned. Ensuring we provide an exceptional customer experience is at the core of retaining business, so re-aligning this KPI in no way removes the customer centric culture that we have built in our retention teams.
Team Performance Weighting Team/CCM Performance
Weighting
Direct Banking Performance Weighting
Direct Banking Performance Weighting
CCRU Agents Removal of CES Target
CCRU Leaders Removal of CES Target
Team Performance Targets CCM Performance Targets Site Performance Targets
National Performance Targets
• With the introduction of DBSA, we now have more ways to measures how we provide fast, friendly and confident service to our customers.
• By introducing additional metrics into the productivity KPI, we aim to achieve a balanced focus across all our telephony metrics.
• Leaders telephony productivity will now be measured by the % of staff achieving ‘valued expectations’.
Service Agents AHT, Hold Time, NRCS, ACW,
Transfer Rates, Adherence
% Staff Achieving Telephony Productivity Targets
Sales Agents AHT, NRCS, ACW, Transfer Rates,
Adherence
Controllable Shrinkage (all CCM’s)
CAN
CBA.0001.0049.1203

7 of 41
FY15 ‘People Gate Opener’ removed
People KPI added with a 10% weighting against overall performance
• We received a great deal of feedback regarding our FY15 ‘People’ gate opener which included metrics for turnover and UPA.
• It was highlighted that these metrics have been challenging to achieve across different shift times/businesses, and are often influenced by factors outside of a leaders immediate control.
• Subsequently, the decision was made to remove this gate opener at a leadership level. To re-enforce the importance of managing controllable shrinkage, we have now ensured this is a metric across all our CCM roles.
• Whilst we now won’t have metricated KPI goals at a leadership level, this does not remove our focus to execute the RBS and DB people strategies.
• To support us to continue to inspire and grow our people, and build a vibrant and diverse workforce, a ‘people KPI will be introduced for all people leaders in RBS.
• This KPI is currently being developed and reviewed. More information to come in the next 2-3 weeks.
CAN
CBA.0001.0049.1204

8 of 41
CBA.0001.0049.1205

9 of 41
Risk & Safety Management Gate Opener Qualitative Assessment (Refer Risk & Safety Management Definitions)
- Customer Focus - Team & Culture - Continuous Improvement - Effective communication - Judgement - Drive results
N/A Manager Observation
Customer Experience Survey (CES) Team Performance
30% Valued Contribution 81.8%- 86.8% (Refer CES Targets for additional target information)
Customer Experience Survey (CES) Direct Banking Performance
10% Valued Contribution 84.6%-85.9% (Refer CES Targets for additional target information)
Telephony 30%
Key Metrics AHT, NRCS, Hold Time, ACW, Transfer Rate (Refer Telephony Productivity Targets for additional information)
Adherence 30% Valued Contribution 94%-94.9% (Refer Adherence Targets for additional target information)
CAN
CBA.0001.0049.1206

10 of 41
Risk & Safety Management Gate Opener Qualitative Assessment (Refer Risk & Safety Management Definitions)
- Customer Focus - Team & Culture - Continuous Improvement - Effective communication - Judgement - Drive results
N/A Manager Observation
Customer Experience Survey (CES) Team Performance
20% Valued Contribution 81.8%- 86.8% (Refer CES Targets on for additional target information)
Customer Experience Survey (CES) Direct Banking Performance
10% Valued Contribution 84.6%-85.9% (Refer CES Targets on for additional target information)
SPR % to Plan 40% Valued Contribution 90%-100.9% (Refer Leadership Matrix and Sales Targets for additional target information)
Telephony 30%
Key Metrics AHT, NRCS, Adherence, ACW, Transfer Rate (Refer Telephony Productivity Targets for additional information)
CAN
CBA.0001.0049.1207

11 of 41
Risk & Safety Management Gate Opener Qualitative Assessment (Refer Risk & Safety Management Definitions)
- Customer Focus - Team & Culture - Continuous Improvement - Effective communication - Judgement - Drive results
N/A Manager Observation
Retention Rates (avoidable) 60% Target 30%
Telephony 40%
Key Metrics AHT, NRCS, Adherence, ACW, Transfer Rate (Refer Telephony Productivity Targets for additional information)
CAN
CBA.0001.0049.1208

12 of 41
Risk & Safety Management Gate Opener Qualitative Assessment (Refer Risk & Safety Management Definitions)
- Customer Focus - Team & Culture - Continuous Improvement - Effective communication - Judgement - Drive results
N/A Manager Observation
Customer Experience Survey (CES) Team Performance
30% Community
Survey
Valued Contribution 81.8%- 86.8% (Refer CES Targets for additional target information)
Customer Experience Survey (CES) Direct Banking Performance
10% Valued Contribution 84.6%-85.9% (Refer CES Targets for additional target information)
Telephony 60%
Key Metrics AHT, NRCS, Hold Time, ACW, Transfer Rate (Refer Telephony Productivity Targets for additional information)
CAN
CBA.0001.0049.1209

13 of 41
Risk & Safety Management Gate Opener Qualitative Assessment (Refer Risk & Safety Management Definitions)
- Customer Focus - Team & Culture - Continuous Improvement - Effective communication - Judgement - Drive results
N/A Manager Observation
Customer Experience Survey (CES) Team Performance
30% Valued Contribution 81.8%- 86.8% (Refer CES Targets for additional target information)
Customer Experience Survey (CES) Direct Banking Performance
10% Valued Contribution 84.6%-85.9% (Refer CES Targets for additional target information)
Digital Productivity % to Plan 60% Target 100%
No KPI change. Your leaders will
continue to coach and support you to achieve a
‘Green Score Card’
Your productivity KPI will hold a 50% weighting on
your overall performance.
This will now include a ‘Productivity Quality’ KPI with a weighting of 10%
(Remaining 40% weighting against
Productivity % to plan)
CAN
CBA.0001.0049.1210

14 of 41
Risk & Safety Management Gate Opener Qualitative Assessment (Refer Risk & Safety Management Definitions)
- Customer Focus - Team & Culture - Continuous Improvement - Effective communication - Judgement - Drive results
N/A Manager Observation
Customer Experience Survey (CES) Team Performance
20% Valued Contribution 81.8%- 86.8% (Refer CES Targets on for additional target information)
Customer Experience Survey (CES) Direct Banking Performance
10% Valued Contribution 84.6%-85.9% (Refer CES Targets for additional target information)
SPR % Plan 40% Valued Contribution 90%-100.9% (Refer Leadership Matrix and Sales Targets for additional target information)
Telephony 30%
Key Metrics AHT, NRCS, Adherence, ACW, Transfer Rate (Refer Telephony Productivity Targets for additional target information)
• This change will ensure that all lending
applications are performed within the DL business, which provides our customers with a consistent service experience, and reduces risk within our business.
• When reviewing the personal loans application process, we identified that a majority of opportunities to discuss motor insurance and personal loan protection policies with customers arise during a PL application.
• To ensure fair and equitable targets, and a seamless experience for our customers, these targets have been removed from Our Branch SPR.
CAN
CBA.0001.0049.1211

15 of 41
CBA.0001.0049.1212

16 of 41
Risk & Safety Management Gate Opener Qualitative Assessment (Refer Risk & Safety Management Definitions)
- Customer Focus - Team & Culture - Continuous Improvement - Effective communication - Judgement - Drive results
N/A Manager Observation
Customer Experience Survey (CES) Team Performance
30% Valued Contribution 81.8%- 86.8% (Refer CES Targets for additional target information)
Customer Experience Survey (CES) Direct Banking Performance
10% Valued Contribution 84.6%-85.9% (Refer CES Targets for additional target information)
% Staff achieving Telephony Productivity Targets
30% Valued Contribution 55%-64.9% (Refer Leadership Matrix and Telephony Targets for additional target information)
Adherence 20% Valued Contribution 94%-94.9% (Refer Adherence Targets for additional target information)
TBD 10% TBD
CAN
CBA.0001.0049.1213

17 of 41
Risk & Safety Management Gate Opener Qualitative Assessment (Refer Risk & Safety Management Definitions)
- Customer Focus - Team & Culture - Continuous Improvement - Effective communication - Judgement - Drive results
N/A Manager Observation
Customer Experience Survey (CES) Team Performance
20% Valued Contribution 81.8%- 86.8% (Refer CES Targets for additional target information)
Customer Experience Survey (CES) Direct Banking Performance
10% Valued Contribution 84.6%-85.9% (Refer CES Targets for additional target information)
SPR % to Plan 40% Valued Contribution 90%-100.9% (Refer Leadership Matrix and Sales Targets for additional target information)
% Staff achieving Telephony Productivity Targets
20% Valued Contribution 55%-64.9% (Refer Leadership Matrix and Telephony Targets for additional target information)
TBD 10% TBD
CAN
CBA.0001.0049.1214

18 of 41
Risk & Safety Management Gate Opener Qualitative Assessment (Refer Risk & Safety Management Definitions)
- Customer Focus - Team & Culture - Continuous Improvement - Effective communication - Judgement - Drive results
N/A Manager Observation
Retention Rates (avoidable) 50% Target 30%
% Staff achieving Telephony Productivity Targets
40% Valued Contribution 55%-64.9% (Refer Leadership Matrix and Telephony Targets for additional target information)
TBD 10% TBD
CAN
CBA.0001.0049.1215

19 of 41
Risk & Safety Management Gate Opener Qualitative Assessment (Refer Risk & Safety Management Definitions slide x)
- Customer Focus - Team & Culture - Continuous Improvement - Effective communication - Judgement - Drive results
N/A Manager Observation
Customer Experience Survey (CES) Team Performance
30% Valued Contribution 81.8%- 86.8% (Refer CES Targets for additional target information)
Customer Experience Survey (CES) Direct Banking Performance
10% Valued Contribution 84.6%-85.9% (Refer CES Targets for additional target information)
Digital Productivity % to Plan 40% Target 100%
Digital Productivity Quality 10%
Manager Observation - % of staff achieving ‘green scorecard’ - Quality action plan execution - Implementation of corrective actions
TBD 10% TBD
No KPI change. Your leaders will
continue to coach and support you to achieve a
‘Green Score Card’
Your productivity KPI will hold a 50% weighting on
your overall performance.
This will now include a ‘Productivity Quality’ KPI with a weighting of 10%
(Remaining 40% weighting against
Productivity % to plan)
CAN
CBA.0001.0049.1216

20 of 41
Risk & Safety Management Gate Opener Qualitative Assessment (Refer Risk & Safety Management Definitions slide x)
- Customer Focus - Team & Culture - Continuous Improvement - Effective communication - Judgement - Drive results
N/A Manager Observation
Customer Experience Survey (CES) Team Performance
30% Community
Survey
Valued Contribution 81.8%- 86.8% (Refer CES Targets on slide x for additional target information)
Customer Experience Survey (CES) Direct Banking Performance
10% Valued Contribution 84.6%-85.9% (Refer CES Targets on slide x for additional target information)
% Staff achieving Telephony Productivity Targets
30% Valued Contribution 55%-64.9% (Refer to Leadership Matrix and Telephony Targets for additional target information)
Adherence 20% Valued Contribution 94%-94.9% (Refer Adherence Targets for additional target information)
TBD 10% TBD
CAN
CBA.0001.0049.1217

21 of 41
Risk & Safety Management Gate Opener Qualitative Assessment (Refer Risk & Safety Management Definitions)
- Customer Focus - Team & Culture - Continuous Improvement - Effective communication - Judgement - Drive results
N/A Manager Observation
Customer Experience Survey (CES) Team Performance
30% Valued Contribution 83.5%- 86.5% (Refer CES Targets for additional target information)
Customer Experience Survey (CES) Direct Banking Performance
10% Valued Contribution 84.6%-85.9% (Refer CES Targets for additional target information)
% Staff achieving Telephony Productivity Targets
30% Valued Contribution 55%-64.9% (Refer to Leadership Matrix and Telephony Targets for additional target information)
Adherence 10% Valued Contribution 94%-94.9% (Refer Adherence Targets for additional target information)
Controllable Shrinkage 10% Valued Contribution 8.3% (Refer to Leadership Matrix for further target information)
TBD 10% TBD
CAN
CBA.0001.0049.1218

22 of 41
Risk & Safety Management Gate Opener Qualitative Assessment (Refer Risk & Safety Management Definitions)
- Customer Focus - Team & Culture - Continuous Improvement - Effective communication - Judgement - Drive results
N/A Manager Observation
Customer Experience Survey (CES) Team Performance
20% Valued Contribution 83.5%- 86.5% (Refer CES Targets for additional target information)
Customer Experience Survey (CES) Direct Banking Performance
10% Valued Contribution 84.6%-85.9% (Refer CES Targets for additional target information)
SPR % to Plan 30% Valued Contribution 90%-100.9% (Refer to Leadership Matrix and Sales Targets for additional target information)
% Staff achieving Telephony Productivity Targets
20% Valued Contribution 55%-64.9% (Refer to Leadership Matrix and Telephony Targets for additional target information)
Controllable Shrinkage 10% Valued Contribution 8.3% (Refer to Leadership Matrix for further target information)
TBD 10% TBD
CAN
CBA.0001.0049.1219

23 of 41
CBA.0001.0049.1220

24 of 41
Risk & Safety Management Gate Opener Qualitative Assessment (Refer Risk & Safety Management Definitions)
- Customer Focus - Team & Culture - Continuous Improvement - Effective communication - Judgement - Drive results
N/A Manager Observation
Customer Experience Survey (CES) Site Performance
10% Valued Contribution 84.6%-85.9% (Refer CES Targets for additional target information)
Customer Experience Survey (CES) Direct Banking Performance
10% Valued Contribution 84.6%-85.9% (Refer CES Targets for additional target information)
Stakeholder Engagement 20% Qualitative Assessment Survey Monkey Manager Observation
CAP Management
30%
Qualitative Assessment (Refer Site Support Definitions for additional information)
Business Support 20% Qualitative Assessment (Refer Site Support Definitions on for additional information)
TBD 10% TBD
CAN
CBA.0001.0049.1221

25 of 41
Risk & Safety Management Gate Opener Qualitative Assessment (Refer Risk & Safety Management Definitions)
- Customer Focus - Team & Culture - Continuous Improvement - Effective communication - Judgement - Drive results
N/A Manager Observation
Customer Experience Survey (CES) Site Performance
10% Valued Contribution 84.6%-85.9% (Refer CES Targets for additional target information)
Customer Experience Survey (CES) Direct Banking Performance
10% Valued Contribution 84.6%-85.9% (Refer CES Targets for additional target information)
Stakeholder Engagement 20% Qualitative Assessment Survey Monkey Manager Observation
CAP Support 40% Qualitative Assessment (Refer Site Support Definitions for additional information)
Business Support 20% Qualitative Assessment (Refer Site Support Definitions for additional information)
CAN
CBA.0001.0049.1222

26 of 41
- Effectively manage the completion of CAP/CSA tasks . - Quarterly CAP/CSA reviews completed in a timely manner. - Implement and execute corrective actions. - Proactively identify control weaknesses, and implement robust action plans, in a timely manner to address root cause. - Manage various periodical audits, as delegated by line manager. - Effectively utilises continuous improvement tools and methodologies to diagnose issues, and implement solutions. - Proactively engages with operational control team to review risk and safety processes, and to share best practise. Sessions are documented, and clear actions are taken from any issues identified. - Shares best practise/insights with site management team based, to ensure that all CAP tasks are completed in a compliant manner. - Collaborates with Site Support Manager peers across Direct Banking , and actively leads the execution/embedding of the 'National Site Support Action Plan' and 'National Team Charter‘. - Effectively supports the completion of CAP/CSA tasks. - Quarterly CSA reviews completed in a timely manner. - Supports in the implementation of corrective actions. - Supports various periodical audits, as instructed by line manager. - Effectively utilises continuous improvement tools and methodologies to diagnose issues, and present solutions. - Collaborates with peers across Direct Banking and actively contributes to the execution of the 'National Site Support Action Plan' and 'National Team Charter‘. - Analyse existing reporting to improve on efficiencies within the business, and where required provide additional insights. - Escalation & onsite contact for site system/tech maintenance, issues and incidents. - Reference point for visitors, and co-ordinates events, conferences and inductions. - Provides advice/guidance on property/equipment policy & procedures. - Manage minor works and order contractors. - Undertake special projects/tasks as allocated by line manager. - Payment/management of invoices/requisitions. - Undertake general office management e.g. filing, faxing, printing , mail management and ordering/distribution of stores.
Additional Site Support Manager Requirements
-Review HR reports regarding leave taken, higher duty, overtime etc. and assist with resource planning, coordinate leave and RDO reconciliations. Act as the EM Pay Quest & PeopleSoft delegate and effect return to work programs.
CBA.0001.0049.1223

27 of 41
CBA.0001.0049.1224

28 of 41
All modules completed within required timeframes and in accordance with the RBS Mandatory Learning Suite
Takes accountability for own safety and the safety of others.
Actively participates in health and safety activities in line with the Corporate Safety Calendar.
Health & Safety issues/incidents are reported and escalated in line with the Banks health and safety responsibilities.
Adheres to legislative requirements and Bank policies expected of their role.
Adheres to scripting and processes (no major errors/no repeat errors).
Proactively identifies issues (e.g. complaints/incidents/risks) and escalates in a timely manner.
Additional Leadership Criteria
Quality and timely CSA testing requirements completed.
Call monitoring completed to the required level and in a timely manner.
CAN
CBA.0001.0049.1225

29 of 41
Creating value in each customer interaction and focusing on the total customer experience
• Understands the customer • Creates value • Resolves Issues • Lives Sales & Service
Inspiring others to demonstrate CBA’s values and working together to create a passionate, high performing culture.
• Respects others and CBA Group • Works with others • Manages performance and development • Builds empowered teams
Continuously Improving and Innovating what we do to make things simple and easy for our customers and each other.
• Fosters a culture of continuous improvement • Develops and implements solutions • Leads change • Lives productivity and Continuous
Improvement
Communicating clearly and with impact to ensure understanding, engagement and commitment to action.
• Plans and understands communication • Delivers clear and impactful messages • Ensures understanding • Engagement through communications
Making sound decisions based on understanding business, analysing data and applying common sense.
• Understands CBA Group • Understands the industry • Reaches measured decisions • Enhances brand and reputation • Applies good judgment
Initiating action and committing to achieving business outcomes by taking accountability for goals.
• Sets goals and drives accountability • Stays focused to execute • Manages risks prudently
CAN
CBA.0001.0049.1226

30 of 41
<75.5% 75.6%-81.7% 81.8%- 86.8% 86.9%-89.9% > 90%
<78% 78%-83.4% 83.5%-86.5% 86.6%-88.4% >88.5%
<80% 80%-84.5% 84.6%-85.9% 86%-87.5% > 87.6%
<80% 80%-84.5% 84.6%-85.9% 86%-87.5% > 87.6%
CAN
CBA.0001.0049.1227

31 of 41
Performance Outcome Criteria
Unsatisfactory 1< metrics achieved
Performance Requires Development 2 metrics achieved OR 2> metrics achieved but AHT target not met
Valued Contribution 3 metrics achieved including AHT
Superior Contribution 4 metrics achieved including AHT
Exceptional Contribution 5 metrics achieved including AHT
*Indicates Separate KPI
LOB AHT ACW HOLD TIME TRANSFER NRCS ADHERENCE TO
SCHEDULE
General Service 176 13 14 14% 8 94% *
General Service (Travel Money) 223 13 14 14% 8 94% *
Netbank 231 16 18 10% 8 94% *
Cards AM 250 17 NO TARGET 14% 10 94%
Cards PM 279 18 NO TARGET 13% 10 94%
Cards Service (Casuals) 240 17 NO TARGET 14% 10 94%
CCRU 408 70 NO TARGET 13% 8 94%
General Sales 228 15 NO TARGET 16% 10 94%
POC 160 11 12 15% 8 94% *
ICAL 244 20 22 3% 8 94% *
Our Branch 550 38 NO TARGET 9% 20 94%
24x7 General Service 205
19 21 5% 8 94% * 24x7 Cards (Combined) 309
24x7 Netbank 290
24x7 Travel Money 320
CAN
CBA.0001.0049.1228

32 of 41 CAN
AHT ACW HOLD TIME TRANSFER NRCS ADHERENCE TO
SCHEDULE OUTCOME
176 13 14 14% 8 94% * EXCEPTIONAL CONTRIBUTION
Scenario 1 - CSR Outcomes 174 15 14 12% 8 - Superior Contribution
Scenario 2 - CSR Outcomes 190 13 12 10% 7 - Performance Requires
Development
Scenario 3 - CSR Outcomes 158 11 10 17% 10 - Valued Contribution
250 17 NO TARGET 14% 10 94% EXCEPTIONAL CONTRIBUTION
Scenario 1 - CSR Outcomes 250 16 NO TARGET 10% 11 96% Superior Contribution
Scenario 2 - CSR Outcomes 232 14 NO TARGET 15% 8 92% Valued Contribution
Scenario 3 - CSR Outcomes 284 12 NO TARGET 17% 10 94% Performance Requires
Development
228 15 NO TARGET 16% 10 94% EXCEPTIONAL CONTRIBUTION
Scenario 1 - CSR Outcomes 194 11 NO TARGET 14% 12 96% Superior Contribution
Scenario 2 - CSR Outcomes 248 13 NO TARGET 15% 8 94% Performance Requires
Development
Scenario 3 - CSR Outcomes 205 13 NO TARGET 19% 12 98% Valued Contribution
CBA.0001.0049.1229

33 of 41
CBA.0001.0049.1230

34 of 41 CAN
CBA.0001.0049.1231

35 of 41
Opportunity hours Relief &
Secondment
• Segments above are for illustrative purposes only • Overtime opportunities will include sales targets • UPA excluded from sales target consideration • New starters will have a share of target until fully trained
CAN
CBA.0001.0049.1232

36 of 41 CAN
CBA.0001.0049.1233
37 of 9
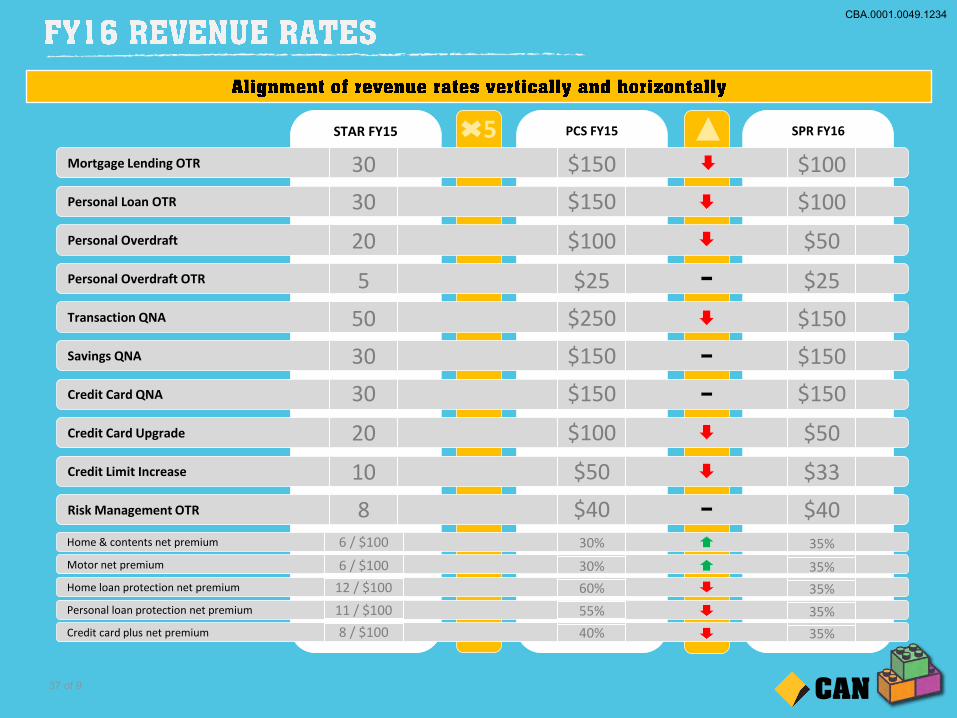
PCS FY15 SPR FY16 STAR FY15
Mortgage Lending OTR
Personal Loan OTR
Personal Overdraft
Transaction QNA
Personal Overdraft OTR
Savings QNA
Credit Card QNA
Credit Card Upgrade
Risk Management OTR
Credit Limit Increase
30
30
20
5
50
30
30
20
10
8
$150
$150
$100
$25
$250
$150
$150
$100
$50
$40
$100
$100
$50
$25
$150
$150
$150
$50
$33
Home & contents net premium
$40
Motor net premium
35%
Home loan protection net premium
35%
Personal loan protection net premium
35%
Credit card plus net premium
35%
35%
30%
30%
60%
55%
40%
6 / $100
6 / $100
12 / $100
11 / $100
8 / $100
5
CAN
CBA.0001.0049.1234

38 of 9
$44.84 REDUCTION TO WEEKLY REVENUE
TARGET
AVERAGE PER FTE/WEEK PER PRODUCTIVE HOUR
SALES TARGETS REVENUE
RATES SPR REVENUE SALES TARGETS SPR REVENUE
FY15 FORECAST
FY16 FORECAST
FY16
TARGET
FY15 FORECAST
FY16 TARGET
YoY % FY15
FORECAST FY16
TARGET
FY15 FORECAST
FY16 TARGET
MORTGAGE LENDING $6.33 $6.33 - $0.29 $0.29
Mortgage Lending OTR 0.06 0.06 $100.00 $6.33 $6.33 - 0.003 0.003 $0.29 $0.29
CONSUMER FINANCE $60.94 $56.37 (7.5%) $2.76 $2.55
Personal Loan OTR 0.50 0.50 $100.00 $50.35 $50.35 - 0.023 0.023 $2.28 $2.28
Personal Overdraft 0.19 0.10 $50.00 $9.32 $4.75 (49.0%) 0.008 0.004 $0.42 $0.22
Personal Overdraft OTR 0.05 0.05 $25.00 $1.27 $1.27 - 0.002 0.002 $0.06 $0.06
DEPOSITS $104.48 $104.48 - $4.73 $4.73
Transaction QNA 0.24 0.24 $150.00 $36.26 $36.26 - 0.011 0.011 $1.64 $1.64
Youth QNA 0.03 0.03 $20.00 $0.51 $0.51 - 0.001 0.001 $0.02 $0.02
Savings QNA 0.45 0.45 $150.00 $67.70 $67.70 - 0.020 0.020 $3.06 $3.06
CREDIT CARDS $429.04 $389.03 (9.3%) $19.41 $17.60
Credit Card QNA 1.00 1.00 $150.00 $150.15 $150.15 - 0.045 0.045 $6.79 $6.79
Credit Card Upgrade 2.10 2.10 $50.00 $104.92 $104.92 - 0.095 0.095 $4.75 $4.75
Credit Limit Increase 3.48 2.68 $50.00 $173.97 $133.96 (23.0%) 0.157 0.121 $7.87 $6.06
RISK MANAGEMENT $20.08 $19.82 (1.3%) $0.91 $0.90
Home and Contents Net Premium 0.47 0.00 35% $0.16 $0.00 (100.0%) 0.021 0.000 $0.01 $0.00
Motor Insurance Net Premium 0.26 0.00 35% $0.09 $0.00 (100.0%) 0.012 0.000 $0.00 $0.00
Personal Loan Protection Net Premium 0.04 0.00 35% $0.01 $0.00 (100.0%) 0.002 0.000 $0.00 $0.00
Home Loan Protection Net Premium 0.00 0.00 35% $0.00 $0.00 0.000 0.000 $0.00 $0.00
Credit Card Plus Net Premium 38.05 38.05 35% $13.32 $13.32 - 1.721 1.721 $0.60 $0.60
Risk Management OTR 0.16 0.16 $40.00 $6.50 $6.50 - 0.007 0.007 $0.29 $0.29
TOTAL SPR TARGET $620.87 $576.03 (7.2%) $28.08 $26.06
CBA.0001.0049.1235

39 of 9 CAN
$30.33 REDUCTION TO
WEEKLY REVENUE TARGET
AVERAGE PER FTE/WEEK PER PRODUCTIVE HOUR
SALES TARGETS REVENUE
RATES SPR REVENUE SALES TARGETS SPR REVENUE
FY15 FORECAST
FY16 FORECAST
FY16
TARGET
FY15 FORECAST
FY16 TARGET
YoY % FY15
FORECAST FY16
TARGET
FY15 FORECAST
FY16 TARGET
MORTGAGE LENDING $21.96 $21.96 - $0.99 $0.99
Mortgage Lending OTR 0.22 0.22 $21.96 $21.96 - 0.010 0.010 $0.99 $0.99
CONSUMER FINANCE $100.00 $133.55 $119.91 (10.2%) $6.04 $5.42
Personal Loan OTR 1.01 1.01 $101.09 $101.09 - 0.046 0.046 $4.57 $4.57
Personal Overdraft 0.56 0.28 $100.00 $27.84 $14.20 (49.0%) 0.025 0.013 $1.26 $0.64
Personal Overdraft OTR 0.19 0.19 $50.00 $4.63 $4.63 - 0.008 0.008 $0.21 $0.21
DEPOSITS $25.00 $652.35 $652.35 - $29.51 $29.51
Transaction QNA 1.80 1.80 $270.07 $270.07 - 0.081 0.081 $12.22 $12.22
Youth QNA 0.27 0.27 $150.00 $5.44 $5.44 - 0.012 0.012 $0.25 $0.25
Savings QNA 2.51 2.51 $20.00 $376.84 $376.84 - 0.114 0.114 $17.05 $17.05
CREDIT CARDS $150.00 $117.70 $110.97 (5.7%) $5.32 $5.02
Credit Card QNA 0.41 0.41 $61.90 $61.90 - 0.019 0.019 $2.80 $2.80
Credit Card Upgrade 0.53 0.53 $150.00 $26.51 $26.51 - 0.024 0.024 $1.20 $1.20
Credit Limit Increase 0.59 0.45 $50.00 $29.29 $22.55 (23.0%) 0.026 0.020 $1.32 $1.02
RISK MANAGEMENT $50.00 $38.82 $28.87 (25.6%) $1.76 $1.31
Home and Contents Net Premium 1.12 0.00 $0.39 $0.00 (100.0%) 0.051 0.000 $0.02 $0.00
Motor Insurance Net Premium 0.72 0.00 35% $0.25 $0.00 (100.0%) 0.032 0.000 $0.01 $0.00
Personal Loan Protection Net Premium 0.24 0.00 35% $0.08 $0.00 (100.0%) 0.011 0.000 $0.00 $0.00
Home Loan Protection Net Premium 0.00 0.00 35% $0.00 $0.00 - 0.000 0.000 $0.00 $0.00
Credit Card Plus Net Premium 26.36 0.00 35% $9.23 $0.00 (100.0%) 1.192 0.000 $0.42 $0.00
Risk Management OTR 0.72 0.72 35% $28.87 $28.87 - 0.033 0.033 $1.31 $1.31
TOTAL SPR TARGET $964.39 $934.06 (3.1%) $43.62 $42.25
CBA.0001.0049.1236

40 of 9 CAN
$149.69 REDUCTION TO WEEKLY REVENUE
TARGET
AVERAGE PER FTE/WEEK PER PRODUCTIVE HOUR
SALES TARGETS REVENUE
RATES SPR REVENUE SALES TARGETS SPR REVENUE
FY15 FORECAST
FY16 FORECAST
FY16
TARGET
FY15 FORECAST
FY16 TARGET
YoY % FY15
FORECAST FY16
TARGET
FY15 FORECAST
FY16 TARGET
MORTGAGE LENDING $105.55 $112.03 6.1% $4.77 $5.07
Mortgage Lending OTR 1.06 1.12 $100.00 $105.55 $112.03 6.1% 0.048 0.051 $4.77 $5.07
CONSUMER FINANCE $21.31 $14.46 (32.2%) $0.96 $0.65
Personal Loan OTR 0.05 0.05 $100.00 $4.68 $5.14 9.8% 0.002 0.002 $0.21 $0.23
Personal Overdraft 0.31 0.19 $50.00 $15.70 $9.32 (40.7%) 0.014 0.008 $0.71 $0.42
Personal Overdraft OTR 0.04 0.00 $25.00 $0.92 $0.00 (100.0%) 0.002 0.000 $0.04 $0.00
DEPOSITS $618.85 $685.46 10.8% $27.99 $31.01
Transaction QNA 2.72 3.05 $150.00 $407.40 $458.17 12.5% 0.123 0.138 $18.43 $20.73
Youth QNA 0.02 0.00 $20.00 $0.45 $0.00 (100.0%) 0.001 0.000 $0.02 $0.00
Savings QNA 1.41 1.52 $150.00 $211.00 $227.29 7.7% 0.064 0.069 $9.54 $10.28
CREDIT CARDS $340.22 $374.78 10.2% $15.39 $16.95
Credit Card QNA 1.58 1.74 $150.00 $237.57 $261.61 10.1% 0.072 0.079 $10.75 $11.83
Credit Card Upgrade 1.43 1.69 $50.00 $71.68 $84.50 17.9% 0.065 0.076 $3.24 $3.82
Credit Limit Increase 0.62 0.57 $50.00 $30.97 $28.66 (7.4%) 0.028 0.026 $1.40 $1.30
RISK MANAGEMENT $493.94 $243.46 (50.7%) $22.34 $11.01
Home and Contents Net Premium 532.79 631.25 35% $186.48 $220.94 18.5% 24.100 28.554 $8.44 $9.99
Motor Insurance Net Premium 643.36 0.00 35% $225.18 $0.00 (100.0%) 29.102 0.000 $10.19 $0.00
Personal Loan Protection Net Premium 178.58 0.00 35% $62.50 $0.00 (100.0%) 8.078 0.000 $2.83 $0.00
Home Loan Protection Net Premium 14.34 16.95 35% $5.02 $5.93 18.2% 0.649 0.767 $0.23 $0.27
Credit Card Plus Net Premium 32.34 35.61 35% $11.32 $12.47 10.1% 1.463 1.611 $0.51 $0.56
Risk Management OTR 0.09 0.10 $40.00 $3.45 $4.13 19.7% 0.004 0.005 $0.16 $0.19
TOTAL SPR TARGET $1,579.88 $1,430.19 (9.5%) $71.46 $64.69
CBA.0001.0049.1237
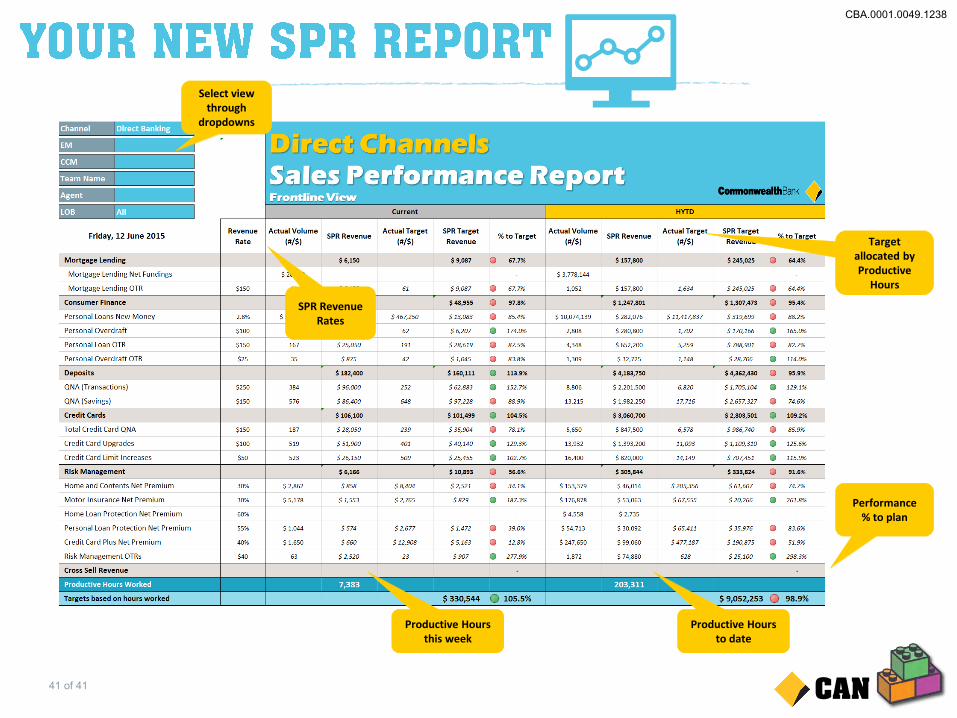
41 of 41
Performance % to plan
Select view through
dropdowns
SPR Revenue Rates
Target allocated by Productive
Hours
Productive Hours this week
Productive Hours to date
CAN
CBA.0001.0049.1238

42 of 41
What are the benefits of us changing
from STAR/PCS to SPR?
• Alignment across positions from Agent to EGM level
• Alignment across DB and DL
• Automation of sales reporting (PCS, STAR and SPR are all Excel based)
• Productivity gains from reducing manual amendments – saving time as an agent, TL, CCM, Site EM and Finance.
• Consistency in measuring performance across sites as all plans will now be set based on productive hours
worked.
Why is UPA excluded from productive
hours?
Based on your feedback, our new sales processes are designed to provide agents with fair and equitable targets. If
an agent needs to take an unplanned absence, the time they are away will be removed from their productive
hours. Health and wellbeing is a very important part of our culture in Direct Banking, and we hope that this change
will better support our agents to achieve a work life balance, whilst continuing to maintain our focus on meeting
our customers’ needs.
How are system exceptions catered
for?
All system exceptions are to be entered by a Team Leader on the same day in which they occurred. SPR
automatically calculates targets based on an agents schedule in EWFM. For this reason, it is very important that an
agents schedule is accurately reflected, to ensure they receive the appropriate target week on week.
What happens if I need to input an
exception for last week? How will my
SPR report re-calculate my target?
If you need to enter a back dated system exception, SPR reporting will adjust the YTD performance in your next
SPR report. It is critical that you keep EWFM up to date, and if an exception is missed, that this is rectified in a
timely manner.
Your exception must be input by Friday 5pm, in order for the target adjustment to appear for that week. If you
process later than this, a YTD adjustment will be applied in the following report release.
How are site exceptions catered for? All site exceptions are to be booked in advance and entered by The Bridge/CCMs.
What are productive hours? Productive Hours = Paid hours – Meetings – Huddles – Relief – Buddying/Mentoring – Breaks – Training – TOFU –
Coaching – System – Site – Time in Lieu – UPA + Overtime
What is the correlation of points to $
with the new system? 1 point = $5
Who do I contact if I have an enquiry
regarding my Sales Performance
Report?
Contact DB Performance Reporting via email
CAN
CBA.0001.0049.1239

43 of 41
CAN
CBA.0001.0049.1240

44 of 41
CAN
CBA.0001.0049.1241