Embed Size (px)
Citation preview
2017 State of Our Watershed Report
The State of Our Watershed
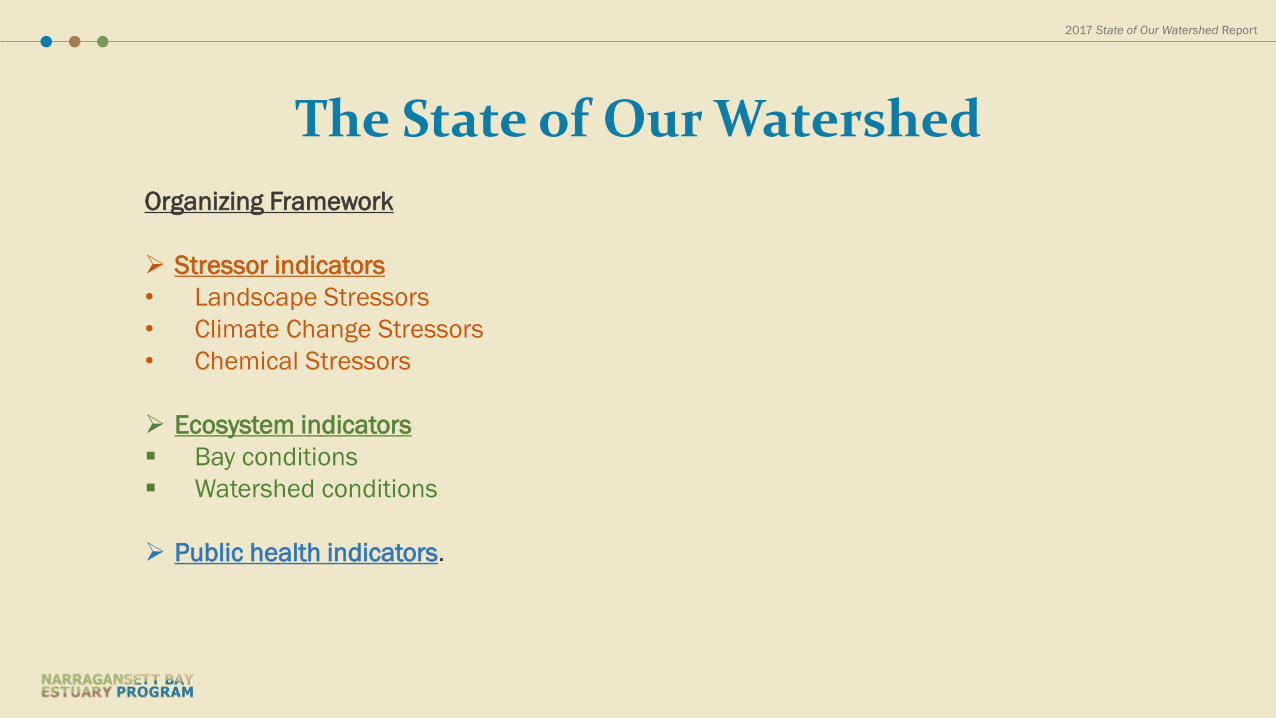
Organizing Framework
Stressor indicators
• Landscape Stressors
• Climate Change Stressors
• Chemical Stressors
Ecosystem indicators
Bay conditions
Watershed conditions
Public health indicators.

2017 State of Our Watershed Report
The State of Our Watershed
Landscape Stressors
Population, Land Use, Impervious Cover, Wastewater, and Nutrient Loadings
Climate Change Stressors
Temperature, Precipitation, and Sea Level
Chemical Stressors
Legacy Contaminants and Emerging Contaminants
Bay Ecological Condition
Seagrasses, Salt Marsh, Benthic Habitat, Estuarine Fish Communities
Dissolved Oxygen, Chlorophyll, Water Clarity
Watershed Ecological Condition
Macroinvertebrates, Freshwater Fish Communities, Water Quality conditions for aquatic life
impacted by nutrient-related pollutants, Protected Open Space, and Ecological Significant Lands
Public Health
Marine Beaches for Swimming, Water Quality for Recreational Use, and Shellfishing Areas
2017 State of Our Watershed Report
The State of Our Watershed
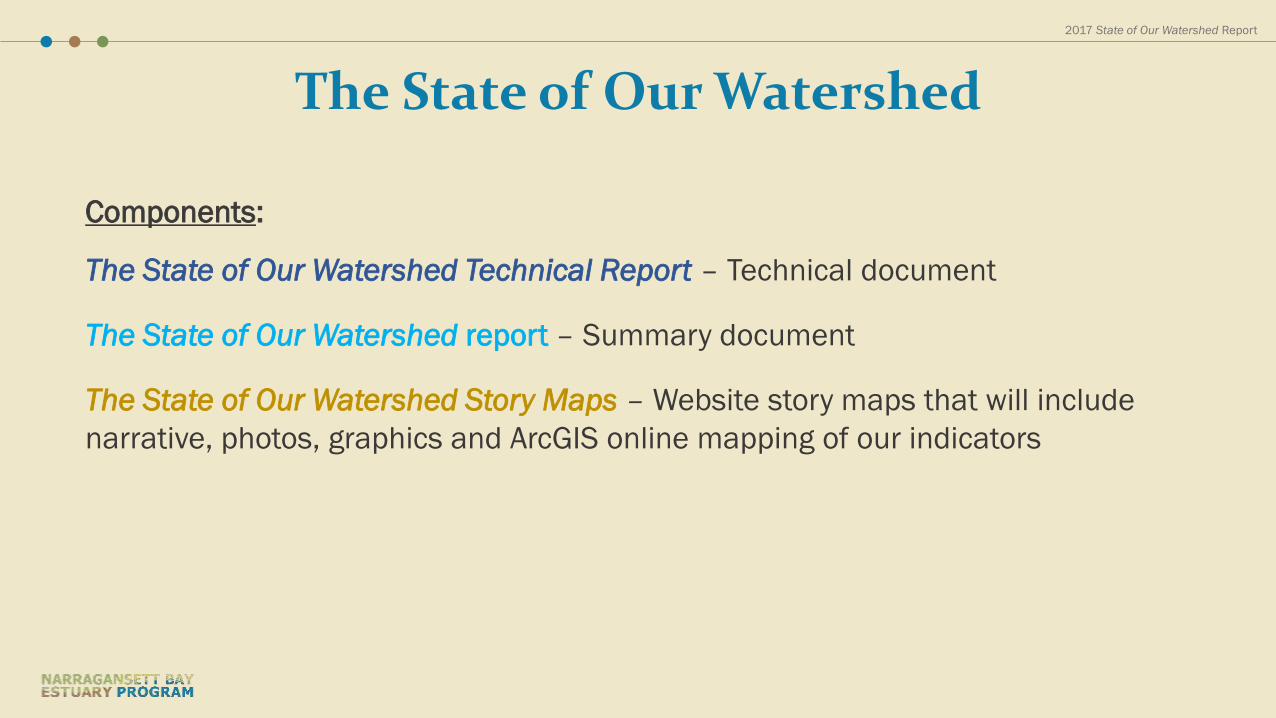
Components:
The State of Our Watershed Technical Report – Technical document
The State of Our Watershed report – Summary document
The State of Our Watershed Story Maps – Website story maps that will include
narrative, photos, graphics and ArcGIS online mapping of our indicators
2017 State of Our Watershed Report
The State of Our WatershedGeographic Scope
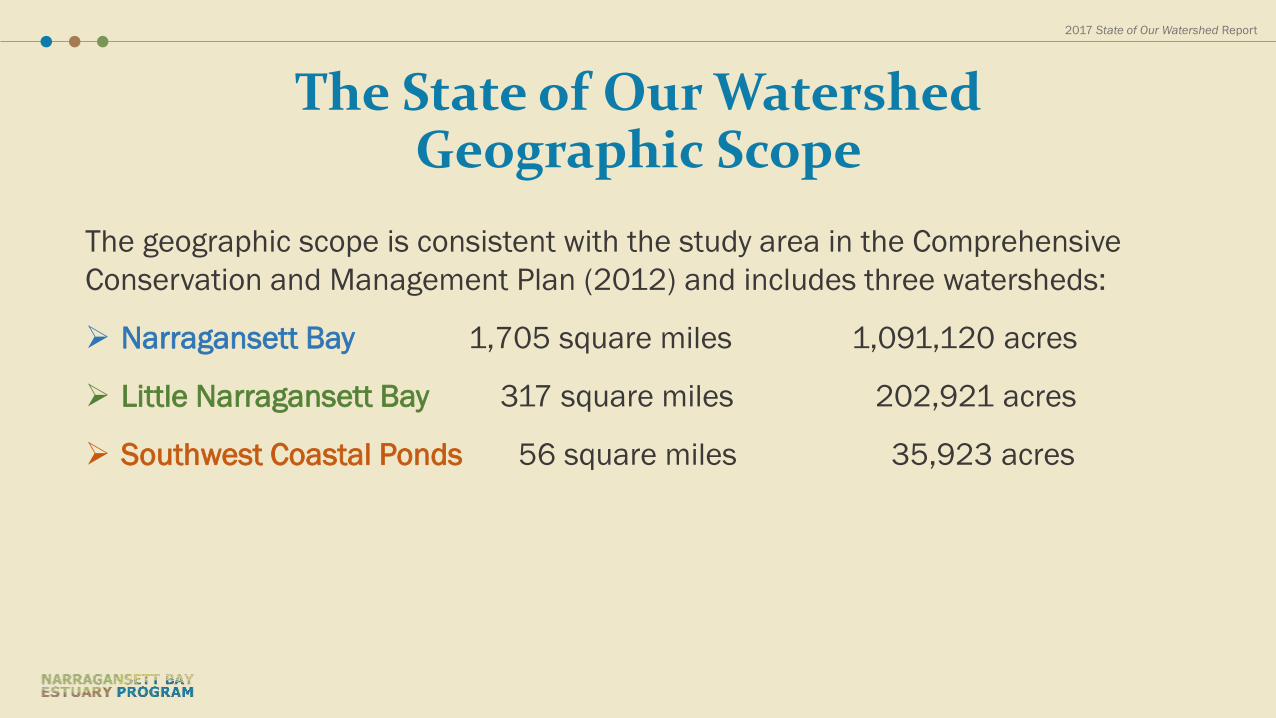
The geographic scope is consistent with the study area in the Comprehensive
Conservation and Management Plan (2012) and includes three watersheds:
Narragansett Bay 1,705 square miles 1,091,120 acres
Little Narragansett Bay 317 square miles 202,921 acres
Southwest Coastal Ponds 56 square miles 35,923 acres
2017 State of Our Watershed Report
The State of Our WatershedGeographic Scales
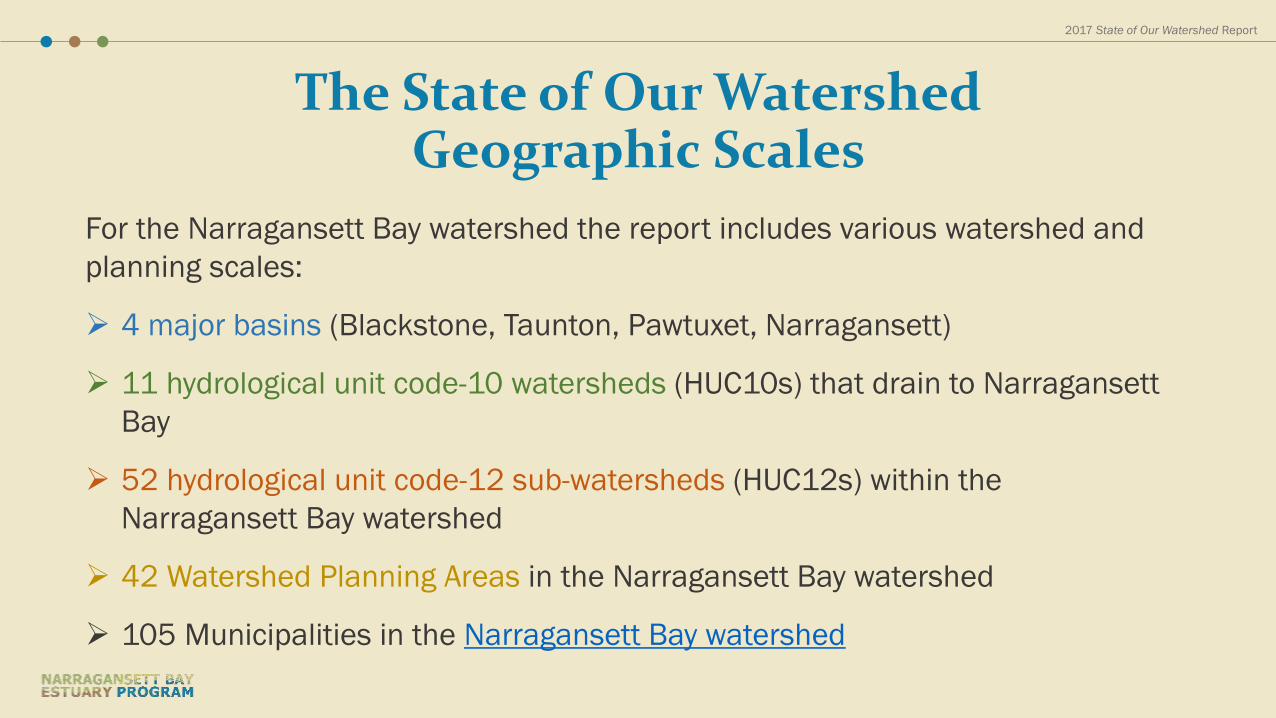
For the Narragansett Bay watershed the report includes various watershed and
planning scales:
4 major basins (Blackstone, Taunton, Pawtuxet, Narragansett)
11 hydrological unit code-10 watersheds (HUC10s) that drain to Narragansett
Bay
52 hydrological unit code-12 sub-watersheds (HUC12s) within the
Narragansett Bay watershed
42 Watershed Planning Areas in the Narragansett Bay watershed
105 Municipalities in the Narragansett Bay watershed
2017 State of Our Watershed Report
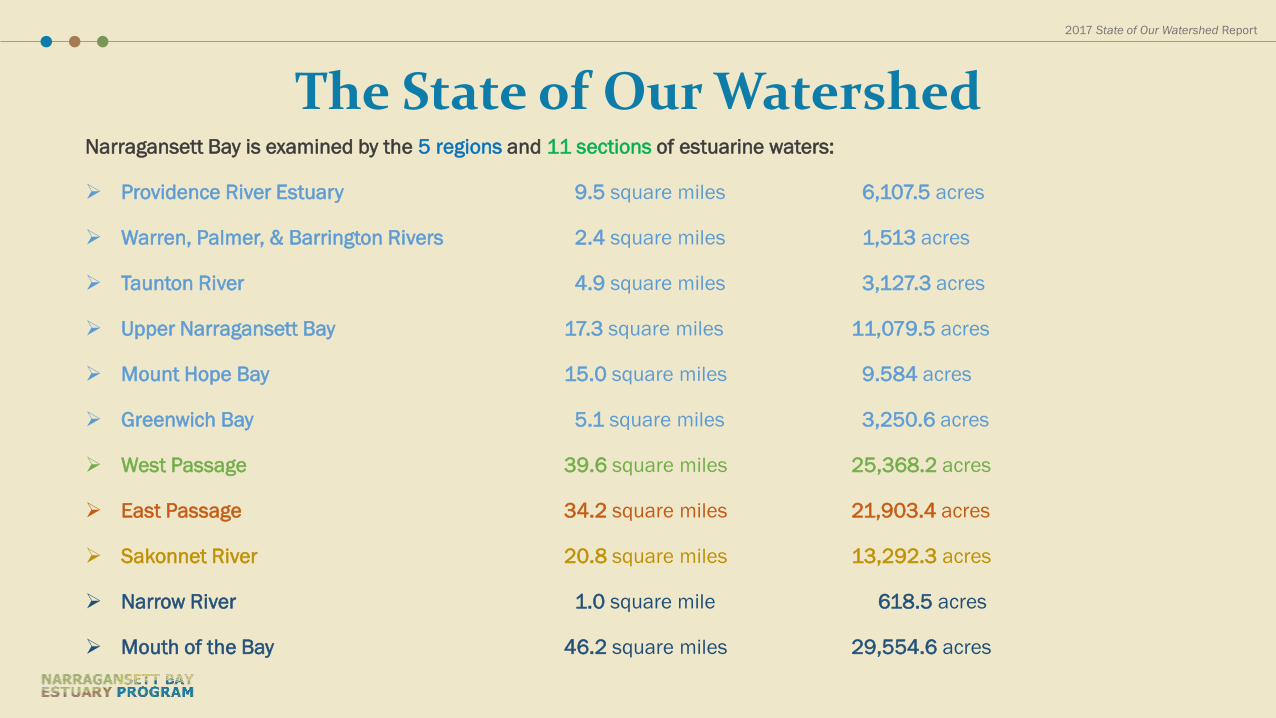
The State of Our WatershedNarragansett Bay is examined by the 5 regions and 11 sections of estuarine waters:
Providence River Estuary 9.5 square miles 6,107.5 acres
Warren, Palmer, & Barrington Rivers 2.4 square miles 1,513 acres
Taunton River 4.9 square miles 3,127.3 acres
Upper Narragansett Bay 17.3 square miles 11,079.5 acres
Mount Hope Bay 15.0 square miles 9.584 acres
Greenwich Bay 5.1 square miles 3,250.6 acres
West Passage 39.6 square miles 25,368.2 acres
East Passage 34.2 square miles 21,903.4 acres
Sakonnet River 20.8 square miles 13,292.3 acres
Narrow River 1.0 square mile 618.5 acres
Mouth of the Bay 46.2 square miles 29,554.6 acres

2017 State of Our Watershed Report
Landscape Stressors
2017 State of Our Watershed Report
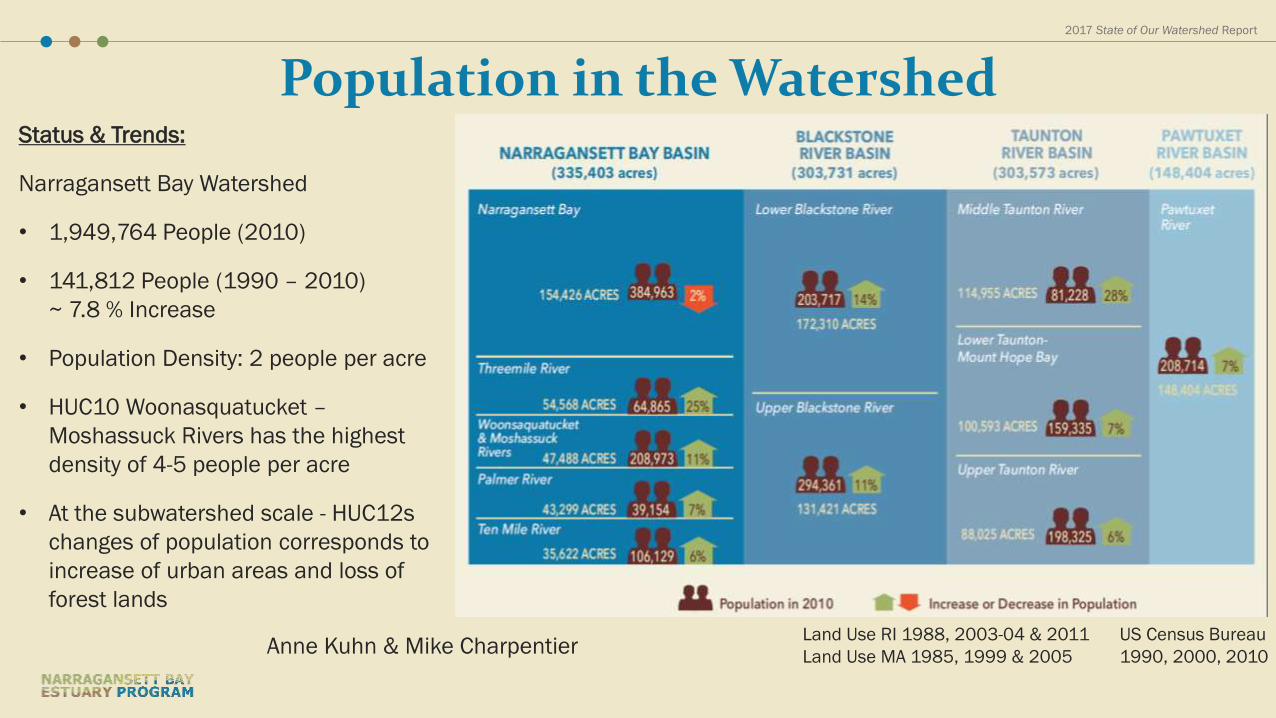
Status & Trends:
Narragansett Bay Watershed
• 1,949,764 People (2010)
• 141,812 People (1990 – 2010)
~ 7.8 % Increase
• Population Density: 2 people per acre
• HUC10 Woonasquatucket –
Moshassuck Rivers has the highest
density of 4-5 people per acre
• At the subwatershed scale - HUC12s
changes of population corresponds to
increase of urban areas and loss of
forest lands
Population in the Watershed
Anne Kuhn & Mike Charpentier Land Use RI 1988, 2003-04 & 2011
Land Use MA 1985, 1999 & 2005
US Census Bureau
1990, 2000, 2010

2017 State of Our Watershed Report
Land Use
6.2%
2.1%
Status & Trends:
• Forest Lands: 424,642 Acres (39%)
2001 – 2011 Decline: 19,158 Acres (4%)
• Urban Areas: 379,804 Acres (35%)
2001 – 2011 Gain: 29,435 Acres (8%)
• HUC10s
Ten Mile River (-871 Acres) and Upper
Taunton River (-2,797 Acres) largest forest
lands decline by 9%
Middle Taunton River (+3,826 Acres)
largest urban increase by 18%
-3.0%
-1.4%
Anne Kuhn & Mike Charpentier National Land Cover Dataset: Resolution 30m
2017 State of Our Watershed Report
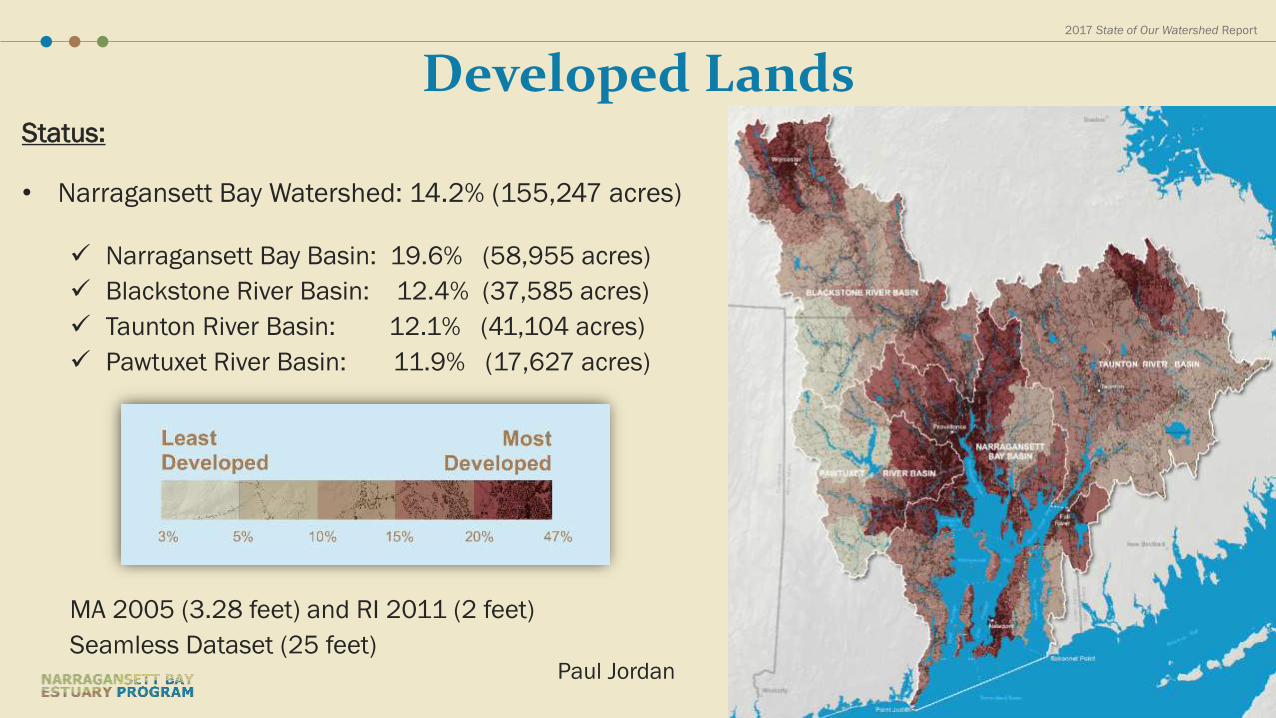
Developed LandsStatus:
• Narragansett Bay Watershed: 14.2% (155,247 acres)
Narragansett Bay Basin: 19.6% (58,955 acres)
Blackstone River Basin: 12.4% (37,585 acres)
Taunton River Basin: 12.1% (41,104 acres)
Pawtuxet River Basin: 11.9% (17,627 acres)
MA 2005 (3.28 feet) and RI 2011 (2 feet)
Seamless Dataset (25 feet)Paul Jordan

2017 State of Our Watershed Report
WastewaterStatus:
Estimated Number of Buildings Served by:
• Sewer Systems: 454,283 (~67%)
• Septic Systems: 221,422 (~33%)
• Hotspots: 90% higher than densities in the rest of the
watershed (within 1 hectare)
Juliet Swigor, Brian Moore, Jennifer
Ryan & Jonathan Zwarg

2017 State of Our Watershed Report
Nutrient Loading
URI-GSO, NBC, RIDEM, USEPA,
MassDEP, UBWPAD, CDM
Smith, UMass-Amherst,
McLaughlin Research Corp.
Status & Trends:
Total WWTF Loading
• 2004: 11,196 thou lbs/yr
• 2015: 4,825 thou lbs/yr
• Percent change: 57%

2017 State of Our Watershed Report
Nutrient Loading
Trends:
Since 1980s
• Loadings decreased by
half
• Largest decreases in
rivers and WWTF
discharge
• NPS have become
relatively more important
2017 State of Our Watershed Report
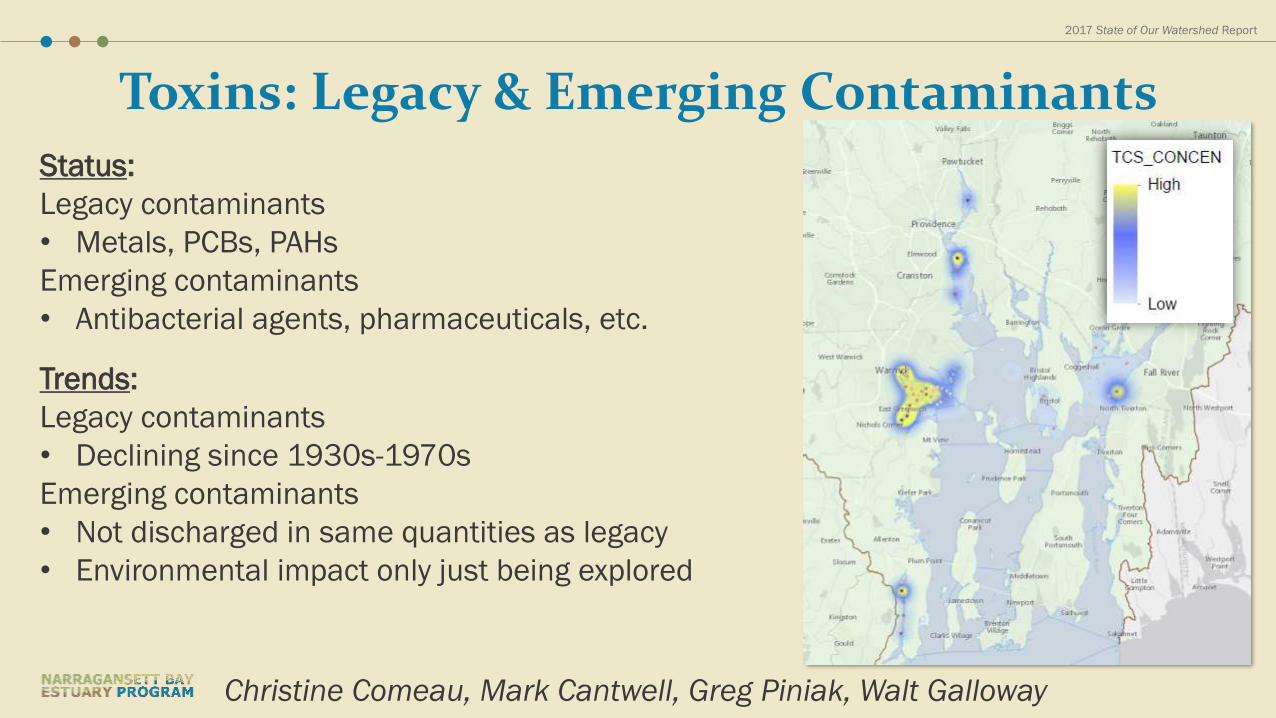
Toxins: Legacy & Emerging Contaminants
Status:
Legacy contaminants
• Metals, PCBs, PAHs
Emerging contaminants
• Antibacterial agents, pharmaceuticals, etc.
Trends:
Legacy contaminants
• Declining since 1930s-1970s
Emerging contaminants
• Not discharged in same quantities as legacy
• Environmental impact only just being explored
Christine Comeau, Mark Cantwell, Greg Piniak, Walt Galloway
2017 State of Our Watershed Report
Climates Change Stressors
2017 State of Our Watershed Report
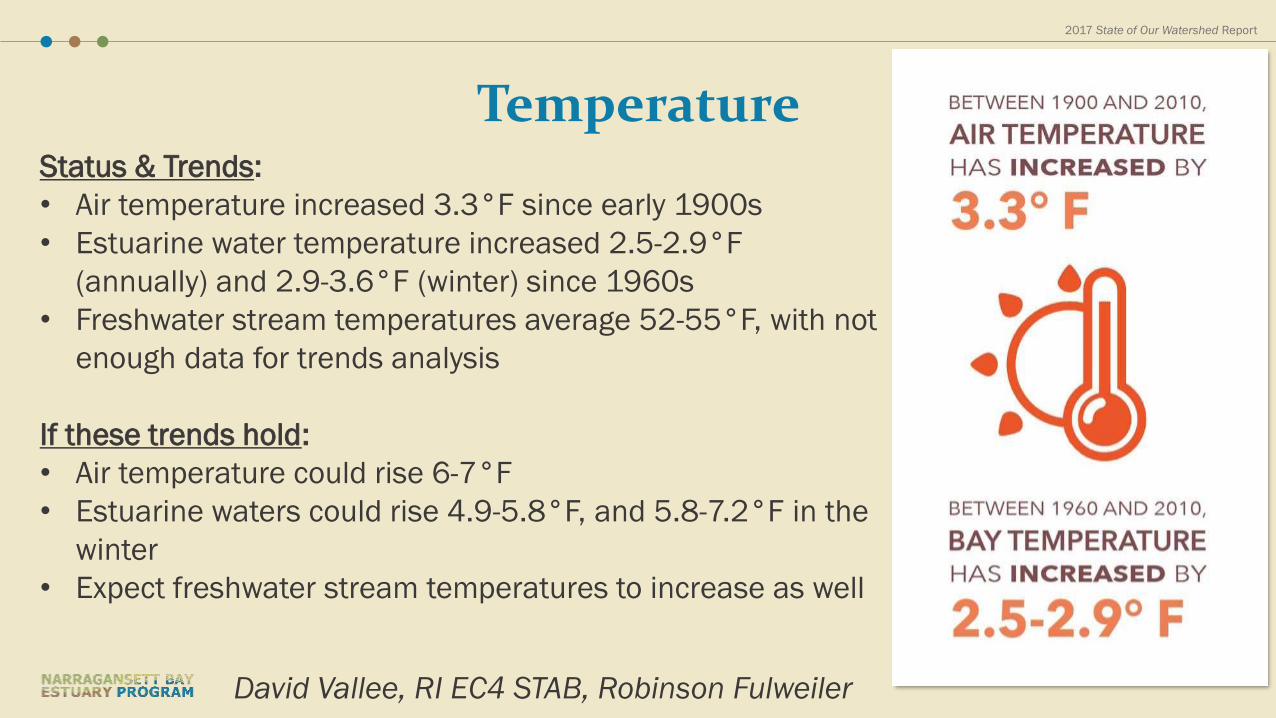
TemperatureStatus & Trends:
• Air temperature increased 3.3°F since early 1900s
• Estuarine water temperature increased 2.5-2.9°F
(annually) and 2.9-3.6°F (winter) since 1960s
• Freshwater stream temperatures average 52-55°F, with not
enough data for trends analysis
If these trends hold:
• Air temperature could rise 6-7°F
• Estuarine waters could rise 4.9-5.8°F, and 5.8-7.2°F in the
winter
• Expect freshwater stream temperatures to increase as well
David Vallee, RI EC4 STAB, Robinson Fulweiler
2017 State of Our Watershed Report
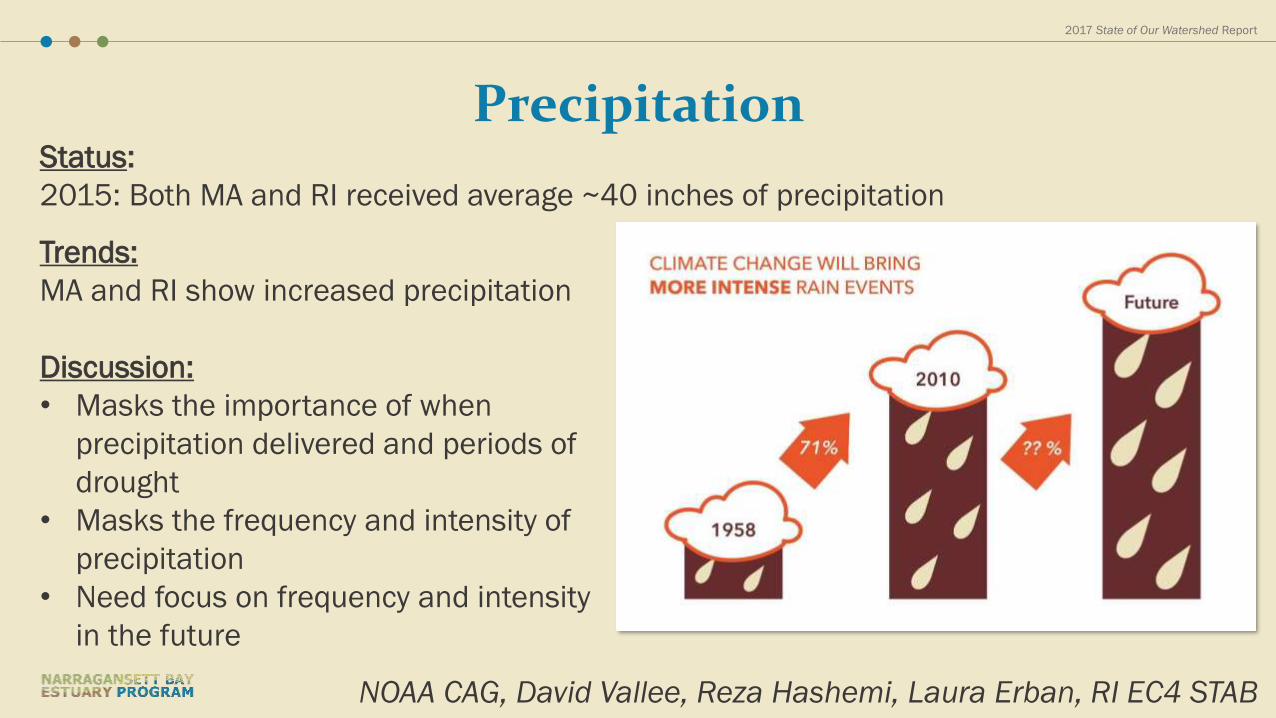
PrecipitationStatus:
2015: Both MA and RI received average ~40 inches of precipitation
Trends:
MA and RI show increased precipitation
Discussion:
• Masks the importance of when
precipitation delivered and periods of
drought
• Masks the frequency and intensity of
precipitation
• Need focus on frequency and intensity
in the future
NOAA CAG, David Vallee, Reza Hashemi, Laura Erban, RI EC4 STAB

2017 State of Our Watershed Report
Sea Level
1930
2015
2050
2100 6.6 Feet above 1990 Sea Levels as Ice Sheets melts more rapidly
Sea Level 85 years ago+9”
+ 2” sea level raise every 10 yearsNarragansett Bay
King Tide
Sea Level Rise Trends:
• Global: 1.3 inches per Decade (1993 – 2010)
• Newport Tide Gauge: 1.1 inch per Decade (1930 – 2015)
• NOAA Future SLR Projections: 6.6 feet by 2100 above
1990 levels
• Plus Storm Surge
Current and Future Impacts:
• Nuisance Flooding: Already occurring during extreme tide
events (King Tide) 2.16’ above MHHW ~ 10.5’ water levels
• Saltmarsh loss: 52-87%
Jim Boyd and Jim Tobey
Barrington River
Storm
Surge
Storm
Surge

2017 State of Our Watershed Report
Bay Ecosystem Indicators
2017 State of Our Watershed Report
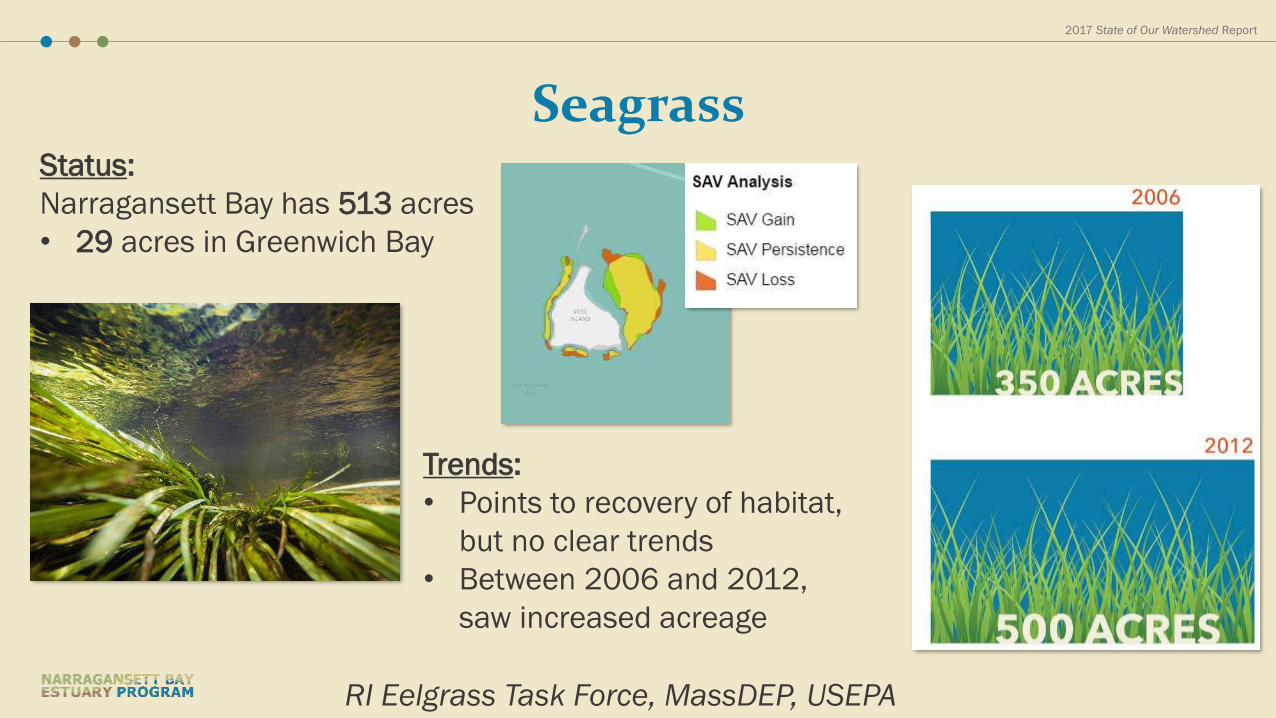
SeagrassStatus:
Narragansett Bay has 513 acres
• 29 acres in Greenwich Bay
RI Eelgrass Task Force, MassDEP, USEPA
Trends:
• Points to recovery of habitat,
but no clear trends
• Between 2006 and 2012,
saw increased acreage
2017 State of Our Watershed Report
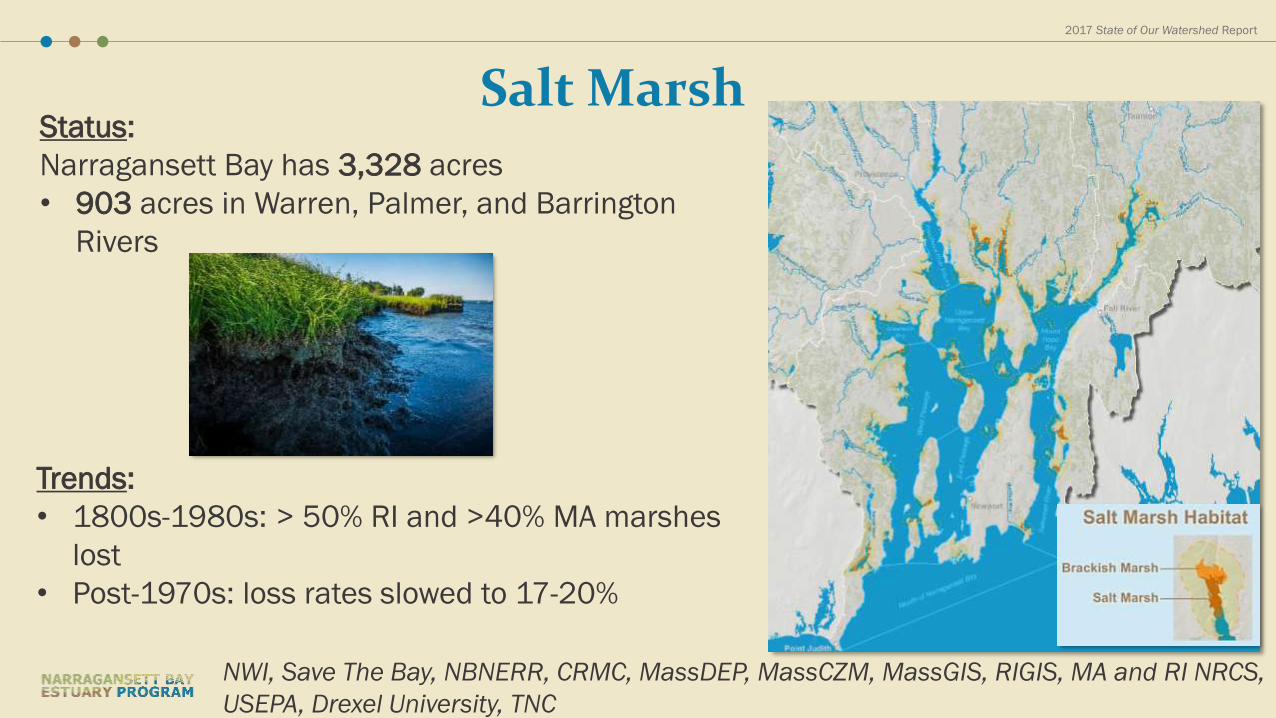
Salt MarshStatus:
Narragansett Bay has 3,328 acres
• 903 acres in Warren, Palmer, and Barrington
Rivers
NWI, Save The Bay, NBNERR, CRMC, MassDEP, MassCZM, MassGIS, RIGIS, MA and RI NRCS,
USEPA, Drexel University, TNC
Trends:
• 1800s-1980s: > 50% RI and >40% MA marshes
lost
• Post-1970s: loss rates slowed to 17-20%

2017 State of Our Watershed Report
Benthic HabitatsStatus & Trends:
1988-2008: benthic habitat quality improved
• Providence River Estuary: 8/10 stations
changed
• Shallow Embayments: 6/10 stations changed
• Open Bay: 10/18 stations changed
1988-2008: Ampelisa spp. increased > 5-fold
and expanded into the Providence River Estuary
Emily Shumchenia, Marissa Guarinello,
John King co-wrote the peer-reviewed article
on which this report is based

2017 State of Our Watershed Report
Fish Species CommunitiesStatus & Trends:
• Warm water species used to come in pulses, now
coming and staying for longer periods of time
• Lobster population increased through the 1980s then
collapsed
Changes linked to:
• Warming temperatures
• Pollution
• Fishing pressures
• Habitat loss
Emily Shumchenia, Eric Schneider, Jason McNamee, Scott Olszewski, Jeremy Collie
2017 State of Our Watershed Report
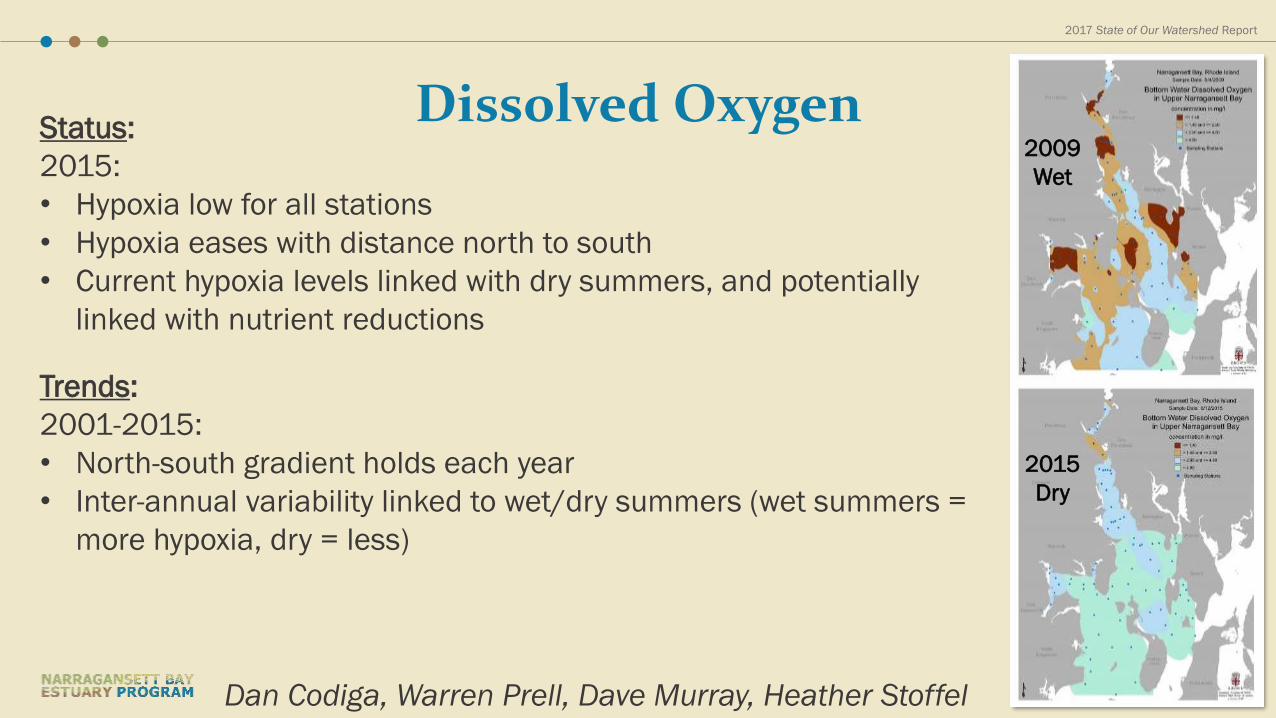
Dissolved OxygenStatus:
2015:
• Hypoxia low for all stations
• Hypoxia eases with distance north to south
• Current hypoxia levels linked with dry summers, and potentially
linked with nutrient reductions
Trends:
2001-2015:
• North-south gradient holds each year
• Inter-annual variability linked to wet/dry summers (wet summers =
more hypoxia, dry = less)
Dan Codiga, Warren Prell, Dave Murray, Heather Stoffel
2009
Wet
2015
Dry
2017 State of Our Watershed Report
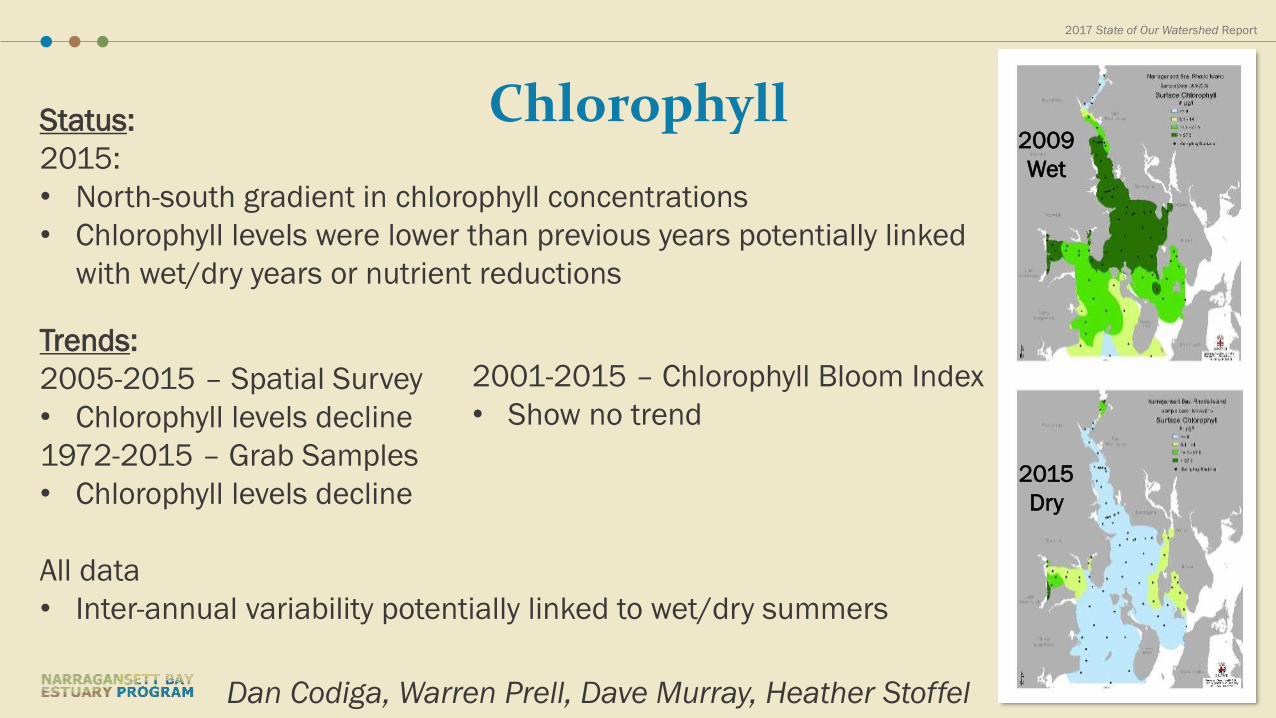
ChlorophyllStatus:
2015:
• North-south gradient in chlorophyll concentrations
• Chlorophyll levels were lower than previous years potentially linked
with wet/dry years or nutrient reductions
Trends:
2005-2015 – Spatial Survey
• Chlorophyll levels decline
1972-2015 – Grab Samples
• Chlorophyll levels decline
All data
• Inter-annual variability potentially linked to wet/dry summers
Dan Codiga, Warren Prell, Dave Murray, Heather Stoffel
2009
Wet
2015
Dry
2001-2015 – Chlorophyll Bloom Index
• Show no trend

2017 State of Our Watershed Report
Water ClarityStatus:
2014:
• Improved along a north-south
gradient
• In winter, clarity similar for all
stations along the gradient
Trends:
1972-2015:
• Clarity improved by ~30% in Mid-Narragansett Bay
2007-2014:
• Clarity declined until 2012, then improved to 2014 in the
Providence River & Upper Bay
• Potentially linked to summer precipitation levels and
reductions in nutrient pollution
NBC, URI-GSO, RIDEM, NBNERR
2017 State of Our Watershed Report
Watershed Ecosystem Indicators

2017 State of Our Watershed Report
Stream Invertebrates78 riffle sites are assessed in Narragansett Bay watershed
Status 59 of 78 are excellent or good
Katie DeGoosh &
Robert Nuzzo
How is the habitat?
How is the Biological Community?
Healthy Slightly
Unhealthy
Moderately
Disturbed
Very
Disturbed
Excellent 59 sites 18 sites
Good
Fair 1 site
Poor
This can indicate: Good Water Quality Poor Water Quality
2017 State of Our Watershed Report
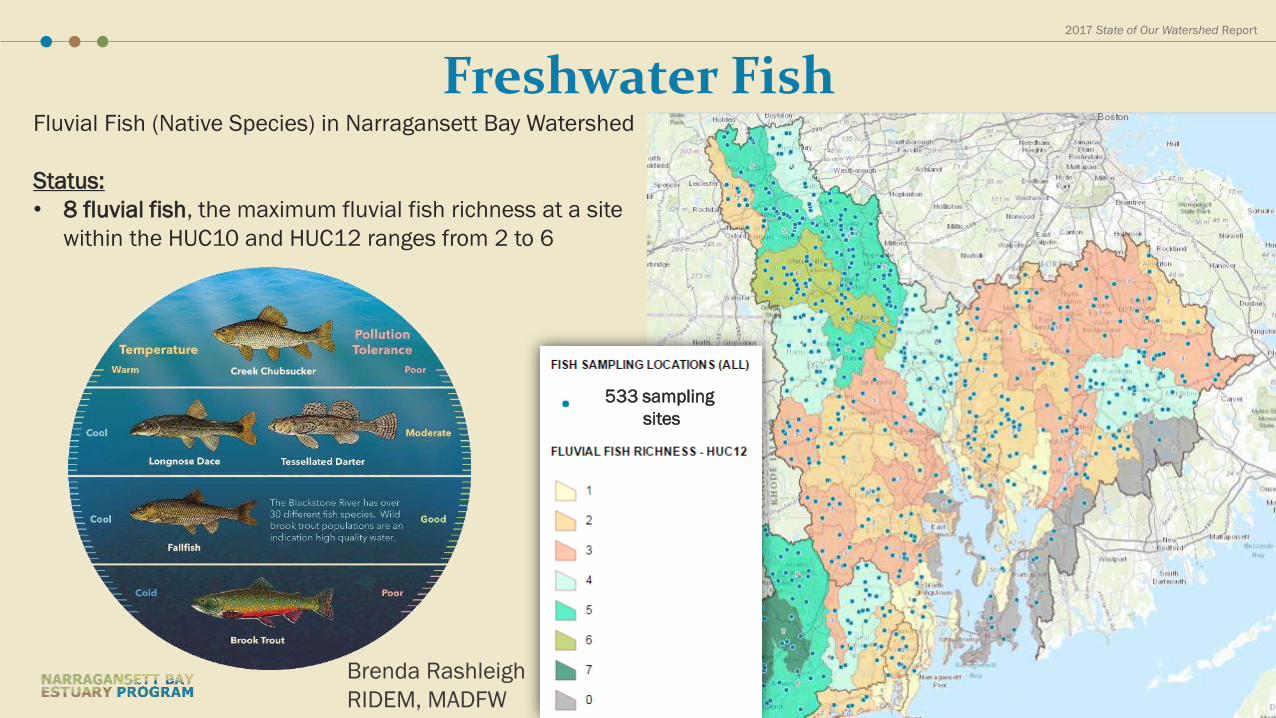
Freshwater FishFluvial Fish (Native Species) in Narragansett Bay Watershed
Status:
• 8 fluvial fish, the maximum fluvial fish richness at a site
within the HUC10 and HUC12 ranges from 2 to 6
Brenda Rashleigh
RIDEM, MADFW
533 sampling
sites
2017 State of Our Watershed Report
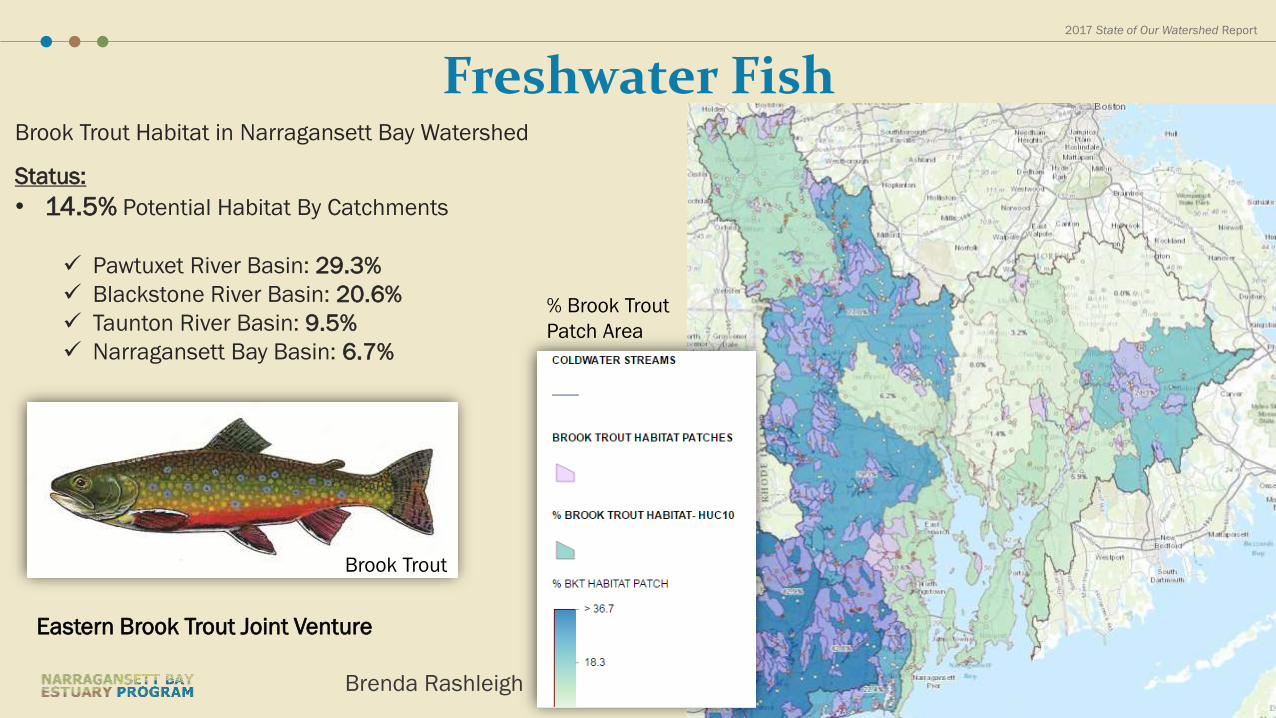
Freshwater FishBrook Trout Habitat in Narragansett Bay Watershed
Brenda Rashleigh
% Brook Trout
Patch Area
Brook Trout
Status:
• 14.5% Potential Habitat By Catchments
Pawtuxet River Basin: 29.3%
Blackstone River Basin: 20.6%
Taunton River Basin: 9.5%
Narragansett Bay Basin: 6.7%
Eastern Brook Trout Joint Venture

2017 State of Our Watershed Report
Assessed:
• Estuarine:156 sq. miles
(80% of the Bay)
• Rivers and Streams:
1,345 miles (38% of NHD)
• Ponds and Lakes:
390 (34,830 acres)
Status:
• Acceptable conditions: 56 sq. miles of the Bay, 450 miles of
streams, and 17 ponds
• Impacted by Nutrient Related Pollutants: 57 sq. miles of the Bay,
166 miles of streams, and 48 ponds
• Unknown conditions: 41 sq. miles of the Bay, 506 miles of
streams, and 47 ponds
Major Basins:
• Entire Blackstone River and Upper Estuary are impacted by
Nutrients and Low DO
Water Quality and Aquatic Life
RIDEM and MADEP
2017 State of Our Watershed Report
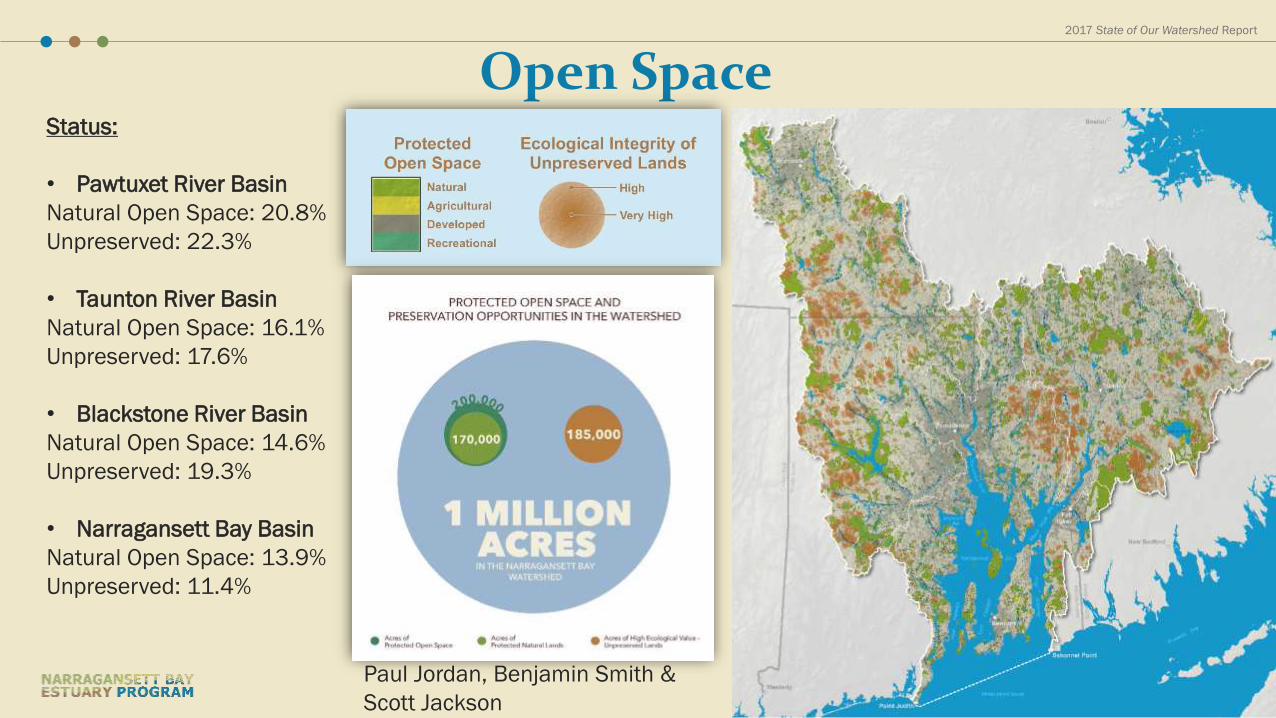
Open SpaceStatus:
• Pawtuxet River Basin
Natural Open Space: 20.8%
Unpreserved: 22.3%
• Taunton River Basin
Natural Open Space: 16.1%
Unpreserved: 17.6%
• Blackstone River Basin
Natural Open Space: 14.6%
Unpreserved: 19.3%
• Narragansett Bay Basin
Natural Open Space: 13.9%
Unpreserved: 11.4%
Paul Jordan, Benjamin Smith &
Scott Jackson

2017 State of Our Watershed Report
Public Health Indicators

2017 State of Our Watershed Report
# Closure Events and Frequency (2004 – 2015)
38 Saltwater Beaches in Narragansett Bay
Status & Trends:
• # Closure events in 2015: 44 at 18 Beaches
• Regular Frequency: 25 Beaches
Most closures and changes have occurred in the Upper Estuary:
Providence River, Greenwich Bay, Mount Hope Bay
• 14 have shown slightly decline and 10 slightly increase on
closure events
• Irregular Frequency: 11 Beaches
• No closures: 1 Beach
Swimming at Our Beaches
RI Department of Health
MA Department of Public Health
2017 State of Our Watershed Report
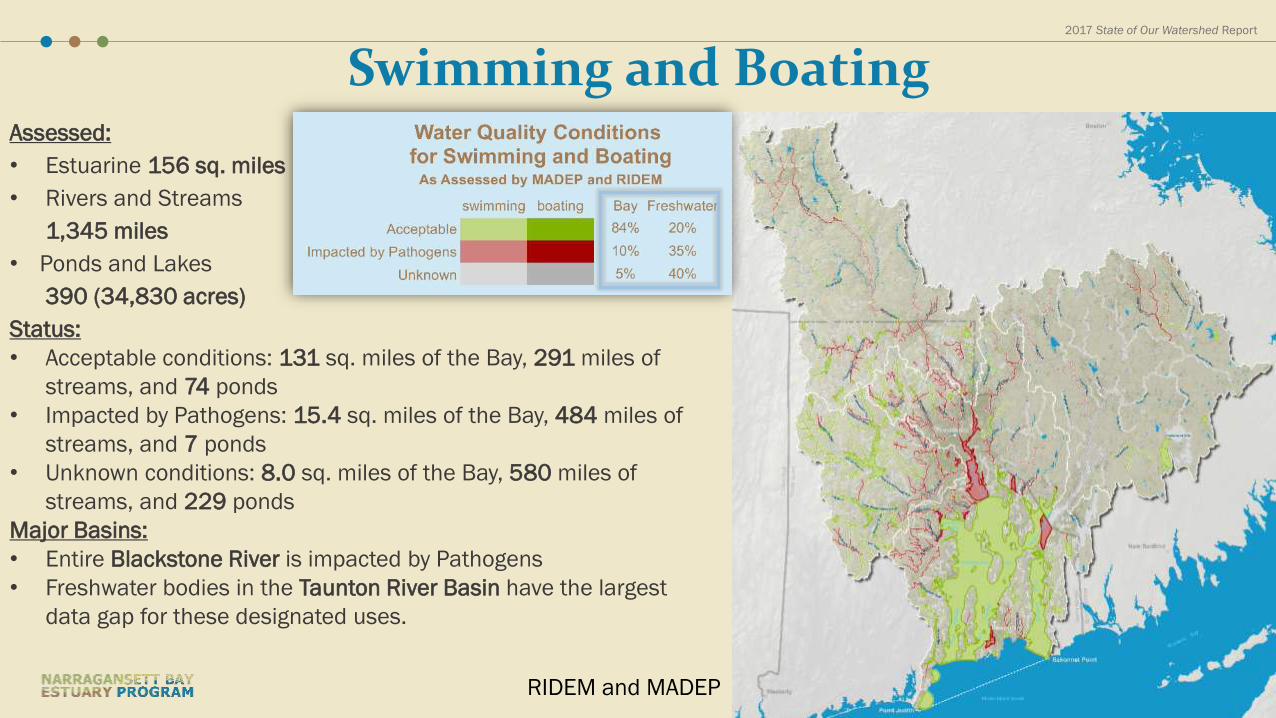
Swimming and BoatingAssessed:
• Estuarine 156 sq. miles
• Rivers and Streams
1,345 miles
• Ponds and Lakes
390 (34,830 acres)
Status:
• Acceptable conditions: 131 sq. miles of the Bay, 291 miles of
streams, and 74 ponds
• Impacted by Pathogens: 15.4 sq. miles of the Bay, 484 miles of
streams, and 7 ponds
• Unknown conditions: 8.0 sq. miles of the Bay, 580 miles of
streams, and 229 ponds
Major Basins:
• Entire Blackstone River is impacted by Pathogens
• Freshwater bodies in the Taunton River Basin have the largest
data gap for these designated uses.
RIDEM and MADEP
2017 State of Our Watershed Report
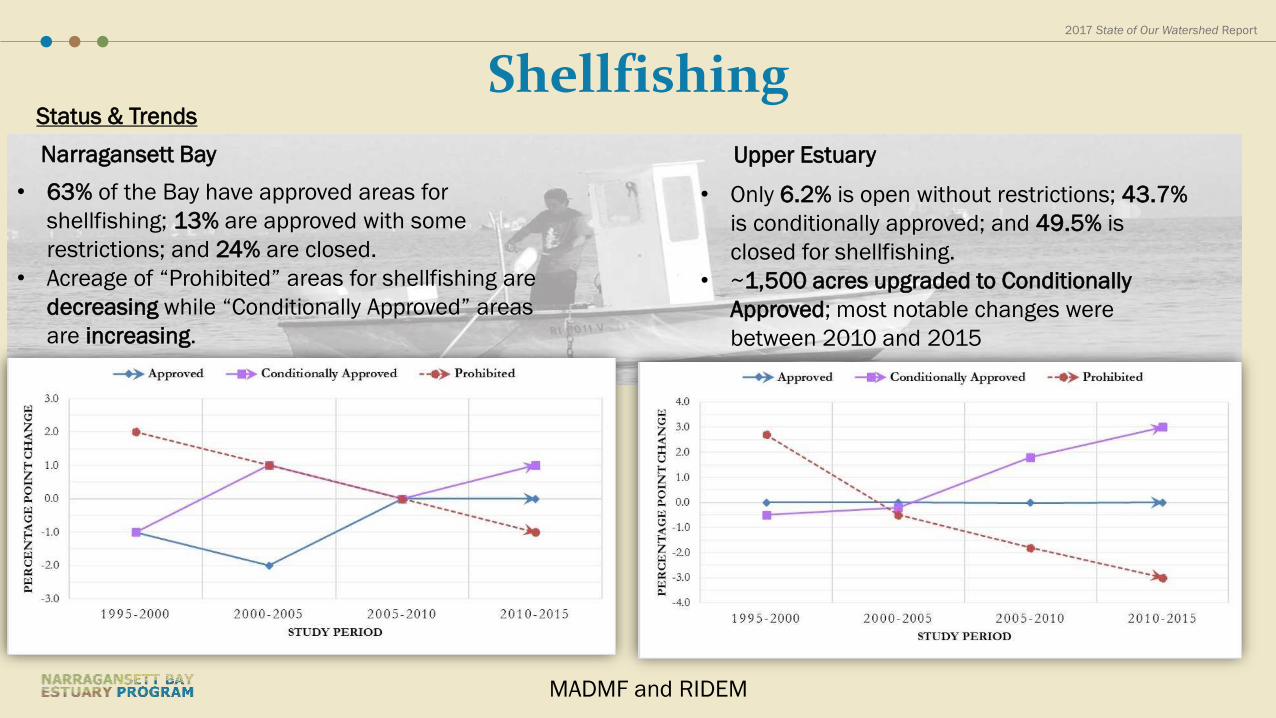
Shellfishing
• 63% of the Bay have approved areas for
shellfishing; 13% are approved with some
restrictions; and 24% are closed.
• Acreage of “Prohibited” areas for shellfishing are
decreasing while “Conditionally Approved” areas
are increasing.
• Only 6.2% is open without restrictions; 43.7%
is conditionally approved; and 49.5% is
closed for shellfishing.
• ~1,500 acres upgraded to Conditionally
Approved; most notable changes were
between 2010 and 2015
MADMF and RIDEM
Narragansett Bay Upper Estuary
Status & Trends