Embed Size (px)
Citation preview

TAQA Annual Report 2020
POWERING A THRIVING
FUTUREAnnual Report 2020
Our Business 1-11About Us 1
2020 Operational Highlights 4
At a Glance 6
Business Model 10
Strategic Review 12-19Chairman’s Statement 12
Group CEO & Managing Director’s Statement 14
Strategic Review 16
Operational Review 20-33Generation 20
Transmission and Distribution 22
Oil and Gas 24
Health, Safety, Security and Environment 26
Our People 28
Corporate Social Responsibility 30
Financial Review 34-35Financial Highlights 34
Control Environment 36-47Board of Directors 36
Executive Management 38
Corporate Governance 40
Financial Statements 48-120Report of the Board of Directors 48
Proforma Financial Information 50
Proforma Consolidated Statement of Profit or Loss 51
Proforma Consolidated Statement of Financial Position 52
Independent Auditor’s Report 53
Consolidated Statement of Profit or Loss 56
Consolidated Statement of Comprehensive Income 57
Consolidated Statement of Financial Position 58
Consolidated Statement of Changes in Equity 60
Consolidated Statement of Cash Flows 61
Notes to the Consolidated Financial Statements 63
Glossary 120
OUR PURPOSEPowering a thriving future by efficiently providing sustainable and reliable energy and water to unleash the unlimited potential of people and places.
OUR VISIONTo be the sustainable energy champion and power and water partner of choice for business, government and society.
As Abu Dhabi’s integrated utilities leader, we are building an inspiring tomorrow for our people, our partners and our shareholders.
OUR MISSIONWe innovatively develop, generate, transmit and distribute energy and water efficiently and affordably to the communities and industries that rely on us to thrive.
We leverage our scale, agility and financial strength to be a leading representative of Abu Dhabi’s vision of progress, collaboration and a sustainable future.

1TAQA Annual Report 2020
Strategic Review Operational Review Financial Review Control Environment Financial StatementsOur Business
ABOUT US
TAQA has significant investments in power and water generation, transmission and distribution assets, as well as upstream and midstream oil and gas operations.
TAQA has operations in the UAE, Canada, Ghana, India, Iraq, Morocco, the Netherlands, Oman, Saudi Arabia, the United Kingdom and the United States.
In 2020, a historic transaction between TAQA and Abu Dhabi Power Corporation (ADPower) brought the majority of Abu Dhabi’s power and water generation, transmission and distribution assets under single management for the first time. This transaction made TAQA one of the largest utilities companies in the GCC.
We are a purpose-led business with a clear sense of the values for which we stand and the future we want to help to create.
In everything we do, we are committed to supporting Abu Dhabi’s drive to harness and champion clean energy technologies in all aspects of the generation, transmission and distribution of the Emirate’s power and water. We are also committed to providing essential energy and water services to the communities in which we operate across the world.
We are proud of the work we do to support people and communities throughout the world.
TAQA IS A DIVERSIFIED UTILITIES AND ENERGY GROUP HEADQUARTERED IN ABU DHABI AND LISTED ON THE ABU DHABI SECURITIES EXCHANGE (ADX). We are one of the largest publicly traded companies in the UAE by market capitalization, and one of the top ten largest integrated utility companies in Europe, the Middle East and Africa (EMEA).

2 TAQA Annual Report 2020
ABOUT US (CONTINUED)
TAQA was formed in 2005, following the privatization of Abu Dhabi’s power and water sector, and we were listed on ADX, the Abu Dhabi Stock Exchange in the same year. Over the following years, we began pursuing opportunities in new geographies and established operations in Canada, Ghana, India, Iraq, Morocco, the Netherlands, Oman, Saudi Arabia, the United Kingdom and the United States.
In July 2020, ADPower (our majority shareholder) combined a significant number of its assets with those of TAQA to create a single integrated utility business with the scale, financial capability and expertise to play a decisive role in leading the transition to clean energy sources in Abu Dhabi and beyond.
Today, TAQA is one of the EMEA region’s ten largest integrated utilities businesses.
2005Founded as a public joint stock company by Abu Dhabi Water and Electricity Authority owning interests in power and water assets in the UAE, and listed on the Abu Dhabi Stock Exchange.
2010Acquired interest of Abu Dhabi Water and Electricity Authority in Sohar Aluminium Company LLC, Oman.
2009TAQA began operating the Brent System oil pipelines in the UK, commenced expansion into North America and started oil exploration in the Kurdistan region of Iraq.
2007TAQA’s power portfolio was expanded to include operations in Ghana, India, Morocco and Saudi Arabia.
2006-2008TAQA began to transform from a UAE-based power and water company into an international energy company, commencing operations in the United Kingdom and the Netherlands.
OUR HISTORY

3TAQA Annual Report 2020
Strategic Review Operational Review Financial Review Control Environment Financial StatementsOur Business
2020FEBRUARY• Offer from ADPower to the TAQA Board of
Directors for transfer of majority of its power and water generation, transmission and distribution assets to TAQA in return of shares in TAQA.
• Under the transaction, TAQA would receive the majority of ADPower’s power and water generation and transmission and distribution assets in return for issuing shares to ADPower (increasing its shareholding in TAQA to 98.6%).
APRIL• ADPower’s offer was approved by the TAQA Board
of Directors.
JULY• The foregoing transaction between TAQA and
ADPower closed.
• Moody’s TAQA standalone/final credit ratings were upgraded (to baa1/Aa3 with stable outlook).
• Fitch’s TAQA standalone/final credit ratings were upgraded (to bbb+/AA- with stable outlook).
2013Acquisition of BP’s Harding and Brae interests in the northern North Sea.
2014Business Transformation: focused on safe and efficient operations driving significant change to the organization.

4 TAQA Annual Report 2020
2020 HIGHLIGHTS

5TAQA Annual Report 2020
Strategic Review Operational Review Financial Review Control Environment Financial StatementsOur Business
Total water desalination capacity
913Total electrical generation capacity
23 GW MIGDwith 200 MIGD under development
with 4.4 GW under development
11 countries with operations
95% of Abu Dhabi’s water and power supply
Power from renewable energy
1 MNcustomers in the UAE
GWwith 2 GW under development
1.4
KM80K 18Kelectricity networks
KMof water pipelines
Moody’s credit ratings outlook
Aa3/Fitch’s credit ratings outlook
AA-/STABLE STABLE
40% of Morocco’s electricity requirements met
Net income contribution to group from transmission and distribution
MN3,949AED
One notch below Abu Dhabi sovereign credit rating of Aa2 with stable outlook
One notch below Abu Dhabi sovereign credit rating of AA with stable outlook

6 TAQA Annual Report 2020
AT A GLANCE
AL DHAFRAREGION
ABU DHABIREGION
AL AINREGION
NORTHERNEMIRATES
12
34
6
5
TRANSMISSION ABU DHABI TRANSMISSION & DESPATCH COMPANY (TRANSCO) TRANSCO is responsible for the development, operations and maintenance of high-voltage power and bulk water transmission networks within Abu Dhabi and beyond. TRANSCO provides secure, sustainable, economic and reliable transmission networks that connect generation companies to distribution companies, as well as other end-users.
DISTRIBUTION ABU DHABI DISTRIBUTION COMPANY (ADDC) ADDC plans, operates, maintains and owns network distribution assets and directly interfaces with water and electricity customers in Abu Dhabi’s central and Al Dhafra regions, leveraging technical expertise and best-practice customer-care solutions. Through innovation and continuous enhancements, ADDC ensures water and electricity flow to more than 600,000 service points through a smart, robust, efficient and sustainable distribution network.
AL AIN DISTRIBUTION COMPANY (AADC) AADC plans, operates, maintains and owns network distribution assets and directly interfaces with water and electricity customers in the Al Ain region east of Abu Dhabi, leveraging technical expertise and best-practice customer-care solutions. Through innovation and continuous enhancements, AADC ensures water and electricity flow to more than 250,000 customers through a smart, robust, efficient and sustainable distribution network.
UAE OPERATIONS
GENERATION See map below for more details.
95%Meeting more than 95% of Abu Dhabi’s power and water needs

7TAQA Annual Report 2020
Strategic Review Operational Review Financial Review Control Environment Financial StatementsOur Business
1
SHUWEIHAT S1 • Combined-cycle power plant and water
desalination facility • Gross power capacity of 1.6 GW • Gross water desalination capacity of 101 MIGD• TAQA (60%), ENGIE (20%) and Sumitomo (20%)
SHUWEIHAT S2 • A combined-cycle power plant and multi-stage flash
desalination plant • Gross power capacity of 1.6 GW • Gross water desalination capacity of 101 MIGD • TAQA (60%), ENGIE (20%), Marubeni (10%) and
Osaka Gas (10%)
SHUWEIHAT S3 • A combined-cycle power plant comprising two
power blocks • Gross power capacity of 1.6 GW • TAQA (60%), Sumitomo (20.4%) and KEPCO (19.6%)
2
MIRFA INTERNATIONAL POWER AND WATER PLANT • Combined-cycle power plant and a modular reverse
osmosis and three multi-stage flash desalination units.• Gross power capacity of 1.7 GW • Gross water desalination capacity of 53 MIGD • TAQA (60%), ADFG (20%) and ENGIE (20%)
3
UMM AL NAR• A combined-cycle power plant and multi-stage flash
desalination facility • Gross power capacity of 2.3 GW • Gross water desalination capacity of 96 MIGD • TAQA (60% in the new Um Al Nar plant only), ENGIE (20%)
and Jera (20%)
4
TAWEELAH A1• Combined-cycle power plant and thermal-based water
desalination facility • Gross power capacity of 1.7 GW • Gross water desalination capacity of 84 MIGD • TAQA (60%), ENGIE (20%) and Total (20%)
TAWEELAH A2• The first build own operate project in the UAE • A combined-cycle power plant and multi-stage flash water
desalination facility• Gross power capacity of 760 MW • Gross water desalination capacity of 53 MIGD • TAQA (60%), Marubeni (34%) and JGC Holdings (6%)
TAWEELAH B• Three distinct power generation and desalination facilities,
including simple, open and combined-cycle gas turbines and multi-stage flash distillation
• Gross power capacity of 2.2 GW • Gross water desalination capacity of 162 MIGD • TAQA (60%), Marubeni (14%), BTU Power (10%), Powertek
(10%) and Kyuden (6%)
5
FUJAIRAH F1• Combined-cycle power plant and hybrid multi-stage flash
and reverse osmosis desalination plant• Gross power capacity of 882 MW• Gross water desalination capacity of 131 MIGD• TAQA (60%) and Sembcorp (40%)
FUJAIRAH F2• Combined-cycle power plant and reverse osmosis
desalination plant• Gross power capacity of 2.1 GW• Gross water desalination capacity of 132 MIGD • TAQA (60%) ENGIE (20%) and Marubeni (20%)
6
NOOR AD• Currently the world’s largest single site solar photovoltaic
(PV) plant • Gross power capacity of 1.2 GW • TAQA (60%), Marubeni (20%) and Jinko Power (20%)
ASSETS UNDER DEVELOPMENT FUJAIRAH F3 • Most efficient and largest independent gas-fired power
plant in the UAE • 2.4 GW power generation capacity• TAQA (40%), Mubadala (20%) and Marubeni (40%)
AL DHAFRA SOLAR PV • To become the world’s largest solar power plant • Set world record for lowest tariff for solar power of 1.32 US
cents/kWh• Gross power capacity of 2 GW • TAQA (40%), Masdar (20%), EDF Renewables (20%) and
Jinko Power (20%)
TAWEELAH REVERSE OSMOSIS • Slated to be the world’s largest reverse osmosis
desalination plants • Gross water desalination capacity: 200 MIGD • 50MW of onsite solar generation• TAQA (20%), Mubadala (40%) and ACWA Power (40%)

8 TAQA Annual Report 2020
UNITED STATESLAKEFIELD WIND FARM (MINNESOTA)• 205.5 MW power capacity • 50% TAQA ownership
RED OAK POWER PLANT (NEW JERSEY)• A combined-cycle gas-powered plant• 832 MW power capacity• TAQA owns 85% and Morgan Stanley 15%
of tolling agreement
CANADA • TAQA operated and non-
operated oil and gas assets: • 72,928 BOEPD (63%)
AT A GLANCE (CONTINUED)
We are present across four continents in 11 countries, which include Canada, Ghana, India, Iraq, Morocco, the Netherlands, Oman, Saudi Arabia, the United Arab Emirates, the United Kingdom and the United States.
INTERNATIONAL ASSETS

9TAQA Annual Report 2020
Strategic Review Operational Review Financial Review Control Environment Financial StatementsOur Business
OMANSOHAR ALUMINIUM • 1,000 MW power capacity • Aluminium production capacity:
360,000 metric tons per annum • 40% TAQA ownership (smelter and power
generation facility supplying the smelter)
INDIANEYVELI POWER PLANT• A lignite-fired power plant • 250 MW power capacity • 99.98% TAQA ownership
GHANATAKORADI T2 POWER PLANT• 330 MW power capacity• 90% TAQA ownership
NETHERLANDS• 2 gas storage
facilities and other oil and gas interests
IRAQ• Atrush block in Kurdistan region • TAQA operated • 10,283 bpd (TAQA entitlement) • 47.4% TAQA working interest
SAUDI ARABIAJUBAIL POWER PLANT• This co-generation facility delivers the entire output to
the Saudi Aramco-owned SADAF Petrochemical Plant to fuel its operations
• 250 MW gross installed power capacity • 25% TAQA ownership
MOROCCOJORF LASFAR POWER PLANT• Coal-fired power station • 2GW power capacity• 86% TAQA ownership (Units 1-4) 91% TAQA
ownership (Units 5-6)• Listed on the Casablanca Stock Exchange
UNITED KINGDOM• TAQA operated and non-operated oil
and gas assets (off and onshore) • 30,911 boepd
11COUNTRIES
OPERATIONS IN

10 TAQA Annual Report 2020
BUSINESS MODEL
HOW WE CREATE VALUE
BUSINESS LINESGeneration
Find out more on page 20
Transmission and Distribution
Find out more on page 22
Oil and Gas
Find out more on page 24
STRATEGYFind out more on page 11
PRUDENT RESOURCE ALLOCATIONFind out more on page 33
HOW WE CREATE VALUEWHAT WE LEVERAGE
Power and water generation assets owned and operated directly or through international partners.Find out more on page 20
Regulated network infrastructure assets and high potential for future growth through exclusivity rights in Abu Dhabi.Find out more on page 18
Natural resources including oil fields and gas reserves.Find out more on page 24
Purposeful workforce of more than 7,000 employees across global operations, bringing expertise, skills and innovative ideas.Find out more on page 28
Financial resources from internal cash generation, substantial undrawn credit facilities and access to capital markets through strong investment grade ratings.Find out more on page 34
Strong brand built on a track record of successful portfolio management and efficient and reliable operatorship experience.Find out more on page 1
Enduring relationships with governments, business partners, regulators and communities.Find out more on page 16
PORTFOLIO MANAGEMENTStrategy > Investment Management > Asset Management:
Performance Management, Governance & Assurance, Technical Support & Optimization > Project Management
Find out more on page 1
Find out more on page 36
OUR PURPOSE
OUR VISION
OUR MISSION
OUR VALUES
OUR PEOPLE
�Corporate Governance
�Risk Management
�Ethics & Compliance
Value creation is guided by:
Control environment established through:

11TAQA Annual Report 2020
Strategic Review Operational Review Financial ReviewOur Business Financial StatementsControl Environment
WHAT WE DELIVER
* The UN’s 17 Sustainable Development Goals (SDGs) are central to the UN’s 2030 Agenda for Sustainable Development and are an urgent call for action by all countries.
Our employees deliver value by operating a strategic guided business model with oversight from TAQA Headquarters, while maintaining operatorship flexibility to pursue operational excellence and full regulatory compliance for each jurisdiction.
Building blocks of modern life whether it be power, water or oil and gas, supplied reliably to high quality standards.
Economic growth to the communities and economies in which we operate, providing employment and contract work, paying royalties, taxes, license fees and duties.
Workplace of choice that attracts and retains talent, promotes a strong work culture, prioritizes employee well-being and safety, develops skills and thrives on diversity and inclusion.Find out more on page 28
Social responsibility through our support and actions for the environment and local communities, as well as open engagement and clear governance.Find out more on page 30
Reduced environmental impact as we proactively work towards the transition to clean energy and maintain compliance with heightening environmental regulation.
Shareholder returns through a sustainable dividend policy, value-creation and future monetization options.Find out more on page 48
SUPPORTING UN SDGs*

12 TAQA Annual Report 2020
CHAIRMAN’S STATEMENT
“IN THE CONTEXT OF THE COVID-19 PANDEMIC, WHICH HAS DRAMATICALLY AFFECTED SO MANY INDUSTRIES, OUR FINANCIAL RESULTS DO SHOWCASE OUR RESILIENCE DURING THESE CHALLENGING MARKET CONDITIONS.”

13
Strategic Review Operational Review Financial Review Control Environment Financial StatementsOur Business
TAQA Annual Report 2020
Against a backdrop of large-scale disruption caused by the global COVID-19 pandemic, in 2020 TAQA made history. Our transaction with Abu Dhabi Power Corporation (ADPower), executed in July, optimally positions us for the future by bringing together all of Abu Dhabi’s power and water assets under single management.
TAQA Group’s 2020 annual report articulates how we are embracing this exciting change, emphasizing the significant efficiencies of scale that will enable the Group to harness leading cross-sector expertise over the long term to drive and champion the sustainable energy transition throughout the Emirate of Abu Dhabi and beyond.
In 2020, the transaction between TAQA and ADPower was first proposed to the Board in February and completed in July. The two organizations are highly complementary and bringing them together means we are now better-positioned than ever to capture and capitalize upon new growth opportunities, both at home in Abu Dhabi and internationally.
Following the transaction with ADPower, the market responded positively, driving up our share prices and leading to an upgrade in our standalone credit rating. This is an extraordinary achievement during a global pandemic and testament to our improved financial profile.
The Board has since announced a policy to sustainably increase shareholder dividends, committing to specific dividend targets for the next three years. This policy is in line with our long-standing strategic goal of operating a quarterly dividend policy, which is comparable to our integrated utility peers throughout the world. In fact, TAQA is currently the only publicly listed UAE company to deliver quarterly dividend payments.
In 2020, we also agreed to allow foreign investment in TAQA, a decision that, in due, course will allow us to broaden our investor base, improve liquidity and support the efforts of Abu Dhabi’s leadership to encourage foreign direct investment, helping position the emirate as a leading global investment hub.
In the context of the COVID-19 pandemic, which has dramatically affected so many industries, our financial results do showcase our resilience during these challenging market conditions.
As governments and businesses around the world came to terms with new realities in 2020, one legacy we see is that sustainability and the transition to renewable energy sources have become even more of a political priority around the world. This energy transition will play an important role in supporting global economic recovery efforts, and at TAQA, we have the financial strength and resilience to spearhead the transition of the power and water sector in the UAE and internationally.
I am confident TAQA’s new direction will generate value for the people of Abu Dhabi and the international jurisdictions in which we operate, as well as enhance value for our shareholders. TAQA has a strong base of sustainable, low-emission power and water projects to complement our existing diverse portfolio and is well-positioned to explore further growth opportunities in the utilities sector.
Central to our strategy for the future will be to continue seeking optimal operational efficiency for all existing assets and to harness our strong balance sheet and access to global capital markets to participate in new opportunities, particularly opportunities relating to clean sources of power. We expect to become a leading player in renewables over the coming years.
Lastly, on behalf of my fellow directors of the board and TAQA’s executive management team, I would like to thank our customers, shareholders, partners and all colleagues for their support.
H.E. Mohamed Hassan Al SuwaidiChairman of the Board of Directors

14 TAQA Annual Report 2020
GROUP CEO & MANAGING DIRECTOR’S STATEMENT
“I AM PROUD OF TAQA’S PROGRESS DURING 2020 AS WE CONTINUED TO DELIVER ON KEY OPERATIONAL AND FINANCIAL MILESTONES THROUGHOUT THE YEAR, INCLUDING ON OUR PROMISE TO SHAREHOLDERS TO PROVIDE MORE ATTRACTIVE RETURNS WITH OUR NEW DIVIDEND POLICY.”

15
Strategic Review Operational Review Financial Review Control Environment Financial StatementsOur Business
TAQA Annual Report 2020
TAQA’s 2020 results confirm our ambition to not only supply energy and water in a sustainable, reliable and efficient manner, but have the scale, expertise and financial strength to deliver progress towards the United Arab Emirates’ ambitious energy and environmental goals.
In July last year, TAQA completed its first step towards realizing this ambition. Following our transaction with Abu Dhabi Power Corporation (ADPower), TAQA became a fully integrated utilities champion, a top-10 integrated utilities company in Europe the Middle East and Africa by regulated assets and one of the UAE’s largest publicly traded companies by market capitalization.
Despite the challenges set forth by the COVID-19 pandemic, I am proud of TAQA’s progress during 2020 as we continued to deliver on key operational and financial milestones throughout the year, including on our promise to shareholders to provide more attractive returns with our new dividend policy.
On the operational front, our Generation business line completed financial close on two record-breaking projects: Fujairah F3, the region’s largest independent gas-fired power plant in the UAE, which is currently under construction, and the Al Dhafra Solar Photovoltaic (PV) plant, which will be the world’s largest single-site solar PV plant in the world, having already broken the record for the world’s most cost competitive tariff for solar power, set, in April, at USD 1.32 cents/kWh (AED 4.85 fils/kWh).
We have also progressed construction on our next utility-scale clean energy project, Taweelah RO, which will be the world’s largest reverse osmosis (RO) plant. Once complete, it will produce 200 MIGD of desalinated water using highly efficient RO technology and on-site solar power to further boost its sustainable credentials.
Transmission and Distribution is TAQA’s newest business line in our diverse Group. In 2020, it commenced efforts to accelerate the role of digitalization across its integrated business in a comprehensive effort to improve efficiency, safety and operational down-time. Most importantly, the Transmission and Distribution business successfully implemented robust business continuity measures that ensured we were able to provide an uninterrupted supply of power and water to our customers across Abu Dhabi.
On the sustainability front, we officially transferred Abu Dhabi Energy Services (ADES), a Super Esco, under our Transmission and Distribution business line to provide government and private entities across the emirate with retrofitting services to cut consumption of water and power. As we look at the UAE’s economic recovery from the COVID-19 pandemic, it is services like ADES that will help both commercial and government enterprises reduce their carbon footprint and consumption costs.
Our Oil and Gas business line demonstrated strong resilience throughout challenging market conditions in 2020. Despite this, it continued to navigate the operational challenges and demand volatility from the pandemic. Among the business line’s operational highlights include TAQA Europe increasing its operated asset portfolio with the transfer of operatorship of the Brae field assets, while maintaining production levels and preserving the health and well-being of our people.
In the short to medium term, we remain focused on the work required to complete the integration following the company’s transaction with ADPower, including a strategic review of our business, building on the strategic imperatives that underpinned the deal.
Over the longer term, TAQA Group is well-positioned to support Abu Dhabi’s Economic Vision 2030 and the UAE’s National Energy Strategy 2050. As the utilities sector continues to rapidly evolve, we are committed to ensuring TAQA is ready to take advantage of these changes.
We are grateful for the trust and confidence of our shareholders, customers and partners throughout 2020 and for the dedication of our talented workforce. I am confident we will reinforce this trust by continuing to enhance our business, strengthen our market position and deliver sustainable growth in 2021 and beyond.
As TAQA delivers on its core mandate, we will become an even more resilient business that will succeed in the current challenging environment and will take advantage of the opportunities that will come with the recovery.
Jasim Husain ThabetGroup Chief Executive Officer and Managing Director

16 TAQA Annual Report 2020
OUR SIX STRATEGIC IMPERATIVES01CREATE AN INTEGRATED, EFFICIENT AND DIGITAL UTILITY COMPANY
• Increase our generation capacity to be on par with globally leading generation companies
• Capitalize on our deep experience in solar power, RO water desalination, thermal water and power not building new co-generation assets going forward generation assets
• Deploy best practices and synergies across our combined power and water generation assets, driving improved fuel efficiencies and performance levels
• Drive digitalization to reduce investment costs, optimize utilization and reduce business support costs
02ENHANCE TAQA’S POSITION AS ABU DHABI’S CLEAN POWER AND WATER CHAMPION
• Meet the power and water needs of our home market, while driving the broader UAE’s clean energy agenda
• Accelerate the UAE’s energy transition by adding new generation capacity, decoupling power and water generation and focusing on both solar power and reverse osmosis water desalination
• Maintain a substantial majority of our existing gas-fired capacities and participate in new gas-fired power plants that are more efficient with lower emissions
• Develop new non-regulated revenue streams that complement core regulated and contracted businesses
03SELECTIVELY SEEK VALUE-ADDED GROWTH OUTSIDE OF ABU DHABI
• Apply a disciplined investment assessment framework, focused on select international opportunities with attractive risk-adjusted returns
• Assess opportunities for large-scale projects that align with our core competencies – in current and new markets
• Decrease our exposure to commodity price volatility with a larger share of our revenue based on stable, predictable cash flows
STRATEGIC REVIEW

17TAQA Annual Report 2020
Strategic Review Operational Review Financial ReviewOur Business Financial StatementsControl Environment
04ENSURE FINANCIAL STEWARDSHIP AND CONSIDER MONETIZATION OPTIONS
• Enhance our financial profile through our de-leveraged capital structure and our higher share of stable, predictable cash flows from regulated and contracted assets
• Cultivate healthy access to global capital markets and bank-lending channels and maintain a solid investment grade credit rating on a standalone basis
• Apply a robust capital allocation framework and fund shareholder returns through both sustainable dividend distributions and significant growth initiatives
• Pay dividends on a quarterly basis, 2020-2022, growing 10% annually
05MAINTAIN AN OPTIMAL REGULATORY ENVIRONMENT THROUGH GOVERNMENT PARTNERSHIP
• Maintain cooperation with the Abu Dhabi Department of Energy to facilitate stable and fair returns and regulatory best practices
• Remain an active partner in helping to further develop the regulatory framework, with the current regulatory period locking in reimbursement levels until 2023
• Collaborate with various off-takers, particularly the government-owned single-buyer in Abu Dhabi
06DEVELOP COMPETENCIES AROUND CORE STRENGTHS THROUGH OUR NEW OPERATING MODEL
• Maintain our position as one of the largest employers in the industry, with significant growth potential in new, innovative business areas
• Nurture our multinational workforce of talented and dedicated specialists, while attracting new leaders in our industry and adjacent sectors
• Provide training, development and growth opportunities that build rewarding, long-term careers – locally and internationally
• Draw on technical and development expertise at our operating companies while creating opportunities for strategic, financial and business-steering experts at our HQ
Our purpose is central to everything we do, and informs our six long-term strategic imperatives, which are to…

18 TAQA Annual Report 2020
OUR SIX COMPETITIVE STRENGTHS
STRATEGIC REVIEW (CONTINUED)
ONE OF THE LARGEST PUBLICLY TRADED INTEGRATED UTILITY COMPANIES IN EMEA
We are one of the largest publicly traded integrated utility companies in the region by market capitalization and a top-ten utility player in EMEA by regulated asset base. Our gross power generation capacity is 23 GW, and our gross desalination capacity is more than 900 MIGD. In our home market of the United Arab Emirates (UAE), we serve approximately one million customers.
VERTICALLY INTEGRATED ACROSS THE VALUE CHAIN, WITH EXCLUSIVITY RIGHTS TO FUTURE PROJECTS
We operate significant contracted generation assets and enjoy exclusivity rights to participate in all future power and water generation projects tendered in Abu Dhabi over the next 10 years, with a minimum 40% stake. We are the sole transmission and distribution company in the Emirate of Abu Dhabi and our transmission network extends across six of the seven Emirates in the UAE.
HIGHLY PREDICTABLE AND SECURE CASH FLOW PROFILE, INVESTMENT GRADE CREDIT RATINGS AND PRUDENT DEBT LEVELS
TAQA’s regulated and long-term contracted businesses contribute more than 90% of total revenues and EBITDA. The principles of the regulatory framework under which our Transmission and Distribution business operates in the UAE have been in place for more than 20 years, ensuring stable and predictable cash flows. Our Generation business line operates under long-term contractual frameworks with government-related off-takers that similarly ensure stable and predictable cash flows. In addition, TAQA has similar long-term power purchase agreements with high quality customers for captive power plants.

TAQA Annual Report 2020
Strategic Review Operational Review Financial Review Control Environment Financial StatementsOur Business
19
LONG-STANDING, TRANSPARENT AND INTERNATIONALLY ALIGNED REGULATORY FRAMEWORK
We operate with a regulated asset base-driven framework with transparent and publicly available regulatory guidelines. The framework is adjusted every four to five years through a public consultative process, in line with international best practice for such regulatory price control mechanisms. Our output volume risk is limited within the framework, which allocates approximately 85% of the required revenue calculated to fixed components. The framework further guarantees the difference between any calculated revenue and actual revenue billed to customers.
STRONG TIES TO ABU DHABI AND THE UAE’S LONG-TERM ENERGY AMBITIONS
TAQA is proud to contribute to Abu Dhabi’s economic, environmental and social development. We represent approximately 5% of Abu Dhabi’s gross domestic product and are strongly guided by the UAE’s Energy Strategy 2050 and Water Security Strategy 2036. We have one of the highest Emiratization rates among the UAE’s publicly traded companies and are committed to improving living standards in local communities through social investments.
POSITIONED TO CAPTURE INFRASTRUCTURE GROWTH IN ABU DHABI AND BEYOND
TAQA has proven capabilities that are key to our development in the UAE, including project development and operations. For example, we own a significant fleet of modern power assets, including: Taweelah RO, the world’s largest sea water reverse osmosis (RO) plant; Al Dhafra Solar PV, the world’s largest solar photovoltaic plant; Fujairah F3, the UAE’s largest gas-fired independent power project; and two projects to distribute recycled water not only to municipal landscaping customers, but also to commercial and agricultural customers. TAQA will continue to take advantage of growth opportunities in Abu Dhabi and beyond.

20 TAQA Annual Report 2020
GENERATION
BUSINESS OVERVIEW TAQA’s Generation business line has 23 GW of power generation capacity globally (1.4 GW from renewable energy sources) and 913 MIGD of water desalination capacity.
We have a further 4.4 GW and 200 MIGD under development, including 2 GW from renewable sources and 200 MIGD from highly efficient reverse osmosis.
In the UAE, our assets include 14 IWPPs, of which 11 are under operation and three are under construction. We also have generation assets in Ghana, India, Morocco, Oman, Saudi Arabia and the United States.
AGILITY AND RESILIENCETAQA’s power and water generation businesses demonstrated agility and resilience in 2020 to navigate challenges presented by the global COVID-19 pandemic.
Other challenges faced over the course of the year included electricity market oversupply and lower than average wind in the U.S.
Despite these challenges, TAQA’s Generation business delivered a strong performance in 2020. Our business line still made progress on our business plan, meeting planned milestones including financial close on two world-class and record-setting projects.
OPERATIONAL REVIEW
OUR GENERATION ASSETS INCLUDE:UAE• Our UAE operational assets are majority TAQA-owned, generating
a capacity of 18 GW and 913 MIGD• The 1.2 GW Noor Abu Dhabi is currently the world’s largest
single-site solar PV plant with TAQA owning 60% • Under construction:
– Al Dhafra Solar PV (2 GW) – 40% TAQA, Masdar, EDF Renewables and JinkoPower will have a 20% stake each
– Fujairah F3 (2.4 GW) – 40% TAQA, 20% Mubadala and 40% Marubeni Corporation
– Taweelah RO (200 MIGD) – 20% TAQA, 40% Mubadala and ACWA Power 40%
Ghana• TAQA-operated and 90% owned; the Takoradi gas-fired power plant
has a capacity of 330 MW
India• TAQA-operated and 100% owned, the Neyveli lignite-fired power
plant has a generation capacity of 250 MW
Morocco• TAQA-operated Jorf Lasfar coal-fired power plant is the country’s
leading IPP, meeting more than 40% of Morocco’s electricity demand. Morocco’s coal-fired power plant has a generation capacity of 2 GW with six steam turbine units
• TAQA owns 86% (Units 1-4) • TAQA owns 91% (Units 5-6)
Oman• Non-operated, 40% TAQA-owned Sohar Aluminium smelter with
a generation capacity of 1,000 MW, producing 396,000 tons of aluminium per year
Saudi Arabia• Non-operated, 25% TAQA-owned Jubail gas-fired power plant with
a generation capacity of 250 MW
United States• A non-operated merchant asset, 85% TAQA-owned in tolling
arrangements, the Red Oak (New Jersey) gas-fired power plant has a generation capacity of 832 MW
• Non-operated, 50% TAQA-owned lease of Lakefield (Minnesota) wind farm has a generation capacity of 205.5 MW
GENERATION PROFORMA FY 2020 EBITDA SPLIT
1.0BNInternational
AED 6.6BNUAEAED
7.6BN

21TAQA Annual Report 2020
Strategic Review Operational Review Financial Review Control Environment Financial StatementsOur Business
23Total Electrical Generation Capacity
1.4Power from renewable energy
OPERATIONAL HIGHLIGHTS2020 was a difficult year for most businesses around the world, but TAQA’s Generation business line delivered significant results across our operations. We also executed several initiatives to improve efficiency and reduce costs at generation plants.
The transaction with Abu Dhabi Power Corporation strengthened TAQA’s Generation business, increasing the number of Independent (Water) and Power Producer Plants (IWPPs) we own and operate, 11 in our core market, the UAE.
With the exception of Red Oak in the US, our assets operate under long-term contracts with government-owned offtakers or through similar offtake arrangements. Aside from our US-based assets and Jubail Power Company in Saudi Arabia, all of our international power generation assets are TAQA-operated.
Through financial prudence and the integration of digital technologies and advanced analytics, a leaner, more streamlined and efficient operation created better agility and value.
MIDDLE EASTIn the UAE, despite significant challenges posed by the COVID-19 pandemic and related economic uncertainty, customers suffered no disruptions of service, and we took far-reaching measures to safeguard our workforce from the virus.
IWPP initiatives included a digitalization pilot program to monitor data in real time and to benchmark performance against class-leading peers, an exercise that will enable us to improve efficiency in terms of manpower and operational costs for years to come.
Taweelah RO, which is currently under construction, utilizes cutting-edge reverse osmosis (RO) technology. Once operational, the plant will be the world’s largest RO desalination plant, and also one of the most energy-efficient. In addition to its desalination capabilities, the Taweelah site is able to generate 50 MW of solar power. The expected project commercial operation date is 2022.
We also announced the most cost-competitive tariff for solar power in the world at AED 4.85 fils/kWh (USD 1.32 cents/kWh) for the Al Dhafra Solar PV project, and reached financial close, with construction commencing in 2021. The expected project commercial operation date is 2022.
Fujairah F3, which is currently under construction, will be the UAE’s most efficient and largest independent gas-fired power plant. It will contribute to increase the system efficiency. The expected project commercial operation date is 2023.
MOROCCOTAQA Morocco identified several key areas to strengthen the efficiency of its operations and to reduce operating costs.
Among these strategic initiatives were steps to improve heat rate efficiency, source and inventory optimization, obsolescence management and a digitalization program that will be conducted over the next five years as part of the Group’s overall move from preventive to predictive maintenance.
Unit 1 underwent an overhaul that included the installation of digital monitoring and early detection programs. The coal unloaders were upgraded, which has significantly improved performance.
TAQA Morocco also announced one of the country’s largest private bond placements in 2020, reinforcing the company’s position in the Moroccan electricity market. The finalization of this transaction was delivered through a bond issuance by private placement for AED 1.08 billion, diversifying TAQA Morocco’s funding base and reducing debt costs by over 20% and an extension of debt maturity.
In addition to the bond placement, it achieved the extension of its Power Purchase Agreement (PPA) with the off-taker, Office National de l’Electricité et de l’Eau Potable (ONEE), for an additional 17 years for Units 1-4 of its Jorf Lasfar Power Plant, thereby enhancing value by extending the company’s debt repayment profile.
GHANAThe Takoradi plant completed construction of the chemical, oil and paints storage and scrap metal shed, and a CCTV system was installed across the plant to improve plant security and safety. This builds on the work previously completed to install a steam turbine turning the plant from single to combined cycle, and providing major efficiency gains.
UNITED STATESThough the Lakefield Wind Farm continued to experience wind that was below the long-term average – which resulted in reduced energy production – this was offset by lower-than-expected maintenance costs.
As a result of the decision by the United States Federal Reserve to cut interest rates, we were able to enhance our hedging positions and to take advantage of preferential refinancing opportunities.
Scheduled maintenance at Lakefield included the second phase of a multi-year wind turbine blade repair/maintenance program during the summer.
INDIAThe Neyveli plant progressed with the project for the addition of a flue gas desulfurization (FGD) system to comply with sulfur dioxide emission regulations. Completion of the project is planned for Q1 2023.
During the annual outage, the corrective maintenance plan was initiated, which included major overhauling and re-blading of three stages of steam turbine.
A new road to transport lignite from the surrounding mines to the loading area is in the construction phase.
LOOKING AHEADThe decarbonization of power and water generation is central to the global energy transition. TAQA is embracing clean energy by adopting new technologies like solar PV to reduce our carbon footprint and complement our existing portfolio.
Although we recognize there is still a role for traditional forms of energy, we are committed to leading and championing the energy transition, in Abu Dhabi and throughout the world.
GW GW

22 TAQA Annual Report 2020
TRANSMISSION AND DISTRIBUTION
OPERATIONAL REVIEW (CONTINUED)
BUSINESS OVERVIEWTAQA Group’s Transmission and Distribution business line comprises four operating companies: Abu Dhabi Transmission and Despatch Company (TRANSCO), Abu Dhabi Distribution Company (ADDC), Al Ain Distribution Company (AADC) and Abu Dhabi Energy Services Company (ADES). The Transmission & Distribution business delivered a strong performance in 2020, despite increased potential for operation and service disruption associated with the COVID-19 pandemic.
TAQA implemented robust business continuity measures across our integrated operations, as our colleagues’ hard work and commitment ensured an uninterrupted supply of power and water service throughout the year.
Across TAQA’s operations in 2020, we commenced initiatives to transition towards reliability-based maintenance. These initiatives included an advanced analytics and machine learning pilot project.
In addition, utilization of specialized tools enabled maintenance of overhead ADPower Lines to be undertaken without lines being de-energized. Throughout the year, new digital technologies were harnessed across operations, streamlining services and increasing efficiency.
The Transmission and Distribution business line will continue to play an important role in driving TAQA Group’s – and, in turn, the UAE’s – progress towards a sustainable, long-term energy transition.
OPERATIONAL HIGHLIGHTSIn 2020, we reinforced our reputation for the provision of reliable, safe services. In total, we invested AED 2.7 billion in capital expenditure. Power and water transmission networks delivered system availability of 99.1% and 97.8%, respectively.
Standout achievements included:• Implementation of digital technologies across operations to create
value, resolve operational challenges and enhance customer experience. Examples included: _ Provision of enhanced digital services for end users, including
integration with the Unified Abu Dhabi Government Digital Services Portal (TAMM) – meaning customers no longer need to visit branches to resolve a wide range of issues
_ Modernization of the grid by using connected sensors and drones for power line inspection
_ Experimentation with Artificial Intelligence (AI) solutions to improve network maintenance and demand forecasting, enabling improved data-centric decision making
Throughout the year, we also made good progress on several large-scale projects, including: • Finalizing plans for a joint project with Abu Dhabi National Oil
Company (ADNOC) to connect ADNOC’s offshore fields to the national grid, through TRANSCO. The fields currently use their own gas generators, which is costly and inefficient. Connecting directly to the grid enables enhanced efficiency and reduced greenhouse gas emissions. The project is at the evaluation stage, with the preferred bidder process to be completed by Q2 2021.
Other major capital expenditure projects in 2020 included: TRANSCO: • Energizing a new 220/33 kV grid station in Al Towayya, Al Ain,
to power the Nibras project and new developments in the neighboring area
• Energizing the 400 kV SHPS-WMZD OHL sub-station, which is part of TRANSCO’s network and will transmit power from the Barakah Nuclear Power Plant. TRANSCO played a critical role in the synchronization of Barakah, having constructed 952 kilometers of 400 kV overhead lines to connect Unit 1 to the Abu Dhabi electricity grid – ensuring the power generated at Barakah is safely delivered to where it is needed
• Awarding a contract to replace a pumping station at Jabel Hafeet Base
• Connecting the world’s largest single site solar plant to the UAE’s transmission grid

23TAQA Annual Report 2020
Strategic Review Operational Review Financial Review Control Environment Financial StatementsOur Business
18Kof water pipelines
80Kof electricity networks
2020 AWARDSTRANSCO:• Asian Power Awards 2020
‘Transmission & Distribution Project of the Year’ for integrating the Barakah Nuclear Power Plant to the UAE grid
• Royal Society for the Prevention of Accidents 7th consecutive Gold Medal in the ‘Occupational Health and Safety Employee Performance’ & Gold Award for ‘Contractors & Consultants Performance’
ADDC:• Commencing construction of the Recycled Water Transmission
System, from Abu Dhabi to Dubai and Abu Dhabi to Al Ain, enabling us to meet growing demand
• Commencing construction of the Intermittent Chlorination System for ADDC’s Water Distribution Network
• Energizing the Shawamekh-2 33/11 kV primary substation
IMPROVING EFFICIENCY AND CUTTING COSTSOver the course of 2020, we reduced operating costs and created value by increasing efficiency and reducing waste. Initiatives included:• Continuation of our recycled water program, focused on
expanding distribution of recycled water. The aim of the program is to optimize the use of desalinated water and divert recycled water for landscaping irrigation over a number of years
• Improved cash collections in Abu Dhabi through initiatives including the onboarding of commercial and industrial customers into a direct debit program
• Implementation of Demand Side Management (DSM) programs to improve energy and water efficiency across our customer base
• Establishment of TAQA’s new operating company, Abu Dhabi Energy Services Company (ADES), to manage reduction of electricity and water consumption and to support the development of Abu Dhabi’s retrofit market– ADES has already signed Memoranda of Understanding with
the Ministry of Education, as well as with SEHA, to retrofit schools and healthcare facilities across the Emirate
LOOKING AHEADOur priorities for 2021 and beyond include:
TRANSCO• OHL works and connection of major generation assets
(e.g., Fujairah F3, Al Dhafra Solar PV) • Reinforcement of Water Transmission Scheme to transfer
water from the Taweelah complex to the network
ADDC• Replacement of the existing five Sweihan primary substations
with five new 33/11 kV (4x20 MVA) primary substations• Initiate water supply to Sir Bani Yas Island in Western Region• Construction of two new 33/11 kV PRY’s for Al Reeman 1,
Al Reeman 2 and Baniyas North
AADC:• Integration of Advanced Demand Management System (ADMS) • Supply & Installation of 33/11 kV Primary Substation in Wahat
Al Zawiya Project, Al Khurair and Al Dhaher
The Transmission & Distribution team looks forward to accelerating the energy transition in Abu Dhabi, particularly in connecting clean sources of energy to the grid as efficiently as possible.
KM KM

24 TAQA Annual Report 2020
OIL & GASOPERATIONAL REVIEW (CONTINUED)
BUSINESS OVERVIEWTAQA’s Oil and Gas business line has demonstrated strong resilience throughout the sustained economic uncertainty of 2020, particularly in navigating the significant operational challenges and demand volatility caused by the global COVID-19 pandemic.
EUROPETAQA Europe is comprised of assets in the United Kingdom and in the Netherlands. TAQA Europe produced approximately 35,000 boepd net from twenty producing fields in 2020. TAQA Europe now operates eight offshore platforms in the northern and central regions of the UK sector of the North Sea, with Brae Alpha, Brae Bravo and East Brae being added to the previous operated portfolio of Cormorant Alpha, Eider, North Cormorant, Tern and Harding. In The Netherlands, TAQA operates the P15 complex in the Dutch sector of the North Sea.
In 2020, TAQA Europe increased its operated asset portfolio with the transfer of operatorship of the Brae field assets, which occurred on October 1, 2020. TAQA has since initiated performance improvement measures in the areas of safety, asset reliability and cost efficiency.
TAQA Europe completed a four-well infill campaign at the North Cormorant platform in May.
In addition, TAQA Europe continued to plan for the retirement of aging assets and received approval from the UK Department of Business, Energy and Industrial Strategy for decommissioning programs for the topside facilities at the Eider, Tern and North Cormorant platforms.
TAQA Europe operates the Gas Storage Bergermeer (GSB) facility near Alkmaar which is Europe’s largest open-access gas storage facility and was granted permission by The Netherland’s Ministry of Economic Affairs and Climate to increase gas storage capacity by 10% in fourth quarter of 2020.
In the Netherlands, TAQA is also active with the Porthos Project, a project aiming to reduce CO2 emissions through storage in depleted gas reservoirs beneath the North Sea.

25TAQA Annual Report 2020
Strategic Review Operational Review Financial Review Control Environment Financial StatementsOur Business
NORTH AMERICA During 2020, TAQA North in Canada produced produced approximately 73,000 boepd. TAQA North drilled 14 wells focused on its core holdings in order to support production levels and to add reserves.
Plans were approved in January for an Acid Gas Injection (AGI) project at the East Crossfield Plant, and project work commenced soon after. The project will extend the operational life of the plant and significantly reduce greenhouse gas emissions.
In April, TAQA North completed the construction of a gas treatment and compression plant in the Sunchild area of Central Alberta, which improves the processing and operations efficiency of the produced gas. In line with its strategy to focus on operations in Western Canada, TAQA sold all of its oil and gas assets in the United States in 2020.
IRAQIn 2020, TAQA Iraq produced an average gross production 45,000 boepd. Production and operational efficiency were the key drivers in the year. Along with ongoing workovers and interventions to existing wells to sustain production, TAQA Iraq installed H2S sweetening columns and desalters that delivered improved operations.
LOOKING AHEADThe Oil & Gas business will continue to identify and implement efficiencies throughout its diverse geographies. TAQA Europe will continue to optimize production and costs within the existing mature assets while also progressing with the planning and execution of decommissioning activities for selected platforms in the North Sea.
TAQA North plans to significantly step-up drilling activity in 2021 with 23 operated development and appraisal wells aimed at sustaining the current production level. The Crossfield AGI project will be completed, which will provide a significant reduction in greenhouse gas emissions.
TAQA Iraq will recommence drilling operations with a new development well planned for the first half of 2021. TAQA Iraq will continue to work on delivering efficiencies in operations.
AWARDS TAQA North in Canada, with the developer InterPro Solutions, were named winners of the IBM Maximo World Awards 2020 in the Best Mobility Program category.
OUR OIL AND GAS ASSETS:EuropeTAQA UK operates eight offshore platforms producing from twenty fields across the northern and central regions of the UK North Sea. TAQA Europe also owns equity in several fields operated by other entities in the central region.
TAQA Netherlands has interests in more than 25 assets in The Netherlands including concessions for gas production onshore in the Alkmaar region and offshore in the Dutch North Sea, and two onshore underground gas storage facilities including the Gas Storage Bergermeer (GSB).
CanadaTAQA North manage operated and non-operated oil and gas assets in Western Canada, which produce gas, NGLs and oil across more than 2.4 million acres (9,712 square kilometers) of land-holdings. TAQA North operations include exploration and development activities, gas compression, gas processing and gas transportation infrastructure, and crude oil batteries for oil production.
IraqLocated in the Kurdistan region, the Atrush block is TAQA Group’s first greenfield oil and gas development and covers 269 square kilometers, 85 km northwest of Erbil, the region’s capital. First discovered in 2011, production began in 2017.

26 TAQA Annual Report 2020
HEALTH, SAFETY, SECURITY AND ENVIRONMENT
OPERATIONAL REVIEW (CONTINUED)
The safety of our people is TAQA’s number one priority. In 2020, we undertook important work to ensure our Health, Safety, Security and Environment (HSSE) performance across the business applied the highest standards. In order to ensure HSSE performance was consistent across all areas of TAQA Group’s operations, HSSE is delivered through strong leadership across the organization and is facilitated by a central team that works closely with each of TAQA’s businesses to ensure consistent HSSE performance across the group.
PROTECTING OUR PEOPLE DURING A GLOBAL PANDEMICIn March 2020, we established a dedicated COVID-19 taskforce. The taskforce comprised members from the Business Continuity Management team, Group Communications, Human Capital and further specific functional expertise as required. The taskforce worked on finding ways to protect employees and mitigate the risks presented by the pandemic while also ensuring our operations could continue and the communities in which we serve experienced no COVID-19 related disruptions of services.
From the outset, all office-based and non-essential site employees transitioned to working remotely. In addition to observing all COVID-19 government-related protocols in the geographies where we operate, we also put in place safeguards of our own to keep our people safe and to secure safe and reliable continuity of supply. Our safety protocols often exceeded the recommended protocols from regulators. Additionally, we developed and implemented systems and tools globally to provide daily tracking of COVID-19 developments in our assets. In the UAE, these tools were integrated with the Department of Energy to enable one source sector-wide real-time tracking of COVID-19 developments, including testing, cases and recoveries.
To facilitate deep HSSE alignment, we carried out an Occupational Health and Safety review of TAQA’s Transmission and Distribution business. The exercise provided valuable insights that will enable us to focus on key areas for enhancement in 2021.

810
1992020
2019
20172018
1.751.65
0.820.412020
2019
20172018
11
002020
2019
20172018
3648
47322020
2019
20172018
27TAQA Annual Report 2020
Strategic Review Operational Review Financial Review Control Environment Financial StatementsOur Business
KEY HSSE INITIATIVES In 2020, we implemented several initiatives to enhance HSSEperformance across the Group. These included:• Launching a new global HSSE Policy• Introducing a new comprehensive HSSE Performance Book
to improve management information• Developing a new Operating Model for HSSE• Implementing our Global Process Safety Standard• Completing a Major Operational Risk review across all international
businesses, including identifying Process Safety barriers• Updating incident reporting and incident investigation
procedures to ensure inclusion of new TAQA T&D business• Commencing roll-out of an e-solution to record and report incidents• Planning for a comprehensive environmental review to enhance
our environmental approach and improved KPI’s
1. LTI and Fatalities 2017 to 2018 reflect legacy TAQA.2. RIR 2017 to 2018 reflects legacy TAQA.3. RIR 2019 and 2020 reflects New TAQA.4. Recordable Spills 2017 to 2018 reflects legacy TAQA and 2019 to 2020 reflects New TAQA.5. In 2019 we have added one retrospective spill which occurred in 2019 but reported late by a 3rd party contractor in 2020 at TAQA UK.
In 2020, we developed a plan for integrating our TAQA HSSE Management System, Commitment to Operational Excellence (COE), into our new TAQA businesses. COE details the manner in which we seek, now and in the future, to ensure TAQA’s HSSE culture is consistent across the business and conforms to thehighest standards.
TAQA’s HSSE Management System clearly defines what theGroup expects from subsidiaries in terms of HSSE standards,addressing all areas of business that have an impact on the safety of employees, including: issues of health, security andenvironmental performance.
Fatalities
Recorded injury rate (incidents/1,000,000 hrs) Recordable spills
Lost time injuries

28 TAQA Annual Report 2020
PEOPLE
Throughout our 11 countries of operation, TAQA Group strives to create a working culture characterized by performance excellence, continuous learning and a commitment to fulfill one’s full potential. At TAQA, we provided opportunities for colleagues throughout the business to develop professional skills in order to advance and thrive.
In 2020, we recognized outstanding achievements, enhanced employee engagement and provided clearly defined career guidance.
Highlights included:
• Employee Engagement In 2020, TAQA Group initiated a far-reaching three-year Employee Engagement Program, designed to drive employee engagement and enhance business performance across all TAQA Group business lines. We carried out an Employee Engagement survey of all employees in order to understand directly from them how they felt about working at TAQA, where they felt we were performing strongly, and how collectively we could address challenges to improve operational capability. TAQA Group’s overall 2020 Employee Net Promoter score, which quantifies the likelihood of employees speaking positively to friends and family about the experience of working for the company, was recorded at 74%, which is significantly higher than UAE and global benchmarks for organizations of TAQA’s size.
• Diversity and Inclusion TAQA is dedicated to ensuring that it has a workforce which represents a diverse and inclusive population. TAQA is proud to have employees from over 60 nationalities working across all areas of the business worldwide. We continued to support Emiratization across all areas of the business, and at all levels of the organization. TAQA’s HQ workforce comprises 169 UAE Nationals (54%). Of these 169 UAE Nationals, 60% hold positions in senior management, and 80% hold Executive Management positions. 40 are women. We are also working to support young, talented UAE Nationals. In 2020, we offered seven internships, despite the challenges presented by the COVID-19 pandemic.
OPERATIONAL REVIEW (CONTINUED)

* Hold positions within senior management and above
29TAQA Annual Report 2020
Strategic Review Operational Review Financial Review Control Environment Financial StatementsOur Business
• Rewards and Recognition Erin Ingram, Commercial Associate at TAQA UK, was named as a joint winner in the Young Professional category in the 2020 SPE Aberdeen Offshore Achievement Awards – the oldest and largest industry awards for the UK energy sector. Erin was among five people named as finalists for the award, which acknowledges the ‘professional capability and wider contribution’ made to the offshore industry by a person aged 35 or under. The accolade reflects the positive impact Erin has already made in the UK business, where she has become established as the single point of contact for all commercial matters across the Northern North Sea assets.
• TAQA Europe HSSEQ Director John Hogg received a well-deserved recognition at one of the UK’s major industry awards programs. Named Mentor of the Year in the 2020 Oil & Gas UK (OGUK) Awards for his sterling efforts supporting colleagues over many years, he was announced as winner of the category during a virtual ceremony attended by hundreds of industry people via live streams on YouTube, LinkedIn and Facebook on December 10. OGUK said the accolade recognized “the vital role he has played and his extraordinary commitment to aiding learning and improvement across the industry.”
• Training and Development We continued delivery of TAQA Group’s Graduate Training Program (GTP) to develop the professional and behavioral skills of UAE graduates. We are proud of the manner in which the program supports Abu Dhabi’s long-term objective to provide professional opportunities and training for Emirati talent. The program equips young people with the skills needed to succeed in a professional environment. The 18-month program, launched in 2019, had 95 students (80% of which were female graduates) in the first cohort, which will graduate in May 2021. We partnered with Harvard Business School Publishing to give all employees at headquarters access to Harvard ManageMentor®, an online platform that provides training in more than 40 key business disciplines.
• Wellness During this year of COVID-19, every measure was taken to keep employees safe and well. Globally each TAQA OpCo implemented changes which best suited their local workforce, ensuring that local government guidelines were met at all times. Options were created for employees to work from home, and shifts and routines were given flexibility to enable working parents to support their children where possible.
• Employees globally were encouraged and supported to work with their teams and managers to find solutions that maintained their safety and well being whilst also delivering on work objectives in an environment of cohesiveness and teamwork.
Country Number of Employees Turnover rateFemale
participation% of female FTEs
in senior positions
TAQA HQ UAE 169 6% 34% 15%*
AADC UAE 1,578 8% 25% 23%
ADDC UAE 1,906 9.2% 19.5% 17.8%
TRANSCO UAE 1,042 8.6% 32% 26%
ADES UAE 4 0% 0% 0%
AMPC UAE 116 18.4% 9% 14%
Jorf Lasfar Morocco 496 0.81% 4.7% 31.5%
TAQA Neyveli India 134 0% 6% 9.1%
Takoradi Ghana 77 1% 8% 12.5%
TAQA Atrush Iraq 154 2.5% 13% 3%
TAQA Bratani UK 870 1.2% 20.1% 2.2%
TAQA Energy The Netherlands 145 5% 16% 8%
TAQA North Canada 327 1.81% 39% 44%
DIVERSITY AND INCLUSION SNAPSHOT 2020
7,000+total employees

30 TAQA Annual Report 2020
CORPORATE SOCIAL RESPONSIBILITY
OPERATIONAL REVIEW (CONTINUED)
TAQA is committed to being a force for good in all of the geographies in which we operate. We believe by using our position in society to support good causes and to raise money we can drive positive change. We are proud of the work undertaken in 2020 to support a wide range of charities and initiatives, including:
UAEBREAST CANCER AWARENESSWe organized talks by experts to raise awareness of breast cancer among employees.
FAMILY SUPPORTWe raised funds to support employees and their families affected by the pandemic in Abu Dhabi by providing food and essential goods.
NORTH AMERICATAQA CARESTAQA Cares is the annual fundraising campaign for TAQA North’s Calgary office. TAQA Cares brings the team together to support the local community through various philanthropic initiatives. This year, we supported United Way of Calgary, Canadian Mental Health Association (CMHA) and Calgary Food Bank. We raised CAD 37,245 for United Way, CAD 4,041 for Calgary Food Bank and approximately (in kind) CAD 4,000 for Canadian Mental Health Association.
RUN FOR THE CURERun for the Cure is a fundraising run organized by the Canadian Cancer Society in support of breast cancer research. TAQA North has participated every year since 2011. This year, we raised CAD 8,800.
ALBERTA CHILDREN’S HOSPITAL DONATIONWe donated CAD 20,000 to Alberta Children’s Hospital.
STARS DONATIONWe donated CAD 47,500 to STARS, an air ambulance service that provides critical care and patient transport. STARS is a service that has been called upon for TAQA field workers.

31TAQA Annual Report 2020
Strategic Review Operational Review Financial Review Control Environment Financial StatementsOur Business
UNITED KINGDOMTAQA CHARITY OF THE YEAR In 2020, we chose as our charity of the year Hamish Dear’s Warm Hugs, a children’s cancer charity that provides days out and other activities for young people undergoing cancer treatment. Over the course of the year, through a range of activities, we raised GBP 42,000 to support 270 children.
TACKLING FOOD POVERTY We raised GBP 26,000 to support Community Food Initiatives North East (CFINE), a charity that provides food to people who are struggling.
BROADCAIRN MOUNTAIN PATH SPONSORSHIPWe raised GBP 5,000 to help maintain Broadcairn Mountain public footpath in Scotland.
MACDUFF MARINE AQUARIUM WASTE EXHIBIT REPLACEMENTWe raised GBP 10,000 to support Macduff Marine Aquarium, helping to promote key environmental messages through an exhibit featuring plastic in the ocean.
RIVER EDUCATION PACKAGEWe raised GBP 10,000 for the River Education Package to encourage children to engage with the natural environment.
GREYHOPE BAYWe raised GBP 15,000 to support the Greyhope Bay dolphin viewing experience.
NETHERLANDSPARLAN YOUTH CAREParlan was our charity of the year. It provides foster care and professional services for families with socio-economic problems. We raised EUR 13,200 in support of Parlan.
TAQA CULTURE FUNDWe donated EUR 50,000 in 2020 to support local arts and cultural activities such as choirs, museums, theatrical events and cultural heritage organizations.
ENERGY CHALLENGES FOUNDATIONWe supported energy consumption and conservation projects in primary schools in the Alkmaar region and taught children about the energy transition. We donated EUR 10,000 to the Energy Challenges Foundation.

32 TAQA Annual Report 2020
OPERATIONAL REVIEW (CONTINUED)
IRAQWOMEN AND YOUTH LITERACY PROGRAM We donated USD 47,600 to a three-year program to support young women in Iraq to learn to read and write. Fifty women graduated in 2020.
KEROSENE PROJECTWe supplied 12,600 liters of kerosene to schools and businesses in the Kurdistan region to be used for heating.
CHAMANKE SECONDARY SCHOOL PLUMBING WORKWe supported plumbing work in the Chamanke secondary school worth USD 18,000.
CORONAVIRUS PROTECTION MATERIALSWe distributed more than 12,000 pieces of protective equipment and clothing to safeguard people against COVID-19 in the Chamanke region of Kurdistan, worth approximately USD 19,500.
INDIAPRIME MINISTER CARES FUNDWe donated INR 7,500,000 to the Prime Minister’s Citizen Assistance and Relief in Emergency Situations Fund to support people affected by the COVID-19 pandemic.
CRISIS SUPPORT We provided support worth INR 25,000 to give shelter to a family that lost their hut in a fire accident in Neyveli.
HEALTH CAMP AT OOMANGALAMWe donated INR 544,900 to facilitate medical care for villagers.
DESILTING AND REPAIR OF WATER PONDS We donated INR 1,700,000 to desilt ponds in Uthangal in order to increase rainwater harvesting and help irrigation processes.
PVC PIPELINE INSTALLATION We donated INR 300,000 to install a pipeline in a village in Oomangalam, providing drinking water for 50 families.
COVID-19 PPE KIT We donated PPE equipment worth INR 460,000 to safeguard 1,500 families from COVID-19 in Uthangal village.
GHANASTREET LIGHTS FOR LOWER INCHABANWe funded the installation of 30 streetlights in the Lower Inchaban area at a cost of GHC 12,600.
CEMENT FOR YABIW PALACE We donated cement worth GHC 8,800 to the reconstruction of a community chief’s palace.
FINANCIAL SUPPORT FOR BRAIN SURGERY We provided GHC 40,000 in financial support to enable three-month old baby Hilda to have brain surgery.
FINANCIAL SUPPORT FOR HEARING AIDS We provided GHC 6,000 to support Mariam, a five-year old girl from Lower Inchaban, to obtain a hearing aid.

33TAQA Annual Report 2020
Strategic Review Operational Review Financial Review Control Environment Financial StatementsOur Business Financial StatementsControl EnvironmentFinancial Review
EDUCATIONAL SUPPORT We provided GHC 23,800 in financial support to enable Nana Osei Nkwantabisa, a Lower Axim chief, to further his education.
SPORT SPONSORSHIP We provided GHC 47,000 in financial support to enable the Baffour Football Academy to participate in a tournament in Italy.
COVID-19 SUPPORTWe provided PPE equipment worth approximately GHC 170,000 to the Shama district to help safeguard people from the COVID-19 pandemic.
HEALTH SERVICES We provided GHC 60,000 in financial support to assist the Shama District Health Authority to build a health center for children.
MOCK EXAMS SPONSORSHIPWe provided GHC 30,000 in financial support to enable students in the Shama district to prepare for exams.
NKWANTAKESIDU SCHOOL PROJECTWe provided GHC 24,825 in financial support to enable Nikwantakesidu school to finish construction of two classrooms.
ADMISSION FEES We provided GHC 1,965 in the form of an academic scholarship to Patient Nketsiah, a female mechanical engineering student.
WATER SUPPLY We provided GHC 6,000 in financial support to provide the Aboadze community with water following damage to a pipeline.
MOROCCOEXCELLENCE SCHOLARSHIPWe provided USD 90,000 in financial support to academic scholarships for five women in STEM.
REMOTE AREAS HEALTHCAREWe provided USD 150,000 in financial support to an initiative organized by the Sheikh Zayed bin Sultan Al Nahyan Foundation to provide free healthcare for people in remote areas.
EL JADIDA HEALTHCAREWe provided USD 70,000 in financial support to facilitate emergency healthcare for people living in the El Jadida region.
EL JADIDA SOCIAL SUPPORTWe provided • USD 50,000 in financial support to enable
the upgrade of medical facilities at the El Jadida hospital
• USD 40,000 to provide theatrical workshops to encourage self-expression by young people
• USD 25,000 for education for young children • USD 25,000 to provide sports facilities in
deprived areas

34 TAQA Annual Report 2020
FINANCIAL HIGHLIGHTSIn 2020, TAQA delivered robust operational performance in the face of the continuing COVID-19 pandemic. We ensured secure power and water supplies through high levels of capacity availabilities within generation and high levels of network availabilities within transmission and distribution. Oil and gas production was slightly lower than in 2019 reflecting the Company's decision to reduce drilling in response to depressed commodity prices.
TAQA's financial results*, whilst resilient, reflected the more challenging economic conditions seen in energy markets on the back of the COVID-19 situation. Both revenues and EBITDA were impacted compared to the same period last year.
Revenues were down 6% to AED 41.2 billion, largely reflecting weaker realized prices in the Oil & Gas business as well as slightly lower revenues in both the Transmission & Distribution and Generation segments.
EBITDA reached AED 16.0 billion, 13% lower year-on-year reflecting lower revenues (mainly in Oil & Gas) and partially offset by lower group operating and administrative expenses.
Transmission and distribution contributed 49% of Group EBITDA and is the largest segment within the Group. As sole owners of Abu Dhabi’s power and water grids, we undertake all maintenance, upgrade work and expansion of the networks, be it to maintain high network availability rates, improve efficiency or in response to increased demand due to increased electrification or natural growth. This in turn feeds into our regulated asset base (RAB) on which we earn guaranteed returns.
Generation contributed 47% of total EBITDA, with 41% from the UAE fleet. We supply over 95% of total Abu Dhabi power and water demand from the grid (thus excluding captive generation assets in industrial complexes such as EGA, the aluminium smelter, and ADNOC, Abu Dhabi’s national oil and gas company). Our exclusivity rights will allow us to participate with a minimum 40% stake in all future power and water generation projects in Abu Dhabi over the next 10 years. This ensures significant growth prospects for this segment.
The Oil and Gas segment contributed less than 5% of EBITDA, reflecting the much higher level of group EBITDA since the ADPower transaction and suppressed commodity prices.
Combined, the Group reported a net profit of AED 2.8 billion (TAQA-share), significantly lower than the prior year period. Included in that figure is the impact of an AED 1.5 billion post-tax impairment charge taken in Q1 2020 within the Oil & Gas segment. The impairment and a further AED 1.1 billion reduction in net income from the Oil & Gas segment, help account for much of the fall in the Group’s net income of AED 2.6 billion versus net income for the full year 2019.
* Financial and operational figures referenced in this section are on a proforma basis, restating our statutory results as if the transaction with ADPower had closed on 1 January 2019. This enables meaningful year on year comparisons.

35TAQA Annual Report 2020
Strategic Review Operational Review Financial Review Control Environment Financial StatementsOur Business
35TAQA Annual Report 2020
7,8638,3252019
2020
Revenues (AED million)
41,15143,8982019
2020 16,00418,3102019
2020
2,7885,4352019
2020
EBITDA (AED million)
Net income (TAQA-share; AED million)
80,13582,6782019
2020 24,65925,1472019
2020
Regulated asset base (RAB; AED million) Revenues (AED million)
EBITDA (AED million)
93.993.72019
2020 12,31412,6692019
2020
7,5577,4812019
2020
Global technical availability (%) Revenues (AED million)
EBITDA (AED million)
118.0124.42019
2020 4,1786,0822019
2020
7332,5322019
2020
Production (mboepd) Revenues (AED million)
EBITDA (AED million)
TAQA GROUP
TRANSMISSION & DISTRIBUTION
GENERATION
OIL AND GAS

36 TAQA Annual Report 2020
H.E. MOHAMED HASSAN AL SUWAIDI, CHAIRMAN
Elected to the Board in 2019 and elected Chairman in 2020
H.E. Mohamed Hassan Al Suwaidi serves as the Chief Executive Officer of ADQ. His Excellency is also the Chairman of Emirates Water & Electricity Company (EWEC), as well as a member of the boards of directors of Abu Dhabi Pension Fund, Emirates Nuclear Energy Corporation and Emirates Global Aluminium. Before joining ADQ, His Excellency was leading Metals and Mining for Mubadala Investment Company, where he worked in investment management across a wide range of sectors including Real Estate, Hospitality, Infrastructure, Utilities, Technology, Agriculture, Metals and Mining. His Excellency holds a Bachelor of Science in Accounting from United Arab Emirates University.
H.E. SAEED MUBARAK AL HAJERI, VICE CHAIRMAN
Elected to the Board in 2011 and elected Vice Chairman in 2020
H.E. Saeed Mubarak Al Hajeri has more than 26 years of experience in international finance. He is the Vice Chairman of Islamic Arab Insurance Company and an Executive Director at Abu Dhabi Investment Authority. He previously was a board member of the CFA Institute and a Member of the Executive Advisory Board of MSCI Barra. H.E. Al Hajeri holds a bachelor’s degree in business administration from Lewis & Clark College in the United States and is a Chartered Financial Analyst. He also attended the Executive Education Program at Harvard Business School.
H.E. SAIF MOHAMED AL HAJERI, BOARD MEMBER
Elected to the Board in 2020
H.E. Saif Mohamed Al Hajeri is the Chairman of Abu Dhabi Power Corporation. He was previously the Chairman of the Department of Economic Development – Abu Dhabi (DED) and a member of the Executive Council of Abu Dhabi. As Chairman of the DED, H.E. Al Hajeri was responsible for overseeing and driving the Abu Dhabi’s economic agenda and strategy. Prior to his appointment as Chairman of the DED in 2017, H.E. Al Hajeri served as CEO of Tawazun Economic Council and Tawazun Holding company since 2008. H.E. Al Hajeri holds a bachelor’s degree in business administration and economics from Lewis & Clark College in the United States.
BOARD OF DIRECTORS

37TAQA Annual Report 2020
Strategic Review Operational Review Financial Review Control Environment Financial StatementsOur Business
KHALIFA SULTAN AL SUWAIDI, BOARD MEMBER
Elected to the Board in 2020
Khalifa Sultan Al Suwaidi is the Chief Investment Officer at ADQ, where he manages portfolio companies in the Energy & Utilities, Mobility & Logistics and Food & Agriculture sectors. In addition to his role at ADQ, Mr. Al Suwaidi is Chairman of the Board at SENAAT, where he oversees the holding company’s performance and management of its subsidiaries. Mr. Al Suwaidi is also the Chairman of Agthia and National Petroleum Construction Company and Vice Chairman of Abu Dhabi Ports and Emirates Water and Electricity Company. Mr. Al Suwaidi holds a bachelor’s degree in business, majoring in marketing, from California State University and an Executive Master of Business Administration with distinction from Zayed University.
SALEM SULTAN AL DHAHERI, BOARD MEMBER
Elected to the Board in 2011
Salem Sultan Al Dhaheri is Deputy Director at Abu Dhabi Investment Authority. He is also a Member of the Board of Directors of SENAAT and Al Etihad Credit Bureau, while serving on the Audit Committees of Abu Dhabi Retirement Pensions Benefits Fund, Abu Dhabi National Oil Company, Emirates Investment Authority, Etisalat and General Pension and Social Security Authority Mr. Al Dhaheri is a Certified Public Accountant. He has a bachelor’s degree in accounting from Metropolitan State College in the United States.
KHALED ABDULLA AL-MASS, BOARD MEMBER
Elected to the Board in 2014
Khaled Abdulla Al-Mass is a Board Member of Abu Dhabi Health Services Company (SEHA) and the Chairman of iMass Investments LLC, an investment holding company that specializes in investment banking advisory, direct investments, artificial intelligence and financial technology. Mr. Al-Mass is also the Chairman of iTech Engineering Consultancy, which specializes in Building Information Modeling solutions, smart cities, digital twins and artificial technology. Mr. Al-Mass holds a bachelor’s degree in management from Marylhurst University, United States.
JASIM HUSAIN THABET*, BOARD MEMBER
Elected to the Board in 2019
Jasim Husain Thabet serves as TAQA’s Group Chief Executive Officer and Managing Director, a role he has held since July 2020. Mr. Thabet, who was elected to TAQA’s Board of Directors in 2019, is an energy industry veteran with more than two decades of experience. Prior to his role at TAQA, Mr. Thabet served as CEO & MD of Abu Dhabi Power Corporation, where he leveraged the company’s portfolio of assets throughout the value-chain to support the transformation of the power and water sector in the UAE. He also served as CEO of the National Central Cooling Company PJSC (Tabreed), where he drove capacity expansion and revenue growth. Mr. Thabet sits on the board of the Etihad Aviation Group and Abu Dhabi Ports. He holds a bachelor’s degree in mechanical engineering from Saint Martin’s University in the United States.
* In 2020, he served on the board of directors of Emirates Water and Electricity Company, and in 2021, he was appointed to the board of Etihad Aviation Group.

38 TAQA Annual Report 2020
EXECUTIVE MANAGEMENT TEAM
JASIM HUSAIN THABET*, GROUP CHIEF EXECUTIVE OFFICER AND MANAGING DIRECTOR
Jasim Husain Thabet serves as TAQA’s Group Chief Executive Officer and Managing Director, a role he has held since July 2020. Mr. Thabet, who was elected to TAQA’s Board of Directors in 2019, is an energy industry veteran with more than two decades of experience. Prior to his role at TAQA, Mr. Thabet served as CEO & MD of Abu Dhabi Power Corporation, where he leveraged the company’s portfolio of assets throughout the value-chain to support the transformation of the power and water sector in the UAE. He also served as CEO of the National Central Cooling Company PJSC (Tabreed), where he drove capacity expansion and revenue growth. Mr. Thabet sits on the board of the Etihad Aviation Group and Abu Dhabi Ports. He holds a bachelor’s degree in mechanical engineering from Saint Martin’s University in the United States.
STEPHEN RIDLINGTON, CHIEF FINANCIAL OFFICER
Stephen Ridlington serves as TAQA’s Chief Financial Officer, a position he has held since July 2020. Prior to his role at TAQA, Mr. Ridlington was Chief Investment Officer at Abu Dhabi Power Corporation. He previously held positions with BP, TNK-BP, Buried Hill, and the National Central Cooling Company PJSC (Tabreed), serving as CFO at the latter two companies. Mr. Ridlington holds a Master of Philosophy in Economics from St. Antony’s College, Oxford, and a Bachelor of Arts in Economics and Mathematics from the University of Sussex.
MOHAMMAD ADNAN SHARAFI, CHIEF LEGAL OFFICER AND BOARD SECRETARY
Mohammad Adnan Sharafi serves as TAQA’s Chief Legal Officer and Board Secretary, overseeing the Group’s legal, governance, ethics and compliance and regulatory affairs functions. Previously, Mr. Sharafi served as the General Counsel of Abu Dhabi Power Corporation, in addition to more than 12 years within the legal function at Mubadala Investment Company. Prior to Mubadala, Mr. Sharafi worked at Clifford Chance LLP in London and Dubai. Mr. Sharafi is qualified to practice law as a Solicitor of the Supreme Court of England & Wales and holds a Post-Graduate Diploma in Legal Practice from the College of Law as well as a Bachelor of Laws from the University of Westminster, London.
OMAR ABDULLA ALHASHMI, EXECUTIVE DIRECTOR OF TRANSMISSION AND DISTRIBUTION
Omar Abdulla Alhashmi serves as Executive Director of TAQA’s Transmission & Distribution business line, a position he has held since July 2020. In this role, he oversees the company’s diverse portfolio of transmission and distribution assets. Prior to his role at TAQA, Mr. Alhashmi was the Executive Director – Asset Management at Abu Dhabi Power Corporation, where he supported the development of the company’s transformation plan, structure and governance. He has also held leadership positions in Etihad Airways and Mubadala Investment Company. Mr. Alhashmi holds a Master of Business Administration from the London Business School and a Master of Science in Mechanical Engineering from the George Washington University.
* In 2020, he served on the board of directors of Emirates Water and Electricity Company, and in 2021, he was appointed to the board of Etihad Aviation Group.** Mr. Wynn was preceded by Sean McCarthy, who served as TAQA’s acting Head of Group Communications from July 1 to Dec. 31.

39TAQA Annual Report 2020
Strategic Review Operational Review Financial Review Control Environment Financial StatementsOur Business
FARID AL AWLAQI, EXECUTIVE DIRECTOR OF GENERATION
Farid Al Awlaqi serves as Executive Director of TAQA’s Generation business line, a position he has held since July 2020. In this role, he oversees and develops the company’s global power generation and water portfolio. Mr. Al Awlaqi previously served as Senior Vice President in the energy platform at Mubadala Investment Company. Mr. Al Awlaki holds a Master of Business Administration from the London Business School, as well as a Master of Engineering in Petroleum Engineering from Imperial College, London. He also attended Royal Military Academy Sandhurst.
FRANCO POLO, EXECUTIVE DIRECTOR OF OIL AND GAS
Franco Polo serves as the Executive Director of TAQA’s Oil & Gas business line. Prior to his role, Mr. Polo held Upstream Executive positions in various regions including Asia Pacific, Iraq, North Africa & Middle East at Eni, an integrated energy company. He also supported renewable and energy transition projects. Mr. Polo holds a Master of Science and a Bachelor of Science in Geology from the University of Bologna, Italy.
STEPHEN WACKERLE, CHIEF RISK AND INTERNAL AUDIT OFFICER
Stephen Wackerle serves as TAQA’s Chief Risk and Internal Audit Officer. Mr. Wackerle oversees the objective review of TAQA’s internal control system and the Group’s management of significant risks through his responsibility for the activities of internal audit, enterprise risk, health, safety and environment, and security and business continuity. Prior to this role, Mr. Wackerle held leadership roles in risk and audit with Abu Dhabi Power Corporation and BP. Mr. Wackerle is a qualified chartered accountant and CFA charterholder and holds a Bachelor of Commerce and a post-graduate diploma in accounting from the University of Cape Town.
NOEL AOUN, ACTING HEAD OF STRATEGY & M&A
Noel Aoun serves as TAQA’s (acting) head of Strategy and M&A. He previously served as TAQA’s Group Strategy and Business Development Director. In his current role, Mr. Aoun leads the development of TAQA’s corporate strategy and operating model, and the execution of investment strategies while coordinating strategies across the organization’s business lines. Prior to his position at TAQA, he held leadership positions in Schneider Electric and Booz & Co. Mr. Aoun holds a Master of Business Administration from INSEAD and a Master of Science in Electrical and Computer Engineering from Ecole Supérieure des Ingénieurs de Beirut.
GARETH WYNN**, CHIEF COMMUNICATIONS OFFICER
Gareth Wynn serves as TAQA Chief Communications Officer, where he oversees all external, internal, government advocacy and corporate social responsibility activities across the Group. Mr. Wynn has more than two decades of experience as a senior communications leader in international energy companies. He most recently served as Stakeholder and Communications Director for Oil & Gas UK, the leading representative organization for the UK offshore oil and gas industry. Mr. Wynn has also held key senior management positions at EDF Energy and FTI Consulting. He holds a Bachelor of Science in Microbiology and Microbial Technology with honors from the University of Warwick.

40 TAQA Annual Report 2020
CORPORATE GOVERNANCE
TAQA’s corporate governance policy is based on the principles of transparency, fair disclosure, financial supervision and accountability. We believe these principles to be essential elements for establishing a successful governance framework and laying down the foundations and methodologies for our business activities to achieve our goals in line with the interests of our clients, shareholders and employees.
H.E. Mohamed Hassan Al SuwaidiChairman of the Board

TAQABOARD OF DIRECTORS
STRATEGY AND INVESTMENT COMMITTEE
CHIEF EXECUTIVE OFFICER AND MANAGING DIRECTOR
AUDIT COMMITTEE
NOMINATION AND RENUMERATION
COMMITTEE
TAQA Board of Directors Board committees Chief Executive Officer and
Managing Director
41TAQA Annual Report 2020
Strategic Review Operational Review Financial Review Control Environment Financial StatementsOur Business
We at TAQA believe in continuously monitoring and enhancing our control environment to manage and mitigate any potential risks to our business and operations. Based on international best practices and Resolution No. (3/R.M) of 2020 of the Securities and Commodities Authority of the United Arab Emirates (the “SCA” and the “Corporate Governance Guide”), TAQA’s corporate governance framework has evolved to re-emphasize the principles of accountability, fairness, disclosure, transparency and responsibility.
Following the approval of the transaction involving the transfer of the majority of ADPower’s power and water generation, transmission and distribution assets to TAQA, TAQA’s Board of Directors (the “Board”) was appointed by the general assembly of the shareholders on 29 April 2020 for a term of three years. Under the leadership of our new Board and management team with renewed focus on value creation, TAQA announced a new dividend policy reflecting our commitment to excellence, stable investor returns and continued growth.
TAQA has established its control environment through corporate governance practices, risk management and an ethics & compliance office, based on a system of checks and balances. In line with the Corporate Governance Guide, the Board has constituted the Audit Committee and the Nomination and Remuneration Committee to effectively perform its obligations. The Board has additionally constituted a Strategy & Investment Committee.
Main duties and key activities of the Board committees in 2020 are as below:
AUDIT COMMITTEE
Chair Mr. Khaled Abdulla Almass*
Committee Members Mr. Salem Sultan Aldhaheri and Khalifa Sultan Alsuwaidi (Majority Independent members)
Main duties Monitoring the integrity of the Company’s financial statements and reports (annual reports, semi-annual reports, and quarterly reports) and reviewing the financial and accounting policies and procedures of the Company, as well as ensuring the independence of the Company’s external auditor.
Oversee the implementation of the internal control systems (including but not limited to risk management, ethics & compliance and internal audit) and periodically reviews its effectiveness.
Key activities in 2020 • Quarterly and preliminary financial results• Internal audit update• Risk management update• Compliance update• Recapitalization of subsidiaries• Appointment of 2020 external auditors• Delegation of authority policy and updates
* Appointed as chairman of Audit Committee with effect from 14 February 2021 and preceded by Mr. Salem Sultan Aldhaheri (former chairman of Audit Committee)

42 TAQA Annual Report 2020
NOMINATION AND REMUNERATION COMMITTEE
Chair H.E. Saif Mohamed Alhajeri*
Committee Members Mr. Saeed Mubarak Alhajeri and Khalifa Sultan Alsuwaidi(Majority Independent members)
Main duties Recommendation of remuneration strategies and guidelines to the Board that are aligned with the overall business objectives of the Company, formulation and annual review of the policy on granting remunerations, benefits, incentives, and salaries to Board members and Employees and recommendation regarding the general compensation philosophy for the Group, as well as budget for annual incentives are to be awarded.
Key activities in 2020 • 2020 Scorecard• Board and Board Committee fee for 2019• Board nomination and review of candidate profiles• Review of committee charter• New TAQA organizational chart• Change on TAQA representative on boards of business units – Endorsement
* Appointed as chairman of Nomination and Remuneration Committee with effect from 14 February 2021 and preceded by Mr. Saeed Mubarak Alhajeri (former chairman of Nomination and Remuneration Committee)
STRATEGY AND INVESTMENT COMMITTEE
Chair Khalifa Sultan Alsuwaidi
Committee Members Mr. Khaled Abdulla Almass and Mr. Jasim Husain Thabet
Main duties Develop the long-term business strategy of the Group aiming to ensure that the value of the enterprise as a whole is more than the sum of its parts and make the required recommendations to the Board.
Key activities in 2020 • Context, Outlook & Revised Financial Forecasts – Update• 2020 Budget rebase (Capex, Opex and Abex) • Operational, liquidity and equity implications and actions• Corporate Strategy • Budget and 5-Year Plan • Other project based matters
CORPORATE GOVERNANCE (CONTINUED)

43TAQA Annual Report 2020
Strategic Review Operational Review Financial Review Control Environment Financial StatementsOur Business
With the Board setting TAQA’s overarching strategy and the management team implementing the strategy and managing day-to-day operations, the management team undertakes additional procedures for internal controls to ensure good governance and controls over decision making with institution of the following management committees:
CHIEF EXECUTIVE OFFICER AND MANAGING DIRECTOR
INSIDER TRADING SUPERVISION COMMITTEE
EXECUTIVE MANAGEMENT COMMITTEE
HEALTH, SAFETY, SECURITY AND ENVIRONMENT COMMITTEE
RISK AND INTERNAL AUDIT DEPARTMENT
LEGAL AND ETHICS & COMPLIANCE DEPARTMENT
INVESTMENT COMMITTEE
AUDIT COMMITTEE
TAQA Board of Directors Board committees Chief Executive Officer and
Managing Director Management Committee Function
Direct report Indirect
TAQABOARD OF DIRECTORS

44 TAQA Annual Report 2020
EXECUTIVE MANAGEMENT COMMITTEE
Chair Jasim Husain Thabet
Purpose • Executive body to consider, deliberate on and, where applicable, oversee the execution and implementation of matters that are of strategic or of material importance to the Group
INVESTMENT COMMITTEE
Chair Jasim Husain Thabet
Purpose • The purpose of the Committee is to review, assure and endorse for to the Strategy and Investment Committee and the Board, as applicable, investments to be undertaken by members of the Group for operations (including capital expenditure and abandonment expenditure), financing and refinancing (including corporate and project financings), business development projects (including brownfield and greenfield projects), transaction for mergers & acquisitions and disposals
HSSE COMMITTEE
Chair Jasim Husain Thabet
Purpose • To promote a culture of safety in business operations; to oversee the implementation of the HSSE Strategy; to review the processes for measuring and reporting HSSE performance; to oversee the implementation of the HSSE Policy and Management System; and to oversee incident investigations and the implementation of lessons learnt
INSIDER TRADING COMMITTEE
Chair Mr. Saeed Al Darei (Executive Vice President, Government Affairs)
Purpose • Overseeing the implementation of the Group’s internal trading policy;• Preparing an insiders’ register for restricted persons in accordance with the Group’s internal trading policy; and • Monitoring and supervising transactions carried out by restricted persons on the Group’s insiders’ register, the
ownership of the Company’s shares by registered persons and maintaining the insiders’ register itself
CORPORATE GOVERNANCE (CONTINUED)

45TAQA Annual Report 2020
Strategic Review Operational Review Financial Review Control Environment Financial StatementsOur Business
For more information relating to corporate governance practices, please refer to the Corporate Governance Report 2020 available at https://www.taqa.com/wp-content/uploads/2021/03/20210307_TAQA-2020-Corporate-Governance-Report-En.pdf.
ORGANIZATION STRUCTURE (AS ON 31 DECEMBER 2020)
TAQABOARD OF DIRECTORS
BOARD COMMITTEE (NOMINATION AND
REMUNERATION)
CHIEF EXECUTIVE OFFICER AND MANAGING DIRECTOR
BOARD COMMITTEE (AUDIT)
CEO AND MD OFFICE
TRANSMISSION & DISTRIBUTION
SPECIAL PROJECTS & BUSINESS
DEVELOPMENT
BUSINESS DEVELOPMENT
INFORMATION TECHNOLOGY
PLANNING & BUDGETING
HSSEEXTERNAL COMMSETHICS &
COMPLIANCEM&A
TRANSMISSION ASSET
MANAGEMENT
UAE ASSET MANAGEMENT
HUMAN CAPITALFINANCIAL
REPORTING & TAXINTERNAL AUDITINTERNAL COMMSSTRATEGY
DISTRIBUTION ASSET
MANAGEMENT
TECHNICAL & OPERATIONAL EXCELLENCE
INTERNATIONAL ASSET
MANAGEMENTSUPPLY CHAIN
TREASURY, RISK & INSURANCE
ENTERPRISE RISKCSR
INTERNATIONAL ASSET
MANAGEMENT
TECHNICAL & OPERATIONAL EXCELLENCE
GENERAL SERVICEINVESTOR
RELATIONSBUSINESS
CONTINUITY
SECURITY
GOVERNMENT ADVOCACY
TECHNICAL & OPERATION
EXCELLENCE
FINANCE LEGALRISK & INTERNAL
AUDITGENERATION OIL & GAS
DEPUTY CEO BUSINESS SUPPORT
STRATEGY & M&A
COMMUNICATIONS
BOARD COMMITTEE (STRATEGY AND
INVESTMENT)
TAQA Board of Directors Board committees Chief Executive Officer Division Department
Direct report

46 TAQA Annual Report 2020
ETHICS & COMPLIANCEAt TAQA, we know that millions of people rely on us to provide them with vital infrastructure and services. Given the critical nature of our operations, we are committed to perform our responsibilities to the highest professional standards. These standards can only be achieved if we work with integrity, and in accordance with laws and regulations that apply to TAQA, as a global organization. At TAQA we strive not only to generate financial value for our shareholders, but also to serve our stakeholders in an ethical and responsible manner.
TAQA Group Ethics & Compliance Office is mandated to establish a strong, robust and cohesive ethics and compliance culture across the Group. The Ethics & Compliance office functionally reports to the Audit Committee of the Board and has direct access to the Board to deal with matters independently and in confidence.
The Ethics & Compliance Office endeavors to encourage and nurture a culture by working with each of the businesses within the TAQA Group and instituting a framework to prevent, detect, and respond to ethics & compliance matters.
PREVENT DETECT RESPOND
• Code of Ethics & Business Conduct• Policies & Procedures• Training & Awareness
• Risk Assessment• Controls • Monitoring • Screening • Helpline
• Corrective Actions• Disciplinary Actions
By the end of 2020, the Ethics & Compliance Office had significantly overhauled the Code of Ethics & Business Conduct along with four key Policies (Speaking Up Policy, Anti-Bribery & Corruption and Anti-Fraud Policy, Conflicts of Interest Policy and Insider Trading Policy) which will be formally rolled out in 2021. The Ethics & Compliance Office continues to work on the remaining Policies to complete a full suite of Ethics & Compliance Policies.
The Ethics & Compliance Office utilizes digital technologies to enhance the effectiveness of its activities. Such technologies include an independently hosted anonymous helpline that is available to internal and external stakeholders (helpline.taqa.com). This is fundamental to the objective of nurturing a culture where everyone feels comfortable to communicate any concerns knowing that they will be addressed appropriately and allows the organization to respond to any ethical or compliance issues or concerns that might not otherwise come to light. In an effort to be more proactive in its compliance risk identification and mitigation, the Ethics & Compliance Office utilizes data analytics to help further identify any areas or locales of concern.
The Ethics & Compliance Office not only utilizes state of the art technologies in the management of risks and concerns, but also in the creation of an innovative code and policies which are user-friendly and engaging.
To complement this innovative approach, the Ethics & Compliance Office is also working on immersive learning technologies to disseminate Ethics & Compliance learnings in the most effective way. Additionally, as a strategic partner to the organization, the Ethics & Compliance Office offers customized training that addresses the unique requirements of each of the Businesses within the TAQA Group.
CORPORATE GOVERNANCE (CONTINUED)

47TAQA Annual Report 2020
Strategic Review Operational Review Financial Review Control Environment Financial StatementsOur Business
RISK MANAGEMENTTAQA’s risk management system is designed to provide a robust framework to identify, assess and proactively respond to risks. The system applies effective mechanisms to manage, monitor and report on risk that touch on every aspect of our business to ensure that the levels of risk that TAQA may face, as far as practically possible, are properly accounted for.
Our risk management framework outlines our approach to:• Understand the risk environment and enable effective identification and assessment of risks• Consider and confirm the appropriate responses and measures to manage the risks• Monitor and review specific risks to determine effectiveness of their management and to assess further actions• Report on risks and their management
This framework helps enable our understanding of the significant risks that have the potential to impact our business performance, and how well risks are being managed to inform any opportunities for enhancements.
Effective implementation of our risk management system and framework relies on three levels of activity across the company:• Ongoing identification, management and review of risks across business lines, businesses and functions • Structured reviews and reporting at key stages of particular business processes, such as planning, performance reviews and investment
decision-making • Periodic oversight of risks and their management across the Group
Many of our risks are enduring in nature and arise from our strategy, plans and operations. Changes in the environment, both internal and external, can affect the potential impact and likelihood of the risk occurring. We consider these changes when monitoring and reviewing our risks, including identifying emerging risks that could change our risk profile.
TAQA’s enterprise risk management team helps to embed these three levels of activity, maintains the risk management system and framework, and facilitates the development, analysis and review of the risk profile of the company.
We endeavor to apply the three lines model. Businesses and functions, as the first line, are responsible for managing risks, maintaining an effective control environment and checking the effectiveness of their activities. Specific functions are in the second line, (functions within risk and internal audit in relation to risk matters and legal in relation to ethics and compliance matters), set policies and procedures and provide guidance, tools and expertise to support the first line’s management of risks. The third line is independent assurance on the effectiveness of the management of risks as part of the internal control system and is provided through a prioritized program of internal audits.

48 TAQA Annual Report 2020
On behalf of the Board of Directors of Abu Dhabi National Energy Company PJSC (“TAQA”, the “Company” or the “Group”), I am pleased to present the Company’s financial statements for the year ended 31 December 2020 as well as proforma financial information for the same period. This report references proforma financial and operational information as if the transaction between TAQA and Abu Dhabi Power Corporation (“ADPower”) took place on 1 January 2019 (see “Proforma Financial Information – Basis of Preparation”). This enables a more meaningful like-for-like comparison with prior periods.
In 2020, TAQA delivered resilient performance amidst challenging economic conditions. Our results were underpinned by robust contracted and regulated utilities infrastructure businesses that were bolstered by the substantial asset transfer between TAQA and ADPower in July 2020. Operationally, we have continued to supply customers (many of whom are large government and private consumers) with power and water through an expansive portfolio of 19 generation assets with 22.0 GW and 913 MIGD of installed capacity as well as nearly 100 thousand kilometers of transmission and distribution networks. Additionally, we continue to operate international upstream and midstream oil and gas assets outside the UAE.
FINANCIAL HIGHLIGHTS:Our strengthened financial profile, as a result of new and enlarged utilities businesses, allowed the Company to absorb the negative impact of an unprecedented decline in oil and gas commodity prices. • Group revenues of AED 41.2 billion were 6% lower than the prior-year period (2019: AED 43.9 billion), primarily due to lower commodity prices
and production volumes within the Oil & Gas segment • EBITDA was AED 16.0 billion, down 13% (2019: AED 18.3 billion), reflecting lower revenues that were partially offset by lower expenses• Net income (TAQA-share) decreased to AED 2.8 billion (2019: AED 5.4 billion), which reflected a significantly lower contribution from the Oil &
Gas segment that was impacted by an AED 1.5 billion post-tax impairment charge taken in Q1 2020 and lower commodity prices reducing revenues through the rest of the year
• Capital expenditure was AED 4.0 billion, a decrease of 19% (2019: AED 5.0 billion) primarily due to lower spend in the Oil & Gas segment• Total liquidity at year-end remained strong at AED 16.5 billion (2019: AED 16.5 billion) including AED 8.3 billion in cash and cash equivalents
(2019: AED 5.1 billion), and AED 8.2 billion of undrawn credit facilities (2019: AED 11.5 billion)
Segmental highlights:• Transmission & Distribution regulated asset value of AED 80.1 billion, a 3% decrease (2019: AED 82.7 billion) on deflationary and pre-set
regulatory factors• Transmission & Distribution revenues of AED 24.7 billion, 2% lower (2019: AED 25.1 billion) and EBITDA of AED 7.9 billion, 6% lower
(2019: AED 8.3 billion)• Generation revenues of AED 12.3 billion, 3% lower (2019: AED 12.7 billion) and EBITDA of AED 7.6 billion, 1% higher (2019: AED 7.5 billion)• Oil & Gas revenues of AED 4.2 billion, 31% lower (2019: AED 6.1 billion) and EBITDA of AED 0.7 billion, 71% lower (2019: AED 2.5 billion)
OPERATIONAL HIGHLIGHTS:Our utilities businesses maintained high generation and network availabilities, ensuring security of power and water supplies throughout the year despite the challenging conditions imposed by the COVID-19 pandemic.• Transmission power and water network availabilities of 99.1% and 97.8%, respectively, an improvement over the prior year period
(2019: 99.0% and 95.9%)• Generation global technical availability of 93.9% was consistent with the prior period (2019: 93.7%).• Oil & Gas average production volumes were 118.0 mboepd, a 5% decrease (2019: 124.4 mboepd) on delayed drilling campaigns• Construction remains underway for low carbon power and water generation projects in the UAE with a combined capacity of 4.4 GW
and 200 MIGD HEALTH, SAFETY, SECURITY AND ENVIRONMENT (HSSE):A fundamental part of TAQA’s business, COVID-19 related precautions taken across our businesses have helped improve HSSE indicators in 2020. The Group focused on essential operations and reducing manpower and contractor activities, whilst maintaining minimum safe operating levels.• Zero work-related fatalities across the Group as for the same prior-year period• Recorded injury rates (RIR) of 0.41 incidents/1 million hours (2019: 0.82 incidents/1 million hours)• Lost time injuries (LTI) numbered 9 (2019: 19)• Reportable spills numbered 32 (2019: 47)
REPORT OF THE BOARD OF DIRECTORSFor the year ended 31 December 2020

49TAQA Annual Report 2020
Strategic Review Operational Review Financial Review Control Environment Financial StatementsOur Business
CORPORATE DEVELOPMENTS:On 3 February 2020, the Company’s Board of Directors (the “Board”) received an offer from ADPower, its majority shareholder and owner of most of the water and electricity assets across the Emirate of Abu Dhabi. The key terms of the offer were that ADPower would transfer most of its power and water generation, transmission and distribution assets to the Company in exchange for shares and termination of the land lease agreement between ADPower and the Company. After hiring a financial advisor and receiving a fairness opinion, the Board subsequently recommended to shareholders the approval of the landmark transaction at the Annual General Assembly. Shareholders approved the transaction on 29 April 2020 and the transaction was completed on 1 July 2020.
On 29 April 2020, the three-year term of the Board came to an end and a new Board was elected by shareholders at the annual General Assembly. This resulted in the re-election of five board members and the election of two new board members. At the first meeting of the new Board, a new Chairman was elected and the previous Chairman was elected as Vice-chairman.
On 1 July 2020, upon completion of the transaction with ADPower, the Board appointed Jasim Husain Thabet as Group Chief Executive Officer and Managing Director of the Company, and the previous CEO took up a Deputy CEO position in the Company. A new Chief Financial Officer was also appointed. The Deputy CEO subsequently resigned his position and left the Company on 1 November 2020.
On 13 December 2020, the Company’s shareholders approved a new dividend policy, reflecting the Company’s strengthened financial profile following the ADPower transaction and confidence in the Company’s strong growth prospects and cash flow generation ability going forward. The progressive dividend policy covers the three year period for fiscal years 2020-22 and guides toward dividends that will be paid quarterly and grow 10% annually over the period. It is caveated by the consideration of several factors, including the availability of distributable reserves, our capital expenditure plans, credit rating considerations and other cash requirements in future periods.
Following shareholder approval of the new dividend policy, the Board approved and distributed an interim cash dividend of 1.50 fils per share in December 2020. The Board has proposed a final cash dividend of 1.00 fils per share to bring the total cash dividend for 2020 to 2.50 fils per share (or AED 2.8 billion). Dividend distributions for the year will be subject to shareholder approval at the Company’s upcoming Annual General Assembly.
LOOKING AHEAD:2020 was a year of great progress, change and achievement for TAQA despite the financial and operational challenges brought about by the COVID-19 pandemic. Following the transaction with ADPower, and under the leadership of our new CEO and Managing Director, Jasim Husain Thabet, and the new management team, we are well placed to grow using our robust balance sheet, strong cash flow and our position as one of the largest listed integrated utilities companies in the EMEA region.
H.E. Mohamed Hassan Al SuwaidiChairman of the BoardAbu Dhabi National Energy Company PJSC (TAQA)

50 TAQA Annual Report 2020
ABU DHABI NATIONAL ENERGY COMPANY PJSC (“TAQA”) PROFORMA FINANCIAL INFORMATION31 December 2020 (Unaudited)
BASIS OF PREPARATIONThe Pro forma consolidated financial information (“Pro forma financial information”) illustrates the effects on the statement of financial position and financial performance of the transaction whereby Abu Dhabi Power Corporation (“ADPower”) contributed the majority of its power and water generation, transmission and distribution assets (“Acquired assets”) to Abu Dhabi National Energy Company PJSC (“TAQA”). Further details of the transaction are detailed within note 1 of TAQA’s consolidated financial statements for the year ended 31 December 2020.
The Pro forma financial information consists of the unaudited consolidated statement of financial position of the acquired assets and TAQA (together referred to as “the Group”) as at 31 December 2019, and its unaudited pro forma consolidated statement of profit or loss for the twelve month period ended 31 December 2020 and 31 December 2019. These statements are prepared as if the transaction has taken place as at 1 January 2019 with the exception of the bargain purchase on acquisition (detailed in note 1 of TAQA’s consolidated financial statements) which has been recognized as at the date of the transaction, 1 July 2020.
The purpose of the Pro forma financial information is to show the material effects that the transaction would have had on the historical consolidated statement of financial position and consolidated statement of profit or loss as if the Group had already existed in the structure created by the transaction at 1 July 2020. They are not representative of the financial situation and performance that could have been observed if the indicated business combination had been undertaken at an earlier date.
The presentation of the Pro forma financial information of the Group is based on certain pro forma assumptions and has been prepared for illustrative purposes only and, because of its nature, the Pro forma financial information addresses a hypothetical situation and, therefore, does not represent and may not give a true picture of the financial position and profit of the Group.
The Pro forma financial information has been compiled based on the accounting policies adopted by the Group for the preparation of 31 December 2020 financial information. Any impact due to change in accounting policies and related adjustment have been reflected in comparative periods. The Pro forma financial information does not take into consideration the effects of expected synergies or costs incurred to achieve these synergies as a result of the transaction. The Pro forma financial information gives no indication of the results and future financial situation of the Group.

51TAQA Annual Report 2020
Strategic Review Operational Review Financial Review Control Environment Financial StatementsOur Business
PROFORMA CONSOLIDATED STATEMENT OF PROFIT OR LOSS For the year ended 31 December 2020 (Unaudited)
Year ended 31 December2020
AED million2019
AED million
REVENUESRevenue from generation of power and water 12,314 12,669Revenue from transmission and distribution of power and water 24,659 25,147Revenue from oil and gas 4,178 6,082
41,151 43,898COST OF SALESOperating expenses (23,332) (23,625)Depreciation, depletion and amortization (9,606) (9,471)Impairment losses (2,004) –
(34,942) (33,096)
GROSS PROFIT 6,209 10,802
General and administrative expenses (1,920) (2,088)Finance costs (3,271) (3,567)Gain (loss) in fair values of derivatives and fair value hedges 50 (89)Net foreign exchange gain 241 200Share of results of associates and joint ventures 105 125Bargain purchase gain 570 –Other income 231 302
PROFIT BEFORE TAX 2,215 5,685
Income tax credit (expense) 797 (168)
PROFIT FOR THE YEAR 3,012 5,517
Attributable to:Equity holders of the parent 2,788 5,435Non-controlling interests 224 82
3,012 5,517

52 TAQA Annual Report 2020
PROFORMA CONSOLIDATED STATEMENT OF FINANCIAL POSITION As at 31 December 2020 (Unaudited)
31 December 2020
AED million
31 December 2019
AED million
ASSETSNon-current assetsProperty, plant and equipment 125,949 131,749 Operating financial assets 9,740 9,150 Intangible assets 19,232 20,096 Investment in and loans to associates and joint ventures 2,429 2,244 Deferred tax assets 5,622 5,265 Other assets 741 304
163,713 168,808 Current assetsInventories 3,599 3,913 Amounts due from related parties 2,609 7,661 Operating financial assets 1,197 1,038 Accounts receivable, prepayments and other receivables 7,290 8,658 Cash and short term deposits 8,519 5,145
23,214 26,415
TOTAL ASSETS 186,927 195,223
EQUITY AND LIABILITIESEquity attributable to equity holders of the parentShare capital 112,434 112,434 Proposed increase in share capital – 2,113 Statutory reserve 381 2,996Legal reserve – 2,996Merger reserve (56,443) (64,144)Retained earnings 4,925 2,995 Foreign currency translation reserve 19 –Cumulative changes in fair value of derivatives in cash flow hedge 593 –
61,909 59,390 Non-controlling interests 6,880 7,596Loans from non-controlling interest shareholders in subsidiaries 466 206
7,346 7,802
TOTAL EQUITY 69,255 67,192
Non-current liabilitiesInterest bearing loans and borrowings 66,198 73,517 Islamic loans 780 940 Deferred tax liabilities 1,312 1,300 Asset retirement obligations 15,905 16,186 Loan from related party 24 77 Deferred income – grant 315 –Other liabilities 5,497 4,496
90,031 96,516 Current liabilitiesAccounts payable, accrual and other liabilities 16,271 16,481 Interest bearing loans and borrowings 8,856 3,109 Islamic loans 173 192 Amounts due to related parties 2,203 11,624 Bank overdrafts 66 74 Deferred income – grant 72 35
27,641 31,515
TOTAL LIABILITIES 117,672 128,031
TOTAL EQUITY AND LIABILITIES 186,927 195,223

53TAQA Annual Report 2020
Strategic Review Operational Review Financial Review Control Environment Financial StatementsOur Business
REPORT ON THE CONSOLIDATED FINANCIAL STATEMENTS
OpinionWe have audited the consolidated financial statements of Abu Dhabi National Energy Company PJSC (the “Company”) and its subsidiaries (together referred to as the “Group”) (“TAQA”), which comprise the consolidated statement of financial position as at 31 December 2020, and the consolidated statements of profit or loss, comprehensive income, changes in equity and cash flows for the year then ended, and notes to the consolidated financial statements, including a summary of significant accounting policies.
In our opinion, the accompanying consolidated financial statements present fairly, in all material respects, the financial position of the Group as at 31 December 2020, and its financial performance and its cash flows for the year then ended in accordance with International Financial Reporting Standards (IFRSs) as issued by the International Accounting Standards Board.
Basis for Opinion We conducted our audit in accordance with International Standards on Auditing (ISAs). Our responsibilities under those standards are further described in the Auditor’s Responsibilities for the Audit of the Consolidated Financial Statements section of our report. We are independent of the Group in accordance with the International Ethics Standards Board for Accountants’ Code of Ethics for Professional Accountants (IESBA Code) together with the other ethical requirements that are relevant to our audit of the Group’s consolidated financial statements in the United Arab Emirates, and we have fulfilled our other ethical responsibilities in accordance with these requirements and the IESBA Code. We believe that the audit evidence we have obtained is sufficient and appropriate to provide a basis for our opinion.
Key Audit MatterKey audit matter is the matter that, in our professional judgment, is of most significance in our audit of the consolidated financial statements of the current period. This matter was addressed in the context of our audit of the consolidated financial statements as a whole, and in forming our opinion thereon, and we do not provide a separate opinion on this matter.
Key Audit Matter How our audit addressed the key audit matter
Accounting for business acquisition and related purchase price allocation
On 29 April 2020, Shareholders of TAQA approved the acquisition of perimeter assets (the “transaction“) from Abu Dhabi Power Company PJSC with effect from 1 July 2020. The transaction has been accounted for in accordance with IFRS 3 Business Combinations and management elected to use the acquisition method. The transaction was accounted for as a reverse acquisition whereby TransCo was determined to be the accounting acquirer of TAQA, and accordingly the comparative information presented in the consolidated financial statements is that of TransCo.
We determined that the business combination accounting is a key audit matter due to the significant judgments applied by management in:• the determination of the accounting acquirer under the reverse
acquisition;• the determination of the fair value of accounting acquirer;• the determination of the fair value, with involvement of management’s
expert, of assets and liabilities acquired in the transaction; and• the identification and measurement of intangible assets and
determination of the useful lives to be assigned to the identified intangible assets
A number of assumptions were also made bymanagement in the determination of the appropriate methodology, assumptions and valuation techniques.
Refer to Note 1 to the consolidated financial statements.
As part of our audit procedures, we have:• Assessed the design and implementation of controls over the
accounting of the transaction;• Assessed, with the involvement of our internal experts, whether
management’s assumptions in relation to the accounting for the transaction as a reverse acquisition are in accordance with the requirements of IFRS 3;
• Reviewed the sale and purchase agreement to assist us in forming a view of the accounting treatment of the acquisition;
• Assessed the completeness and accuracy of the asset and liability accounts included in the purchase price allocation;
• Evaluated, with involvement of our internal experts, the methodologies and significant inputs used by the Group including the intangible assets and the determination of the useful lives of the identified intangible assets;
• Assessed, with involvement of our internal experts, the fair value of a sample of the assets and liabilities acquired;
• Analyzed the fair value adjustments recognized by management and evaluated whether the adjustments made were in accordance with the requirements of IFRS 3;
• Agreed the fair values of the assets and liabilities determined by management to the amounts presented in the consolidated financial statements;
• Assessed the bargain purchase gain recognized by management and evaluated whether it was accounted for in accordance with the requirements of IFRS 3;
• Performed sensitivity analysis around the key assumptions used by management to ascertain the extent of change in those assumptions that either individually or collectively would be required for additional adjustment to fair values; and
• Assessed the related disclosures in Note 1 of the financial statements to determine if they were in compliance with IFRSs
INDEPENDENT AUDITOR’S REPORT TO THE SHAREHOLDERS OF ABU DHABI NATIONAL ENERGY COMPANY PJSC

54 TAQA Annual Report 2020
Other Information The Board of Directors’ and management are responsible for the other information. The other information comprises the Directors’ Report, which we obtained prior to the date of this auditor’s report, and the Annual Report 2020, which will be made available to us after the auditor’s report date. The other information does not include the consolidated financial statements and our auditor’s report thereon.
Our opinion on the consolidated financial statements does not cover the other information and we do not express any form of assurance or conclusion thereon.
In connection with our audit of the consolidated financial statements, our responsibility is to read the other information identified above and, in doing so, consider whether the other information is materially inconsistent with the consolidated financial statements or our knowledge obtained in the audit, or otherwise appears to be materially misstated.
If, based on the work we have performed on the other information that we obtained prior to the date of this auditor’s report, we conclude that there is a material misstatement of this other information, we are required to report that fact. We have nothing to report in this regard.
When we read the Annual Report for 2020, if we conclude that there is a material misstatement therein, we will be required to communicate the matter to those charged with governance and consider whether a reportable irregularity exists in terms of the auditing standards, which must be reported.
Responsibilities of Management and Those Charged with Governance for the Consolidated Financial Statements Management is responsible for the preparation and fair presentation of the consolidated financial statements in accordance with IFRSs and the applicable provisions of the articles of association of the Company and the UAE Federal Law No. (2) of 2015, and for such internal control as management determine is necessary to enable the preparation of consolidated financial statements that are free from material misstatement, whether due to fraud or error.
In preparing the consolidated financial statements, management is responsible for assessing the Group’s ability to continue as a going concern, disclosing, as applicable, matters related to going concern and using the going concern basis of accounting unless management either intends to liquidate the Group or to cease operations, or has no realistic alternative but to do so.
Those charged with governance are responsible for overseeing the Group’s financial reporting process.
Auditor’s Responsibilities for the Audit of the Consolidated Financial Statements Our objectives are to obtain reasonable assurance about whether the consolidated financial statements as a whole are free from material misstatement, whether due to fraud or error, and to issue an auditor’s report that includes our opinion. Reasonable assurance is a high level of assurance, but is not a guarantee that an audit conducted in accordance with ISAs will always detect a material misstatement when it exists. Misstatements can arise from fraud or error and are considered material if, individually or in the aggregate, they could reasonably be expected to influence the economic decisions of users taken on the basis of these consolidated financial statements.
As part of an audit in accordance with ISAs, we exercise professional judgment and maintain professional skepticism throughout the audit. We also:• Identify and assess the risks of material misstatement of the consolidated financial statements, whether due to fraud or error, design and
perform audit procedures responsive to those risk, and obtain audit evidence that is sufficient and appropriate to provide a basis for our opinion. The risk of not detecting a material misstatement resulting from fraud is higher than the one resulting from error, as fraud may involve collusion, forgery, intentional omission, misrepresentations, or the override of internal control
• Obtain an understanding of internal control relevant to the audit in order to design audit procedures that are appropriate in the circumstances, but not for the purpose of expressing an opinion on the effectiveness of the internal control
• Evaluate the appropriateness of accounting policies used and the reasonableness of accounting estimates and related disclosures made by management
• Conclude on the appropriateness of management’s use of the going concern basis of accounting and based on the audit evidence obtained, whether a material uncertainty exists related to events or conditions that may cast significant doubt on the Group’s ability to continue as a going concern. If we conclude that a material uncertainty exists, we are required to draw attention in our auditor’s report to the related disclosures in the consolidated financial statements or, if such disclosure are inadequate, to modify our opinion. Our conclusions are based on the audit evidence obtained up to the date of our auditor’s report. However, future events or conditions may cause the Group to cease to continue as a going concern
• Evaluate the overall presentation, structure and content of the consolidated financial statements, including the disclosures, and whether the consolidated financial statements represents the underlying transactions and events in a manner that achieves fair presentation
• Obtain sufficient appropriate audit evidence regarding the financial information of the entities or business activities within the Group to express an opinion on the consolidated financial statements. We are responsible for the direction, supervision and performance of the group audit. We remain solely responsible for our audit opinion
INDEPENDENT AUDITOR’S REPORT TO THE SHAREHOLDERS OF ABU DHABI NATIONAL ENERGY COMPANY PJSC (CONTINUED)

55TAQA Annual Report 2020
Strategic Review Operational Review Financial Review Control Environment Financial StatementsOur Business
We communicate with those charged with governance regarding, among other matters, the planned scope and timing of the audit and significant audit findings, including any significant deficiencies in internal control that we identify during our audit.
We also provide those charged with governance with a statement that we have complied with relevant ethical requirements regarding independence, and to communicate with them all relationships and other matters that may reasonably be thought to bear on our independence, and where applicable, related safeguards.
From the matters communicated with those charged with governance, we determine those matters that were of most significance in the audit of the consolidated financial statements of the current period and are therefore the key audit matters. We describe these matters in our auditor’s report unless law and regulations preclude public disclosure about the matter or when, in extremely rare circumstances, we determine that a matter should not be communicated in our report because the adverse consequences of doing so would reasonably be expected to outweigh the public interest benefits of such communication.
Report on other legal and regulatory requirements As required by the UAE Federal Law No. (2) of 2015, we report that for the year ended 31 December 2020:• we have obtained all the information we considered necessary for the purposes of our audit;• the consolidated financial statements have been prepared and comply, in all material respects, with the applicable provisions of the UAE
Federal Law No. (2) of 2015; • the Group has maintained proper books of account;• the financial information included in the Directors’ report is consistent with the books of account of the Group; • the Group has not purchased or invested in any shares during the financial year ended 31 December 2020, except as disclosed in note 1 to
the consolidated financial statements;• note 6 to the consolidated financial statements of the Group discloses social contributions made during the financial year ended
31 December 2020;• note 30 to the consolidated financial statements discloses the material related party transactions and balances, and the terms under which
they were conducted; and• based on the information that has been made available to us, nothing has come to our attention which causes us to believe that the Company
has contravened during the financial year ended 31 December 2020 any of the applicable provisions of the UAE Federal Law No. (2) of 2015 or of its Articles of Association which would materially affect its activities or its financial position as at 31 December 2020
Further, as required by the Resolution of the Chairman of the Abu Dhabi Accountability Authority No. (1) of 2017 pertaining to Auditing the Financial Statements of Subject Entities, we report that based on the procedures performed and information provided to us, nothing has come to our attention that causes us to believe that the Group has not complied, in all material respects, with any of the provisions of the following laws, regulations and circulars as applicable, which would materially affect its activities or the consolidated financial statements as at 31 December 2020:• law of establishment; and• relevant provisions of the applicable laws, resolutions and circulars organizing the Group’s operations
Deloitte & Touche (M.E.)
Obada AlkowatlyRegistration No. 105614 February 2021Abu DhabiUnited Arab Emirates
INDEPENDENT AUDITOR’S REPORT TO THE SHAREHOLDERS OF ABU DHABI NATIONAL ENERGY COMPANY PJSC

56 TAQA Annual Report 2020
CONSOLIDATED STATEMENT OF PROFIT OR LOSSFor the year ended 31 December 2020
31 December
Notes2020
AED million2019
AED million
REVENUESRevenue from generation of power and water 3.1 6,381 –Revenue from transmission and distribution of power and water 3.2 15,380 6,057Revenue from oil and gas 3.3 2,224 –
23,985 6,057
COST OF SALESOperating expenses 4 (12,666) (693)Depreciation, depletion and amortization 5 (5,617) (1,811)
(18,283) (2,504)
GROSS PROFIT 5,702 3,553
General and administrative expenses 6 (1,294) (455)Finance costs 7 (1,581) (1)Net foreign exchange gain 73 –Share of results of associates and joint ventures 15 55 –Interest income 31 –Bargain purchase gain 1 570 –Other income 8 203 85
PROFIT BEFORE TAX 3,759 3,182
Income tax credit 9 258 –
PROFIT FOR THE YEAR 4,017 3,182
Attributable to:Equity holders of the parent 3,808 3,182Non-controlling interests 209 –
PROFIT FOR THE YEAR 4,017 3,182
Basic and diluted earnings per share attributable to equity holders of the parent (AED) 10 0.04 0.04
The accompanying notes form an integral part of these consolidated financial statements.

57TAQA Annual Report 2020
Strategic Review Operational Review Financial Review Control Environment Financial StatementsOur Business
CONSOLIDATED STATEMENT OF OTHER COMPREHENSIVE INCOMEFor the year ended 31 December 2020
31 December2020
AED million2019
AED million
PROFIT FOR THE YEAR 4,017 3,182OTHER COMPREHENSIVE INCOMEItems that may be reclassified to income statement in subsequent periods:Changes in fair values of derivative instruments in cash flow hedges 955 –Exchange differences arising on translation of overseas operations 19 –
974 –Items not to be reclassified to income statement in subsequent periods:Remeasurement gains on defined benefit plans 3 –
3 –NET OTHER COMPREHENSIVE INCOME FOR THE YEAR 977 –
TOTAL COMPREHENSIVE INCOME FOR THE YEAR 4,994 3,182
Attributable to:Equity holders of the parent 4,423 3,182Non-controlling interests 571 –
4,994 3,182
The accompanying notes form an integral part of these consolidated financial statements.

58 TAQA Annual Report 2020
CONSOLIDATED STATEMENT OF FINANCIAL POSITIONAs at 31 December 2020
Notes
31 December 2020
AED million
31 December 2019
AED million
ASSETSNon-current assetsProperty, plant and equipment 12 125,949 42,873Operating financial assets 13 9,740 –Intangible assets 14 19,232 –Investment in and loans to associates and joint ventures 15 2,429 –Deferred tax assets 9 5,622 –Other assets 16 741 114
163,713 42,987
Current assetsInventories 17 3,599 94Amounts due from related parties 30 2,609 5,837Operating financial assets 13 1,197 –Accounts receivable, prepayments and other receivables 18 7,290 61Cash and short term deposits 19 8,519 220
23,214 6,212
TOTAL ASSETS 186,927 49,199
EQUITY AND LIABILITIESEquity attributable to equity holders of the parentShare capital 20 112,434 5,992Proposed increase in share capital 21 – 2,113Statutory reserve 21 381 2,996Legal reserve 21 – 2,996Merger reserve 21 (56,443) –Retained earnings 4,925 3,182Proposed dividend 21 – 2,805Interest free loans from the shareholder 21 – 22,896Foreign currency translation reserve 19 –Cumulative changes in fair value of derivatives in cash flow hedges 593 –
61,909 42,980Non-controlling interests 22 6,880 –Loans from non-controlling interest shareholders in subsidiaries 23 466 –
Total non-controlling interests, including loans 7,346 –
TOTAL EQUITY 69,255 42,980
The accompanying notes form an integral part of these consolidated financial statements.

59TAQA Annual Report 2020
Strategic Review Operational Review Financial Review Control Environment Financial StatementsOur Business
CONSOLIDATED STATEMENT OF FINANCIAL POSITIONAs at 31 December 2020
Notes
31 December 2020
AED million
31 December 2019
AED million
Non-current liabilitiesInterest bearing loans and borrowings 24 66,198 –Islamic loans 25 780 –Deferred tax liabilities 9 1,312 –Asset retirement obligations 26 15,905 –Employees’ end of service benefits 432 112Loan from related party 30 24 –Deferred income – grant 27 315 1,026Other liabilities 28 5,065 77
90,031 1,215
Current liabilitiesAccounts payable, accruals and other liabilities 29 16,271 2,755Interest bearing loans and borrowings 24 8,856 –Islamic loans 25 173 –Amounts due to related parties 30 2,203 2,177Bank overdrafts 19 66 –Deferred income – grant 27 72 72
27,641 5,004
TOTAL LIABILITIES 117,672 6,219
TOTAL EQUITY AND LIABILITIES 186,927 49,199
To the best of our knowledge, the financial information included in these consolidated financial statements fairly presents in all material respects the financial condition, results of operation and cash flows of the Group as of, and for, the periods presented therein. The consolidated financial statements were approved by the Board of Directors on 14 February 2021 and signed on its behalf by:
Chairman of the Board of Directors
Chairman of the Audit Committee
Group Chief Executive Officer & Managing Director
Chief Financial Officer
The accompanying notes form an integral part of these consolidated financial statements.
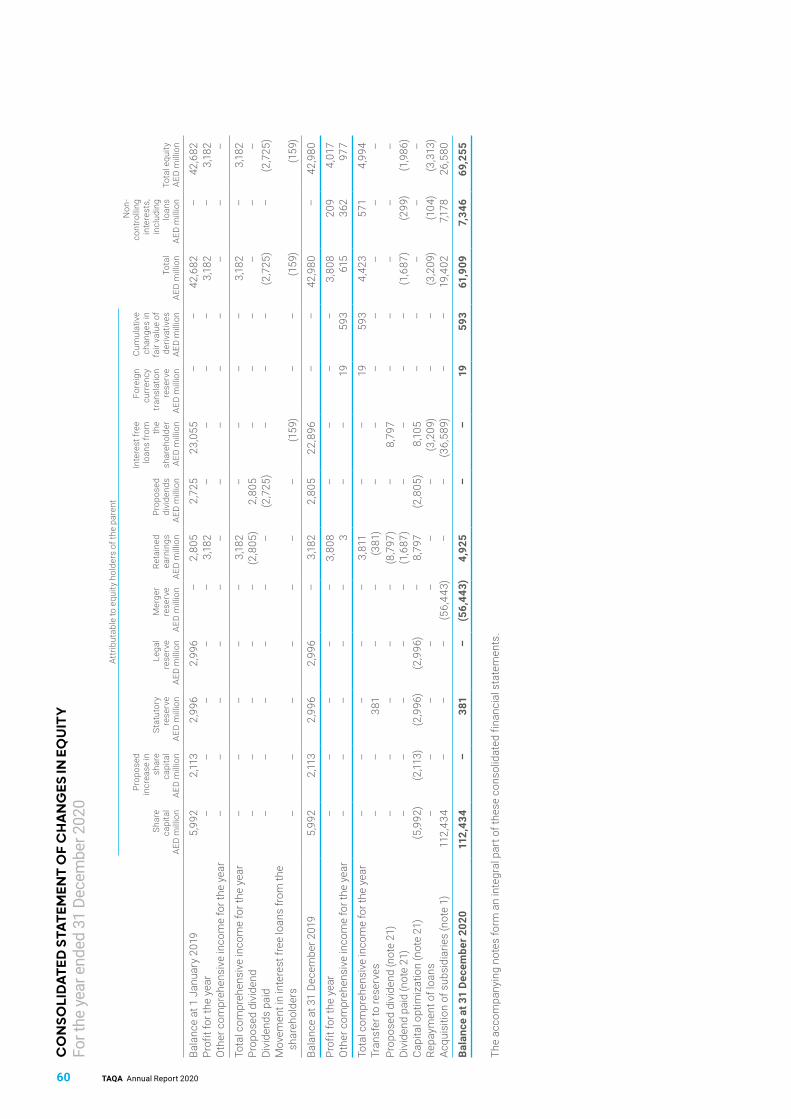
60 TAQA Annual Report 2020
CO
NSO
LID
ATED
STA
TEM
ENT
OF
CH
AN
GES
IN E
QU
ITY
Fo
r the
yea
r end
ed 3
1 De
cem
ber 2
020
Attr
ibut
able
to e
quity
hol
ders
of t
he p
aren
t
Shar
eca
pita
l AE
D m
illio
n
Prop
osed
incr
ease
in
shar
e ca
pita
l AE
D m
illio
n
Stat
utor
yre
serv
eAE
D m
illio
n
Lega
l re
serv
eAE
D m
illio
n
Mer
ger
rese
rve
AED
mill
ion
Reta
ined
ea
rnin
gs
AED
mill
ion
Prop
osed
divi
dend
s AE
D m
illio
n
Inte
rest
free
lo
ans
from
th
e sh
areh
olde
rAE
D m
illio
n
Fore
ign
curr
ency
tr
ansl
atio
n re
serv
eAE
D m
illio
n
Cum
ulat
ive
chan
ges
in
fair
valu
e of
de
rivat
ives
AE
D m
illio
nTo
tal
AED
mill
ion
Non
-co
ntro
lling
inte
rest
s,
incl
udin
glo
ans
AED
mill
ion
Tota
l equ
ity
AED
mill
ion
Bala
nce
at 1
Jan
uary
201
95,
992
2,11
32,
996
2,99
6–
2,80
52,
725
23,0
55–
–42
,682
–42
,682
Prof
it fo
r the
yea
r–
––
––
3,18
2–
––
–3,
182
–3,
182
Oth
er c
ompr
ehen
sive
inco
me
for t
he y
ear
––
––
––
––
––
––
–
Tota
l com
preh
ensi
ve in
com
e fo
r the
yea
r–
––
––
3,18
2–
––
–3,
182
–3,
182
Prop
osed
div
iden
d–
––
––
(2,8
05)
2,80
5–
––
––
–D
ivid
ends
pai
d–
––
––
–(2
,725
)–
––
(2,7
25)
–(2
,725
)M
ovem
ent i
n in
tere
st fr
ee lo
ans
from
the
shar
ehol
ders
––
––
––
–(1
59)
––
(159
)(1
59)
Bala
nce
at 3
1 D
ecem
ber 2
019
5,99
22,
113
2,99
62,
996
–3,
182
2,80
522
,896
––
42,9
80–
42,9
80
Prof
it fo
r the
yea
r–
––
––
3,80
8–
––
–3,
808
209
4,01
7O
ther
com
preh
ensi
ve in
com
e fo
r the
yea
r–
––
––
3–
–19
593
615
362
977
Tota
l com
preh
ensi
ve in
com
e fo
r the
yea
r–
––
––
3,81
1–
–19
593
4,42
357
14,
994
Tran
sfer
to re
serv
es–
–38
1–
–(3
81)
––
––
––
–Pr
opos
ed d
ivid
end
(not
e 21
)–
––
––
(8,7
97)
–8,
797
––
––
–D
ivid
end
paid
(not
e 21
)–
––
––
(1,6
87)
––
––
(1,6
87)
(299
)(1
,986
)C
apita
l opt
imiz
atio
n (n
ote
21)
(5,9
92)
(2,11
3)(2
,996
)(2
,996
)–
8,79
7(2
,805
)8,
105
––
––
–Re
paym
ent o
f loa
ns–
––
––
––
(3,2
09)
––
(3,2
09)
(104
)(3
,313
)Ac
quis
ition
of s
ubsi
diar
ies
(not
e 1)
112,
434
––
–(5
6,44
3)–
–(3
6,58
9)–
–19
,402
7,178
26,5
80
Bala
nce
at 3
1 D
ecem
ber 2
020
112,
434
–38
1–
(56,
443)
4,92
5–
–19
593
61,9
097,
346
69,2
55
The
acco
mpa
nyin
g no
tes
form
an
inte
gral
par
t of t
hese
con
solid
ated
fina
ncia
l sta
tem
ents
.

61TAQA Annual Report 2020
Strategic Review Operational Review Financial Review Control Environment Financial StatementsOur Business
CONSOLIDATED STATEMENT OF CASH FLOWSFor the year ended 31 December 2020
Notes
31 December 2020
AED million
31 December 2019
AED million
OPERATING ACTIVITIESProfit before tax 3,759 3,182Adjustments for:
Depreciation, depletion and amortization 5 5,617 1,811Release of deferred income-grant 27 (29) (72)Gain on exchange – loans and borrowings and operating financial assets 343 –Finance costs 7 1,581 1Share of results of associates and joint ventures 15 (55) –Other movements (45) 56Revenue from operating financial assets 13 (884) –Bargain purchase gain 1 (570) –
Working capital changes:Inventories 299 (3)Accounts receivables and prepayments 1,468 (16)Amounts due from related parties (761) 13,774Amounts due to related parties 836 (17,403)Accounts payable, accruals and other liabilities (1,750) 399
Income tax received 62 –Asset retirement obligation payments 26 (136) –Cash received from operating financial assets 13 978 –
Net cash generated from operating activities 10,713 1,729
INVESTING ACTIVITIESAcquisition of subsidiaries – cash and cash equivalents in acquired entities 1 7,458 –Purchases of property, plant and equipment (2,250) (1,409)Purchases of intangible assets 14 (11) –Other movements 16 –Advance to a related party (148) –
Net cash generated from (used in) investing activities 5,065 (1,409)
FINANCING ACTIVITIESInterest bearing loans and borrowings received 24 1,709 –Repayments of interest bearing loans and borrowings 24 (5,072) –Repayments of Islamic loans 25 (80) –Payments of lease liabilities (93) (1)Interest paid (1,745) (1)Dividend paid to non-controlling interest shareholders (340) –Dividend paid to shareholders (1,687) –Repayment of loans to/obtaining loans from non-controlling interest shareholders in
subsidiaries(104) –
Repayment of interest free loans from shareholder – (159)
Net cash used in financing activities (7,412) (161)

62 TAQA Annual Report 2020
Notes
31 December 2020
AED million
31 December 2019
AED million
NET INCREASE IN CASH AND CASH EQUIVALENTS 8,366 159Net foreign exchange difference (133) –Cash and cash equivalents at 1 January 19 220 61Restricted cash 19 (132) –
CASH AND CASH EQUIVALENTS AT 31 DECEMBER 19 8,321 220
The accompanying notes form an integral part of these consolidated financial statements.
SIGNIFICANT NON-CASH TRANSACTIONS:Issuance of shares by TAQA for acquisition of ADPC Perimeter Assets (note 1) was a non-cash consideration and therefore not reflected above.
Abu Dhabi Transmission & Despatch Company PJSC dividend transferred to shareholder AED 2,725 million in the year ended 31 December 2019. This was offset against amounts due to related parties.
CONSOLIDATED STATEMENT OF CASH FLOWS (CONTINUED)For the year ended 31 December 2020

63TAQA Annual Report 2020
Strategic Review Operational Review Financial Review Control Environment Financial StatementsOur Business
1 CORPORATE INFORMATIONAbu Dhabi National Energy Company PJSC (“TAQA” or the “Company”) was established on 21 June 2005 pursuant to the provisions of Emiri Decree number 16/2005 as a public joint stock company with Abu Dhabi Water and Electricity Authority (“ADWEA”) as its founding shareholder.
In February 2018, Law No. 11 of 2018 on the establishment of the Department of Energy (DOE) was published. Pursuant to the law, all of ADWEA’s assets, rights and obligations were transferred to the Department of Energy and the Department of Energy became their legal successor holding 75.1% shares in TAQA. The Department of Energy is responsible for the control, supervision and regulation of the energy sector in the Emirate of Abu Dhabi, including the Emirate’s energy strategy.
In January 2019, by virtue of Law No. 3 of 2019, the shareholding held by the Department of Energy was transferred to Abu Dhabi Power Corporation (ADPC). As such, TAQA is now a subsidiary of ADPC. ADPC is a 100% owned by Abu Dhabi Development Holding Company (“ADQ”).
TAQA owns a number of strategic power generation and water desalination assets in its domestic market in the UAE and operates internationally across the energy value chain from upstream and midstream oil and gas businesses through to power generation. TAQA’s registered head office is at 25th Floor, Al Maqam Tower, Abu Dhabi Global Market Square, PO Box 55224, Abu Dhabi, United Arab Emirates.
On 29 April 2020, the shareholders of the Company approved a proposed “Transaction” in accordance with the terms of the share purchase agreement entered into between TAQA and ADPC, whereby ADPC contributed the majority of its power and water generation, transmission and distribution assets (“Perimeter Assets”) to TAQA. This was effected through a newly established limited liability company, Al Maqam Energy Holding LLC (Al Maqam) wholly owned by ADPC. The following are the Perimeter Assets forming part of the transaction, which became effective on 1 July 2020;(a) a 100% stake in Abu Dhabi Distribution Company PJSC (ADDC);(b) a 100% stake in Al Ain Distribution Company PJSC (AADC);(c) a 100% stake in Abu Dhabi Transmission & Despatch Company PJSC (TransCo);(d) a 100% stake in Butinah Power Holding Company PJSC, which holds ADPCs interest in the Shuweihat S3 project (BPHC);(e) a 100% stake in Al Mirfa Power Company PJSC, which holds ADPCs interest in the Al Ain and Madinat Zayed generation assets (AMPC);(f) a 75% stake in Al Mirfa Power Holding Company PJSC, which holds the Mirfa project (MPHC);(g) a 100% stake in Sweihan Energy Holding Company PJSC, which holds ADPCs interest in the Noor Abu Dhabi PV project (SEHC);(h) a 10% stake in eight Abu Dhabi Independent Water and Power Producers (“IWPPs”) holding companies (of which the remaining 90% stake is
currently held by TAQA), being Emirates Power Company PJSC (relating to Taweelah A2), Shuweihat Power Company PJSC (relating to Shuweihat S1), Arabian United Power Company PJSC (relating to Umm Al Nar), Taweelah United Power Company PJSC (relating to Taweelah B), Union Power Holding Company PJSC (relating to Fujairah F1), Gulf Power Company PJSC (relating to Taweelah A1), Fujairah Water and Electricity Company PJSC (relating to Fujairah F2) and Al Ruwais Power Holding Company PJSC (relating to Shuweihat S2);
(i) a 33.34% stake in Taweelah RO Holding Company LLC (TROHC), which holds an interest in the Taweelah reverse osmosis project;( j) a 66.66% stake in Fujairah Energy Holding Company LLC, which holds an interest in Fujairah Power Company (Fujairah F3); and(k) a 66.66% stake in Dhafrah Solar Energy Holding Company LLC, which holds an interest in the Al Dhafra Solar PV2 Project
TransCo is responsible for the planning, construction, operation and maintenance of the transmission network used to transmit water and electricity from power and water generators to the distribution networks operated by ADDC and AADC and, where required, to other Emirates in the United Arab Emirates. TransCo also manages the Load Despatch Centre (LDC), which determines the despatch of electricity across the grid. This activity is not part of the Perimeter Assets and will be transferred to Emirates Water and Electricity Company PJSC, a wholly-owned subsidiary of ADPC.
ADDC is the sole distributor of water and electricity in Abu Dhabi and the surrounding areas and AADC is the sole distributor of water and electricity in Al Ain and its surrounding areas. TransCo, ADDC and AADC are all regulated and licensed by the DOE.
As part of the Transaction, ADPC and TAQA also agreed to terminate the existing framework agreement entered into between them effective as of 31 December 2016 (including the underlying lease agreements, contracts, letters and documents) in relation to the plots of land intended to be used for certain future IWPPs in Abu Dhabi (the “Framework Agreement”). Therefore, the consideration transferred by TAQA to ADPC has been adjusted to include the fair value of these plots of land. The termination of the Framework Agreement has no impact on TAQA’s existing operations. At Transaction closing, ADPC transferred the entire issued share capital of Al Maqam to TAQA.
The consideration for transferring of the Perimeter Assets was satisfied by the issuance of a convertible instrument (the “Convertible Instrument”) from TAQA to ADPC and termination of the Framework Agreement. At Transaction closing, the Convertible Instrument was converted into 106,367,950,000 ordinary shares of par value AED 1 each in the capital of TAQA. Following the transaction closing on 1 July 2020, ADPC’s ownership represents 98.60% of the entire issued share capital of TAQA.
NOTES TO THE CONSOLIDATED FINANCIAL STATEMENTS31 December 2020

64 TAQA Annual Report 2020
NOTES TO THE CONSOLIDATED FINANCIAL STATEMENTS (CONTINUED)31 December 2020
1 CORPORATE INFORMATION (CONTINUED)Common Control Transaction and Reverse AcquisitionSince the ultimate controlling party of the combining entities before and after the Transaction remain the same (i.e. ADPC), the Transaction is a business combination involving entities under common control. Although, common control transactions are scoped out of “IFRS 3 – Business Combinations”, based on the guidance contained in “IAS 8 – Accounting Policies, Changes in Accounting Estimates and Errors”, management has a policy choice to account for the common control transaction under acquisition accounting principles contained in IFRS 3 or at the predecessor accounting principles, using book values. The management chose to apply IFRS 3 acquisition accounting for this common control transaction.
IFRS 3 requires one of the combining entities is to be identified as the accounting acquirer being the entity that obtains control of the acquiree. and in some cases, the accounting acquirer may not be the same as the legal acquirer. The overall transaction is deemed to have substance, given different businesses are coming together and the external minority shareholders of TAQA will get diluted. The newly established company Al Maqam cannot be the acquirer, as it does not have substance and will not constitute a business. IFRS 3 provides guidance on the considerations that are relevant for identifying the acquirer. Whilst most considerations may not be relevant for the perspective of transactions under common control, as per the standard, the acquirer is usually the combining entity whose relative size is significantly greater than that of the other combining entities. In this Transaction, TransCo was determined to be the accounting acquirer (or the legal acquiree) given its relative size within the combining entities and TAQA was determined to be the legal acquirer (or the accounting acquiree) resulting in a reverse acquisition.
The principles of reverse acquisition were used to reflect the acquisition of the Company by TransCo, effective 1 July 2020. As a result, the information presented in the financial statements – in the comparative period and the period prior to the acquisition were those of the accounting acquirer, TransCo and not TAQA, the legal acquirer. Furthermore, the number of shares as required under IFRS 3 is that of TAQA (as legal acquirer) and not TransCo and therefore the share capital in the statement of changes in equity is that of TAQA. This resulted in an adjustment within equity of AED 56.4 billion. Refer to note 21 for further details. This also resulted in adjustment to earnings per share for the previous year. These consolidated financial statements are therefore a continuation of the financial statements of TransCo (the accounting acquirer) and the comparatives in these consolidated financial statements are also TransCo. A complete set of significant accounting policies and critical accounting judgments have also been presented and explained in these consolidated financial statements. Despite TransCo being deemed as the accounting acquirer, TAQA will be used to refer to the Group throughout these financial statements. 1.1 Consideration transferred The acquisition date fair value of the equity of the accounting acquirer, TransCo is used to determine the consideration for the combination. At the date of merger TransCo had 50,000 outstanding issued shares represented 59.5% of the value of the combined entity. TransCo, as the accounting acquirer, issued hypothetical shares to the shareholders of TAQA and the Perimeter Assets that represented 40.5 % of the value of the combined entity. To this end, TransCo issued 34,047 hypothetical shares as the purchase consideration for the acquisition of TAQA. The fair value of TransCo shares at the date of merger was AED 1,118,570.53 per share.
The following table summarizes the acquisition date fair value of the consideration transferred:
Fair Valuation % OwnershipAmount
(AED million)
Fair Valuation of TransCo – Accounting Acquirer 59.5% 55,929Fair Valuation of Perimeter Assets – Accounting Acquirees 36.2% 34,020Fair Valuation of TAQA – Accounting Acquiree 4.3% 4,064Combined Fair Value 100% 94,013TransCo Shares % Ownership No. of Shares
TransCo outstanding shares pre-transaction 59.5% 50,000Shares to be issued to Perimeter Assets to achieve post merger capital structure 36.2% 30,414Shares to be issued to TAQA to achieve post merger capital structure 4.3% 3,634
Capital structure of TransCo post-merger (Reverse acquisition) 100% 84,048
Share swap ratio – 1,118,570.53 New TAQA ordinary shares for each share of TransCo
Consideration transferred for the reverse acquisition (34,048 new shares issued at AED 1,118,570.53 per share) 38,084
Less: Non-cash distribution of land (18,682)
Net consideration transferred for the reverse acquisition 19,402

65TAQA Annual Report 2020
Strategic Review Operational Review Financial Review Control Environment Financial StatementsOur Business
1.2 Acquisition-related costsThe acquisition-related costs of the transaction were AED 134 million covering legal fees, valuation and due diligence costs.
1.3 Consideration and purchase price allocation The consideration paid to effect the business combination was based on the report of an external appraisal of the businesses taken as a whole.
Attributed Fair Value as at
1 July 2020AED million
ASSETSNon-current assetsProperty plant and equipment 85,640Operating financial assets 9,528Intangible assets 20,841Investments in associates and joint ventures 1,479Advance and loans to associates 892Deferred tax assets 6,258Other assets 203
124,841
Current assetsInventories 3,802Operating financial assets 1,154Amounts due from related parties 3,095Accounts receivables and prepayments 8,418Cash and short-term deposits 7,458
23,927
TOTAL ASSETS ACQUIRED 148,768
LIABILITIESNon-current liabilitiesInterest bearing loans and borrowings 71,998Islamic loans 819Deferred tax liabilities 1,306Asset retirement obligations 16,032Other liabilities 6,108
96,263
Current liabilitiesAccounts payable, accruals and other liabilities 14,596Interest bearing loans 6,454Islamic loans 168Amounts due to related parties 4,067Bank overdrafts 70
25,355
TOTAL LIABILITIES ACQUIRED 121,618
Fair value of identifiable net assets acquired 27,150Less: Non-controlling interest (7,178)
TAQA share of net assets acquired 19,972Bargain purchase on acquisition (570)
Net consideration transferred for the reverse acquisition 19,402

66 TAQA Annual Report 2020
NOTES TO THE CONSOLIDATED FINANCIAL STATEMENTS (CONTINUED)31 December 2020
1 CORPORATE INFORMATION (CONTINUED)1.3 Consideration and purchase price allocation (continued)The non-controlling interests in TAQA has been recognized at its proportionate share of the acquired net identifiable assets. As such, the non-controlling interest represents share in net assets of TAQA attributable to owners of non-controlling interest.
The fair values of assets and liabilities acquired are based on a the below approaches:
a) Property, plant and equipment (PP&E)The fair value of PP&E for all generation and distribution assets were established based on the depreciated replacement cost (DRC) approach. The DRC approach involves establishing the new replacement cost of the underlying assets, and then adjusting this value to reflect physical, functional and economic obsolescence.
Oil and gas related PP&E were fair valued based on the income approach. The income approach uses a discounted cash flow model as the basis of the valuation. The future cashflows were based on managements business plan for the related entities using a proved and probable (“2P”) reserves base and a commodity price forecast as of the valuation date.
b) Intangible assetsThe fair value of the intangible assets was based on multiperiod excess earnings method approach. The excess earnings method estimates the value of an intangible asset as the present value of the cash flows attributable to the subject intangible asset after excluding the proportion of the cash flows that are attributable to other assets required to generate the cash flows.
The valuation of identifiable intangible assets was performed by an independent professional appraiser. Based on the appraisal report, the following items were included in the purchase price allocation: • Power (& water) purchase agreements;• Power & water distribution licences; and• Reacquired connection rights
c) Operating financial assetsBased on IFRIC 12, the international generation companies recognize operating financial assets, due to unconditional contractual right to receive cash in return for constructing, operating and maintaining power plant from the Government as a part of Power Purchase Agreement. The fair value of the operating financial assets is based on the income approach. In accordance with the income approach using a discounted cash flow method as the basis of the valuation.
1.4 Revenue and profit contributed by the accounting acquireesThe acquired business contributed revenues of AED 22,974 million and net income of AED 1,235 million for the period from 1 July to 31 December 2020.
If the acquisition had occurred on 1 January 2020, consolidated pro forma revenue and net income for the year ended 31 December 2020 would have been AED 41,151 million and AED 3,012 million respectively.
1.5 Cash and cash equivalents contributed by the accounting acquireesOn 1 July 2020 the acquired business contributed net cash and cash equivalents of AED 7,458 million.
1.6 Accounts receivables contributed by the accounting acquireesOn 1 July 2020 the acquired business includes accounts receivables with a fair value of AED 8,418 million and a gross contractual value of AED 9,447 million.
1.7 Interest bearing loans and borrowingsOn 1 July 2020, the acquired business included a portfolio of Medium Term Notes, Bonds and Islamic loans. The fair value attributable to these instruments included within interest bearing loans and borrowings was AED 38,535 million, being the fair value of the debt instruments as at 1 July 2020 based on the quoted market prices at that date. On 1 July 2020, the associated face value of this debt (net of discount and transaction costs) is AED 33,744 million.

67TAQA Annual Report 2020
Strategic Review Operational Review Financial Review Control Environment Financial StatementsOur Business
2 BASIS OF PREPARATION AND ACCOUNTING POLICIES 2.1 Basis of preparationThe consolidated financial statements of TAQA have been prepared on the historical cost basis except for assets and liabilities measured at fair value in accordance with International Financial Reporting Standards (“IFRS”) as issued by the International Accounting Standards Board (“IASB”) and the applicable requirements of the UAE Federal Law No. (2) of 2015.
These consolidated financial statements have been presented in United Arab Emirates Dirhams (AED). All values are rounded to the nearest million (AED million) except where otherwise indicated.
As at 31 December 2020, retained earnings of the Group are AED 4,925 million (2019: AED 3,182 million). As at 31 December 2020, the current liabilities of the Group exceed its current assets by AED 4,427 million (2019: current assets exceeded current liabilities by AED 1,208 million). The consolidated financial statements have been prepared on a going concern basis. The Group has sufficient short to medium term liquidity through the Group’s undrawn committed borrowing facilities (Note 19) to meet ongoing commitments and therefore it is concluded that adequate support is available to evidence that the going concern assumption is appropriate for the preparation of the 2020 consolidated financial statements.
The COVID-19 pandemic has caused an unprecedented global crisis with the measures necessary to contain the virus triggering a global economic downturn. Despite the pandemic’s outbreak in early 2020, the Group has faced no significant disruptions to business and has proactively managed and put in place mitigating measures to limit the impact on the Group’s operations whilst ensuring the highest standards of health, safety and asset reliability are maintained.
Federal Decree-Law No. 26 of 2020 which amends certain provisions of Federal Law No. 2 of 2015 on Commercial Companies was issued on 27 September 2020 and the amendments came into effect on 2 January 2021. The Company is in the process of reviewing the new provisions and will apply the requirements thereof no later than one year from the date on which the amendments came into effect.
The accounting policies adopted in the preparation of these consolidated financial statements comprise of the consistent application of the accounting policies of Abu Dhabi Transmission & Despatch Company PJSC (TransCo) as disclosed in its annual financial statements for the year ended 31 December 2019, accounting policies that have been adopted as part of the business combination as explained in Note 1 and new accounting policies that became effective from 1 January 2020 as explained in Note 2. The accounting policies of TAQA and the Perimeter Assets have been aligned to those of TransCo. The principal accounting policies adopted are set out below: 2.2 Significant accounting policiesBasis of consolidationThese consolidated financial statements incorporate the financial statements of TAQA and entities controlled by TAQA – its subsidiaries (together referred to as the “Group”), made up to 31 December 2020. Control is achieved when the Group:• has the power over the investee;• is exposed, or has rights, to variable returns from its involvement with the investee; and• has the ability to use its power to affects its returns
The Group reassesses whether or not it controls an investee if facts and circumstances indicate that there are changes to one or more of the three elements of control listed above. When the Group has less than a majority of the voting rights of an investee, it considers that it has power over the investee when the voting rights are sufficient to give it the practical ability to direct the relevant activities of the investee unilaterally. The Group considers all relevant facts and circumstances in assessing whether or not its voting rights in an investee are sufficient to give it power, including:• the size of its holding of voting rights relative to the size and dispersion of holdings of the other vote holders;• potential voting rights held by it, other vote holders or other parties;• rights arising from other contractual arrangements; and• any additional facts and circumstances that indicate that it has, or does not have, the current ability to direct the relevant activities at the time
that decisions need to be made, including voting patterns at previous shareholders’ meetings
Consolidation of a subsidiary begins when the Group obtains control over the subsidiary and ceases when it loses control of the subsidiary. Specifically, the results of subsidiaries acquired or disposed of during the period are included in income statement from the date the Group gains control until the date when it ceases to control the subsidiary. Where necessary, adjustments are made to the financial statements of subsidiaries to bring the accounting policies used into line with the Group’s accounting policies. All intragroup assets and liabilities, equity, income, expenses and cash flows relating to transactions between the members of the Group are eliminated on consolidation.
Non-controlling interests in subsidiaries are identified separately from the Group’s equity therein. Those interests of non-controlling shareholders that are present ownership interests entitling their holders to a proportionate share of net assets upon liquidation may initially be measured at fair value or at the non-controlling interests’ proportionate share of the fair value of the acquiree’s identifiable net assets. The choice of measurement is made on an acquisition-by-acquisition basis. Subsequent to acquisition, the carrying amount of non-controlling interests is the amount of those interests at initial recognition plus the non-controlling interests’ share of subsequent changes in equity.

68 TAQA Annual Report 2020
NOTES TO THE CONSOLIDATED FINANCIAL STATEMENTS (CONTINUED)31 December 2020
2 BASIS OF PREPARATION AND ACCOUNTING POLICIES (CONTINUED)2.2 Significant accounting policies (continued)Basis of consolidation (continued)Profit or loss and each component of other comprehensive income/(loss) are attributed to the owners of the Group and to the non-controlling interests. Total comprehensive income of the subsidiaries is attributed to the owners of the Group and to the non-controlling interests even if this results in the non-controlling interests having a deficit balance. Changes in the Group’s interests in subsidiaries that do not result in a loss of control are accounted for as equity transactions. The carrying amount of the Group’s interests and the non-controlling interests are adjusted to reflect the changes in their relative interests in the subsidiaries. Any difference between the amount by which the non-controlling interests are adjusted and the fair value of the consideration paid or received is recognized directly in equity and attributed to the owners of the Group.
Business combinationsAcquisitions of businesses are accounted for using the acquisition method. The consideration transferred in a business combination is measured at fair value, which is calculated as the sum of the acquisition-date fair values of assets transferred by the Group, liabilities incurred by the Group to the former owners of the acquiree and the equity interest issued by the Group in exchange for control of the acquiree. Acquisition-related costs are recognized in profit or loss as incurred.
At the acquisition date, the identifiable assets acquired and the liabilities assumed are recognized at their fair value at the acquisition date, except that deferred tax assets or liabilities and assets or liabilities related to employee benefit arrangements are recognized and measured in accordance with IAS 12 – Income taxes and IAS 19 – Employee benefits respectively.
Goodwill is measured as the excess of the sum of the consideration transferred, the amount of any non-controlling interests in the acquiree, and the fair value of the acquirer’s previously held equity interest in the acquiree (if any) over the net of the acquisition-date amounts of the identifiable assets acquired and the liabilities assumed. If, after reassessment, the net of the acquisition-date amounts of the identifiable assets acquired and liabilities assumed exceeds the sum of the consideration transferred, the amount of any non-controlling interests in the acquiree and the fair value of the acquirer’s previously held interest in the acquiree (if any), the excess is recognized immediately in profit or loss as a bargain purchase gain.
Measurement period adjustments are adjustments that arise from additional information obtained during the ‘measurement period’ (which cannot exceed one year from the acquisition date) about facts and circumstances that existed at the acquisition date.
If the initial accounting for a business combination is incomplete by the end of the reporting period in which the combination occurs, the Group reports provisional amounts for the items for which the accounting is incomplete. Those provisional amounts are adjusted during the measurement period (see above), or additional assets or liabilities are recognized, to reflect new information obtained about facts and circumstances that existed as of the acquisition date that, if known, would have affected the amounts recognized as of that date.
Business combinations under common control, which have substance for the combining entities, are also accounted for using the acquisition method explained above.
Fair value measurementThe Group measures certain financial instruments, such as, derivatives, and certain non-financial assets, at fair value at each reporting date. Fair value is the price that would be received to sell an asset or paid to transfer a liability in an orderly transaction between market participants. The group categorizes assets and liabilities measured at fair value into one of three levels depending on the ability to observe inputs employed in their measurement. Level 1 inputs are quoted prices in active markets for identical assets or liabilities. Level 2 inputs are inputs that are observable, either directly or indirectly, other than quoted prices included within Level 1 for the asset or liability. Level 3 inputs are unobservable inputs for the asset or liability reflecting significant modification to observable related market data or the Group’s assumption about pricing by market participants.
Revenue recognitionRevenue from contracts with customers is recognized when or as the Group satisfies a performance obligation by transferring control of a promised good or service to a customer. The transfer of control usually coincides with title passing to the customer and the customer taking physical possession.
When, or as, a performance obligation is satisfied, the Group recognizes as revenue the amount of the transaction price that is allocated to that performance obligation. The transaction price is the amount of consideration to which the Group expects to be entitled. The transaction price is allocated to the performance obligations in the contract based on standalone selling prices of the goods or services promised.
The different revenue streams of the Group and the timing of revenue recognition in respect of each revenue stream are mentioned on the following page:

69TAQA Annual Report 2020
Strategic Review Operational Review Financial Review Control Environment Financial StatementsOur Business
a) Revenue from transmission and distribution of power and waterThe Group has a transmission system that consists of various transmission lines and transformers that link power stations to the distribution system. The transmission network primarily transports bulk power and water to the distribution networks. The Group also provides infrastructure services for the transmission system network.
The Group earns revenue from licensed and unlicensed activities, using certain assets that are shared between these activities, and other assets that are solely dedicated to unlicensed activities.
Licensed activities represent operations and transactions relating to the transmission of power and water within the Emirate of Abu Dhabi, which are charged to ADDC and AADC (both are Group companies). These transactions are eliminated as intra-group transactions and not reported in these consolidated financial statements post the effective date of the merger transaction, i.e. 1 July 2020.
Unlicensed activities represent operations and transactions relating to transmission of power and water to Federal Electricity and Water Authority and Sharjah Electricity and Water Authority, which are charged to Emirates Water and Electricity Company (EWEC) (previously Abu Dhabi Water and Energy Corporation (ADWEC)).
Transmission use of system charges from shared assets (licensed activities)Revenue from Transmission Use of System (TUOS) charges is calculated in accordance with the formula in the licensed activities document issued by the DOE, under the licenses issued to the Company by DOE for the transmission of water and electricity from generation and desalination plants to the distribution companies and comprise the costs for the provision of shared transmission network services at delivery points to the distribution companies. Specifically, the system charges for the transmission of water and electricity are based on the RC1 which covers the period 2019 to 2021.
Revenue from TUOS charges is recognized upon the delivery of electricity and water.
As per the terms of the License revenue from TUOS charges cannot exceed the maximum allowed electricity and water revenue calculated in accordance with a formula as defined in the License and price control as regulated by the DOE in accordance with the License and correspondence relating to Regulatory Control (RC). System charges from solely dedicated assets (unlicensed activities)The service charges for the transmission of water and electricity to other emirates from solely dedicated assets are based on the specific transmission charge calculated with reference to the costs associated with operating relevant dedicated assets. Such revenue is also recognized upon the delivery of electricity and water.
Revenue from supply and distribution of power and waterThe Group also earns revenue from supply and distribution of power and water in the region of Abu Dhabi. Revenue is subject to Maximum Allowed Revenue (“MAR”) calculated in accordance with a formula as defined in the License document issued by DOE.
Revenue earned from supply business includes charges recoverable from customers for the supply of power and water within the Group’s distribution. Revenue is recognized over time as when the units of power and water are supplied to customers and includes an estimate of the value of the units supplied to customers between the date of the last meter reading and the reporting date. It is considered highly probable that a significant reversal in the cumulative revenue recognized will not occur based on accumulated historical experience of the Group.
When the Group satisfies a performance obligation by transferring a promised good or service, the Group has earned a right to consideration from the customer and, therefore, has a contract asset in the form of account receivable.
Revenue from connection and meter installation feesRevenue from connection and meter installation fees includes income earned from customers for installation of meters and other related equipment. These charges are recognized in profit or loss when the connection is activated.
Revenue from water coupons and prepaid cardsRevenue from prepaid cards represents charges received from the customers for the sale of water coupons and prepaid cards. These charges are recognized in profit on loss at the time when units of water are distributed to the customers against these prepaid cards.
Other operating revenueOther operating revenue in respect of sale of power and water for the period are based on the difference between MAR and revenue billed to customers for the supply and distribution of water and electricity.
Revenue is recognized over time as when the units of power and water are supplied to customers and includes an estimate of the value of the units supplied to customers between the date of the last meter reading and the reporting date.

70 TAQA Annual Report 2020
NOTES TO THE CONSOLIDATED FINANCIAL STATEMENTS (CONTINUED)31 December 2020
2 BASIS OF PREPARATION AND ACCOUNTING POLICIES (CONTINUED)2.2 Significant accounting policies (continued)Revenue recognition (continued)b) Revenue from generation of power and waterThe Group earns revenue from sale of power and water. The revenue recognition of the Group’s power and water business is as follows:• Where the Group determines that the Power and Water Purchase Agreement (PWPA)/Power Purchase Agreement (PPA) meets the financial
asset model requirements for service concession arrangements (explained under significant accounting policy on ‘Service concessions’), consideration receivable is allocated by reference to the relative fair values of the services delivered
• Operating revenue is recognized as the service is provided and finance revenue is recognized using the effective interest rate method on the financial asset
• Where the Group determines that the PWPA/PPA contains an operating lease, capacity payments are recognized as operating lease rental revenue on a systematic basis to the extent that capacity has been made available to the offtaker during the period. Those payments, which are not included as capacity payments (e.g. fuel revenue), are recognized as revenue in accordance with the contractual terms of the PWPA/PPA
• Energy and water payments are recognized as revenue at the point in time when the contracted power and water capacity is provided to the offtaker
• Fuel revenue represents reimbursements from the offtakers in the power and water subsidiaries at market prices for fuel consumed in power generation in accordance with the terms of the power and water purchase agreements and the power purchase agreements. Fuel revenue is recognized as and when fuel is consumed in the production of power and water
c) Revenue from oil and gasRevenue from the sale of oil and gas is recognized at the point in time when control of the product is transferred to the customer, which is generally when the product is physically transferred into a vessel, pipe or other delivery mechanism and the customer accepts the product.
The Group’s sales of oil and gas are priced based on market prices and where necessary adjusted for a quality differential based on the American Petroleum Institute (API) gravity of the oil and gas sold.
Lifting or offtake arrangements for oil and gas produced by certain of the Group’s jointly owned assets are such that each participant may not receive and sell its precise share of the overall production in each period. The resulting imbalance between cumulative production entitlement and cumulative sales attributable to each participant at a reporting date represents ‘underlift’ or ‘overlift’. Underlift and overlift are valued at market value and included within current assets and current liabilities respectively. Movements during an accounting period are adjusted through cost of sales such that gross profit is recognized on an entitlements basis.
Gas storageThe revenue from gas storage is recognized over time as the service is provided and accepted by customers.
Government grantsGrants that compensate the Group for the cost of an asset are initially recognized as a deferred government grant at fair value when there is reasonable assurance that a grant will be received and the Group will comply with the conditions associated with the grant. Subsequently, these grants are recognized in profit or loss on a systematic basis over the useful life of the associated asset.
Taxesa) Current income taxCurrent income tax assets and liabilities for the current and prior periods are measured at the amount expected to be recovered from or paid to taxation authorities. The tax rates and tax laws used to compute the amount are those that are enacted or substantively enacted at the reporting date, in the countries where the Group operates and generates taxable income.
Current income tax relating to items recognized directly in equity is recognized in equity and not in profit or loss. Management periodically evaluates positions taken in tax returns with respect to situations in which applicable tax regulations are subject to interpretation and establishes provisions where appropriate. A provision is recognized for those matters for which the tax determination is uncertain but it is considered probable that there will be a future outflow of funds to a tax authority. The provisions are measured at the best estimate of the amount expected to become payable. The assessment is based on the judgment of tax professionals within the Group supported by previous experience in respect of such activities and in certain cases based on specialist independent tax advice.

71TAQA Annual Report 2020
Strategic Review Operational Review Financial Review Control Environment Financial StatementsOur Business
b) Deferred income tax Deferred income tax assets and liabilities are measured using enacted or substantively enacted income tax rates as at the balance sheet date that are anticipated to apply to taxable income in the years in which temporary differences are anticipated to be recovered or settled. Changes to these balances are recognized in profit or loss or in other comprehensive income/(loss) in the period they occur.
The Group recognizes the financial statement impact of a tax filing position when it is probable, based on the technical merits, that the position will be sustained upon audit. The Group assesses possible outcomes and their associated probabilities. If the Group determines payment is probable, it measures the tax provision at the best estimate of the amount of tax payable.
The carrying amount of deferred income tax assets is reviewed at each reporting date and reduced to the extent that it is no longer probable that sufficient taxable profit will be available to allow all or part of the deferred income tax asset to be utilized. Unrecognized deferred income tax assets are reassessed at each reporting date and are recognized to the extent that it has become probable that future taxable profits will allow the deferred income tax asset to be recovered.
Deferred income tax assets and deferred income tax liabilities are offset, if a legally enforceable right exists to set off current tax assets against current income tax liabilities and the deferred income taxes relate to the same taxable entity and the same taxation authority. Foreign currency translationFor the purpose of these consolidated financial statements, the UAE Dirhams (AED) is the presentation currency of the Group.
In individual subsidiaries, joint ventures and associates, transactions in foreign currencies are initially recorded in the functional currency of those entities at the spot exchange rate on the date of the transaction. Monetary assets and liabilities denominated in foreign currencies are retranslated into the functional currency at the spot exchange rate at the reporting date. Any resulting exchange differences are included in the profit or loss, unless hedge accounting is applied. Non-monetary assets and liabilities, other than those measured at fair value are not retranslated subsequent to initial recognition.
In these consolidated financial statements, the assets and liabilities of foreign operations are translated into AED at the rate of exchange prevailing at the reporting date and their income statements are translated at the weighted average exchange rates on a monthly basis. The exchange differences arising on the translation are recognized in other comprehensive income/(loss) and accumulated in the foreign currency translation reserve within equity. On disposal of a foreign operation, the deferred cumulative amount recognized in equity relating to that particular foreign operation is recognized in profit or loss.
Investments in associates and joint venturesAn associate is an entity over which the Group has significant influence and that is neither a subsidiary nor an interest in a joint venture. Significant influence is the power to participate in the financial and operating policy decisions of the investee but is not control or joint control over those policies.
A joint venture is a joint arrangement whereby the parties that have joint control of the arrangement have rights to the net assets of the joint arrangement. Joint control is the contractually agreed sharing of control of an arrangement, which exists only when decisions about the relevant activities require unanimous consent of the parties sharing control.
The results, assets and liabilities of associates and joint ventures are incorporated in these consolidated financial statements using the equity method of accounting.
Under the equity method, an investment is carried on the statement of financial position at cost plus post-acquisition changes in the Group’s share of net assets of the entity, less distributions received and less any impairment in value of the investment. Loans advanced to equity-accounted entities that have the characteristics of equity financing are also included in the investment on the Group’s statement of financial position. The Group’s statement of profit or loss reflects the Group’s share of the results after tax of the equity-accounted entity, adjusted to account for depreciation, amortization and any impairment of the equity-accounted entity’s assets based on their fair values at the date of acquisition. The Group’s statement of profit or loss and other comprehensive income includes the Group’s share of the equity-accounted entity’s other comprehensive income/(loss). The Group’s share of amounts recognized directly in equity by an equity-accounted entity is recognized directly in the Group’s statement of changes in equity.
Unrealized gains on transactions between the Group and its equity-accounted entities are eliminated to the extent of the Group’s interest in the equity-accounted entity.
The Group assesses investments in equity-accounted entities for impairment whenever events or changes in circumstances indicate that the carrying value may not be recoverable. If any such indication of impairment exists, the carrying amount of the investment is compared with its recoverable amount, being the higher of its fair value less costs of disposal (FVLCD) and value in use (VIU). If the carrying amount exceeds the recoverable amount, the investment is written down to its recoverable amount.

72 TAQA Annual Report 2020
NOTES TO THE CONSOLIDATED FINANCIAL STATEMENTS (CONTINUED)31 December 2020
2 BASIS OF PREPARATION AND ACCOUNTING POLICIES (CONTINUED)2.2 Significant accounting policies (continued)Interests in joint operationsA joint operation is a joint arrangement whereby parties that have joint control of the arrangement have rights to the assets, and obligations for the liabilities, relating to the arrangement. Joint control is the contractually agreed sharing of control of an arrangement, which exists only when decisions about the relevant activities require unanimous consent of the parties sharing control.
The Group accounts for the assets, liabilities, revenues and expenses relating to its interest in a joint operation in accordance with the IFRSs applicable to the particular assets, liabilities, revenues and expenses.
Certain of the Group’s activities in the oil and gas segment are conducted through joint operations where the partners have a direct ownership interest in and jointly control the underlying assets of the joint operation. The Group accounts for its share of the jointly controlled assets, any liabilities it has incurred, its share of any liabilities jointly incurred with other partners, income from the sale or use of its share of the joint operation’s output, together with its share of the expenses incurred by the joint operation, and any expenses it incurs in relation to its interest in the joint operation.
LeasesThe determination of whether an arrangement is, or contains a lease is based on the substance of the arrangement at inception date. The arrangement is assessed for whether the fulfillment of the arrangement is dependent on the use of a specific asset or assets or the arrangement conveys a right to use the asset or assets, even if that right is not explicitly specified in an arrangement.
a) Group as a lessee – Right of use assetsThe Group recognizes right-of-use assets at the commencement date of the lease (i.e., the date the underlying asset is available for use). Right-of-use assets are measured at cost, less any accumulated depreciation and impairment losses, and adjusted for any remeasurement of lease liabilities. The cost of right-of-use assets includes the amount of lease liabilities recognized, initial direct costs incurred, and lease payments made at or before the commencement date less any lease incentives received. Unless the Group is reasonably certain to obtain ownership of the leased asset at the end of the lease term, the recognized right-of-use assets are depreciated on a straight-line basis over the shorter of its estimated useful life and the lease term. Right-of-use assets are subject to impairment.
b) Group as a lessee – Lease liabilities At the commencement date of the lease, the Group recognizes lease liabilities measured at the present value of lease payments to be made over the lease term. The lease payments include fixed payments (including in-substance fixed payments) less any lease incentives receivable, variable lease payments that depend on an index or a rate, and amounts expected to be paid under residual value guarantees. The lease payments also include the exercise price of a purchase option reasonably certain to be exercised by the Group and payments of penalties for terminating a lease, if the lease term reflects the Group exercising the option to terminate. The variable lease payments that do not depend on an index or a rate are recognized as expense in the period in which the event or condition that triggers the payment occurs.
In calculating the present value of lease payments, the Group uses the incremental borrowing rate at the lease commencement date if the interest rate implicit in the lease is not readily determinable. After the commencement date, the amount of lease liabilities is increased to reflect the accretion of interest and reduced for the lease payments made. In addition, the carrying amount of lease liabilities is remeasured if there is a modification, a change in the lease term, a change in the in-substance fixed lease payments or a change in the assessment to purchase the underlying asset.
c) Group as a lessor – Finance leasesLeases where the Group transfers substantially all the risks and benefits of ownership of the asset are classified as financial leases. The amounts due from the lessee are recorded in the consolidated statement of financial position as financial assets and are carried at the amount of the net investment in the lease after making provision for expected credit losses.
d) Group as a lessor – Operating leasesLeases where the Group does not transfer substantially all the risks and benefits of ownership of the asset are classified as operating leases. Initial direct costs incurred in negotiating an operating lease are added to the carrying amount of the leased asset and recognized over the lease term on the same basis as rental income. Contingent rents are recognized as revenue in the period in which they are earned.
Intangible assetsIntangible assets acquired separately are measured on initial recognition at cost. The cost of intangible assets acquired in a business combination is their fair value at the date of acquisition. Following initial recognition, intangible assets are carried at cost less any accumulated amortization and any accumulated impairment losses. Subsequent expenditure is capitalized only when it increases the future economic benefits embodied in the specific asset to which it relates.

73TAQA Annual Report 2020
Strategic Review Operational Review Financial Review Control Environment Financial StatementsOur Business
The useful lives of intangible assets are assessed to be either finite or indefinite. Amortization for intangible assets with finite lives is calculated on a straight-line basis as follows: • Tolling agreement 2 years • Computer software 3 years • Power (& water) purchase agreements 1-22 years• Reacquired connection rights 1-8 years• Power & water distribution licences Indefinite
The expected useful lives of intangible assets are reviewed on an annual basis and, if necessary, changes in useful lives are accounted for prospectively.
Gains or losses arising from de-recognition of an intangible asset are measured as the difference between the net disposal proceeds and the carrying amount of the asset and are recognized in the profit or loss when the intangible asset is derecognized.
Intangible assets with indefinite useful lives are not amortized but are tested for impairment annually. The assessment of indefinite life is reviewed annually to determine whether the indefinite life continues to be supportable. If not, the change in useful life from indefinite to definite is made on a prospective basis.
Oil and natural gas exploration, evaluation and development expenditurea) Exploration & evaluation costs – capitalization Pre-license costs and geological and geophysical exploration costs incurred prior to obtaining the rights to explore are recognized in profit or loss when incurred. Exploration licences are recognized as an exploration and evaluation (“E&E”) asset. The cost of that licence includes the directly attributable costs of its acquisition. Examples of such costs may include non-refundable taxes and professional and legal costs incurred in obtaining the licence. Costs incurred after the rights to explore have been obtained, such as geological and geophysical costs, drilling costs, appraisal and development study costs and other directly attributable costs of exploration and evaluation activity, including technical and administrative costs for each exploration asset, are capitalized as intangible E&E assets. E&E costs are not amortized prior to the conclusion of appraisal activities.
At completion of appraisal activities if technical feasibility is demonstrated and commercial reserves are discovered then, following development sanction, the carrying value of the relevant E&E asset is reclassified as a development and production (“D&P”) asset. This category reclassification is only performed after the carrying value of the relevant E&E asset has been assessed for impairment, and where appropriate, its carrying value adjusted. If commercial reserves are not discovered at the completion of appraisal activity of each asset and it is not expected to derive any future economic benefits, the E&E asset is written off to profit or loss.
b) Development costsExpenditure on the construction, installation or completion of infrastructure facilities such as platforms, pipelines and the drilling of development wells, including unsuccessful development or delineation wells, is capitalized within oil and gas properties.
Property, plant and equipmenta) Property, plant and equipment – generalProperty, plant and equipment is stated at cost less accumulated depreciation and accumulated impairment losses, if any. The present value of the expected cost for the decommissioning obligation of an asset at the end of its useful life is included in the cost of the respective asset if the recognition criteria for a provision are met. Depreciation is calculated so as to write off the cost of property, plant and equipment over the expected useful economic lives of the assets concerned. If significant parts of an item of property, plant and equipment have different useful lives, these significant parts are accounted for as separate items (major components) of property, plant and equipment. The estimated useful lives of assets as follows: • Buildings, equipment and plant and machinery – 3 to 40 years (Depreciation: Straight line basis)• Plant spares – 5 to 40 years (Depreciation: Straight line basis)• Right of use assets – Lower of useful life and lease term (Depreciation: Straight line basis)• Oil and gas properties – Unit of production (Depreciation: Unit of production basis)
The assets’ residual values, useful lives and methods of depreciation are reviewed, and adjusted if appropriate, at each reporting date, with the effect of any changes in estimate accounted for a prospective basis.
The cost of spare parts held as essential for the continuity of operations and which are designated as strategic spares are depreciated on a straight line basis over their estimated operating life. Spare parts used for normal repairs and maintenance are expensed when issued.
An item of property, plant and equipment is derecognized upon disposal or when no future economic benefits are expected from its use or disposal. Any gain or loss arising on derecognition of the asset (calculated as the difference between the net disposal proceeds and the carrying amount of the asset) is included in profit or loss in the period the asset is derecognized.

74 TAQA Annual Report 2020
NOTES TO THE CONSOLIDATED FINANCIAL STATEMENTS (CONTINUED)31 December 2020
2 BASIS OF PREPARATION AND ACCOUNTING POLICIES (CONTINUED)2.2 Significant accounting policies (continued)Property, plant and equipment (continued)b) Property, plant and equipment – oil and gas propertiesOil and gas properties in the development and production phase (“D&P” assets) and other related assets are stated at cost, less accumulated depreciation and accumulated impairment losses (net of reversal of previously recognized impairment losses, if any). The initial cost of an asset comprises its purchase price or construction cost, any costs directly attributable to bringing the asset into operation and the estimate of the decommissioning obligation. The purchase price or construction cost is the aggregate amount paid and the fair value of any other consideration given to acquire the asset.
Oil and gas properties are depreciated on a unit-of-production basis over the proved and probable (“2P”) reserves of the field concerned. The unit-of-production rate for the amortization of field development costs takes into account expenditures incurred to date, together with estimated future development expenditure. Depreciation on oil and gas properties does not commence until the commencement of production from the property.
c) Property, plant and equipment – major maintenance and repairsExpenditure on major maintenance refits or repairs comprises the cost of replacement assets or parts of assets, inspection costs and overhaul costs. Where an asset or part of an asset that was separately depreciated and is now written off is replaced and it is probable that future economic benefits associated with the item will flow to the group, the expenditure is capitalized. Where an asset or part of an asset was not separately considered as a component, the replacement value is used to estimate the carrying amount of the replaced asset (or asset part) which is immediately written off.
Inspection costs associated with major maintenance programs are capitalized when the recognition criteria are met and amortized over the period to the next inspection. Day to day servicing and maintenance costs are expensed as incurred in profit or loss.
d) Property, plant and equipment – capital work in progressCapital work in progress is included in property, plant and equipment at cost on the basis of the percentage completed at the reporting date. The capital work in progress is transferred to the appropriate asset category and depreciated in accordance with the above policies when construction of the asset is completed and commissioned.
Impairment of non-financial assetsThe Group assesses, at each reporting date, whether there is an indication that an asset may be impaired. If any indication exists, or when annual impairment testing for an asset is required, the Group estimates the asset’s recoverable amount. An asset’s recoverable amount is the higher of an asset’s or cash-generating unit’s fair value less costs of disposal (FVLCD) and its value in use (VIU). Recoverable amount is determined for an individual asset, unless the asset does not generate cash inflows that are largely independent of those from other assets or groups of assets. When the carrying amount of an asset or cash generating unit exceeds its recoverable amount, the asset is considered impaired and is written down to its recoverable amount.
In assessing VIU, the estimated future cash flows are discounted to their present value using a pre-tax discount rate that reflects current market assessments of the time value of money and the risks specific to the asset. In the case of VIU calculations, assumptions are also made regarding the cash flows from each asset’s ultimate disposal. In determining FVLCD, recent appropriate market transactions are taken into account, if available.
If no such transactions can be identified, an appropriate valuation model is used. These calculations are corroborated by valuation multiples, quoted share prices for publicly traded subsidiaries or other available fair value indicators. Impairment losses are recognized in the statement of profit or loss in those expense categories consistent with the function of the impaired asset.
An assessment is made at each reporting date to determine whether there is any indication that previously recognized impairment losses may no longer exist or may have decreased. If such indication exists, the Group estimates the asset’s or cash-generating unit’s recoverable amount. A previously recognized impairment loss is reversed only if there has been a change in the assumptions used to determine the asset’s recoverable amount since the last impairment loss was recognized. The reversal is limited so that the carrying amount of the asset does not exceed its recoverable amount, nor exceed the carrying amount that would have been determined, net of depreciation, had no impairment loss been recognized for the asset in prior years. Such reversal is recognized in profit or loss.
For the purpose of E&E asset impairment testing, cash generating units are grouped at the operating segment level. An impairment test performed in the E&E phase therefore involves grouping all E&E assets within the relevant segment with the development & production (D&P) assets belonging to the same segment. The combined segment carrying amount is compared to the combined segment recoverable amount and any resulting impairment loss identified within the E&E asset is written off to profit or loss. The recoverable amount of the segment is determined as the higher of its FVLCD and its VIU.

75TAQA Annual Report 2020
Strategic Review Operational Review Financial Review Control Environment Financial StatementsOur Business
Borrowing costsBorrowing costs directly attributable to the acquisition, construction or production of qualifying assets, which are assets that necessarily take a substantial period of time to get ready for their intended use or sale, are added to the cost of those assets, until such time as the assets are substantially ready for their intended use or sale. Investment income earned on temporary investment of specific borrowings pending their expenditure on qualifying assets is deducted from the borrowing costs eligible for capitalization.
All other borrowing costs are recognized in profit or loss in the period in which they are incurred.
InventoriesInventories of oil and oil products, which represent production from oil and gas facilities of the Group which are tanked at storage facilities awaiting sale, are valued at market value.
All other items of inventory are valued at the lower of cost, determined on the basis of weighted average cost, and net realizable value. Costs are those expenses incurred in bringing each item to its present location and condition. Net realizable value is the estimated selling price in the ordinary course of business, less estimated costs of completion and the estimated costs necessary to make the sale.
Deferred incomeThis represents the value of property, plant and equipment received as a grant and is recognized as income over the period necessary to match with the related costs of property, plant and equipment which are subject to compensation.
Customer and meter depositsCustomer and meter deposits from electricity and water customers are recognized as liability when they are received and are normally settled at the time of disconnecting the customer from the Group’s distribution network.
Service concessionsThe Group accounts for service concession arrangements under IFRIC 12 when the following conditions are met: • the grantor (usually a government entity) controls or regulates what services the operator must provide with the infrastructure, to whom it
must provide them, and at what price; and • the grantor (usually a government entity) controls – through ownership, beneficial entitlement or otherwise – any significant residual interest
in the infrastructure at the end of the term of the arrangement
In view of the above, concession infrastructure that does not meet the requirements of IFRIC 12 is presented as property, plant and equipment. Under IFRIC 12, the operator’s rights over the plant operated under concession arrangements are accounted for based on the party primarily responsible for payment: • the “intangible asset model” is applied when users have primary responsibility to pay for the concession services; and • the “financial asset model” is applied when the grantor has the primary responsibility to pay the operator for the concession services
Where the grantor guarantees the amounts that will be paid over the term of the contract (e.g. via a guaranteed internal rate of return), the financial asset model is used to account for the concession infrastructure, since the grantor is primarily responsible for payment. The financial asset model is used to account for Build, Operate and Transfer (BOT) contracts entered into with the grantor. The Group recognizes financial assets from service concession arrangements in the statement of financial position as operating financial assets at amortized cost.
Financial instrumentsA financial instrument is any contract that gives rise to a financial asset of one entity and a financial liability or equity instrument of another entity. Financial assets and financial liabilities are recognized when the Group becomes a party to the contractual provisions of the instrument.
a) Financial assetsInitial recognition and measurementFinancial assets are classified, at initial recognition, as subsequently measured at amortized cost, fair value through other comprehensive income (FVOCI), or fair value through profit or loss (FVTPL).
The classification of financial assets at initial recognition depends on the financial asset’s contractual cash flow characteristics and the Group’s business model for managing them. With the exception of trade receivables that do not contain a significant financing component or for which the Group has applied the practical expedient, the Group initially measures a financial asset at its fair value plus, in the case of a financial asset not at FVTPL, transaction costs. Transaction costs of financial assets carried at FVTPL are expensed in profit or loss. Trade receivables that do not contain a significant financing component or for which the Group has applied the practical expedient are measured at the transaction price determined under IFRS 15 – Revenue from Contracts with Customers.

76 TAQA Annual Report 2020
NOTES TO THE CONSOLIDATED FINANCIAL STATEMENTS (CONTINUED)31 December 2020
2 BASIS OF PREPARATION AND ACCOUNTING POLICIES (CONTINUED)2.2 Significant accounting policies (continued)Financial instruments (continued)a) Financial assets (continued)When the fair value of financial assets and liabilities differs from the transaction price on initial recognition, the Group recognizes the difference as follows: • When the fair value is evidenced by a quoted price in an active market for an identical asset or liability (i.e. a level 1 input) or based on a
valuation technique that uses only data from observable markets, the difference is recognized as a gain or loss • In all other cases, the difference is deferred and the time of recognition of deferred day one profit or loss is determined individually. It is either
amortized over life of the instrument, deferred until the instrument’s fair value can be determined using market observable inputs, or realized through settlement
In order for a financial asset to be classified and measured at amortized cost or FVOCI, it needs to give rise to cash flows that are ‘solely payments of principal and interest (SPPI)’ on the principal amount outstanding. This assessment is referred to as the SPPI test and is performed at an instrument level.
The Group’s business model for managing financial assets refers to how it manages its financial assets in order to generate cash flows. The business model determines whether cash flows will result from collecting contractual cash flows, selling the financial assets, or both.
Purchases or sales of financial assets that require delivery of assets within a time frame established by regulation or convention in the market place (regular way trades) are recognized on the trade date, i.e., the date that the Group commits to purchase or sell the asset.
Subsequent measurementFor purposes of subsequent measurement, financial assets are classified in four categories:• Financial assets at amortized cost (debt instruments)• Financial assets at FVOCI with recycling of cumulative gains and losses (debt instruments)• Financial assets designated at FVOCI with no recycling of cumulative gains and losses upon derecognition (equity instruments)• Financial assets at fair value through profit or loss
Financial assets at amortized cost (debt instruments)The Group measures financial assets at amortized cost if both of the following conditions are met:• The financial asset is held within a business model with the objective to hold financial assets in order to collect contractual cash flows; and• The contractual terms of the financial asset give rise on specified dates to cash flows that are solely payments of principal and interest on
the principal amount outstanding
Financial assets at amortized cost are subsequently measured using the effective interest (EIR) method and are subject to impairment. Gains and losses are recognized in profit or loss when the asset is derecognized, modified or impaired.
Financial assets at fair value through OCI (debt instruments)The Group measures debt instruments at FVOCI if both of the following conditions are met:• The financial asset is held within a business model with the objective of both holding to collect contractual cash flows and selling financial
assets; and• The contractual terms of the financial asset give rise on specified dates to cash flows that are solely payments of principal and interest on
the principal amount outstanding
For debt instruments at FVOCI, interest income, foreign exchange revaluation and impairment losses or reversals are recognized in profit or loss and computed in the same manner as for financial assets measured at amortized cost. The remaining fair value changes are recognized in OCI. Upon derecognition, the cumulative fair value change recognized in OCI is recycled to profit or loss.
Financial assets designated at FVOCI (equity instruments)Upon initial recognition, the Group can elect to classify irrevocably its equity investments as equity instruments designated at FVOCI when they meet the definition of equity under IAS 32 – Financial Instruments: Presentation and are not held for trading. The classification is determined on an instrument-by-instrument basis.
Gains and losses on these financial assets are never recycled to profit or loss. Dividends are recognized as other income in the statement of profit or loss when the right of payment has been established, except when the Group benefits from such proceeds as a recovery of part of the cost of the financial asset, in which case, such gains are recorded in OCI. Equity instruments designated at FVOCI are not subject to impairment assessment.

77TAQA Annual Report 2020
Strategic Review Operational Review Financial Review Control Environment Financial StatementsOur Business
Financial assets at FVTPLFinancial assets at FVTPL include financial assets held for trading, financial assets designated upon initial recognition at FVTPL, or financial assets mandatorily required to be measured at fair value. Financial assets are classified as held for trading if they are acquired for the purpose of selling or repurchasing in the near term. Derivatives, including separated embedded derivatives, are also classified as held for trading unless they are designated as effective hedging instruments. The detailed accounting treatment of derivatives is described in the accounting policy of derivative financial instrument and hedging activities. Financial assets with cash flows that are not solely payments of principal and interest are classified and measured at FVTPL, irrespective of the business model.
Notwithstanding the criteria for debt instruments to be classified at amortized cost or at FVOCI, as described above, debt instruments may be designated at FVTPL on initial recognition if doing so eliminates, or significantly reduces, an accounting mismatch.
Financial assets at FVTPL are carried in the statement of financial position at fair value with net changes in fair value recognized in profit or loss.
Cash and short-term depositsCash and short-term deposits in statement of financial position comprise of cash at banks and on hand and short term deposits with an original maturity of three months or less. For the purpose of statement of cash flows, cash and cash equivalents consist of cash and short-term deposits as defined above, net of outstanding bank overdrafts.
DerecognitionA financial asset (or, where applicable, a part of a financial asset or part of a group of similar financial assets) is primarily derecognized (i.e., removed from the Group’s statement of financial position) when:• The rights to receive cash flows from the asset have expired; or• The Group has transferred its rights to receive cash flows from the asset or has assumed an obligation to pay the received cash flows in full
without material delay to a third party under a ‘pass-through’ arrangement; and either: – the Group has transferred substantially all the risks and rewards of the asset, or – the Group has neither transferred nor retained substantially all the risks and rewards of the asset, but has transferred control of the asset
When the Group has transferred its rights to receive cash flows from an asset or has entered into a pass-through arrangement, it evaluates if, and to what extent, it has retained the risks and rewards of ownership. When it has neither transferred nor retained substantially all of the risks and rewards of the asset, nor transferred control of the asset, the Group continues to recognize the transferred asset to the extent of its continuing involvement. In that case, the Group also recognizes an associated liability. The transferred asset and the associated liability are measured on a basis that reflects the rights and obligations that the Group has retained.
Continuing involvement that takes the form of a guarantee over the transferred asset is measured at the lower of the original carrying amount of the asset and the maximum amount of consideration that the Group could be required to repay.
ImpairmentThe Group recognizes an allowance for expected credit losses (ECLs) for all debt instruments not held at FVTPL. The Group measures loss allowances at an amount equal to lifetime ECL, except for those financial instruments on which the counter-party has an investment grade credit rating or credit risk has not increased significantly since their initial recognition, in which case 12-month ECL is measured. 12-month ECL are the portion of ECL that result from default events on a financial instrument that are possible within the 12 months after reporting date
The Group uses a provision matrix to calculate ECLs for financial assets. The provision rates are calculated based on estimates including the probability of default (PD) and the loss incurred in default positions (LGD). These estimates are allocated by assessing the counterparty credit ratings. The Group calibrates the matrix to adjust the provision rates with forward-looking information. For instance, if forecast economic conditions (i.e., gross domestic product) are projected to change then the historical default rates are adjusted. At every reporting date, the counterparty credit ratings are updated and changes in the forward-looking estimates are analyzed. The Group’s historical credit loss experience and forecast of economic conditions may also not be representative of customer’s actual default in the future.
For debt instruments at FVOCI, the Group applies the low credit risk simplification. At every reporting date, the Group evaluates whether the debt instrument is considered to have low credit risk using all reasonable and supportable information that is available without undue cost or effort. In making that evaluation, the Group reassesses the internal credit rating of the debt instrument. In addition, the Group considers that there has been a significant increase in credit risk when contractual payments are more than 30 days past due.

78 TAQA Annual Report 2020
NOTES TO THE CONSOLIDATED FINANCIAL STATEMENTS (CONTINUED)31 December 2020
2 BASIS OF PREPARATION AND ACCOUNTING POLICIES (CONTINUED)2.2 Significant accounting policies (continued)Financial instruments (continued)a) Financial assets (continued)Impairment (continued)Significant increase in credit riskIn assessing whether the credit risk on a financial instrument has increased significantly since initial recognition, the Group compares the risk of a default occurring on the financial instrument as at the reporting date with the risk of a default occurring on the financial instrument as at the date of initial recognition. In making this assessment, the Group considers both quantitative and qualitative information that is reasonable and supportable, including historical experience and forward-looking information that is available without undue cost or effort.
The Group regularly monitors the effectiveness of the criteria used to identify whether there has been a significant increase in credit risk and revises them as appropriate to ensure that the criteria are capable of identifying significant increase in credit risk before the amount becomes past due.
The Group assumes that the credit risk on a financial instrument has not increased significantly since initial recognition if the financial instrument is determined to have low credit risk at the reporting date. A financial instrument is determined to have low credit risk if: • The financial instrument has a low risk of default; • The borrower has a strong capacity to meet its contractual cash flow obligations in the near term; and • Adverse changes in economic and business conditions in the longer term may, but will not necessarily, reduce the ability of the borrower to
fulfill its contractual cash flow obligations
Definition of defaultThe Group employs statistical models to analyze the data collected and generate estimates of PD of exposures with the passage of time. This analysis includes the identification for any changes in default rates and changes in key macro-economic factors across various geographies of the Group.
Credit-impaired financial assetsA financial asset is credit-impaired when one or more events that have a detrimental impact on the estimated future cash flows of that financial asset have occurred. Evidence that a financial asset is credit-impaired includes observable data about the following events:• significant financial difficulty of the issuer or the borrower; • a breach of contract, such as a default or past due event; • the lender(s) of the borrower, for economic or contractual reasons relating to the borrower’s financial difficulty, having granted to the
borrower a concession(s) that the lender(s) would not otherwise consider; • it is becoming probable that the borrower will enter bankruptcy or other financial reorganization; or • the disappearance of an active market for that financial asset because of financial difficulties
Write-off policyThe Group writes off a financial asset when there is information indicating that the counterparty is in severe financial difficulty and there is no realistic prospect of recovery, and all the efforts for collection of the receivables are exhausted. Financial assets written off may still be subject to enforcement activities under the Group’s recovery procedures, taking into account legal advice where appropriate. Any recoveries made are recognized in the consolidated profit or loss.
Measurement and recognition of expected credit lossesThe measurement of expected credit losses is a function of the PD, loss given default (LGD) (i.e. the magnitude of the loss if there is a default) and the exposure at default. The assessment of the PD and LGD is based on historical data adjusted by forward-looking information as described above. As for the exposure at default, for financial assets, this is represented by the assets’ gross carrying amount at the reporting date; for financial guarantee contracts, the exposure includes the amount drawn down as at the reporting date, together with any additional amounts expected to be drawn down in the future by default date determined based on historical trend, the Group’s understanding of the specific future financing needs of the debtors, and other relevant forward-looking information.
For financial assets, the expected credit loss is estimated as the difference between all contractual cash flows that are due to the Group in accordance with the contract and all the cash flows that the Group expects to receive, discounted at the original effective interest rate.

79TAQA Annual Report 2020
Strategic Review Operational Review Financial Review Control Environment Financial StatementsOur Business
b) Financial liabilitiesInitial recognition and measurementAt initial recognition, the Group measures a financial liability not classified as FVTPL, at its fair value minus transaction costs that are incremental and directly attributable to the acquisition or issue of the financial liability. Transaction costs of financial liabilities carried at FVTPL are expensed in profit or loss.
Subsequent measurementFor purposes of subsequent measurement, financial liabilities are classified in two categories:• Financial liabilities at amortized cost• Financial liabilities at FVTPL
Financial liabilities subsequently measured at amortized cost The Group measures financial liabilities that are not held-for-trading and are not designated as at FVTPL at amortized cost at the end of subsequent accounting periods. The carrying amounts of financial liabilities that are subsequently measured at amortized cost are determined based on the effective interest method. Interest expense that is not capitalized as part of costs of an asset is included in the finance costs in the statement of profit or loss.
Financial liabilities subsequently measured at FVTPLThe Group measures financial liabilities that are classified as held for trading, i.e. if they are incurred for the purpose of repurchasing in the near term, at FVTPL. This category also includes derivative financial instruments, including separated embedded derivatives, entered into by the Group that are not designated as hedging instruments in hedge relationships as defined by IFRS 9. Financial guarantee contracts and loan commitments issued by the Group are also designated by the Group as financial liabilities at FVTPL. Gains or losses on financial liabilities at FVTPL are recognized in profit or loss.
DerecognitionThe Group derecognizes financial liabilities when the obligation is discharged, canceled or expires. Any difference between carrying value of financial liability extinguished and the consideration paid is recognized in profit or loss.
c) Offsetting financial instrumentsFinancial assets and liabilities are offset and the net amount reported in the statement of financial position when there is a legally enforceable right to offset the recognized amounts and there is an intention to settle on a net basis or realize the asset and settle the liability simultaneously.
d) Derivative financial instruments and hedge accountingThe Group enters into a variety of derivative financial instruments to manage its exposure to interest rate and foreign exchange rate risks, including foreign exchange forward contracts and interest rate swaps. Further details of derivative financial instruments are disclosed in note 32.
Derivative financial instruments are initially recognized at fair value on the date on which a derivative contract is entered into and are subsequently remeasured at fair value. Derivatives are carried as financial assets when the fair value is positive and as financial liabilities when the fair value is negative.
Hedge accountingAt the inception of a hedge relationship that qualifies for hedge accounting, the Group formally designates and documents the hedge relationship to which it wishes to apply hedge accounting and the risk management objective and strategy for undertaking the hedge.
The documentation includes identification of the hedging instrument, the hedged item, the nature of the risk being hedged and how the Group will assess whether the hedging relationship meets the hedge effectiveness requirements (including the analysis of sources of hedge ineffectiveness and how the hedge ratio is determined).
A hedging relationship qualifies for hedge accounting if it meets all of the following effectiveness requirements: • There is ‘an economic relationship’ between the hedged item and the hedging instrument • The effect of credit risk does not ‘dominate the value changes’ that result from that economic relationship • The hedge ratio of the hedging relationship is the same as that resulting from the quantity of the hedged item that the Group actually hedges
and the quantity of the hedging instrument that the Group actually uses to hedge that quantity of hedged item

80 TAQA Annual Report 2020
NOTES TO THE CONSOLIDATED FINANCIAL STATEMENTS (CONTINUED)31 December 2020
2 BASIS OF PREPARATION AND ACCOUNTING POLICIES (CONTINUED)2.2 Significant accounting policies (continued)Financial instruments (continued)d) Derivative financial instruments and hedge accounting (continued)Hedge accounting (continued)Hedges that meet all the qualifying criteria for hedge accounting are accounted for, as described below:
Fair value hedgesChanges in the fair value of derivatives that are designated and qualify as fair value hedges are recognized in profit or loss immediately, together with any changes in the fair value of the hedged asset or liability that are attributable to the hedged risk. The change in the fair value of the hedging instrument and the change in the hedged item attributable to the hedged risk are recognized in the line of the statement of profit or loss relating to the hedged item.
Hedge accounting is discontinued when the Group revokes the hedging relationship, when the hedging instrument expires or is sold, terminated, or exercised, or when it no longer qualifies for hedge accounting. The fair value adjustment to the carrying amount of the hedged item arising from the hedged risk is amortized to profit or loss from that date.
Cash flow hedgesThe effective portion of changes in the fair value of derivatives that are designated and qualify as cash flow hedges is recognized in statement of profit or loss and other comprehensive income and accumulated under the heading of changes in fair values of derivative instruments in cash flow hedges. The gain or loss relating to the ineffective portion is recognized immediately in statement of profit or loss, and is included in changes in fair values of derivatives and fair value hedges line item.
Amounts previously recognized in other comprehensive income/(loss) and accumulated in equity are reclassified to the profit or loss in the periods when the hedged item is recognized in profit or loss, in the same line of the statement of profit or loss as the recognized hedged item. However, when the hedged forecast transaction results in the recognition of a non-financial asset or a non-financial liability, the gains and losses previously recognized in other comprehensive income/(loss) and accumulated in equity are transferred from equity and included in the initial measurement of the cost of the non-financial asset or non-financial liability.
Hedge accounting is discontinued when the Group revokes the hedging relationship, when the hedging instrument expires or is sold, terminated, or exercised, or when it no longer qualifies for hedge accounting. Any gain or loss recognized in other comprehensive income/(loss) and accumulated in equity at that time remains in equity and is recognized when the forecast transaction is ultimately recognized in profit or loss. When a forecast transaction is no longer expected to occur, the gain or loss accumulated in equity is recognized immediately in profit or loss.
Employees benefitsa) Annual leave and leave passageAn accrual is made for estimated liability for employees’ entitlement to annual leave and leave passage as a result of services rendered by eligible employees up to the end of the reporting period.
b) End of service benefitsDefined contribution plansThe Group provides end of service benefits to certain employees. The entitlement to these benefits is based upon the employees’ final salary and length of service, subject to the completion of a minimum service period. The expected costs of these benefits are accrued over the period of employment. With respect to its UAE national employees, the Group makes contributions to the Abu Dhabi Retirement Pensions and Benefits Fund calculated as a percentage of the employees’ salaries. Where the Group’s obligations are limited to these contributions made to pension and benefit funds, these contributions are expensed on a monthly basis and paid when due.
Defined benefit plansThe cost of defined benefit pension plans and other post employment medical benefits and the present value of the pension obligation are determined using actuarial valuations. The cost of providing benefits under defined benefit plans is determined using the projected unit credit method. Remeasurements, comprising of actuarial gains and losses, the effect of the asset ceiling, excluding amounts included in net interest on the net defined benefit liability and the return on plan assets (excluding amounts included in net interest on the net defined benefit liability), are recognized immediately in statement of financial position with a corresponding debit or credit to retained earnings through other comprehensive income/(loss) in the period in which they occur. Remeasurements are not reclassified to profit or loss in subsequent periods.
Provisionsa) GeneralProvisions are recognized when the Group has a present obligation (legal or constructive) as a result of a past event, it is probable that an outflow of resources embodying economic benefits will be required to settle the obligation and a reliable estimate can be made of the amount of the obligation. When the Group expects some or all of a provision to be reimbursed, for example under an insurance contract, the reimbursement is recognized as a separate asset but only when the reimbursement is virtually certain. The expense relating to any provision is presented in statement of profit or loss net of any reimbursement. If the effect of the time value of money is material, provisions are discounted using a current pre-tax rate that reflects the time value of money and where appropriate, the risks specific to the liability. Where discounting is used, the increase in the provision due to the passage of time is recognized as a finance cost.

81TAQA Annual Report 2020
Strategic Review Operational Review Financial Review Control Environment Financial StatementsOur Business
b) Asset retirement obligations (ARO)/decommissioning liabilityCertain subsidiaries have legal obligations in respect of site restoration and abandonment of their power generation and water desalination assets and oil and gas properties at the end of their useful lives (decommissioning costs). The Group records a provision for the site restoration and abandonment based upon estimated costs at the end of their useful lives. Accordingly, a corresponding asset is recognized in property, plant and equipment. Decommissioning costs are recorded at the present value of expected costs to settle the obligations using estimated cash flows and are recognized as part of the cost of each specific asset. The cash flows are discounted at a rate that reflects the risks specific to the decommissioning liability. The accretion is expensed as incurred and recognized in the statement of profit or loss as a finance cost. The estimated future costs of the asset retirement obligation are reviewed annually and adjusted as appropriate. Changes to provisions based on revised costs estimates or discount rate applied charges are added to or deducted from the cost of the relevant asset.
c) Production bonusesUnder the terms of the relevant production sharing arrangements, the Group’s European (TAQA Bratani and TAQA Energy) and North American (TAQA North) oil and gas assets are entitled to its participating share in hydrocarbon production based on the Group’s working interest. The Group’s oil assets in the Kurdistan region of Iraq (TAQA Atrush) are entitled to its participating interest in the crude oil production based on the Group’s participating interest.
For the Group’s investment in TAQA Atrush asset, the production sharing contract contains a legal obligation for production bonuses to be paid to the Kurdistan Regional Government when certain production targets are achieved. The Group records a provision for these bonuses when it is probable that an outflow of resources embodying economic benefits will be required to settle the obligation. This is assessed based on the Group’s share of proved and probable reserves under the production sharing contract.
ContingenciesFrom time to time, the Group receives claims in the ordinary course of business. Liabilities and contingencies in connection with these matters are periodically assessed based upon the latest information available, usually with the assistance of lawyers and other specialists. A liability is accrued only if an adverse outcome is more likely than not and the amount of the loss can be reasonably estimated. If one of these conditions is not met, the claim is disclosed as a contingent liability, if material. The actual outcome of a claim may differ from the estimated liability and consequently may affect the financial performance and position of the Group.
2.3 Significant accounting judgments, estimates and assumptionsIn the application of the Group’s accounting policies, management is required to make judgments, estimates and assumptions about the carrying amounts of assets and liabilities that are not readily apparent from other sources. The estimates and associated assumptions are based on historical experience and other factors that are considered to be relevant. However, uncertainty about these assumptions and estimates could result in outcomes that could require a material adjustment to the carrying amount of the asset or liability affected in the future.
The estimates and underlying assumptions are reviewed on an ongoing basis. Revisions to accounting estimates are recognized in the period in which the estimate is revised if the revision affects only that period, or in the period of the revision and future periods if the revision affects both current and future periods.
Significant judgments in applying accounting policiesThe management has made the following judgments, which have the most significant effect on the amounts recognized in these consolidated financial statements:
Revenue recognition – Connection and supply of water and electricity Significant judgment was exercised in determining whether the connection and supply of water/electricity are considered to be two distinct performance obligations as that can have a considerable impact on how the related revenue is recognized. Management considered the detailed criteria of IFRS 15 Revenue from Contracts with Customers along with a variety of factors including, but not limited to, the connection and supply agreements, tariffs charged, etc.
In light of the facts and circumstances, management believes that connection and supply are two distinct performance obligations, hence revenue should be recognized as and when each one of the obligations are satisfied. For connection fees, the obligation is fulfilled once the connection is complete after which the Group has the right to receive consideration in full. As a result, revenue related to connection charges is recognized upon initiation of the connection at a point in time. Since the obligation of supply of water/electricity is fulfilled as the product/service is provided, related revenue is also recognized at a point in time upon supply. Conversely if the connection and supply were considered to be one performance obligation, the related connection charges would be deferred over the useful life of the assets installed to provide the connection.
Power and Water Purchase Agreementsa) Service concession agreementsSome of the Group’s foreign subsidiaries have entered into Power Purchase Agreements (“PPA”) with offtakers in countries where they are operating. Management has determined these arrangements to be service concession arrangements under IFRIC 12 – Service Concession Arrangements by applying the requirements of the interpretation to the facts and circumstances in each location. The Group’s domestic (United Arab Emirates) subsidiaries have also entered into long term Power and Water Purchase Agreements (“PWPA”) and PPAs with EWEC. Based on the terms of the PWPAs/PPAs, management has determined that EWEC does not control any residual interest in the respective plants at the end of the term of the PWPAs/PPAs and therefore does not consider the PWPAs/PPAs to fall within the scope of IFRIC Interpretation 12 Service Concession Arrangements.

82 TAQA Annual Report 2020
NOTES TO THE CONSOLIDATED FINANCIAL STATEMENTS (CONTINUED)31 December 2020
2 BASIS OF PREPARATION AND ACCOUNTING POLICIES (CONTINUED)2.3 Significant accounting judgments, estimates and assumptions (continued)Significant judgments in applying accounting policies (continued)Power and Water Purchase Agreements (continued)b) Operating lease commitments – Subsidiaries as lessorAs mentioned above, the Group’s domestic subsidiaries have entered into PWPAs/PPAs. Under the PWPAs/PPAs, the subsidiaries receive payment for the provision of power and water capacity, whether or not the offtaker EWEC requests power or water output (“capacity payments”), and for the variable costs of production (“energy and water payments”). The Group has determined the PWPAs/PPAs are lease arrangements as management considers that the Group retains the principal risks and rewards of ownership of the plants, based on management’s estimate of the useful life and residual value of the assets, and so accounts for the PWPAs/PPAs as operating leases. An estimate of the useful life of the asset and residual value is made and reviewed annually. The effects of changes in useful life are recognized prospectively, over the remaining life of the asset. When there are amendments to the PWPAs/PPAs, management reconsiders whether the Group continues to retain the principal risks and rewards of ownership of the plants.
Equity or liability classificationInterest free loans are classified either as financial liabilities or as equity in accordance with the substance of the contractual arrangement and criteria of IAS 32. Unsecured amounts without defined interests and repayment terms are treated as equity contribution.
Capitalization of project costsa) Transmission networkIn determining the timing of recording of assets and commencing the depreciation, management has considered the principles laid down in IAS 16 – Property, Plant and Equipment, the time of the completion of the commissioning and the time when the asset is ready for its intended use i.e. it is probable that economic benefits will flow to the Group and assets are operational and under the use of the Group.
Project costs, related to the transmission network of the Group, capitalized under capital work in progress are transferred to the relevant category of property, plant and equipment when the following criteria are met:a) the distribution network is connected to the transmission network;b) the project capitalization form is approved by the asset management directorate; and c) the provisional acceptance certificate is issued to the contractor
Any revision in the engineer’s estimates are adjusted prospectively with the recorded project costs. The Group recognizes funded transmission and despatch projects once the respective work is completed, all the regulatory approvals are obtained from the Regulation and Supervision Bureau, the transmission and despatch asset transfer agreements are signed and the transmission and despatch assets are made available for use. The Group signed a Memorandum of Understanding (MOU) with the transferor in prior years. The MOU states that the transferor bears the risks and title to transmission and despatch project construction assets until successful completion of the commissioning of the respective stage. Accordingly, management has determined that the transfer of these transmission and despatch project construction assets have not taken place in accordance with the accounting policies of the Group, MOU’s and asset transfer agreement.
b) Major development projects – Distribution assetsIn determining the timing of recording of these distribution assets which are received from various developers and commencing the depreciation, management has considered the principles laid down in IAS 16, the time of completion of commissioning and the time when the assets are ready for its intended use i.e. it is probable that economic benefits flow to the Group given its exclusive distribution license and the distribution assets are operational and under the use of the Group.
During the year, management has considered the detailed criteria of IAS 16 and reviewed the transfer agreements and the correspondences with developers and consultants of these projects to obtain the justification for their recognition in the Group’s consolidated financial statements. Management believes that these distribution assets meet the conditions mentioned in IAS in terms of capitalizing these distribution assets and consequently depreciating them from the date when these distribution assets were available for use.
Capitalization of staff costsManagement determines whether the Group will recognize an asset from the staff costs incurred to fulfill a project if such costs meet all the following criteria: a) the costs relate directly to a project that the Group can specifically identify; b) the costs generate or enhance resources of the Group that will be used in satisfying performance obligations in the future; andc) the costs are expected to be recovered
Such staff costs will be amortized on a systematic basis over the useful life of the asset recognized.
Determining the lease termIn determining the lease term, management considers all facts and circumstances that create an economic incentive to exercise an extension option, or not exercise a termination option. Extension options (or periods after termination options) are only included in the lease term if the lease is reasonably certain to be extended (or not terminated). The assessment is reviewed if a significant event or a significant change in circumstances occurs which affects this assessment and that is within the control of the Group.

83TAQA Annual Report 2020
Strategic Review Operational Review Financial Review Control Environment Financial StatementsOur Business
Business model assessmentClassification and measurement of financial assets depends on the results of the SPPI and the business model test (please see policy for financial assets sections in Note 2.2). The Group determines the business model at a level that reflects how groups of financial assets are managed together to achieve a particular business objective.
This assessment includes judgment reflecting all relevant evidence including how the performance of the assets is evaluated and their performance measured, the risks that affect the performance of the assets and how these are managed and how the managers of the assets are compensated. The Group monitors financial assets measured at amortized cost that are derecognized prior to their maturity to understand the reason for their disposal and whether the reasons are consistent with the objective of the business for which the asset was held. Monitoring is part of the Group’s continuous assessment of whether the business model for which the remaining financial assets are held continues to be appropriate and if it is not appropriate whether there has been a change in business model and so a prospective change to the classification of those assets. No such changes were required during the periods presented.
Accounting acquirerOne of the most important steps in a business combination is to identify the acquirer in the transaction. From an accounting perspective the legal acquirer may not always be the accounting acquirer. In a business combination effected primarily by exchanging equity interests, the acquirer is usually the entity that issues its equity interests. However, in some business combinations, commonly called ‘reverse acquisitions’, the issuing entity is the acquiree.
As per IFRS 3, several factors determine accounting acquirer – the relative voting rights in the combined entity after the business combination, the existence of a large minority voting interest in the combined entity if no other owner or organized group of owners has a significant voting interest, the composition of the governing body of the combined entity, the composition of the senior management of the combined entity, the terms of the exchange of equity interests and relative size (measured in, for example, assets, revenues or profit) of each combining entity.
In the Transaction between TAQA and ADPC entities, the Group made an assessment of accounting acquirer as per IFRS 3 qualitative and quantitative factors and determined that the acquiring entity for accounting purposes is TransCo given its relative size within the combined Group.
Key sources of estimation uncertainty The key assumptions concerning the future and other key sources of estimation uncertainty at the reporting date, that have a significant risk of causing a material adjustment to the carrying amounts of assets and liabilities within the next financial year are discussed below:
Impairment testing of non-financial assetsManagement determines at each reporting date whether there are any indicators of impairment relating to the Group’s property, plant and equipment and intangible assets including exploration and evaluation assets, power (and water) purchase agreements and distribution licenses. A broad range of internal and external factors are considered as part of the indicator review process.
The Group’s impairment testing for non-financial assets is based on calculating the recoverable amount of each cash generating unit or group of cash generating units being tested. Recoverable amount is the higher of value in use (VIU) and fair value less costs of disposal (FVLCD). VIU for relevant cash generating units is derived from projected cash flows as approved by management and do not include restructuring activities that the group is not yet committed to or significant future investments that will enhance the asset base of the cash generating unit being tested. FVLCD for relevant cash generating units is generally derived from discounted cash flow models using market based inputs and assumptions. Recoverable amount is most sensitive to commodity price assumptions, regulatory framework regimes, foreign exchange rate assumptions, inflation and discount rates used in the cash flow models.
Estimation of oil and gas reservesOil and gas reserves and resources used for accounting purposes are estimated using internationally accepted methods and standards. The Group’s annual oil and gas reserves and resources review process includes an external audit process conducted by appropriately qualified parties. All reserve estimates are subject to revision, either upward or downward, based on new information, such as from development drilling and production activities or from changes in economic factors, including product prices, contract terms or development plans. In general, changes in the technical maturity of hydrocarbon reserves resulting from new information becoming available from development and production activities have tended to be the most significant cause of annual revisions. Changes in oil and gas reserves are an important indication of impairment or reversal of impairment and may result in subsequent impairment charges or reversals as well as affecting the unit-of-production depreciation charge in the profit or loss.
Provision for decommissioningDecommissioning costs will be incurred by the Group at the end of the operating life of certain of the Group’s facilities and properties. The ultimate decommissioning costs or asset retirement obligations are uncertain and cost estimates can vary in response to many factors including changes to relevant legal requirements, the emergence of new restoration techniques or experience at production sites. The expected timing of expenditure can also change, for example in response to changes in laws and regulations or their interpretation, and/or due to changes in commodity prices. The provision is most sensitive to commodity price assumptions, foreign exchange rate assumptions, inflation and discount rates used in the cash flow models.

84 TAQA Annual Report 2020
NOTES TO THE CONSOLIDATED FINANCIAL STATEMENTS (CONTINUED)31 December 2020
2 BASIS OF PREPARATION AND ACCOUNTING POLICIES (CONTINUED)2.3 Significant accounting judgments, estimates and assumptions (continued)Key sources of estimation uncertainty (continued)Allowance for expected credit lossesThe loss allowances for financial assets are based on assumptions about risk of default and expected loss rates. The Group uses judgment in making these assumptions and selecting the inputs to the impairment calculation, based on the Group’s past history, existing market conditions as well as forward looking estimates at the end of each reporting period.
The following information is taken into account when assessing whether credit risk has increased significantly since initial recognition: a) An actual or expected significant deterioration in the financial instrument’s external (if available) or internal credit rating; b) Existing or forecast adverse changes in business, financial or economic conditions that are expected to cause a significant decrease in the
debtor’s ability to meet its debt obligations; c) An actual or expected significant deterioration in the operating results of the debtor; d) Significant increases in credit risk on other financial instruments of the same debtor; e) An actual or expected significant adverse change in the regulatory, economic, or technological environment of the debtor that results in a
significant decrease in the debtor’s ability to meet its debt obligations. Irrespective of the outcome of the above assessment, the Group presumes that the credit risk on a financial asset has increased significantly since initial recognition when contractual payments are more than 90 days past due, unless the Group has reasonable and supportable information that demonstrates otherwise
Allowance for slow moving and obsolete inventoriesManagement assess loss (if any) on items of inventory on account of slow moving and obsolescence on a regular basis. In determining whether provision for obsolescence should be recorded in profit or loss, the Group makes judgments as to whether there is any observable data indicating that there is a future consumption of the item. Based on the factors, management has identified inventory items as slow moving and obsolete to calculate the allowance for slow moving and obsolete inventories.
Fair value of financial instrumentsWhere the fair value of financial assets and financial liabilities recorded in the statement of financial position cannot be derived based on quoted prices from active markets, their fair value is determined using valuation techniques including discounted cash flows models. The inputs to these models are taken from observable markets where possible, but where this is not feasible, a degree of judgment is required in establishing fair values. The judgments include consideration of inputs such as liquidity risk, credit risk and volatility. Changes in assumptions about these factors could affect the reported fair value of financial instruments.
Income taxesThe Group recognizes the net future tax benefit to the extent that it is probable that the deductible temporary differences will reverse in the foreseeable future. Assessing the recoverability of deferred income tax assets requires the Group to make significant assumptions related to expectations of future taxable income. Estimates of future taxable income are based on forecast cash flows from operations and the application of existing tax laws in each jurisdiction. To the extent that future cash flows and taxable income differ significantly from estimates, the ability of the Group to realize the net deferred tax assets recorded at the reporting date could be impacted. Additionally, future changes in tax laws in the jurisdictions in which the Group operates could limit the ability of the Group to obtain tax deductions in future periods.
Useful lives of property, plant and equipmentManagement determines the estimated useful lives of property, plant and equipment. This estimate is determined after considering the expected usage of the asset or physical wear and tear. Management reviews the residual value and useful lives annually and the future depreciation charge is adjusted where management believes that the useful lives differ from previous estimates.
Other operating revenue – Transmission & DistributionOther operating revenue for sales of water and electricity is calculated as the difference between its Maximum Allowed Revenue (MAR) determined in its Regulatory Control 1 (communicated by the DoE) and revenue relating to sales of water and electricity from its customers. Accordingly, the Group recognized this revenue for sales of water and electricity based on those rights and rewards that are confirmed during the period.
Unbilled revenueThe Group estimates the amount of unbilled consumption individually for each customer account based on historical meter readings. Unbilled consumption is calculated based on the average consumption for the period between the date of the last meter reading and the year end.
Fair value of identifiable assets and liabilitiesAs stated in note 1 above, the identifiable assets acquired and the liabilities assumed in business combination are recognized at their fair value. In estimating the fair value of an asset or a liability, the Group engaged third party qualified valuation experts to perform the valuation. The underlying assumptions and estimates in assessing the fair values are detailed within note 12, 14 and 32.3.

85TAQA Annual Report 2020
Strategic Review Operational Review Financial Review Control Environment Financial StatementsOur Business
2.4 New standards, interpretations and amendments adopted by the groupThe following new and revised IFRSs, which became effective for annual periods beginning on or after 1 January 2020, have been adopted in these consolidated financial statements. • Amendments to Interest Rate Benchmark Reform in IFRS 9 and IFRS 7• Amendments to IFRS 16 Leases relating to COVID-19-Related Rent Concessions• Amendments to Reference to the Conceptual Framework in IFRS Standards• Amendments to IFRS 3 Definition of a business• Amendments to IAS 1 and IAS 8 Definition of material
The application of these revised IFRSs has not had any material impact on the amounts reported for the current and prior years but may affect the accounting for future transactions or arrangements.
2.5 New standards, interpretations and amendments but not yet effectiveThe Group has not yet applied the following new and revised IFRSs that have been issued but are not yet effective:• IFRS 17 Insurance Contracts (effective from 1 January 2023)• Amendments to IFRS 10 Consolidated Financial Statements and IAS 28 Investments in Associates and Joint Ventures: Sale or Contribution
of Assets between an Investor and its Associate or Joint Venture (effective date not yet decided)• Amendments to IAS 1 Presentation of Financial Statements: Classification of Liabilities as Current or Non-current (effective from
1 January 2023) • Amendments to IFRS 3 Business Combinations: Reference to the Conceptual Framework (effective from 1 January 2022)• Amendments to IAS 16 Property, Plant and Equipment related to proceeds before intended use (effective from 1 January 2022) • Amendments to IAS 37 Provisions, Contingent Liabilities and Contingent Assets related to Onerous Contracts—Cost of Fulfilling a Contract
(effective from 1 January 2022)• Annual Improvements to IFRS Standards 2018-2020: The Annual Improvements include amendments to IFRS 1 First-time Adoption of
International Financial Reporting Standards (effective from 1 January 2022), IFRS 9 Financial Instruments (effective from 1 January 2022), IFRS 16 Leases (effective date not yet decided) and IAS 41 Agriculture (effective from 1 January 2022)
• Interest Rate Benchmark Reform — Phase 1 (Amendments to IFRS 9 and IFRS 7)• Interest Rate Benchmark Reform — Phase 2 (Amendments to IFRS 9, IAS 39, IFRS 7, IFRS 4 and IFRS 16) (effective from 1 January 2021)
The above stated new standards and amendments are not expected to have any significant impact on consolidated financial statement of the Group.
There are no other applicable new standards and amendments to published standards or IFRIC interpretations that have been issued that would be expected to have a material impact on the consolidated financial statement of the Group.

86 TAQA Annual Report 2020
NOTES TO THE CONSOLIDATED FINANCIAL STATEMENTS (CONTINUED)31 December 2020
3 REVENUE 3.1 Revenue from generation of power and water
31 December2020
AED million2019
AED million
Operating lease revenue 3,562 –Revenue from operating financial assets (note 13) 884 –Sale of power 233 –Energy payments and other related revenue 902 –Reimbursement of coal and other fuel costs* 658 –Others 142 –
6,381 –
* Fuel revenue represents reimbursements from the offtakers of the power and water subsidiaries for fuel consumed in power generation in accordance with the terms of the power and water purchase agreements and the power purchase agreements.
All revenue from generation of power and water is recognized at a point in time, with the exception of revenue from operating financial assets.
3.2 Revenue from transmission and distribution of power and water
31 December2020
AED million2019
AED million
TUOS and connection charges for licensed activities 1,997 4,907TUOS charges for unlicensed activities 1,011 1,150Revenue from supply and distribution of power and water 6,963 –Distribution connection and meter installation fees 453 –Water coupons 49 –Other operating revenue 4,907 –
15,380 6,057
The Group earns revenue from supply and distribution of power and water in the region of Abu Dhabi. Revenue is subject to Maximum Allowed Revenue (“MAR”) calculated in accordance with a formula as defined in the License document issued by DOE. Other operating revenue in respect of sale of power and water for the period are based on the difference between MAR and revenue billed to customers for the supply and distribution of power and water.
All revenue from transmission and distribution of power and water is recognized at a point in time.
3.3 Revenue from oil and gas
31 December2020
AED million2019
AED million
Gross oil and gas revenue 2,004 –Less: royalties (102) –
1,902 –Gas storage revenue 193 –Net processing income 109 –Others 20 –
2,224 –
All revenue from oil and gas recognized at a point in time, with the exception of gas storage revenue.

87TAQA Annual Report 2020
Strategic Review Operational Review Financial Review Control Environment Financial StatementsOur Business
4 OPERATING EXPENSES
31 December2020
AED million2019
AED million
Salaries and related expenses 1,025 341Repairs, maintenance and consumables used 1,561 349Bulk supply tariff 7,106 –Fuel expenses 805 –Charges by operating and maintenance contractors 716 –Oil and gas operating costs 1,171 –Transportation costs 155 –Exploration and evaluation assets written off (note 14) 21 –Others 106 3
12,666 693
5 DEPRECIATION, DEPLETION AND AMORTIZATION
31 December2020
AED million2019
AED million
Depreciation of property, plant and equipment and depletion of oil and gas assets (note 12) 4,917 1,811Amortization of intangible assets (note 14) 700 –
5,617 1,811
6 GENERAL AND ADMINISTRATIVE EXPENSES
31 December2020
AED million2019
AED million
Salaries and related expenses 845 171Professional fees and business development expenses 266 53IT and communications 117 19Corporate social contributions 1 –Others 272 212
1,501 455
Cost recoveries from JV partners (207) –
1,294 455
7 FINANCE COSTS
31 December2020
AED million2019
AED million
Finance costs relating to bonds and global medium term notes 540 –Finance costs relating to interest bearing loans and borrowings and Islamic loans 446 –Interest expense on interest rate swaps 359 –Asset retirement obligations accretion expense (note 26) 228 –Lease liability interest 8 1
1,581 1

88 TAQA Annual Report 2020
NOTES TO THE CONSOLIDATED FINANCIAL STATEMENTS (CONTINUED)31 December 2020
8 OTHER INCOME
31 December2020
AED million2019
AED million
Deferred income – grant released (note 27) 29 72Other 174 13
203 85
9 INCOME TAXThe major components of income tax credit for the years ended 31 December 2020 and 2019 are:
31 December2020
AED million2019
AED million
Consolidated profit or lossCurrent income tax:Current income tax charge 86 –Adjustment in respect to income tax of previous years (26) –Deferred income tax:Relating to origination and reversal of temporary differences (332) –Adjustment in respect to deferred tax of previous years 14 –
Income tax credit reported in the consolidated profit or loss (258) –
The reconciliation between tax credit and the product of accounting profit multiplied by the applicable statutory tax rate for the years ended 31 December 2020 and 2019 is as follows:
31 December2020
AED million2019
AED million
Profit before tax 3,759 3,182Non-taxable profit (including income in non-taxable jurisdictions) (2,460) (3,182)
Total taxable profit 1,299 –
Applicable tax charge at statutory rates – weighted average of 26% (2019: NA) (340) –Adjustment in respect to income tax of previous years 26 –Adjustment in respect to deferred income tax of previous years (14) –Deferred tax recognition due to changes in estimates 533 –Withholding taxes (13) –Tax incentives 10 –Special production taxes on upstream activities 47 –Other 9 –
Income tax credit reported in the profit or loss 258 –
Adjustments relating to prior years are a result of reassessments of prior year taxes in entities within taxable jurisdictions that were acquired as at 1 July 2020. The prior year comparatives are that of TransCo on a standalone basis and as a UAE domiciled entity is not subject to tax.

89TAQA Annual Report 2020
Strategic Review Operational Review Financial Review Control Environment Financial StatementsOur Business
Deferred taxDeferred income tax at 31 December relates to the following:
Consolidated statement of financial position
Consolidated profit or loss
2020 AED million
2019 AED million
2020 AED million
2019 AED million
Deferred tax assets:Temporary difference on property, plant and equipment 460 – (922) –Temporary difference arising on asset retirement obligations 3,339 – 1,302 –Tax losses 284 – 43 –Others 1,539 – (755) –
5,622 – (332) –
Deferred tax liabilities:Temporary difference on property, plant and equipment 1,299 – (4) –Others 13 – 18 –
1,312 – 14 –
Based on the latest available forecast of future profits, the Group has determined AED 1,850 million of tax losses (2019: not applicable) are unlikely to be utilized in the foreseeable future. Hence, no deferred tax benefit has been recognized, though these losses remain available for offset against future taxable profits.
10 BASIC AND DILUTED EARNINGS PER SHARE ATTRIBUTABLE TO EQUITY HOLDERS OF THE PARENTBasic earnings per share amounts are calculated by dividing earnings for the year attributable to ordinary equity holders of the parent by the weighted average number of ordinary shares outstanding during the year.
Diluted earnings per share amounts are calculated by dividing the earnings attributable to ordinary shareholders of the parent by the weighted average number of ordinary shares outstanding during the year, adjusted for the effects of dilutive instruments.
The following reflects the profit and share data used in the earnings per share computations:
31 December2020 2019
Profit for the year attributable to equity holders of the parent (AED million) 3,808 3,182
Weighted average number of ordinary shares issued (million) 97,955 83,475
Basic earnings per share (AED) 0.04 0.04
In accordance with the requirements of IFRS 3, the basic earnings per share in these consolidated financial statements, following the reverse acquisition (note 1), for the comparative period have been restated. The basic earnings per share for the comparative period have been calculated by dividing TransCo’s profit attributable to ordinary shareholders in comparative periods by TransCo’s historical weighted average number of ordinary shares that were outstanding, multiplied by the exchange ratio for TransCo established by the business combination agreement.
No figure for diluted earnings per share has been presented as the Group has not issued any instruments which would have an impact on earnings per share when exercised.

90 TAQA Annual Report 2020
NOTES TO THE CONSOLIDATED FINANCIAL STATEMENTS (CONTINUED)31 December 2020
11 OPERATING SEGMENT INFORMATIONOperating segments are components that engage in business activities that may earn revenues or incur expenses, whose operating results are regularly reviewed by the chief operating decision maker (CODM), and for which discrete financial information is available. The chief operating decision-maker, who is responsible for allocating resources and assessing performance of the operating segments, has been identified as the Chief Executive Officer (CEO) of TAQA.
For this purpose, the Group is organized into business units based on their geography, products and services, and has three reportable operating segments as follows:• Power and Water Generation Segment• Power and Water Transmission & Distribution Segment• Oil and Gas Segment
Power and Water Generation SegmentThis segment is engaged in generation of electricity and production of desalinated water for supply in UAE and generation of electricity in Morocco, India, Ghana, Saudi Arabia and the United States.
Power and Water Transmission & Distribution Segment This segment is engaged in transmission and distribution of water and electricity from the generation and desalination plants in the UAE.
Oil and Gas Segment This segment is engaged in Upstream and Midstream oil and gas activities in Canada and Netherlands and Upstream oil and gas activities in United Kingdom and Kurdistan, Iraq.
Several operating segments have been aggregated to form the above reportable operating segments which are provided below:
Power and Water Generation – UAE Generation
Power and Water Generation – Others
Transmission & DistributionPower and Water Transmission & Distribution – UAE
Oil and Gas – North America
Oil & GasOil and Gas – Europe
Oil and Gas – Iraq
Management monitors the operating results of its business units separately for the purpose of making decisions about resource allocation and performance assessment. Segment performance is evaluated based on ‘profit or loss for the period’ as detailed in the following table. Group financing cost and income except for the subsidiaries with project financing arrangements and interest income is managed on a group basis and is not allocated to operating segments.
The majority of the Group’s revenues, profits, and assets relate to its operations in the United Arab Emirates.
Investment in certain associates with activities other than power and water generation and oil and gas and available for sale investments are managed on a group basis and are therefore not allocated to operating segments.
Interest bearing loans and borrowings and Islamic loans except for the subsidiaries with project financing arrangements are managed on a group basis and are not allocated to operating segments.
Prior year comparative operating segment information has not been provided. As a result of the transaction, prior year comparatives relate to TransCo only and therefore will be solely within the Transmission and Distribution operating segment.

91TAQA Annual Report 2020
Strategic Review Operational Review Financial Review Control Environment Financial StatementsOur Business
The following table presents revenue and profit information for the Group’s operating segments:
GenerationAED million
Transmission & DistributionAED million
Oil & GasAED million
Adjustments, eliminations &
unallocatedAED million
ConsolidatedAED million
Year ended 31 December 2020:Revenue from external customers 6,381 15,380 2,224 – 23,985Operating expenses (2,122) (8,610) (1,894) (40) (12,666)Depreciation, depletion and amortization (2,333) (2,967) (340) 23 (5,617)
Gross profit 1,926 3,803 (10) (17) 5,702
General and administrative expenses (246) (713) (107) (228) (1,294)Finance costs (983) – (204) (394) (1,581)Net foreign exchange gains (losses) 178 – (38) (67) 73Share of results of associates and joint ventures 4 – – 51 55Bargain purchase gain – – – 570 570Other income 55 122 8 18 203Interest income – – – 31 31Income tax (expense) credit (189) – 455 (8) 258
Profit (loss) for the year 745 3,212 104 (44) 4,017
The following table presents segment assets and liabilities of the Group’s operating segments as at 31 December 2020:
GenerationAED million
Transmission & DistributionAED million
Oil & GasAED million
Adjustments, eliminations &
unallocatedAED million
ConsolidatedAED million
At 31 December 2020Property, plant and equipment 36,633 83,944 5,507 (135) 125,949Operating financial assets 10,937 – – – 10,937Investments in and loans to associates and joint ventures 792 – – 1,637 2,429Intangible assets 14,470 4,755 7 – 19,232Other assets 9,223 11,224 6,809 1,124 28,380
Segment assets 72,055 99,923 12,323 2,626 186,927
Segment liabilities 48,482 14,754 15,660 38,776 117,672
Other disclosures at 31 December 2020Additions – property, plant and equipment 104 1,908 142 – 2,154Additions – intangible assets – – 11 – 11

92 TAQA Annual Report 2020
NOTES TO THE CONSOLIDATED FINANCIAL STATEMENTS (CONTINUED)31 December 2020
11 OPERATING SEGMENT INFORMATION (CONTINUED)Geographical informationThe following tables present revenue, certain asset information relating to the Group based on geographical location of the subsidiaries at 31 December 2020:
UAEAED million
NorthAmerica
AED millionEurope
AED millionAfrica
AED millionOthers
AED millionTotal
AED million
Revenue 19,946 1,017 1,246 1,496 280 23,985Non-current assets 140,236 3,500 1,539 9,503 884 155,662
Non-current assets for this purpose consist of property, plant and equipment, operating financial assets, intangible assets and other assets.
Other informationThe Group has one major customer that contributed more than 10% towards the Group’s revenue during the year ended 31 December 2020, as presented in the following table:
GenerationAED million
Transmission & DistributionAED million
Oil & GasAED million
Adjustments, eliminations &
unallocatedAED million
ConsolidatedAED million
Customer 1 4,553 1,011 – – 5,564
4,553 1,011 – – 5,564
12 PROPERTY, PLANT AND EQUIPMENT
Buildings,equipment and
plantand machinery
AED million
Oil and gas assets
AED million
Capitalspares
AED million
Capital workin progressAED million
Right of use assets
AED millionTotal
AED million
2020Cost:
At 1 January 2020 61,251 – 258 4,817 42 66,368Acquisition of subsidiaries (note 1) 114,898 18,378 – 7,758 119 141,153Additions 2,005 142 – – 358 2,505Revision of ARO – 145 – – – 145Disposals of assets – 12 – – – 12Exchange adjustment 333 – – – – 333
At 31 December 2020 178,487 18,677 258 12,575 519 210,516
Depreciation and depletion:At 1 January 2020 23,390 – 98 – 7 23,495Acquisition of subsidiaries (note 1) 41,070 14,402 9 – 32 55,513 Charge for the year (note 5) 4,567 206 – – 144 4,917Exchange adjustment 642 – – – – 642
At 31 December 2020 69,669 14,608 107 – 183 84,567
Net carrying amount:At 31 December 2020 108,818 4,069 151 12,575 336 125,949

93TAQA Annual Report 2020
Strategic Review Operational Review Financial Review Control Environment Financial StatementsOur Business
Buildings,equipments and
plantand machinery
AED million
Oil and gas assets
AED million
Capitalspares
AED million
Capital workin progressAED million
Right of use assets
AED millionTotal
AED million
2019Cost:
At 1 January 2019 60,569 – 322 4,650 – 65,541Recognized on initial application of IFRS 16 – – – – 25 25Additions 7 – 8 973 17 1,005Transfers 806 – – (806) – –Adjustments to projects capitalized in prior
years (109) – – – – (109)Write off (22) – (72) – – (94)
At 31 December 2019 61,251 – 258 4,817 42 66,368
Depreciation and depletion:At 1 January 2019 21,616 – 117 – – 21,733Charge for the year 1,796 – 8 – 7 1,811Write off (22) – (27) – – (49)
At 31 December 2019 23,390 – 98 – 7 23,495
Net carrying amount:At 31 December 2019 37,861 – 160 4,817 35 42,873
Property, plant and equipment with a carrying amount of AED 36,374 million (2019: AED nil) are pledged as security for the related loans.
Oil and gas assets – impairment approach and key assumptionsThe calculation of recoverable amount for oil and gas assets is based upon the following key assumptions: • Reserve and resource volumes;• Inflation rates; • Cash flows relating to gas storage;• Discount rates;• Foreign exchange rates; and• Commodity prices
It is management’s view that the impairment calculations are not materially sensitive to reasonable possible changes in the assumptions. In the impairment calculations, assumptions are also made regarding the cash flows from each asset’s ultimate disposal.
Reserve and resource volumesReserve and resource volumes form the basis of the production profiles within the discounted cash flow models. The Group’s annual oil and gas reserves (proved, probable and possible) and resources review process includes an external audit process conducted by appropriately qualified parties. Where significant, the contingent resources within a segment are also reviewed and reported on. The data generated for each field and location takes into consideration the development plans approved by senior management and reasonable assumptions that an external party would apply in appraising the assets.
Inflation ratesEstimates are obtained from published indices for the countries from which products and services are originated, as well as data relating to specific commodities. Forecast figures are used if data is publicly available. The Company assumed inflation rates ranging from 2% to 5% in perpetuity (2019: not applicable).
Cash flows relating to gas storageCash flows relating to gas storage are based on assumptions on delivery capacity, injection capacity, working volumes and expected availability. The assumptions are supported by non-binding expressions of interests on demand for working volumes.
Discount ratesDiscount rates used reflect the estimated weighted average cost of capital rates for potential acquirer group companies developed for each of the locations. The assets are valued on a FVLCD methodology and therefore post-tax discount rates ranging from 4.3% to 17.0% (2019: not applicable), were used to calculate the recoverable amounts at the reporting date.

94 TAQA Annual Report 2020
NOTES TO THE CONSOLIDATED FINANCIAL STATEMENTS (CONTINUED)31 December 2020
12 PROPERTY, PLANT AND EQUIPMENT (CONTINUED)Oil and gas assets – impairment approach and key assumptions (continued)Foreign exchange rates and commodity pricesA summary of the 2020 key assumptions are provided below:
2021 2022 2023 2024 2025
Commodity pricesWTI (USD/bbl)1 42 48 53 58 63AECO (USD/mmbtu)1 1.65 1.75 1.90 2.15 2.15Brent (USD/bbl)1 45 50 55 60 65Summer/Winter gas spread (Euro/MWh)2 2.90 2.00 2.00 2.00 2.00
Foreign exchange ratesUSD/CAD$ 0.74 0.74 0.74 0.74 0.74USD/Euro 1.14 1.14 1.14 1.14 1.14USD/GBP 1.24 1.33 1.43 1.43 1.43
1 Prices are escalated at 2% thereafter.2 Prices are held flat thereafter.
Power and water assets – impairment approach and key assumptions The recoverable amount for power and water assets is based on FVLCD. In determining FVLCD, a discounted cash flow valuation model was used, incorporating market based assumptions. The key assumptions for FVLCD calculations are outlined below together with the approach management has taken in determining the value to ascribe to each. Management believes it is appropriate to use cash flow forecasts over such periods due to the long term power and water purchase agreements associated with the facilities.
The calculation of FVLCD for power and water generation assets is most sensitive to the following assumptions: • Future cash flows beyond the term of the current PWPAs;• Inflation rates; and• Discount rates
Future cash flows beyond the terms of the current PWPAsThe Group’s expected future cash flows have been estimated based on work performed by an internal expert. In doing so, management has considered key trends in the relevant power and water sectors, likely extension scenarios including extension tariff projections and the recovery of the residual values.
Inflation ratesEstimates are obtained from published indices for the countries from which products and services are originated. Forecast figures are used if data is publicly available. The Company assumed inflation rates ranging from 1% to 5% in perpetuity (2019: not applicable).
Discount ratesDiscount rates used represent the current market assessment of the risks specific to the assets, taking into consideration the time value of money and individual risks of the underlying assets that have not been incorporated in the cash flow estimates. The assets are valued using a FVLCD methodology, future cash flows are discounted using post-tax rates ranging from 3.9% to 8.3% (2019: not applicable).

95TAQA Annual Report 2020
Strategic Review Operational Review Financial Review Control Environment Financial StatementsOur Business
13 OPERATING FINANCIAL ASSETSThe movement in operating financial assets is as follows:
31 December2020
AED million2019
AED million
At 1 January – –Acquisition of subsidiaries (note 1) 10,682 –Recognized during the year (note 3.1) 884 –Consideration received during the year (978) –Exchange gains recognized in the consolidated income statement 349 –
10,937 –
Analyzed in the consolidated statement of financial position as follows:31 December2020
AED million2019
AED million
Non-current portion 9,740 –Current portion 1,197 –
10,937 –
TAQA manages three concession contracts as defined by IFRIC 12, mainly covering electricity generation. The foreign subsidiaries, namely TAQA Morocco (formerly Jorf Lasfar Energy Company SCA (JLEC)), TAQA Neyveli Power Company Pvt Ltd (Neyveli) and Takoradi International Company (Takoradi), have entered into power purchase agreements (PPA) with offtakers in the countries where they are operating. Under the PPA the foreign subsidiaries undertake to make available, and the offtakers undertake to purchase, the available net capacity of the plant for a period of time in accordance with various agreed terms and conditions as specified in the PPA as follows:
TAQA Morocco:The subsidiary had the right of possession for the site and the plant units (units 1 to 4) for a period of 30 years ending in September 2027. On 24 January, 2020 TAQA Morocco with Office National de l’Electricité (“ONE”) signed an extension to the PPA for a further 17 years from 2027 to 2044. At the end of the PPA, the ownership of the site and the plants will be transferred to the offtaker.
During 2009, ONE and TAQA Morocco signed a strategic partnership agreement to extend the capacity of the plant by constructing two new units (units 5&6) with an approximate gross capacity of 350 MW each. In June 2014, the two new units were completed and a 30 year PPA ending 2044 was entered into. Neyveli:The subsidiary has a 30 year PPA with the offtaker ending in December 2032. On the expiry date of the PPA, the offtaker has the option to acquire the plant at a price equal to 50% of the terminal value as defined in the PPA.
Takoradi:The subsidiary had originally signed a 25 year PPA with the offtaker ending in March 2024. On expiry date of the PPA, the plant is to be transferred to the offtaker at a nominal amount. The expansion project has increased the existing 220 MW capacity to 330 MW. As a result of the expansion, the PPA term has been extended to 2039.
Operating financial assets with a carrying amount of AED 10,665 million (2019: not applicable) are pledged as security for the related borrowings in the subsidiaries.
An expected credit loss (ECL) provision of AED 211 million (2019: not applicable) is recognized against the operating financial assets.

96 TAQA Annual Report 2020
NOTES TO THE CONSOLIDATED FINANCIAL STATEMENTS (CONTINUED)31 December 2020
14 INTANGIBLE ASSETS
Explorationand evaluation
assetsAED million
Distribution licences
AED million
Power (and water)
purchaseagreementsAED million
Connection rights
AED million
Tollingagreement
and otherAED million
TotalAED million
2020Cost:
At 1 January 2020 – – – – – –Acquisition of subsidiaries (note 1) 24 4,755 14,849 1,767 1,099 22,494Additions – – – – 11 11Inter-company eliminations – – – (1,638) – (1,638)Other – – – – 82 82Derecognised during the year (note 4) (21) – – – – (21)Exchange adjustment 1 – – – – 1
At 31 December 2020 4 4,755 14,849 129 1,192 20,929
Amortization:At 1 January 2020 – – – – – –Acquisition of subsidiaries (note 1) – – – 552 948 1,500Amortization for the year (note 5) – – 511 154 35 700Intercompany eliminations – – – (603) – (603)Exchange adjustment – – – – – –
At 31 December 2020 – – 511 103 983 1,597
Fair value adjustment on effective fair value hedges (note 32.2 (iv)) – – – – – –
Acquisition of subsidiaries (note 1) – – – – (129) (129)Exchange adjustment – – – – 29 29
Net carrying amount:At 31 December 2020 4 4,755 14,338 26 109 19,232
Distribution licenses The Distribution companies (DisCos) in the UAE have licence agreements with the DoE. These licenses commenced in 1999 and gave the DisCos the exclusive right to distribute power and water throughout the Emirate of Abu Dhabi. These licenses can only be revoked after a 25 year notice period. As a result, the licenses are considered as an indefinite lived intangible asset and is subject to an annual impairment test.
Power (and water) purchase agreements (P(W)PAs)All the I(W)PP assets in the UAE has separate P(W)PAs in place with EWEC with an average term of 25 years. Under the respective P(W)PA, each asset is entitled to sell electricity and water (as applicable) generated by the facility to EWEC at the agreed contractual prices and ADWEA is obliged to make capacity payments for both electricity and water as defined in the respective contracts. The key assumptions for the power and water asset VIU calculations are outlined in note 12 together with the approach management has taken in determining the value to ascribe to each.
Connection rightsThe intangible assets arose from the transfer, made by a number of the Group’s subsidiaries, of certain assets to a related party in accordance with the terms of individual agreements and represent the acquisition cost of the right of connection to the transmission systems at the connection sites for a period of 1 to 8 years. The connection rights cost are being amortized on a straight line basis over the same period, being the expected period of benefit.
Tolling agreementThe Group has a fuel conversion services, capacity and ancillary services purchase agreement (“Tolling Agreement”) relating to the acquisition of BE Red Oak Holding LLC. Under the terms of the Tolling Agreement, the Group is entitled to the economic rights (revenue from sale of electricity, capacity payments and any other ancillary services) of a power plant located in New Jersey, USA and the Group is obligated to supply the fuel and also make certain fixed and variable payments to the operator. The tolling agreement cost is being amortized on a straight line basis over the term of the agreement.
The fair value of the contract is based on estimated forward commodity prices, estimated correlation of commodity prices, volatility factors, and other typical option valuation parameters over the term of the tolling contract.

97TAQA Annual Report 2020
Strategic Review Operational Review Financial Review Control Environment Financial StatementsOur Business
15 INVESTMENT IN AND LOANS TO ASSOCIATES AND JOINT VENTURESThe Group has the following investments:
Country of incorporationand operation
Ownership
2020 2019
AssociatesMassar Solutions PJSC (note i) UAE 49.0% –Jubail Energy Company (note ii) Saudi Arabia 25.0% –Sohar Aluminium Company LLC (note iii) Oman 40.0% –
Joint VentureLWP Lessee LLC (note iv) USA 50.0% –Taweelah RO Holding Company LLC (note v) UAE 33.0% –Fujairah Energy Holding Company LLC (note vi) UAE 67.0% –Dhafrah Solar Energy Holding Company LLC (note vii) UAE 67.0% –
(i) Massar Solution PJSC (formerly Al Wathba Company for Central Services PJSC) is mainly involved in the leasing and management of vehicles and equipment. (ii) Jubail Energy Company (“Jubail”) is involved in the generation of electricity.(iii) Sohar Aluminium Company LLC (“Sohar”) is involved in the construction, ownership and operation of an aluminium smelter and an associated combined cycle power plant.(iv) LWP Lessee LLC (“Lakefield”) is involved in wind power.(v) Taweelah RO Holding Company LLC is involved in the production of desalinated water.(vi) Fujairah Energy Holding Company LLC is involved in the generation of electricity. Despite 67% ownership, TAQA recognizes it’s investment in this entity as a joint venture.
Through the entity’s Articles of Association and Board structure, all shareholders have equal and joint ability to direct the relevant activities of this entity.(vii) Dhafrah Solar Energy Holding Company LLC is involved in solar power generation. Despite 67% ownership, TAQA recognizes it’s investment in this entity as a joint venture.
Through the entity’s Articles of Association and Board structure, all shareholders have equal and joint ability to direct the relevant activities of this entity.
Summary information for associates and joint venturesThis summarized financial information is shown on a 100% basis.
MassarSolutions(i)AED million
JubailEnergy(ii)
AED million
SoharAluminium(iii)
AED million
LWPLessee(iv)
AED million
TaweelahRO(v)
AED million
FujairahEnergy(vi)
AED million
DhafrahSolar(vii)
AED million
Year ended 31 December 2020:Revenue 329 41 2,356 160 – – –Profit for the year 30 27 216 31 – – –
As at 31 December 2020:Non-current assets 598 247 4,506 9 1,637 914 –Current assets 350 88 1,126 101 65 91 196Non-current liabilities (87) (188) (737) (57) (1,602) (537) (196)Current liabilities (132) (11) (2,271) (6) (10) (64) –
Net assets of Associate/JV 729 136 2,624 47 90 404 –
TAQA share of net assets 357 34 1,050 23 29 270 –Equity accounting adjustments 57 15 (277) 128 – – –Classified as loans/advances – – – – (29) (270) –
TAQA carrying amount of investment 414 49 773 151 – – –
The Group’s associates and joint venture are accounted for using the equity method and the reporting dates of the associates are identical to TAQA. The following table analyses the carrying amount and share of profit and other comprehensive income of TAQA’s associates and joint venture.
31 December2020
AED million2019
AED million
Carrying amount of investments 1,387 –
Group’s share of the associates’ and joint venture:Profit for the year 55 –Other comprehensive income – –
Total comprehensive income 55 –
In order for the associates and joint ventures to reduce its exposure to interest rates fluctuations on loans from banks, the a number of the entities have entered into an interest rate arrangements with counter-party banks for a notional amount that mirrors the draw down and repayment schedule of the loans.

98 TAQA Annual Report 2020
NOTES TO THE CONSOLIDATED FINANCIAL STATEMENTS (CONTINUED)31 December 2020
15 INVESTMENT IN AND LOANS TO ASSOCIATES AND JOINT VENTURES (CONTINUED)The Group has the following loans to associates and joint ventures:
31 December2020
AED million2019
AED million
Mezzanine loan – non-current 395 –Advance – non-current 647 –
1,042 –
The balances above mainly arise from the loans and advances made to Sohar Aluminium Company LLC, Taweelah RO Holding Company LLC and Fujairah Energy Holding Company LLC.
An ECL provision of AED 4 million (2019: not applicable) is recognized against the loans to Sohar Aluminium Company LLC.
16 OTHER ASSETS
31 December2020
AED million2019
AED million
Deposit receivable 75 –Advances to contractors 521 114Cash flow hedges (note 32.1) 44 –Others 101 –
741 114
17 INVENTORIES
31 December2020
AED million2019
AED million
Fuel and crude oil 1,611 –Spare parts and consumables 2,960 156
4,571 156
Provision for slow moving and obsolete items (972) (62)
3,599 94
The cost of inventories recognized as an expense in the consolidated income statement is AED 911 million (2019: not applicable).
Inventories with a carrying amount of AED 3,154 million (2019: not applicable) are pledged as security for loans of the UAE domestic subsidiaries and certain foreign subsidiaries in the power business. Movements in the provision for slow moving and obsolete items are as follows:
31 December2020
AED million2019
AED million
At 1 January 62 39Acquisition of subsidiaries (note 1) 807 –Provision for the year 103 23
At 31 December 972 62

99TAQA Annual Report 2020
Strategic Review Operational Review Financial Review Control Environment Financial StatementsOur Business
18 ACCOUNTS RECEIVABLE, PREPAYMENTS AND OTHER RECEIVABLES
31 December2020
AED million2019
AED million
Net trade receivables (note (i)) 4,692 –Accrued revenue 707 –Crude stock underlift 86 –Deposits 414 –Advances to suppliers 97 –Prepaid expenses 442 29Income tax prepaid 538 –Cash flow hedges (note 32.1) 26 –Fair value hedges (note 32.1) 23 –Other receivables 265 32
7,290 61
(i) Trade receivablesAs at 31 December 2020, trade receivables at nominal value of AED 1,005 million (2019: AED nil) were impaired and fully provided for. Trade receivables are non-interest bearing and are recoverable within 30 – 90 working days. Movements in the provision for impairment of receivables are as follows:
31 December2020
AED million2019
AED million
At 1 January – –Acquisition of subsidiaries (note 1) 1,029Provision/ECL for the year (24) –
At 31 December 1,005 –
As at 31 December, the aging analysis of trade receivables is as follows:
Past due
TotalAED million
Not past due
AED million
30-60days
AED million
60-90days
AED million
90-120days
AED million
>120days
AED million
Net trade receivables 4,692 2,363 82 43 7 2,197Expected credit loss provision 1,005 2 20 26 37 920
Subsequent to the balance sheet date, the Group collected AED 1 million (2019: AED 1 million) of balances past due for more than 120 days. Trade receivables net of provisions are expected, on the basis of past experience, to be fully recoverable.
19 CASH AND CASH EQUIVALENTSCash and cash equivalents included in the consolidated statement of cash flows comprise the following amounts:
31 December2020
AED million2019
AED million
Cash at banks and on hand 7,208 220Short term deposits 1,179 –
Total cash and short term deposits 8,387 220Bank overdrafts (66) –
Net cash and cash equivalents 8,321 220
Restricted cash 132 –
Short term deposits are made for varying periods of between one day and three months, depending on the immediate cash requirements of the Group, and earn interest at the respective short-term deposit rates. Bank overdrafts carry interest at floating rates and are secured by guarantees from certain shareholders of the subsidiaries.
At 31 December 2020, the Group had available AED 8,154 million (2019: AED nil) of undrawn committed borrowing facilities in respect of which all conditions precedent have been met.

100 TAQA Annual Report 2020
NOTES TO THE CONSOLIDATED FINANCIAL STATEMENTS (CONTINUED)31 December 2020
20 SHARE CAPITAL The Transaction between TAQA and ADPC (note 1) was effected by the issuance of 106,367,950,000 ordinary shares of AED 1 by TAQA to the existing shareholders of ADPC. The newly issued shares added to the existing share capital of TAQA (i.e. 6,066,300,000 shares) constitutes the share capital of the legal entity/acquirer after the merger, i.e. the Combined Entity. The table below represents the effect of the transaction on the share capital of the Group as of the date of the transaction:
Shares %
Number of shares issued by TAQA to ADPC 106,367,950,000 95Initial share capital of TAQA 6,066,300,000 5
Total shares of TAQA post combination 112,434,250,000 100
31 December2020
AED million2019
AED million
Share capital 112,434 5,992
21 OTHER EQUITY
31 December2020
AED million2019
AED million
Statutory reserve (i)* 381 2,996Legal reserve (ii)* – 2,996Merger reserve (iii) (56,443) –Interest free loan from shareholders (iv)* – 22,896Proposed increase in share capital (v)* – 2,113Proposed dividends (vi)* – 2,805
* In June 2020, prior to the completion of the transaction, a capital optimization program was completed at TransCo which saw a reduction in share capital, statutory and legal reserves in addition to the settlement of intercompany balances and loans between ADPC entities.
(i) Statutory reserveAs required by the UAE Federal Law No. 2 of 2015 and Article 34 of the Articles of Association of TAQA, 10% of the profit for the year is transferred to a statutory reserve. The Company may resolve to discontinue such transfers when the reserve equals 50% of the share capital. The reserve is not available for distribution. Prior to the completion of the transaction, a capital optimization program was completed which saw the settlement of the statutory reserve.
(ii) Legal reserveIn accordance with Article 34 of the Articles of Association of TransCo, 10% of the profit for the year is transferred to a legal reserve. The Company may resolve to discontinue such annual transfers when the reserve totals 50% of the share capital or in accordance with a resolution taken to this effect by the shareholder at the Annual General Meeting upon the recommendation of the Board of Directors. This reserve may only be used for the purposes recommended by the Board of Directors and approved by the shareholder. Prior to the completion of the transaction, a capital optimization program was completed which saw the settlement of the legal reserve.
There is no requirement under the Articles of Association of TAQA to transfer any amount of annual profits to the legal reserve.
(iii) Merger reserveIn accordance with IFRS 3 and per the principles of reverse acquisition, the equity structure appearing in these consolidated financial statements reflects the capital structure (number of shares) of the legal acquirer (TAQA), including the shares issued by TAQA to ADPC to effect the business combination (note 1). This results in the creation of a ‘Merger reserve’ as at 1 July 2020, being the difference between the capital structure of the legal acquirer (TAQA) and the capital structure of the accounting acquirer (TransCo). The Merger reserve has been computed as follows:
AED million
Capital structure of the accounting acquirerTransCo outstanding shares pre-transaction –Consideration transferred for the reverse acquisition 38,654
38,654Less: Capital structure of the legal acquirer (112,434)Less: Non-cash distribution of land (18,682)Less: Bargain purchase gain on acquisition (570)Plus: Interest free loan from shareholder 36,589
(56,443)

101TAQA Annual Report 2020
Strategic Review Operational Review Financial Review Control Environment Financial StatementsOur Business
The purchase consideration computed from the perspective of the accounting acquirer (TransCo) considered the plots of land under the Framework Agreement (note 1) to be acquired by the Group and distributed to the shareholders of the Group as a non-cash distribution in accordance with the requirements of IFRS 3.
(iv) Interest free loan from shareholderAs per the arrangement between Transco and ADPower, there were no contractual obligations to repay shareholder loans provided in prior years as funding for power and water transmission capital projects. Prior to the completion of the transaction, a capital optimization program was completed which saw the settlement of the interest-free loan with ADPower.
(v) Proposed increase in share capitalFollowing a resolution passed by the Executive Council of the Emirate of Abu Dhabi, the Finance Department of the Government of Abu Dhabi committed to fund historic water and electricity projects approved by the Water and Electricity Department (WED) prior to 1 January 1999. This additional funding was provided against a proposed increase in share capital. The legal formalities in connection with the increase in the share capital were not yet completed at the end of the reporting period.
(vi) Proposed dividends2019TransCo proposed an amount of AED 2,805 million, AED 4.68 per share as proposed dividend for the year ended 31 December 2019. As part of capital optimization the dividend was transferred to interest free loans from the shareholder.
2020During the current year, TAQA proposed and paid an interim dividend of AED 1,687 million, being AED 0.015 per share for the year ended 31 December 2020. The interim dividend was approved by the board on 13 December 2020. 22 NON-CONTROLLING INTERESTSAs part of the business combination TAQA legally acquired the following subsidies that have material non-controlling interests:
Country of incorporation and operation
Proportion of equityinterests held by
non-controlling interests
Sweihan PV Power Company PJSC UAE 40.0%Shuweihat Asia Power Company UAE 40.0%Mirfa International Power and Water Company PJSC UAE 40.0%Gulf Total Tractebel Power Company PJSC UAE 40.0%Arabian Power Company PJSC UAE 40.0%Shuweihat CMS International Power Company PJSC UAE 40.0%Taweelah Asia Power Company PJSC UAE 40.0%Emirates SembCorp Water and Power Company PJSC UAE 40.0%Fujairah Asia Power Company PJSC UAE 40.0%Ruwais Power Company PJSC UAE 40.0%Emirates CMS Power Company PJSC UAE 40.0%
All of the Group’s subsidiaries that have material non-controlling interest are similar in nature. These all relate to the Group’s UAE power and water subsidiaries, in which the Group have an effective 60% share. 40% is owned by various international utility companies. Therefore, the following disclosures have been provided on an aggregated basis.

102 TAQA Annual Report 2020
NOTES TO THE CONSOLIDATED FINANCIAL STATEMENTS (CONTINUED)31 December 2020
22 NON-CONTROLLING INTERESTS (CONTINUED)
31 December 2020 AED million
Revenue 4,553Profit 383Other comprehensive income 903
Total comprehensive income 1,286
Profit allocated to non-controlling interests 153Other comprehensive income allocated to non-controlling interests 361
Cash flows from operating activities 3,371Cash flows used in investing activities (103)Cash flows used in financing activities (3,011)
Net increase in cash and cash equivalents 257
Dividends paid to non-controlling interests (268)
At 31 December 2020
Non-current assets 52,245Current assets 5,982Non-current liabilities 36,250Current liabilities 5,450
Total equity 16,527
Equity attributable to parent 10,294Equity attributable to non-controlling interests 6,233
23 LOANS FROM NON-CONTROLLING INTEREST SHAREHOLDERS IN SUBSIDIARIES
31 December2020
AED million2019
AED million
S2 Offshore Holding Company 72 –Fujairah F2 CV 4 –Shuweihat Asia Power Investment B.V. 58 –M Power Holding Company 180 –Sweihan Solar Holding Company 152 –
466 –
The above loans are interest free, with no repayment terms and are unsecured and are subject to terms of repayment as resolved by the Board of Directors of the subsidiaries. Accordingly they have been treated as equity within NCI.
24 INTEREST BEARING LOANS AND BORROWINGS
31 December2020
AED million2019
AED million
Abu Dhabi National Energy Company Global Medium Term notes (note i) 27,859 –Revolving credit facilities (note ii) 5,133 –Abu Dhabi National Energy Company bonds (note iii) 4,429 –Other subsidiaries’ bonds (note iv) 6,458 –Term loans (note v) 31,175 –
75,054 –

103TAQA Annual Report 2020
Strategic Review Operational Review Financial Review Control Environment Financial StatementsOur Business
Analyzed in the consolidated statement of financial position as follows:
31 December2020
AED million2019
AED million
Non-current portion 66,198 –Current portion 8,856 –
75,054 –
The Group’s interest bearing loans and borrowings (before purchase price allocation fair value adjustments and deducting prepaid finance costs) are repayable as follows:
31 December2020
AED million2019
AED million
Within 1 year 8,580 –Between 1-2 years 3,885 –Between 2-3 years 7,209 –Between 3-4 years 11,556 –Between 4-5 years 5,742 –After 5 years 36,729 –
73,701 –
Changes in liabilities arising from financing activities
1 January2020
AED million
Acquisition ofsubsidiaries
(note 1)AED million
Cash flows (note i)
AED million
Other (note ii)
AED million
31 December 2020
AED million
2020Current:
Interest bearing loans and borrowings – 6,454 (5,072) 7,474 8,856Islamic loans – 168 (80) 85 173Lease liabilities 16 184 (93) 110 217
16 6,806 (5,245) 7,669 9,246Non-current:
Interest bearing loans and borrowings – 71,998 1,709 (7,509) 66,198Islamic loans – 819 – (39) 780Lease liabilities 21 349 – (9) 361
21 73,166 1,709 (7,557) 67,339
37 79,972 (3,536) 112 76,585
(i) The cash flows relates to the net movements in interest bearing loans and borrowings and Islamic loans as detailed in the cash flow statement.(ii) This includes reclassifications between non-current and current, prepaid finance cost accruals and payments, foreign exchange difference and fair value adjustments.

104 TAQA Annual Report 2020
NOTES TO THE CONSOLIDATED FINANCIAL STATEMENTS (CONTINUED)31 December 2020
24 INTEREST BEARING LOANS AND BORROWINGS (CONTINUED)(i) Abu Dhabi National Energy Company Global Medium Term NotesAbu Dhabi National Energy Company global medium term notes are recorded at amortized cost using effective interest rates and are direct, unconditional, and unsecured obligations of TAQA. The following table summarizes the terms of the notes payable net of discount/premium and transaction costs:
Issue rate %
Effectiveinterest rate
%Repayment
date2020
AED million2019
AED million
Current liabilitiesUS $500,000,000 99.66% 3.87% June 2021 1,857 –US $250,000,000 102.48% 3.16% June 2021 934 –US $750,000,000 99.52% 6.00% December 2021 2,881 –
5,672 –
Non-current liabilitiesUS $1,250,000,000 99.40% 3.75% January 2023 4,797 –Euro 180,000,000 97.62% 3.10% May 2024 873 –US $750,000,000 99.37% 4.02% May 2024 2,955 –US $750,000,000 99.95% 4.38% April 2025 3,043 –US $500,000,000 99.00% 4.60% June 2026 2,027 –US $500,000,000 104.60% 3.84% June 2026 2,091 –US $1,000,000,000 99.96% 4.88% April 2030 4,349 –US $500,000,000 100.00% 4.00% October 2049 2,052 –
22,187 –27,859 –
(ii) Revolving credit facilitiesThe following table summarizes drawn revolving credit facilities net of transaction costs:
2020AED million
2019AED million
Non-current liabilitiesUS $3.5 billion facility 5,133 –
The revolving credit facility is a USD 3.5 billion, multicurrency revolving credit facility with a syndicate of 13 banks. Amounts borrowed under revolving credit facility carry interest of LIBOR or EURIBOR plus a margin. The facility expires in December 2024.
The liability is stated net of transaction costs incurred, amounting to AED 74 million as at 31 December 2020 (2019: not applicable). This cost is amortized in the consolidated statement of profit or loss over the term of the facility using the effective interest rate method.
(iii) Abu Dhabi National Energy Company bondsThe bonds are recorded at amortized cost using effective interest rates and are direct, unconditional, and unsecured obligations of the Company. Interest on the US dollar bonds is payable semi-annually. Accrued interest is included under accruals and other liabilities. The following table summarizes the bonds net of discount and transaction costs:
Issue rate %
Effectiveinterest rate
%Repayment
date2020
AED million2019
AED million
Non-current liabilitiesUS $1,500,000,000 99.05% 6.60% October 2036 4,429 –
(iv) Other subsidiaries’ bondsThe bonds are recorded at amortized cost using the effective interest rate and are secured by a number of security documents including the subsidiaries contractual rights, cash deposits, other assets and guarantees. Interest on the bonds is payable semi-annually. The following table summarizes the bonds net of discount and transaction costs:
Issue rate %
Effectiveinterest rate
%Repayment
date2020
AED million2019
AED million
Non-current liabilities
Emirates Sembcorp Water & Power Company US $400,000,000 4.45% 4.79%February 2029 to August 2035 1,608 –
Ruwais Power Company US $825,000,000 6.0% 6.18% August 2036 3,772TAQA Morocco MAD 2,700,000,000 3.75% 3.82% March 2038 1,078
6,458 –

105TAQA Annual Report 2020
Strategic Review Operational Review Financial Review Control Environment Financial StatementsOur Business
(v) Term loansAll term loans are shown at amortized cost and carry an effective interest rate of LIBOR plus the margin stated unless noted otherwise.
Currency
Effectiveinterest rate
%Repayment
date2020
AED million2019
AED million
Current liabilitiesGulf Tractebel Power Company PJSC1 USD +0.80% 2021 233 –Shuweihat CMS International Power Company1 USD +1.75% 2021 370 –Arabian Power Company PJSC1 USD +1.65% 2021 269 –Taweelah Asia Power Company PJSC
Term loan (1)1 USD +1.00% 2021 246 –Term loan (2)1 USD +0.83% 2021 326 –
Emirates SembCorp Water and Power Company PJSC2 USD +0.85%-1.20% 2021 196 –Fujairah Asia Power Company PJSC
Term loan (1)1 USD +0.75% 2021 155 –Term loan (2)1 USD +0.50% 2021 234 –
Ruwais Power Company PJSC1 USD +1.90%-2.35% 2021 234 –TAQA Morocco2 MAD 4.8% 2021 104 –Jorf Lasfar Energy Company 5&6 S.A.3 Multi Currency +4.34%-5.60% 2021 321 –Takoradi International Company4 USD +4.25%-4.35% 2021 105 –Sweihan PV Power Company PJSC1 USD +1.2% 2021 79 –Shuweihat Asia Power Company1 USD +1.56%-2.5% 2021 159 –Mirfa International Power and Water Company PJSC1 USD +1.10%-3.15% 2021 153
3,184 –
Non-current liabilitiesAbu Dhabi National Energy Company USD +1.00% 2022 735 –Gulf Tractebel Power Company PJSC1 USD +0.80%-0.95% 2029 2,017 –Arabian Power Company PJSC1 USD +1.65% 2023 593 –Taweelah Asia Power Company PJSC
Term loan (1)1 USD +1.00% 2025 1,023 –Term loan (2)1 USD +0.83% 2025 1,351 –
Emirates SembCorp Water and Power Company PJSC1 USD +0.85%-1.20% 2029 1,910 –Fujairah Asia Power Company PJSC
Term loan (1)1 USD +0.75% 2030 2,011 –Term loan (2)1 USD +0.50% 2030 2,963 –
Ruwais Power Company PJSC1 USD +1.90%-2.50% 2031 3,699 –TAQA Morocco2 MAD 4.8% 2027 483 –Jorf Lasfar Energy Company 5&6 S.A.3 Multi Currency +4.34%-5.60% 2028 1,753 –Takoradi International Company4 USD +4.25%-4.35% 2027 590 –Sweihan PV Power Company PJSC1 USD +1.2% 2042 2,157 –Shuweihat Asia Power Company1 USD +1.56%-2.5% 2034 3,052 –Mirfa International Power and Water Company PJSC1 USD +1.10%-3.15% 2039 3,654
27,991
31,175
1 The loans are secured, subject to various covenants and there are requirements to enter into interest rate swap agreements (note 32).2 The loans are secured by a number of security documents.3 The loan is secured and there are requirements to enter into interest rate swap agreements as well as foreign exchange swap agreements (note 32).4 The loan is secured and there are requirements to enter into interest rate swap agreements (note 32).

106 TAQA Annual Report 2020
NOTES TO THE CONSOLIDATED FINANCIAL STATEMENTS (CONTINUED)31 December 2020
25 ISLAMIC LOANSIslamic loans are with respect to the following subsidiaries:
31 December2020
AED million2019
AED million
Shuweihat CMS International Power Company PJSC 93 –Arabian Power Company PJSC 255 –Abu Dhabi National Energy Company PJSC 605 –
953 –
Analyzed in the consolidated statement of financial position as follows:
31 December2020
AED million2019
AED million
Non-current portion 780 –Current portion 173
953 –
The Group’s Islamic loans (before purchase price allocation fair value adjustments and deducting prepaid finance) are repayable as follows:
31 December2020
AED million2019
AED million
Within 1 year 172 –Between 1-2 years 772 –
944 –
All Islamic loans carry an effective rental rate of LIBOR plus the margin stated unless noted otherwise.
Currency
Effectiverental rate
%Repayment
date2020
AED million2019
AED million
Current liabilitiesShuweihat CMS International Power Company1 USD +1.75% 2021 93 –Arabian Power Company PJSC1 USD +1.65% 2021 80 –
173 –
Non-current liabilitiesAbu Dhabi National Energy Company PJSC2 MYR 4.71% 2022 605 –Arabian Power Company PJSC1 USD +1.65% 2023 175 –
780 –
953 –
1 The loans are secured and there are requirements to enter into rental rate swap agreements (note 32).2 The Group has entered into a cross currency swap arrangement to hedge the exposure of fluctuating currency rates (note 32).

107TAQA Annual Report 2020
Strategic Review Operational Review Financial Review Control Environment Financial StatementsOur Business
26 ASSET RETIREMENT OBLIGATIONSAs part of the land lease agreements between ADPC and the Group’s domestic subsidiaries, the subsidiaries have a legal obligation to remove the power and water desalination plants at the end of the plants’ useful lives, or before if the subsidiaries became unable to continue their operations to that date, and to restore the land. The subsidiaries shall at their sole cost and expense dismantle, demobilize, safeguard and transport the assets, eliminate soil and ground water contamination, fill all excavation and return the surface to grade of the designated areas. The fair value of the ARO liability has been calculated using an expected present value technique. This technique reflects assumptions such as costs, plant useful life, inflation and profit margin that third parties would consider to assume the settlement of the obligation.
In addition, the Group’s foreign subsidiaries involved in the oil and gas sector make provision for the future cost of decommissioning oil and gas properties and facilities at the end of their economic lives. The economic life and the timing of the decommissioning liabilities are dependent on Government legislation, commodity prices and the future production profiles of the respective assets. In addition, the costs of decommissioning are subject to inflationary/ deflationary pressures in the cost of third party service provision.
31 December2020
AED million2019
AED million
At 1 January – –Acquisition of subsidiaries (note 1) 16,408 –Utilized during the year (136) –Provided during the year (2) –Accretion expense (note 7) 228 –Revision in estimated cash flows (607) –Exchange adjustment 187 –
16,078 –
Analyzed in the consolidated statement of financial position as follows:
31 December2020
AED million2019
AED million
Non-current portion 15,905 –Current portion (note 29) 173 –
16,078 –
(i) As part of the acquisition detailed in note 1, the Group acquired asset retirement obligations of AED 16,408 million, being AED 16,032 million non-current and AED 376 million current (included within Accounts payable, accruals and other liabilities).
27 DEFERRED INCOME – GRANTDeferred income relates to the fair value of assets transferred in prior years from Emirates CMS Power Company PJSC, Taweelah Asia Power Company PJSC, Shuweihat CMS International Power Company PJSC, the Private Department Al Ain and Arabian Power Company.
Deferred income also includes an amount of AED 75 million received in prior years from Fujairah Asia Power Company PJSC for the procurement and installation of additional water storage tanks offsite the F2 leased premises and the downstream of the intermediate pumping station of the Water Trunk Main System having a usable storage capacity of 50 million imperial gallons (MIG).
31 December2020
AED million2019
AED million
At 1 January 1,098 1,170Amounts released to other income (note 8) (29) (72)Additions 378 –Inter company eliminations (1,060) –
387 1,098
Analyzed in the consolidated statement of financial position as follows:
31 December2020
AED million2019
AED million
Non-current portion 315 1,026Current portion 72 72
387 1,098

108 TAQA Annual Report 2020
NOTES TO THE CONSOLIDATED FINANCIAL STATEMENTS (CONTINUED)31 December 2020
28 OTHER LIABILITIES
31 December2020
AED million2019
AED million
Negative fair value of derivatives – cash flow hedges (note 32.1) 4,415 –Lease liabilities 361 21Others 289 56
5,065 77
29 ACCOUNTS PAYABLE, ACCRUALS AND OTHER LIABILITIES
31 December2020
AED million2019
AED million
Trade payables 2,142 133Retention creditors 874 803Mega development projects payable 4,112 –Contract accruals 1,752 –Customer deposits 696 –Accrued interest expenses 743 –Accrual for operating costs 825 1,533Payable for capital expenditure 1,006 –Cash flow hedges (note 32.1) 838 –Crude stock overlift 23 –Deferred income – connection fees 11 –Dividend payable to non-controlling interests 52 –Lease liability 217 16Asset retirement obligations – current (note 26) 173 –Income tax payable 582 –Accrued employee related expenses 542 –Others 1,683 270
16,271 2,755
Terms and conditions of the above liabilities:• Trade payables are non-interest bearing and are normally settled between 30 to 60 day terms• Payables to joint venture partners are non-interest bearing and have an average term of 60 days• Interest payable is normally settled throughout the financial year in accordance with the terms of the loans

109TAQA Annual Report 2020
Strategic Review Operational Review Financial Review Control Environment Financial StatementsOur Business
30 RELATED PARTY BALANCESThe Group enters into transactions with companies and entities that fall within the definition of a related party. Related parties, as defined in International Accounting Standard 24: Related Party Disclosures, include associate companies, major shareholders, directors and other key management personnel of the Company, and entities controlled, jointly controlled or significantly influenced by such parties. The transaction detailed in note 1 should be considered as a related party transaction.
The following table provides a summary of other significant related party transactions included in the consolidated statement of profit or loss during the year:
31 December2020
AED million2019
AED million
TUOS and connection charges for licensed activity to:Abu Dhabi Distribution Company (fellow subsidiary) 1,753 3,806Al Ain Distribution Company PJSC (fellow subsidiary) 550 1,101
2,303 4,907
Emirates Water and Electricity Company:TUOS and connection charges for unlicensed activity 1,011 1,150Revenue from electricity and water 4,235 –Fuel revenue 14 –Electricity and water bulk supply tariff (7,106) –
(1,846) 1,150
Other operating revenue 5,210 –
Repairs and maintenance and other related costs charged by:Abu Dhabi Distribution Company (fellow subsidiary) (53) (167)Al Ain Distribution Company PJSC (fellow subsidiary) (15) (21)Emirates Water and Electricity Company (EWEC) (40) (78)MASSAR Solutions (15) (6)
(123) (272)
Other transactionsAdministrative service charges from ADPC (26) (57)GCC grid operating fees (27) (23)Fuel expense (3) –License fees to DOE (48) (23)Charges for provision of IT support services (48) (19)Finance costs (8) –
Other operating revenue for sales of water and electricity is calculated as the difference between its Maximum Allowed Revenue (MAR) determined in its Regulatory Control 1 (communicated by the DoE) and revenue relating to sales of water and electricity from its customers. Accordingly, the Group recognized this revenue for sales of water and electricity based on those rights and rewards that are confirmed during the year.

110 TAQA Annual Report 2020
NOTES TO THE CONSOLIDATED FINANCIAL STATEMENTS (CONTINUED)31 December 2020
30 RELATED PARTY BALANCES (CONTINUED)Balances with related parties Balances with related parties that are disclosed in the consolidated statement of financial position as follows:
31 December2020
AED million2019
AED million
Non-current asset Advance and loans to associates and joint ventures 1,042 –
Current assetsBank balances with UAE government banks 6,660 220
Amounts due from Emirates Water and Electricity Company (EWEC) (note (i)) 1,503 214Amounts due from Abu Dhabi Power Corporation (ADPC) (note (i)) 555 5,426Amounts due from other related parties (note (i)) 551 –Amounts due from Abu Dhabi Distribution Company (fellow subsidiary) – 158Amounts due from Al Ain Distribution Company PJSC (fellow subsidiary) – 39
2,609 5,837
Non-current liabilities Loan from Abu Dhabi Power Corporation (ADPC) 24 –Bank loans with government owned bank 122 –
146 –
Current liabilitiesOverdraft with UAE government banks 66 –
Amounts due to Emirates Water and Electricity Company (EWEC) 1,986 –Amounts due to Abu Dhabi Power Corporation (ADPC) 107 –Amounts due to other related parties 110 –Union Water and Electricity Company – 2,177
2,203 2,177
Available undrawn bank facilities with UAE government banks 360 –
Terms and conditions of transactions with related partiesThe sales to and purchases from related parties are made on terms approved by the management. Outstanding balances at the year end are unsecured, interest free and settlement occurs in cash. There have been no guarantees provided or received for any related party receivables or payables. Amounts due from related parties, net of provisions, are expected, on the basis of past experience, to be fully recoverable. Management has determined that the provision made against these amounts are appropriate as these are receivable from government entities with low probability of default and loss given default.

111TAQA Annual Report 2020
Strategic Review Operational Review Financial Review Control Environment Financial StatementsOur Business
(i) Amounts due from related partiesAs at 31 December 2020, related parties receivables at nominal value of AED 17 million (2019: AED 9 million) were impaired and fully provided for. The amounts due from EWEC, a fellow subsidiary of ADPC, in respect of available capacity and supply of water and electricity, are payable within 30-90 working days. Movements in the provision for impairment of related party receivables are as follows:
31 December2020
AED million2019
AED million
At 1 January 9 30Acquisition of subsidiaries (note 1) 16 –Provision/ECL for the year (8) (21)
At 31 December 17 9
As at 31 December, the aging analysis of related party receivables is as follows:
Past due but not impaired
TotalAED million
Neither pastdue nor
impairedAED million
30-60days
AED million
60-90days
AED million
90-120days
AED million
>120days
AED million
2020 2,609 1,888 194 42 126 359
Compensation of key management personnelThe remuneration of senior key management personnel of the Group during the year was as follows:
31 December2020
AED million2019
AED million
Short and long term benefits 13 6
31 COMMITMENTS AND CONTINGENCIESCapital expenditure commitmentsThe authorized contracted capital expenditure contracted for at 31 December 2020 but not provided for amounted to AED 3,080 million (31 December 2019: AED 1,223 million). Operating lease commitmentsGroup as a lessor:Future capacity payments to be received by the Group under the power and water purchase agreement (“PWPA”) based on projected plant availability as at 31 December 2020 are as follows:
31 December2020
AED million2019
AED million
Within one year 7,072 –After one year but not more than five years 28,122 –More than five years 37,203 –
At 31 December 72,397 –
Other commitmentsAs at the reporting date TAQA North has entered into contractual commitments, mainly pipeline usage, under which they are committed to spend AED 871 million as at 31 December 2020 (31 December 2019: nil).

112 TAQA Annual Report 2020
NOTES TO THE CONSOLIDATED FINANCIAL STATEMENTS (CONTINUED)31 December 2020
31 COMMITMENTS AND CONTINGENCIES (CONTINUED)Contingenciesa) The Group guaranteed the obligations of TAQA GEN X LLC to Morgan Stanley Capital Group Inc. under the Energy Management Agreement
(EMA) and International Swap & Derivatives Master agreement. Payments under this guarantee shall not exceed US $100 million (AED 367 million) (31 December 2019: nil) over the life of the EMA. No payments have been made to date (31 December 2019: nil).
b) The Group has entered into decommissioning security agreements for a number of UK North Sea Assets acquired by it, pursuant to which it may be required to provide financial security to the former owners of the assets, either by means of (a) placing monies in trust or procuring the issuance of letters of credit in an amount equal to its share of the net decommissioning costs of the subject fields plus an allowance for uncertainty; or (b) procuring a guarantee from a holding company or affiliate which satisfies a minimum credit rating threshold; or (c) providing security in such other form as may be agreed by parties to the deeds.
In respect of certain other UK North Sea Assets TAQA is able to meet the security arrangements for decommissioning obligations by way of provision of a parent company guarantee, so long as TAQA continues in majority-ownership of the Government of Abu Dhabi.
c) TAQA Offshore B.V., alongside other oil and gas companies and the government of the Netherlands in a cross industry initiative has put in place security for offshore oil and gas infrastructure decommissioning. TAQA Offshore B.V. has formally committed to the Government initiative and a legal Netherlands trust arrangement has been set up, and a bank guarantee secured, to effect the provision of security by TAQA Offshore B.V.
d) The Group has various claims lodged by contractors and consultants relating to its ongoing and completed projects, arising from extension of time and work performed but not paid. The Group is in negotiations with these contractors and consultants regarding the resolution of these claims. At this stage management believes it is not possible to determine a reliable estimate of the range of potential claims.
e) The Group has a number of letters of credit and guarantees issued on behalf of the generation companies in relation to debt service reserve accounts.
32 FINANCIAL INSTRUMENTS32.1 Hedging Activities
31 December 2020 31 December 2019Fair value Fair value
Notionalamount
AED millionCurrent
AED millionNon-currentAED million
Notional amount
AED millionCurrent
AED millionNon-current AED million
Cash flow hedgesLiabilitiesCross currency interest rate swap 594 16 211 – – –Interest rate swaps – hedged 27,856 819 4,172 – – –Forward foreign exchange contracts 427 3 32 – – –
838 4,415 – – –
AssetsInterest rate swaps – hedged 123 – 44 – –Forward foreign exchange contracts 2,004 26 24 – – –
26 68 – – –
Fair value hedgesAssetsFutures and forward contracts – 23 – – – –

113TAQA Annual Report 2020
Strategic Review Operational Review Financial Review Control Environment Financial StatementsOur Business
(i) Interest Rate Swaps – Cash flow hedgeIn order to reduce their exposure to interest rate fluctuations on variable interest bearing loans and borrowings (note 24) and Islamic loans (note 25) certain subsidiaries have entered into interest rate swap arrangements with counter-party banks for a notional amount that matches the outstanding interest bearing loans and borrowings and Islamic loans. The derivative instruments were designated as cash flow hedges. The following table summarizes certain information relating to the derivatives for each subsidiary as of 31 December 2020 and 31 December 2019:
Notional amount Derivative liabilities Derivative assets Fix leg on instrument
2020
Fix leg on instrument
2019Subsidiary2020
AED million2019
AED million2020
AED million2019
AED million2020
AED million2019
AED million
GTTPC 2,037 – 237 – – – 2.63% to 3.76% –SCIPCO 464 – 8 – – – 1.83% to 2.65% –APC 901 – 57 – – – 4.60% to 4.89% –TAPCO 2,529 – 241 – – – 3.64% to 5.28% –ESWPC 2,121 – 210 – – – 2.80% to 5.85% –FAPCO 5,146 – 1,095 – – – 0.84% to 5.72% –SPVPC 1,984 – 323 – – – 1.43% to 2.77% –MIPCO 3,652 757 – 44 – Average 2.66% –SAPCO 3,237 829 – – – 1.63% to 5.14% –RPC 4,161 – 1,084 – – – 4.62% to 5.40% –JLEC 5&6 1,247 – 116 – – – 1.92% to 2.12% –TICO 500 – 34 – – – 2.20% to 2.31% –
27,979 – 4,991 – 44 –
(ii) Cross currency Swaps – Cash flow hedgesThe Group has entered into a cross currency rate swap agreement to hedge the Group’s exposure on the Malaysian Ringgit Sukuk (note 25). Under the terms of the cross currency rate swap, TAQA is required to pay a fixed rate of 5.3% per annum on an initial exchange amount of US $ 215 million and receive a fixed rate of 4.65% per annum on an amount of MYR 650 million. The derivative instrument had a negative fair value of AED 227 million at 31 December 2020, which is included within other liabilities (note 28) and accounts payables, accruals and other liabilities (note 29) in the consolidated statement of financial position.
(iii) Forward Foreign Exchange ContractsCertain subsidiaries use forward foreign exchange contracts to hedge their risk associated with foreign currency fluctuations relating to scheduled maintenance cost payments to overseas suppliers. The derivative instruments were designated as cash flow hedges. The following table summarizes certain information relating to the derivatives for each subsidiary as of 31 December 2020 and 31 December 2019:
Notional amount Derivative liabilities Derivative assets
Subsidiary2020
AED million2019
AED million2020
AED million2019
AED million2020
AED million2019
AED million
SCIPCO 2 – 2 – – –MIPCO 58 – 1 – – –SPVPC 367 – 32 – – –TAQA Bratani Limited 2,004 – – – 50 –
2,431 – 35 – 50 –
32.2 Hedging activities – Fair Value hedgesTAQA GEN X LLC, a subsidiary of TAQA utilizes derivative instruments, which include futures and forwards as a hedging strategy to manage the exposure in the fair value of the underlying Tolling Agreement. Forward and future transactions are contracts for delayed delivery of commodity instruments in which the counterpart agrees to make or take delivery at a specified price.
As at 31 December 2020, the net fair value of exchange-traded derivative instruments was AED 23 million shown under accounts receivables and prepayments (note 18) (2019: AED nil). The net realized and unrealized gain recognized in the consolidated profit and loss relating to such instruments are AED 40 million for the year ended 31 December 2020 (2019: AED nil).
The Tolling Agreement recognized as an intangible at acquisition was adjusted for the change in fair value for movements in the designated hedge risk in a fair value hedge relationship. The changes in the fair value of the Tolling Agreement attributable to the hedged risk (note 14), for the year ended 31 December 2020 was a gain of AED 14 million (2019: AED nil) which was recognized in the consolidated profit and loss.

114 TAQA Annual Report 2020
NOTES TO THE CONSOLIDATED FINANCIAL STATEMENTS (CONTINUED)31 December 2020
32 FINANCIAL INSTRUMENTS (CONTINUED)32.3 Fair valuesThe fair values of the financial instruments of the Group are not materially different from their carrying values at the reporting date except for certain fixed interest borrowings and operating financial assets. Set out below is a comparison of the carrying amounts and fair values of fixed interest borrowings and operating financial assets:
Carrying amount Fair value2020
AED million2019
AED million2020
AED million2019
AED million
Operating financial assets (note i) 10,937 – 11,112 –Interest bearing loans and borrowings (note ii) 38,751 – 38,894 –
(i) The fair value of operating financial assets is estimated by discounting the expected future cash flows using appropriate interest rates for assets with similar terms, credit risk and remaining maturities.
(ii) Interest bearing loans and borrowings relates to the Abu Dhabi National Energy Company Global Medium Term notes, Abu Dhabi National Energy Company bonds, Ruwais Power Company bond, Emirates SembCorp Water and Power Company bond and TAQA Morocco bond. The fair value of the interest bearing loans and borrowings is based on price quotations at the reporting date.
32.4 Fair Values hierarchyThe Company uses the following hierarchy for determining and disclosing the fair value of financial instruments by valuation technique:
Level 1: Quoted (unadjusted) prices in active markets for identical assets or liabilities.Level 2: Other techniques for which all inputs which have a significant effect on the recorded fair value are observable, either directly or indirectly.Level 3: Techniques which use inputs which have a significant effect on the recorded fair value that are not based on observable market data.
For level 3 valuations, the Group relies on discounted cash flow models based on management expectations.
Fair value AED million
Carrying valueAED million
Fair value hierarchy
At 31 December 2020Financial assets measured at fair valueInterest rate swaps – hedged 44 44 Level 2Future and forward contracts 50 50 Level 2Financial assets disclosed at fair valueOperating financial assets 11,112 10,937 Level 3Future and forward contracts 23 23 Level 2Financial liabilities measured at fair valueInterest rate swaps – hedged 4,991 4,991 Level 2Forward foreign exchange contracts 35 35 Level 2Cross currency interest rate swaps 227 227 Level 2Financial liabilities disclosed at fair valueInterest bearing loans and borrowings 38,894 38,751 Level 1
At 31 December 2019Financial assets measured at fair valueInterest rate swaps – hedged – – –Forward foreign exchange contracts – – –Financial assets disclosed at fair valueOperating financial assets – – –Futures and forward contracts – – –Financial liabilities measured at fair valueInterest rate swaps – hedged – – –Forward foreign exchange contracts – – –Cross currency interest rate swaps – – –Financial liabilities disclosed at fair valueInterest bearing loans and borrowings – – –
During the year ended 31 December 2020 there were no transfers between Level 1 and Level 2 fair value measurements, and no transfers into and out of Level 3 fair value measurements.
The fair values of other financial instruments of the Group are not materially different from their carrying values at the reporting date.
Interest bearing loans and borrowings detailed above relates to the Group’s medium term notes and bonds portfolio. The company’s project related debt is excluded from this number as the fair value is not materially different from the carrying value at the reporting date.
The fair values of the financial assets and financial liabilities measured at fair value included in the Level 1 category above, have been determined by market rates at the year end date.

115TAQA Annual Report 2020
Strategic Review Operational Review Financial Review Control Environment Financial StatementsOur Business
The fair values of the financial assets and financial liabilities measured at fair value included in the Level 2 category above, have been determined in accordance with generally accepted pricing models based on a discounted cash flow analysis. The models incorporate various inputs including foreign exchange spot and forward rates, interest rate curves and forward rate curves of the underlying commodities.
For financial instruments where there is no active market, fair value is determined using valuation techniques. Such techniques may include using recent arm’s length market transactions; reference to the current fair value of another instrument that is substantially the same; discounted cash flow analysis or other valuation models.
33 SUBSIDIARIES, JOINT VENTURES AND ASSOCIATESAs part of the business combination TransCo acquired the following major operating subsidiaries, joint ventures and associates and their effective ownership as at 31 December 2020 are listed below:
SubsidiariesEffective ownership%
Country of incorporation Principal activities
Foreign subsidiariesTAQA Bratani Limited 100% UK Oil & gas productionTAQA North Ltd. 100% Canada Oil & gas productionTAQA Atrush B.V. 100% Netherlands Oil & gas productionTAQA Energy B.V. 100% Netherlands Gas storage, oil & gas productionTAQA Morocco 86% Morocco Power generationJorf Lasfar Energy Company 5&6 S.A 91% Morocco Power generationTakoradi International Company 90% Cayman Islands Power generationTAQA Neyveli Power Company Private Ltd 100% India Power generationTAQA GEN X 85% USA Gas power tolling interest
Domestic subsidiariesAbu Dhabi Distribution Company PJSC (ADDC) 100% UAE Distribution of water and electricity in the region
of Abu Dhabi and surrounding areas.Al Ain Distribution Company PJSC (AADC) 100% UAE Distribution of water and electricity in the region
of Al Ain and surrounding areas.Al Mirfa Power Company PJSC (AMPC) 100% UAE
Generation of electricity and the production of desalinated water
Sweihan PV Power Company PJSC (SPVPC) 60% UAEShuweihat Asia Power Company (SAPCO) 60% UAEMirfa International Power and Water Company PJSC (MIPCO) 60% UAEGulf Total Tractebel Power Company PJSC (GTTPC) 60% UAEArabian Power Company PJSC (APC) 60% UAEShuweihat CMS International Power Company PJSC (SCIPCO) 60% UAETaweelah Asia Power Company PJSC (TAPCO) 60% UAEEmirates Semb Corp Water and Power Company PJSC (ESWPC) 60% UAEFujairah Asia Power Company PJSC (FAPCO) 60% UAEEmirates CMS Power Company (ECPC) 60% UAERuwais Power Company PJSC (RPC) 60% UAETaweelah Shared Facilities Company LLC 53% UAE Operating & maintenanceShuweihat Shared Facilities Company LLC* 42% UAE Operating & maintenance
AssociatesMassar Solutions PJSC 49% UAE Lease ManagementJubail Energy Company 25% KSA Generation of ElectricitySohar Aluminium Company LLC 40% Oman Aluminium Smelter
Joint VenturesLWP Lessee LLC 50% USA Wind PowerTaweelah RO Holding Company LLC 33% UAE Production of desalinated waterFujairah Energy Holding Company LLC 67% UAE Generation of ElectricityDhafrah Solar Energy Holding Company LLC 67% UAE Solar Power
* The entity is treated as a subsidiary even though the Group’s holding in the entity is below 50% due to the Group’s control through the indirect holding in this entity by two of the Group’s subsidiaries being above 50%, thus enabling the Group to have the ability to exercise control in the Board.

116 TAQA Annual Report 2020
NOTES TO THE CONSOLIDATED FINANCIAL STATEMENTS (CONTINUED)31 December 2020
34 FINANCIAL RISK MANAGEMENT OBJECTIVES AND POLICIESInterest rate riskThe Group’s exposure to the risk of changes in market interest rates relates primarily to the Group’s long-term debt obligations and short-term deposits with floating interest rates. The Group’s policy is to manage its interest cost using a mix of fixed and variable rate debts. To manage this, the Group enters into interest rate swaps, in which the Group agrees to exchange, at specified intervals, the difference between fixed and variable rate interest amounts calculated by reference to an agreed upon notional principal amount. These swaps are designated to hedge underlying debt obligations. At 31 December 2020, after taking into account the effect of interest rate swaps, approximately 87% of the Group’s borrowings are at a fixed rate of interest (2019: not applicable).
Interest rate sensitivityThe following table demonstrates the sensitivity to a reasonably possible change in interest rates on that portion of loans and borrowings and deposits, after the impact of hedge accounting. With all other variables held constant, the Group’s profit before tax and equity is affected as follows:
Effect on profit before tax
AED million
Effect on equity AED
million
2020+15 increase in basis point (27) 126-15 decrease in basis point 27 (126)
2019+15 increase in basis point – –-15 decrease in basis point – –
LIBOR reforms and the expected cessation of LIBOR will impact the Group’s current interest rate risk management and accounting for certain financial instruments. The Group is in the process of discussing with the relevant counterparties and understanding the arrangements regarding the new benchmark for the relevant contracts. The Group expects to finalize their plan as early as practicable to ensure a smooth transition from LIBOR to the new benchmark.
Foreign currency riskForeign currency risk is the risk that the fair value or future cash flows of a financial instrument will fluctuate because of changes in foreign exchange rates. The Group’s exposure to risk of changes in foreign exchange rates relates primarily to the operating activities (when revenue or expense are denominated in a different currency from the functional currencies of the subsidiaries), carrying values of assets and liabilities in Canadian Dollars, Euros, Moroccan Dirhams and Indian rupees and the Group’s net investment in foreign subsidiaries.
The Group hedges part of its net exposure to fluctuations on the translation into AED of its foreign operations by holding certain borrowings in foreign currencies, primarily in Euros.
The following table demonstrates the sensitivity to a reasonably possible change in the Euro, GBP, CAD, and Moroccan Dirham exchange rates, with all other variables held constant, of the Group’s profit before tax (due to changes in the fair value of monetary assets and liabilities) and the Group’s equity (due to changes in foreign currency translation reserve). The Group’s exposure to foreign currency changes for all other currencies is not material.
Increase/ decrease in Euro, GBP, Moroccan Dirham,
Indian rupees, and CAD rates
Effect on profit before tax AED
millionEffect on equity
AED million
2020 +5% (81) 20-5% 81 (20)
2019 +5% – –-5% – –
The movement in equity arises from changes in Euro borrowings in the hedge of net investments in the Netherlands. These movements will partly offset the translation of the Netherland’s operations net assets into AED.

117TAQA Annual Report 2020
Strategic Review Operational Review Financial Review Control Environment Financial StatementsOur Business
Commodity price riskTAQA GEN X LLC, a subsidiary of TAQA is affected by the volatility of certain commodities. Its operating activities require the ongoing purchase of gas and sale of electricity. Due to volatility in the prices of these commodities, the subsidiary’s management has developed and enacted a risk management strategy regarding commodity price risk and its mitigation. The Group mitigates the commodity price risks using forward commodity contracts.
The following table shows the effect of price changes on the fair value of the forward commodity contracts on the profit before tax:
Change in year end price
Effect on profit before tax AED
million
2020 +10% 12-10% (12)
2019 +10% –-10% –
The Group also enters into physical commodity contracts in the normal course of business. These contracts are not derivatives and are treated as executory contracts, which are recognized and measured at cost when the transactions occur.
Credit riskCredit risk is the risk that a counterparty will not meet its obligations under a financial instrument or customer contract, leading to a financial loss. The Group is exposed to credit risk from its operating activities (primarily for trade receivables) and from its financing activities, including deposits with banks and other financial instruments.
Trade and other receivables Customer credit risk is managed by each business unit subject to the Group’s established policy, procedures and control relating to customer credit risk management. Credit limits are established for all customers based on internal rating criteria. Credit quality of the customer is assessed based on an extensive credit rating scorecard.
Outstanding customer receivables are regularly monitored and any shipments to major customers are generally covered by letters of credit or other form of credit insurance. The Group’s largest 2 customers account for approximately 28% of outstanding trade receivables and amounts due from related parties at 31 December 2020 (2019: not applicable). The requirement for impairment is analyzed at each reporting date on an individual basis for major costumers. Additionally, a large number of minor receivables are grouped into homogenous groups and assessed for impairment collectively. All impairment considerations for trade and other receivables are performed using the expected credit loss model. The maximum exposure to credit risk at the reporting date is the carrying value of each class of financial assets disclosed in note 18. The Group does not hold collateral as security.
Operating financial assetsThe operating financial assets relating to the Group’s international generation subsidiaries sell their products to one party, which is typically a governmental entity. These subsidiaries seek to limit their credit risk with respect to a single customer by monitoring outstanding receivables. The Group’s maximum exposure to credit risk for the components of the consolidated statement of financial position at 31 December 2020 and 2019 is the carrying amounts as illustrated in note 13.
Other financial instruments and cash depositsCredit risk from balances with banks and financial institutions is managed by the Group’s treasury in accordance with the Group’s policy. Investments of surplus funds are made only with reputable banks and financial institutions. The Group’s maximum exposure to credit risk for the components of the consolidated statement of financial position at 31 December 2020 and 2019 is the carrying amounts as illustrated in note 19 except for derivative financial instruments. The Group’s maximum exposure for derivative instruments is disclosed in note 32 and in the liquidity table below, respectively.
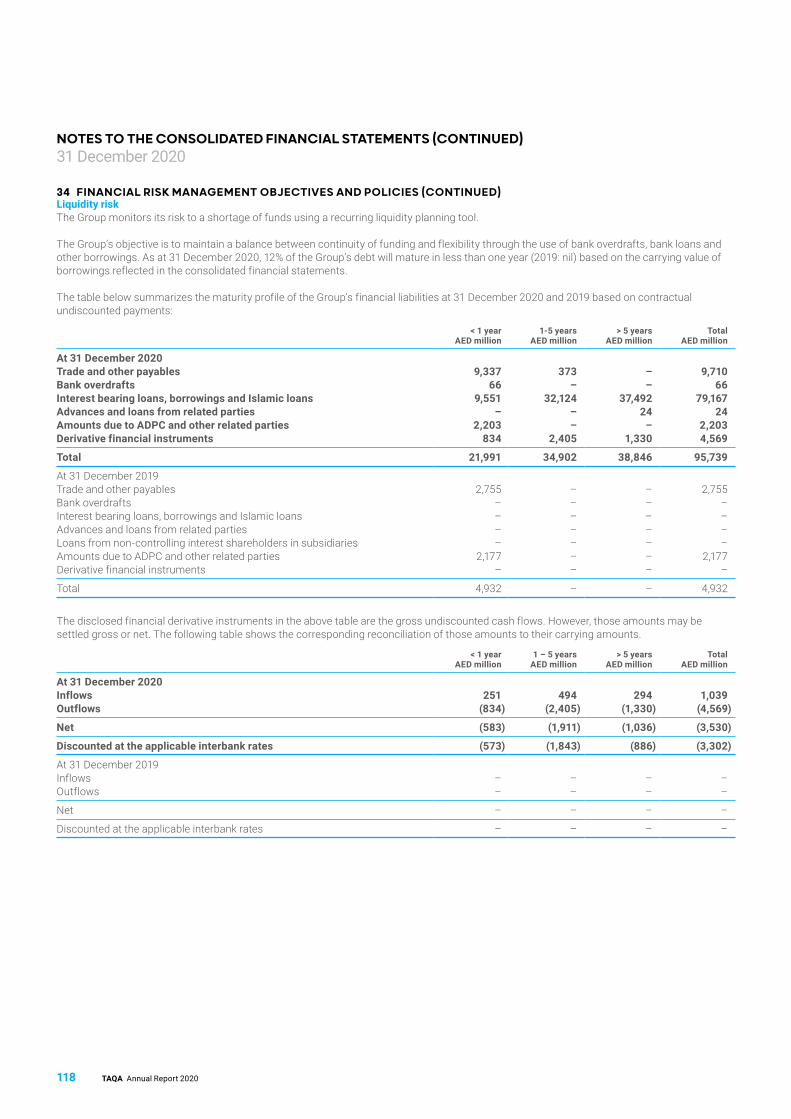
118 TAQA Annual Report 2020
NOTES TO THE CONSOLIDATED FINANCIAL STATEMENTS (CONTINUED)31 December 2020
34 FINANCIAL RISK MANAGEMENT OBJECTIVES AND POLICIES (CONTINUED)Liquidity riskThe Group monitors its risk to a shortage of funds using a recurring liquidity planning tool.
The Group’s objective is to maintain a balance between continuity of funding and flexibility through the use of bank overdrafts, bank loans and other borrowings. As at 31 December 2020, 12% of the Group’s debt will mature in less than one year (2019: nil) based on the carrying value of borrowings reflected in the consolidated financial statements.
The table below summarizes the maturity profile of the Group’s financial liabilities at 31 December 2020 and 2019 based on contractual undiscounted payments:
< 1 yearAED million
1-5 yearsAED million
> 5 yearsAED million
TotalAED million
At 31 December 2020Trade and other payables 9,337 373 – 9,710Bank overdrafts 66 – – 66Interest bearing loans, borrowings and Islamic loans 9,551 32,124 37,492 79,167Advances and loans from related parties – – 24 24Amounts due to ADPC and other related parties 2,203 – – 2,203Derivative financial instruments 834 2,405 1,330 4,569
Total 21,991 34,902 38,846 95,739
At 31 December 2019Trade and other payables 2,755 – – 2,755Bank overdrafts – – – –Interest bearing loans, borrowings and Islamic loans – – – –Advances and loans from related parties – – – –Loans from non-controlling interest shareholders in subsidiaries – – – –Amounts due to ADPC and other related parties 2,177 – – 2,177Derivative financial instruments – – – –
Total 4,932 – – 4,932
The disclosed financial derivative instruments in the above table are the gross undiscounted cash flows. However, those amounts may be settled gross or net. The following table shows the corresponding reconciliation of those amounts to their carrying amounts.
< 1 yearAED million
1 – 5 yearsAED million
> 5 yearsAED million
TotalAED million
At 31 December 2020Inflows 251 494 294 1,039Outflows (834) (2,405) (1,330) (4,569)
Net (583) (1,911) (1,036) (3,530)
Discounted at the applicable interbank rates (573) (1,843) (886) (3,302)
At 31 December 2019Inflows – – – –Outflows – – – –
Net – – – –
Discounted at the applicable interbank rates – – – –

119TAQA Annual Report 2020
Strategic Review Operational Review Financial Review Control Environment Financial StatementsOur Business
Capital managementThe primary objective of the Group’s capital management is to ensure that it maintains a strong credit rating and healthy capital ratios in order to support its business and maximize shareholder value.
The Group manages its capital structure and makes adjustments to it, in light of changes in economic conditions. There are no regulatory imposed requirements on the level of share capital which the Group has not met. To maintain or adjust the capital structure, the Group may adjust the dividend payment to shareholders or issue new shares. On 13 December 2020 TAQA Group’s shareholders approved a new dividend policy for 2020-2022. The policy includes a quarterly dividend payment and a commitment to grow this by 10% per year over the next two years.
The Group monitors capital using a gearing ratio, which is net debt divided by total capital plus net debt. The Group includes within net debt, interest bearing loans and borrowings, Islamic loans, less cash and cash equivalents. Capital includes total equity including non-controlling interests.
2020 AED million
Interest bearing loans and borrowings 75,054Islamic loans 953Less cash and cash equivalents (8,321)
Net debt 67,686
Equity 69,255
Equity and net debt 136,941
Gearing ratio 49%
35 RECLASSIFICATION OF PRIOR YEAR BALANCES Certain comparative figures have been reclassified/regrouped, wherever necessary, as to conform to the presentation adopted in these consolidated financial statements. These reclassifications do not materially change the presentation of the financial statements.
36 EVENTS AFTER REPORTING DATEOn 14th February 2021, the Board of Directors proposed a final dividend of AED 1,124 million, being AED 0.01 per share for the year ended 31 December 2020. The dividend will be subject to shareholder approval at the General Assembly meeting in March 2021.

120 TAQA Annual Report 2020
GLOSSARY OF TERMS
2P Proved Plus Probable
AECO Alberta Energy Company
ADPower Abu Dhabi Power Corporation
ADX Abu Dhabi Securities Exchange
Bcm Billion Cubic Meters
BCM Business Continuity Management
Bbl Barrel
Boe Barrels of Oil Equivalent
Boepd Barrels of Oil Equivalent Per Day
BOO Build, Own and Operate
BOT Build, Operate and Transfer
BOOT Build, Own, Operate and Transfer
Bpd Barrels Per Day
Btu British Thermal Unit (mmbtu: million BTU)
CCGT Combined Cycle Gas Turbine
CGEM Confédération Générale des Entreprises Du Maroc (The General Confederation of Enterprises in Morocco)
CNS Central North Sea
COD Commercial Operation Date
COE Commitment to Operational Excellence
CPF Central Processing Facility
CSR Corporate Social Responsibility
DCS Distributed Control System
DDI Development Dimensions International
DOA Delegation of Authority
EFOR Equivalent Forced Outage Rate
EPF Early Production Facility
ESG Environmental, Social and Governance
ERM Enterprise Risk Management
EWEC Emirates Water and Electricity Company
FGD Flue-gas Desulfurization
FTE Full-time Employee
GBA Greater Brae Area
GCC Gulf Cooperation Council
GSB Gas Storage Bergermeer
GTG Gas Turbine Generator
GW Gigawatt
GWh Gigawatt Hours
HSE Health, Safety and Environment
HSSE Health, Safety, Security and Environmental
IMS Integrity Management System
IOGP International Association of Oil and Gas Producers
ISO International Organization for Standardization
I(W)PP Independent (Water and) Power Plant
JV Joint Venture
KRG Kurdistan Regional Government
KRI Kurdistan Region of Iraq
KV Kilovolt
LTI Lost Time Injury
LTSA Long Term Service Agreement
MED Multiple-Effect Distillation
MENA Middle East and North Africa
MIG Million Imperial Gallons
MVA Megavolt-ampere
MIGD Million Imperial Gallons per Day
MoHRE Ministry of Human Resources and Emiratization
MSF Multi-Stage Flash
MW Megawatt
MWh Megawatt Hours
NGL Natural Gas Liquids
O&G Oil and Gas
O&M Operation and Maintenance
OEM Original Equipment Manufacturer
OHSAS Occupational Health and Safety Assessment Series
ONEE Office National de l’Ectricité et de l’Eau Potable (National Office of Electricity and Drinking Water)
P&A Plug and Abandonment
P&W Power and Water
PEAR People, Environment, Asset and Reputation
PGI Peak Gas Installation
PJM Pennsylvania, Jersey, Maryland Interconnection
P(W)PA Power (and Water) Purchase Agreement
PV Photovoltaic
RGGI Regional Greenhouse Gas Initiative
RO Reverse Osmosis
RIR Recordable Incident Rate
SAMU Service d’Aide Medicale Urgente
SCA Securities and Commodities Authority in the UAE
SDGs Sustainable Development Goals
TC Energy TransCanada Energy
TTF Title Transfer Facility
TWh Terawatt Hours
UAE United Arab Emirates

TAQA Annual Report 2020
Abu Dhabi National Energy Company PJSC (TAQA)Al Maqam Tower (Tower 3)Abu Dhabi Global Market Square, Al Maryah IslandP.O. Box 55224 Abu DhabiUnited Arab Emirates
TAQA.COM