Embed Size (px)
Citation preview

Finance andOperations Report®
2014
Powered by
Presented in Partnership With

2
Contents Section I List of Tables and Figures ................................................................................... 4
Tables ............................................................................................................................... 4 Figures .............................................................................................................................. 4 Statistical Icons ................................................................................................................. 5
Section II Comments on Survey and Report Methodology ................................................. 8 Section III Introduction to Club Benchmarking ................................................................. 11 Section IV Executive Summary ........................................................................................ 12 Section V The Available Cash Model ............................................................................... 14 Section VI Club and Financial Summary .......................................................................... 27
Club Summary ................................................................................................................ 27 Finance Summary ........................................................................................................... 29 Balance Sheet and Capital .............................................................................................. 31 Funding of Capital Investment ......................................................................................... 33 Uniform Income Statement.............................................................................................. 34 Capital Income ................................................................................................................ 41
Section VII Membership ................................................................................................... 42 Membership Statistics ..................................................................................................... 42 Membership Turnover Statistics ...................................................................................... 45 Age of Membership Statistics .......................................................................................... 46 Cost of Membership ........................................................................................................ 46 Initiation Fees .................................................................................................................. 47 Membership Dues and Recurring Fees ........................................................................... 48
Section VIII Food and Beverage ...................................................................................... 50 Overview ......................................................................................................................... 50 Impact of F&B on Club Finances ..................................................................................... 50 Market Basket ................................................................................................................. 55 Cost of Food and Beverage ............................................................................................ 56 Service Charge Rates ..................................................................................................... 58 Annual Minimum Spending Requirement ........................................................................ 58
Section IX General and Administrative ............................................................................ 61 Section X Facilities and Recreation ................................................................................. 64
Clubhouse and Buildings ................................................................................................ 64

3
Guest Rooms .................................................................................................................. 66 Recreation ....................................................................................................................... 67 Tennis ............................................................................................................................. 68 Aquatics .......................................................................................................................... 69 Fitness ............................................................................................................................ 71
Section XI Course Maintenance ...................................................................................... 73 Course Maintenance Budget Breakpoints ....................................................................... 73 Analyzing Course Maintenance Budget Drivers .............................................................. 74 Course Maintenance Labor Distribution .......................................................................... 76 Non-Labor Expense Distribution Breakdown ................................................................... 79 Course Characteristics .................................................................................................... 85
Section XII Golf Operations and Golf Shop ...................................................................... 88 Golf Shop Revenue and Gross Margin ............................................................................ 88 Golf Operations Revenue and the Available Cash Model................................................ 90 Golf Operations Labor ..................................................................................................... 90 Sundry Golf Operations Items ......................................................................................... 92 Golf Cars ......................................................................................................................... 93
Section XIV Appendix State Grouping in Regions ........................................................ 95

4
Section I List of Tables and Figures Tables Table 1 Available Cash Calculation ................................................................................. 16 Table 2 Uses of Available Cash ....................................................................................... 17 Table 3 Regional Analysis Key Available Cash (AC) Metrics ........................................ 24 Table 4 Club Industry Market Segmentation .................................................................... 30 Table 5 Distribution of Membership Age .......................................................................... 46 Table 6 Recurring Fees at Clubs With Golf by Revenue Market Segment ....................... 48 Table 7 Recurring Fees by Club Type ............................................................................. 49 Table 8 Market Basket Prices Median Across All Respondents .................................... 55 Table 9 Key F&B Cost of Goods Sold Ratios 2013 vs. 2014 ........................................ 57 Table 10 Key Annual F&B Minimum Spending Statistics ................................................. 60 Table 11 General and Administrative ............................................................................... 61 Table 12 Overview of Buildings and Maintenance ........................................................... 64 Table 13 Guest Room Penetration by Revenue Market Segment ................................... 66 Table 14 Clubs With Given Recreational Amenity by Revenue Market Segment ............ 67 Table 15 Clubs With Given Recreational Amenity by Club Type...................................... 67 Table 16 Key Tennis Metrics Grouped by Number of Courts ........................................... 68 Table 17 Key Aquatic Operation Metrics Grouped by Total Aquatic Expense .................. 69 Table 18 Key Fitness Operation Metrics Grouped by Total Fitness Expense .................. 71 Table 19 Golf Operations Season by Revenue Segment................................................. 73 Table 20 Course Maintenance Spending Analysis ........................................................... 74 Table 21 Distribution of Pro Shop Ownership .................................................................. 88 Table 22 Golf Shop Revenue and Gross Margin by Club Revenue Segment .................. 89 Table 23 Key Golf Operations Metrics ............................................................................. 90 Table 24 Sundry Golf Operations Items ........................................................................... 92 Figures Figure 1 Uses of Available Cash Clubs Under $6 Million With Golf .............................. 18 Figure 2 Uses of Available Cash Clubs Exceeding $6 Million With Golf........................ 19 Figure 3 Sources of Available Cash Clubs Under $6 Million With Golf ......................... 19 Figure 4 Sources of Available Cash Clubs Exceeding $6 Million With Golf................... 20 Figure 5 Uses of Available Cash Clubs Under $6 Million and No Golf .......................... 21 Figure 6 Uses of Available Cash Clubs Exceeding $6 Million and No Golf ................... 22 Figure 7 Sources of Available Cash Clubs Under $6 Million and No Golf ..................... 22 Figure 8 Sources of Available Cash Clubs Exceeding $6 Million and No Golf .............. 23 Figure 9 Available Cash and Net Available Cash ............................................................. 25 Figure 10 F&B Net as a Percentage of Available Cash.................................................... 26 Figure 11 Responding Clubs by Type .............................................................................. 27 Figure 12 Responding Clubs by Tax Status ..................................................................... 28 Figure 13 Club Operations Overseen By ......................................................................... 29 Figure 14 Cash and Cash Equivalents on Hand as a Percent of Operating Revenue ..... 32

5
Figure 15 Total Debt to Operating Revenue Ratio ........................................................... 33 Figure 16 Capital Improvement Fund Balance ................................................................. 34 Figure 17 Sources of Cash Clubs With Golf.................................................................. 35 Figure 18 Uses of Cash Clubs With Golf ...................................................................... 36 Figure 19 Sources of Cash City Clubs .......................................................................... 37 Figure 20 Uses of Cash City Clubs ............................................................................... 38 Figure 21 Sources of Cash Yacht Clubs ....................................................................... 39 Figure 22 Uses of Cash Yacht Clubs ............................................................................ 40 Figure 23 Year-Over-Year Change in Member Count ...................................................... 43 Figure 24 Distribution of Total Revenue Per Full Member Equivalent All Respondents 45 Figure 25 Percent Change in Initiation Fee at Clubs Responding in 2014 and 2013 ....... 48 Figure 26 Distribution of F&B Bottom Line as a Proportion of Available Cash All Respondents ...................................................................................................................... 51 Figure 27 Distribution of F&B Revenue and Net Income All Respondents .................... 52 Figure 28 Distribution of F&B as a Percentage of Total Club Operating Revenue All Respondents ...................................................................................................................... 54 Figure 29 F&B Cost of Goods Sold Distribution Across All Respondents ..................... 56 Figure 30 Distribution of F&B Labor to F&B Revenue - All Respondents ......................... 57 Figure 31 Distribution of F&B Minimum Spend Requirement Family Membership All Respondents ...................................................................................................................... 59 Figure 32 Distribution of F&B Unspent Minimum Income All Respondents ................... 60 Figure 33 Distribution of Maintained Acreage for 18-Hole Courses With Less Than $1.1 Million Maintenance Expense ............................................................................................. 75 Figure 34 Distribution of Maintained Acreage for 18-Hole Courses With Less Than $1.1 Million Maintenance Expense ............................................................................................. 76 Figure 35 Course Maintenance Summary Labor vs. Non-Labor ...................................... 78 Figure 36 Course Maintenance FTEs Per 18-Hole Course .............................................. 79 Figure 37 Average Distribution of Non-Labor CM Expenses West Region ................... 80 Figure 38 Average Distribution of Non-Labor CM Expenses Southwest Region ........... 81 Figure 39 Average Distribution of Non-Labor CM Expenses Midwest Region .............. 82 Figure 40 Average Distribution of Non-Labor CM Expenses Southeast Region ........... 83 Figure 41 Average Distribution of Non-Labor CM Expenses Northeast Region ............ 84 Figure 42 Square Feet of Greens Per 18 Holes ............................................................... 85 Figure 43 Acres of Fairway Per 18 Holes ........................................................................ 86 Figure 44 Number of Bunkers Per 18 Holes .................................................................... 87 Figure 45 Golf Operations Full Time Equivalents Employees .......................................... 91 Figure 46 Manner of Golf Car Purchase .......................................................................... 94 Statistical Icons SI 1 Distribution of Revenue of Responding Clubs .......................................................... 30 SI 2 Total Debt All Clubs (End Fiscal 2013) .................................................................. 31 SI 3 Cash and Cash Equivalents All Clubs ................................................................... 31 SI 4 Initiation Fee Income ................................................................................................ 41 SI 5 Investment Income ................................................................................................... 41

6
SI 6 Capital Dues and Assessment Income ..................................................................... 41 SI 7 Total Member Count ................................................................................................. 42 SI 8 Full Member Equivalents (FME) ............................................................................... 43 SI 9 Full Member Equivalents Clubs With Golf ............................................................. 44 SI 10 Full Member Equivalents Clubs Without Golf ...................................................... 44 SI 11 Unrestricted Membership Turnover Percentage ..................................................... 45 SI 12 Number of Relinquished Unrestricted Memberships ............................................... 46 SI 13 Number of New Unrestricted Membership Activations ............................................ 46 SI 14 Initiation Fees Clubs With Golf ............................................................................ 47 SI 15 Initiation Fees Clubs Without Golf ....................................................................... 47 SI 16 F&B Income/Loss - Less Than $3.5M Club Revenue ............................................. 53 SI 17 F&B Income/Loss - $3.5M - $6M Club Revenue .................................................... 53 SI 18 F&B Income/Loss - $6M-$9M Club Revenue ......................................................... 53 SI 19 F&B Income/Loss - Greater Than $9M Club Revenue ........................................... 53 SI 20 Member Dining All Clubs ..................................................................................... 58 SI 21 Member Parties All Clubs .................................................................................... 58 SI 22 Sponsored Parties All Clubs ................................................................................ 58 SI 23 Audit/Review Fees ................................................................................................. 61 SI 24 Legal and Professional Fees .................................................................................. 61 SI 25 Salary and Wages for G&A Employees .................................................................. 62 SI 26 Payroll Taxes and Benefits for G&A Employees ..................................................... 62 SI 27 Total Membership and Marketing Expenses ........................................................... 62 SI 28 Total Other G&A Expenses .................................................................................... 62 SI 29 Full Time Equivalent G&A Employees .................................................................... 62 SI 30 Total Club Healthcare Premium Expense ............................................................... 63 SI 31 Total Club Workmen's Comp Premium Expense .................................................... 63 SI 32 Total Club Information Technology (IT) Expense ................................................... 63 SI 33 In-House Cleaning/Maintenance Payroll Expenses ................................................ 64 SI 34 Energy and Utilities Expenses ................................................................................ 64 SI 35 All Other Building Operation and Maintenance Expenses ...................................... 65 SI 36 Locker Room Supplies and Operation Expenses ................................................... 65 SI 37 Main Clubhouse Age .............................................................................................. 65 SI 38 Main Clubhouse Size Square Feet ...................................................................... 65 SI 39 Square Footage of all Maintained Buildings ........................................................... 65 SI 40 Guest Room Revenue ............................................................................................ 66 SI 41 Guest Room Expense ............................................................................................ 66 SI 42 Number of Guest Rooms ........................................................................................ 67 SI 43 Weekend Guest Fee for Pool Use .......................................................................... 69 SI 44 Salary and Wages for Aquatics .............................................................................. 69 SI 45 Payroll Taxes and Benefits for Aquatics ................................................................. 70 SI 46 Full Time Equivalent Employees for Aquatics ......................................................... 70 SI 47 Pool Maintenance and Equipment Expenses ......................................................... 70 SI 48 Other Aquatic Expenses ......................................................................................... 70 SI 49 Salary and Wages for Fitness................................................................................. 72 SI 50 Payroll Taxes and Benefits for Fitness ................................................................... 72

7
SI 51 Fitness Maintenance and Equipment ..................................................................... 72 SI 52 Other Fitness Expenses ......................................................................................... 72 SI 53 Salary and Wages Less Than $800K Budget ...................................................... 76 SI 54 Payroll Taxes and Benefits Less Than $800K Budget ......................................... 77 SI 55 Salary and Wages $800K - $1.2M Budget ........................................................... 77 SI 56 Payroll Taxes and Benefits $800K - $1.2M Budget ............................................. 77 SI 57 Salary and Wages $1.2M - $1.7M Budget ........................................................... 77 SI 58 Payroll Taxes and Benefits $1.2M - $1.7M Budget .............................................. 77 SI 59 Salary and Wages More Than $1.7M Budget ...................................................... 78 SI 60 Payroll Taxes and Benefits More Than $1.7M Budget ......................................... 78 SI 61 Golf Shop Revenue $0M - $3.5M Club Revenue ................................................. 88 SI 62 Golf Shop Revenue $3.5M - $6M Club Revenue ................................................. 89 SI 63 Golf Shop Revenue $6M - $9M Club Revenue .................................................... 89 SI 64 Golf Shop Revenue More Than $9M Club Revenue ............................................ 89 SI 65 Number of PGA Professionals on Staff .................................................................. 90 SI 66 Salary and Wages for Golf Operations and Shop Staff All Respondents ................ 91 SI 67 Payroll Taxes and Benefits for Golf Operations and Shop Staff All Respondents 91 SI 68 Annual Locker Fees ............................................................................................... 92 SI 69 Annual Bag Storage Fees ...................................................................................... 92 SI 70 Annual Driving Range Fees .................................................................................... 93 SI 71 Annual Handicap Fees ........................................................................................... 93 SI 72 Number of Golf Cars............................................................................................... 93 SI 73 Total Golf Car/Trail Fee Revenue ........................................................................... 93 SI 74 Golf Car Maintenance and Operation Expense ...................................................... 93

8
Section II Comments on Survey and Report Methodology This report represents the results of the 2014 Club Finance and Operations Survey conducted in collaboration between Club Benchmarking and the Club Managers Association of America (CMAA). The questions comprising the Finance and Operations survey and the Club Benchmarking Finance and Operations benchmark were developed by Club Benchmarking and CMAA national staff. The data represents the results of fiscal year 2013 operations for clubs with fiscal year ends between July 31, 2013 and April 30, 2014. A total of 506 clubs participated in the 2014 survey. As in the past, every respondent did not reply to every question on the survey. Therefore, the findings in this report are based on the responses received for each individual question. Club Benchmarking and CMAA have exercised best efforts in preparation of the information contained herein for accuracy. However, Club Benchmarking and CMAA disclaim all implied warranties, including, without limitation, warranties of merchantability or fitness for a particular purpose. Club Benchmarking and CMAA shall have no liability for any direct, incidental, special or consequential damages or lost profits. The report relies heavily on the concept of percentiles and quartiles. Quartiles and percentiles are easy to understand and offer an excellent view into the statistical distribution of a set of data. Certain percentile points characterize quartiles namely the 25th percentile (lower quartile), 50th percentile (median) and 75th percentile (upper quartile). Twenty-five percent of all respondents fall in the lower quartile, 25 percent fall between the 25th percentile and the median, 25 percent fall between the median and the 75th percentile and 25 percent of all respondents fall in the upper quartile. The median bisects the distribution - half of the respondents lie below the median while half lie above it. A sample Statistical Icon is shown below using total member count. In this example, half of the responding clubs had a total member count below 634 and half had a member count above. Twenty-five percent of clubs had a member count below 441 while 75 percent had a member count above 441 and finally, 75 percent of clubs had a member count below 980 while 25 percent had a member count above 980. Another example of a graphic used to communicate results throughout the report, and throughout the Club Benchmarking platform, is shown below. The noted graphic is referred to as a scatter plot and it shows a curve connecting every single response for the given data point (also referred to as a metric). The 25th, 50th and 75th percentiles are also shown on
Median 25th Percentile 75th Percentile
441 980
634
Sample Statistical Icon - Total Member Count

9
the curve. In this example, the 25th percentile is $6,116, the 50th percentile (median) is $9,130 and the 75th percentile is $12,772. As you read the report and come across scatter plots such as that below, you should be focusing on the curve between the 25th and 75th percentiles between which 50 percent of all clubs fall. As can be seen in the example, as
those clubs that for whatever reason form the anomalies for the given metric.
scatter plot and exactly into which percentile their club falls. Subscribers can see this for every data point to which they have responded by logging into Club Benchmarking. If you need help in this regard, please see the contacts below. Both the data collection for the survey and the Club Benchmarking platform organize financial information in keeping with the Uniform System of Financial Reporting for Clubs (USFRC).

10
Copyright® 2014 by Club Managers Association of America. All rights reserved. Printed in the United States. No part of the publication may be reproduced or distributed in any form or by any means, or stored in a database or retrieval system, without the prior written permission of the Club Managers Association of America.
Club Benchmarking www.clubbenchmarking.com
New Castle, NH 03854 Detailed questions or comments regarding the survey or the report should be addressed to either Ray Cronin ([email protected]) or Russ Conde ([email protected]) at Club Benchmarking or to Sarah Bal at CMAA ([email protected]).

11
Section III Introduction to Club Benchmarking The Need The business model of clubs needs much greater visibility. Too many general managers are at the whim of board members who believe they know the answer when, in fact, they do not understand the business of clubs. The industry is facing great challenges as a result of economic and demographic pressures. There is a critical need for factual information that managers and boards
What Matters the drivers of true, sustainable success
far too much time is wasted in club boardrooms across the industry discussing issues that have no strategic implications for long term success or even impact on short term financial outcomes
Club Benchmarking and CMAA are working to deliver standardized, contextual, benchmark data that allows managers and boards situation. Without accurate, standardized data clubs often endure lengthy board and committee discussions where opinions are treated as fact and there is misalignment on the key success factors resulting in lack of alignment on strategy and direction. The time has come for managers and boards to embrace a fact-based view of the club industry in an effort to drive sustainable long-term success. Current Situation For decades, clubs have relied on familiar methods to support the need for comparative data; industry-level surveys resulting in static reports, multiple club-to-club surveys (which are typically redundant and lack standardization), or picking up the phone and calling fellow general managers and controllers. These methods are highly redundant and reactionary and are often driven by questions raised at the last board meeting. The data has a very short life span, lacks context and is not available or useful to the industry at large. The data does not live beyond its reactionary goal. Club Benchmarking Fills the Need The industry benefits immensely from centralized, standardized, online data sharing platform containing Finance and Operations, Compensation and Benefits and Policies and Procedures data. The platform is accessible to the entire industry, at any time, right from your desktop.
A single, national, standardized (apples-to-apples) database, with user-defined peer sets [Click to View Club Subscriber Map].
Eventual elimination of the endless stream of surveys and one-off questions. Supports all club types (golf, country, yacht, city, other clubs). A dynamic database, constantly growing with historical data always accessible. Web-based, 24/7 access from anywhere.

12
Section IV Executive Summary
only be compiled with participation from you and your industry peers. Data sharing has moved forward dramatically in standardized data-sharing platform now populated with data from clubs throughout the country.
ynamic benchmarking technology allows the data that has been input by survey participanonline 24/7. Club Benchmarking subscribers can use filters to instantly refine the comparison data for their particular region, revenue range, club type, member count, etc. and see their data in comparison to the user-defined background data. This report presents a wealth of data across all club functions presented in a meaningful
zero in more closely on their own particular situation. That is now possible given the collaboration between CMAA and Club Benchmarking. Care and effort have been taken throughout the analysis in this report to segment data in a way that makes it as relevant as possible for every reader. Attempts have been made to break new ground by presenting logical and detailed analysis based on the business results of the club. Every reader should find highly relevant benchmarks in the report, which can be further supplemented by accessing the Club Benchmarking online platform. Significant effort has been made in the data analysis to illuminate variations in results. There is more meaning in understanding what drives the variation in data than in focusing on any one data point. The precise comparison of your operation to the industry overall or to
static report. That capability is available via online access to Club Benchmarking. Conclusions are drawn in many places in others the statistical distribution of data is presented and the conclusions are left to the reader.
introduced in last yea cept of the dashboard is to present a short list of key financial and operating metrics which capture the key drivers of the club business model. The Table below summarizes these key parameters. Every manager should be able
overall. Another key benefit of embracing a standard dashboard is its effectiveness as a tool for educating Board members on what truly matters from a financial and operating perspective. Over time, universal adoption of this fact-based approach to board education will result in a more consistent and strategic standard for club governance across the industry.

13
Clubs With Golf
2014 Report (Percentile Breakpoints) 25th Median 75th Operating Revenue $4,402,016 $6,214,138 $8,804,059 Available Cash (AC) $2,520,694 $3,577,165 $5,346,862 AC to Operating Revenue Ratio 55% 60% 64% Net Available Cash (Operating Bottom Line)
(-$167,573) $60,742 $355,941
Capital Income $231,557 $558,520 $1,317,304 Available for Capital Investment and Debt Reduction
$134,385 $620,239 $1,245,025
Full Member Equivalents 334 456 655 Full Member Dues $5,100 $6,650 $8,730 Debt per Full Member Equivalent $742 $4,488 $9,056 Payroll to Operating Revenue Ratio 51% 54% 59% Food & Beverage Loss/Profit to AC Ratio -8% -3% 1% Full Member Turnover 4% 6% 10% Average Member Age 55 58 63
Clubs Without Golf
2014 Report (Percentile Breakpoints) 25th Median 75th Operating Revenue $2,588,000 $4,643,327 $9,334,465 Available Cash (AC) $1,075,348 $2,211,117 $4,683,342 AC to Operating Revenue Ratio 42% 49% 60% Net Available Cash (Operating Bottom Line)
(-$59,818) $69,769 $363,304
Capital Income $138,872 $393,000 $954,696 Available for Capital Investment and Debt Reduction
$182,337 $486,165 $1,433,091
Full Member Equivalents 375 663 1,384 Full Member Dues $2,202 $3,000 $4,376 Debt per Full Member Equivalent $0 $1,330 $3,985 Payroll to Operating Revenue Ratio 48% 53% 61% Food & Beverage Loss/Profit to AC Ratio -7% -1% 7% Full Member Turnover 3% 6% 10% Average Member Age 55 58 62

14
Section V The Available Cash Model Understanding and Managing Private Clubs Using the Available Cash
Part of the analysis presented in this report is based on the concept of the Available Cash Model. The Available Cash Model is a framework that allows for true strategic
such, the concept of the Available Cash Model is presented in this section as a primer to the following analysis. Please take time to understand this model and its implications for your operation. It is a pivotal new approach providing a consistent, proven business model in relation to peer groups and the industry at large.
model and successful enterprises truly understand the prevailing business model and work to refine their own adaptation of it. The club industry is no different. There is an overarching business model governing the club industry and every club in it the key word being every. , t from a business and operations standpoint, every club, regardless of its personality, is subject to the business model of the industry. The following question is a test of how well your club grasps the business model. How would you characterize board-level discussion of your Food and Beverage finances?
A. Regularly discussing cost of food, cost of beverage, level of revenue and costs and bottom line in the board room.
B. Club budget specifies an annual net income/deficit target for Food and Beverage
(F&B) and monitors progress against that target with minimal F&B financial discussion beyond that in the board room.
and
make a difference that can be a game-changer for club is likely acting strategically and the rest of this section will serve as further evidence to

15
Unveiling the Private Club Industry Business Model The Available Cash Model Anybody involved in the club business as a manager, club officer or board member is
slogan in search of a tangible financial framework that can change the way private clubs are managed. Throughout the section, only the operational business model is addressed capital or balance sheet issues are not examined. The operating business model excludes initiation fee income, capital dues and assessments and investment income all of which should be considered capital income and separated with great intent from operating monies. The key issue in illuminating the operational business model of clubs is Where does the money personality is, the sources and uses of cash are common amongst all clubs. Indeed, it is the common sources and uses of cash that frame both the business model and Club Bench as
clubs are in business to provide certain some clubs do it
with world class service, others with more pedestrian service. Club Benchmarking has applied the Uniform System of Financial Reporting for Clubs (USFRC) and common sense to develop a logical grouping of functions related to delivering amenities common to every club ultimately shaping the common business model.
business model is membership dues revenue. Membership dues revenue is unencumbered cash there is no cost associated with it. On the other hand, Food and Beverage (F&B) revenue is heavily encumbered by the costs associated with delivering F&B goods and service. The stark distinction between membership dues revenue and F&B revenue serves as a key point in the illumination of the Available Cash Model. In a club, not all revenue is
financial health or the monies required to run the club. The Available Cash Model starts with identifying the sources of operating cash. Club Benchmarking has defined a simple, but standardized, calculation to derive Available Cash. Table 1 shows the calculation for clubs with and without golf.

16
Table 1 Available Cash Calculation
Clubs Without Golf Clubs With Golf Available Cash Equals
Membership Dues Revenue F&B Net = (F&B Revenue F&B
Expenses) Rooms Net = (Rooms Revenue
Rooms Expenses) Other Net = (All Other Operating
Revenue All Other Operating Expenses)
Sports Revenue = (Racquet Revenue + Fitness Revenue + Aquatics Revenue)
Yachting Net (Yachting Revenue Yachting Expenses in Yacht Clubs)
Available Cash Equals Membership Dues Revenue
F&B Net = (F&B Revenue F&B Expenses)
Rooms Net = (Rooms Revenue Rooms Expenses)
Other Net = (All Other Operating Revenue All Other Operating Expenses)
Sports Revenue = (Racquet Revenue + Fitness Revenue + Aquatics Revenue)
Golf Operations Net = (Golf Operations Revenue Golf Operations Expenses Golf Operations Labor)
The fundamental concept is to isolate the cash available to run the club. The cash emanates mainly from membership dues revenue, which is increased or decreased by the bottom-line operational results flowing from each of the main revenue-producing departments in the club. The main revenue-producing departments for which net results are calculated include: Food and Beverage, Overnight Rooms (for clubs with rooms), Golf Operations (for clubs with golf), Yachting (for clubs with yachting) and Other (Other Operating Revenue less Other Operating Expenses). Non-Golf Sports Revenue is considered unencumbered available cash as the expense of maintaining those facilities is considered fixed regardless of usage. Therefore, revenue generated via those facilities is viewed as unencumbered. A few statistics from the Club Benchmarking database will move the analysis from theory to practice. The median for operating revenue across the clubs in the Club Benchmarking database (at the time of writing this section) is $5,670,678 (excluding initiation fee, capital income and investment income), while the median Available Cash is $3,367,536 or 60 percent of the revenue. F&B provides 30 percent of revenue at the average club accounting for most of the difference between revenue and Available Cash.
not considered in the net calculations for each of the revenue producing departments.
standardized uses of cash.

17
Table 2 Uses of Available Cash
Clubs Without Golf Clubs With Golf
General and Administrative Buildings and Maintenance Sports (Racquets, Aquatics, Fitness, Spa) Fixed Expenses (Real Estate Taxes, Property and Liability Insurance, Interest Expense)
General and Administrative Buildings and Maintenance Non-Golf Sports (Racquets, Aquatics, Fitness, Spa) Fixed Expenses (Real Estate Taxes, Property and Liability Insurance, Interest Expense) Course Maintenance Golf Operations Labor (other Golf Ops expenses are netted in Available Cash calculation)
The Common Business Model The business model that unites all clubs is the Available Cash Model. Clubs derive and consume Available Cash in similar proportions mostly independent of geographic location, type, quality or size of club. The proportional sources and uses of cash are identical. All clubs derive the majority of cash necessary to run the club from dues - the average club in the Club Benchmarking database derives 76 percent of its Available Cash from dues revenue. The great variation that exists from club to club due to banquet revenue, class of
business model by adding or subtracting the net income or deficit from F&B from the Available Cash bucket. Every club has a G&A function, buildings maintenance and operation expenses, fixed expenses (in the form of insurance, real estate taxes and possibly interest expenses) and 97 percent of all clubs in the Club Benchmarking database have some form of non-golf sports. These are the few, standardized uses of Available Cash at all clubs.
statistical distribution of proportional sources and uses of cash, and the ratio of Available Cash to the total operating revenue of the club. The best way to describe this is to use real data. As a starting point, please refer to Figures 1 4. Figure 1 and Figure 2 show the proportionate uses of Available Cash for clubs with golf and less than $6 million in total revenue (Figure 1) and more than $6 million in revenue (Figure 2). A couple of variations worth noting are the percentage of Available Cash used for course maintenance and non-golf sports. The smaller revenue clubs use a slightly higher portion of their Available Cash to maintain the course and expend a slightly lower portion on supporting non-golf sports. As you can see, the remaining uses of cash are almost identical.

18
Figures 3 and 4 show the same distributions for the sources of Available Cash and they also are almost identical. Figure 1 Uses of Available Cash Clubs Under $6 Million With Golf

19
Figure 2 Uses of Available Cash Clubs Exceeding $6 Million With Golf
Figure 3 Sources of Available Cash Clubs Under $6 Million With Golf

20
Figure 4 Sources of Available Cash Clubs Exceeding $6 Million With Golf

21
Figures 5-8 show the same information for clubs without golf. The proportionate uses do not vary substantially and the sources vary in that the larger clubs without golf tend to have more rooms and a profit from their rooms operation that contributes to Available Cash. Figure 5 Uses of Available Cash Clubs Under $6 Million and No Golf

22
Figure 6 Uses of Available Cash Clubs Exceeding $6 Million and No Golf
Figure 7 Sources of Available Cash Clubs Under $6 Million and No Golf

23
Figure 8 Sources of Available Cash Clubs Exceeding $6 Million and No Golf
Understanding the business model of the industry at large is the first step in gaining
scale, but they all have the same simple business model properly viewed with Club the Available
Cash Report to easily identify disproportionate uses and sources of cash pointing to
tment-level metrics can be used to diagnose the root cause (e.g. G&A headcount is too high, Member dues revenue is too low, etc.). This process allows for diagnosis at the business model-level and correction at the department level where actions can be concrete, rapid and measurable. The Common Business Model and Geography Conventional wisdom may lead one to believe that the business model for clubs varies based on where a club is located. The factual data points to the exact opposite conclusion clearly showing the common business model is independent of geography. This conclusion can have significant,
model to many clubs nationally. Table 3 summarizes certain data from the Club Benchmarking database regarding key attributes of the Available Cash Model. As can be seen, there is only marginal variation

24
from region to region and it is logical to conclude the data supports the thesis of a common club business model which is represented well by the Available Cash Model. Table 3 Regional Analysis Key Available Cash (AC) Metrics
National North East
South East
Midwest South West
West
AC as % of Operating Revenue
60% 60% 60% 56% 60% 62%
Net AC as % of AC -2% 3% - 2% -5% -3% -4% Net F&B Income as % of AC
-3% 0% -5% 0% -4% -5%
Course Maintenance as % of AC
31% 32% 32% 30% 30% 36%
Golf Operations as % of AC
10% 9% 10% 10% 11% 10%
G&A as % of AC 23% 23% 24% 26% 25% 22% Non-Golf Sports as % of AC
9% 7% 11% 6% 10% 7%
Buildings and Maintenance as % of AC
16% 14% 14% 15% 14% 15%
Fixed Expense as % of AC 10% 12% 9% 12% 10% 9% Interest Expense as % of AC
3% 4% 3% 5% 3% 2%
The Bottom Line In addition to understanding sources and uses of Available Cash, it is necessary that your club can quantify the amount of both its Available Cash and its Net Available Cash. Net Available Cash is the difference between your Available Cash and the total Uses of Cash for operations. The total Uses of Cash = G&A + Non-Golf Sports + Fixed Expenses + Buildings Maintenance and Operation + Golf Course Maintenance + Golf Operations Labor (in clubs with Golf).
le Cash report, shows the distribution of at
the time of this whitepaper. As you can see, the median club has a Net Cash result of $57,691 a small operating surplus. One quarter of the clubs had a significant operating cash burn of more than -$190,682 (the 25th percentile) while one quarter of the clubs generated more than $331,550 (the 75th percentile).
Available Cash and Net Available Cash. Clearly, this club has a serious problem with their Net Available Cash as indicated by the -$525,987 was essentially masking the operational problem that was uncovered in minutes using Club

25
$50,000 in F&B and the board was worked into fervor over the loss. Unfortunately, they were focused on the wrong issue. Figure 9 Available Cash and Net Available Cash
Figure 10 shows the distribution of the ratio of F&B Net to Available Cash for the clubs in
B bottom line across the industry is a
More than 70 percent of clubs have an F&B bottom line that contributes less than +/- Cash. Board meeting dialogue concerning F&B is not in balance with this fact.

26
Figure 10 F&B Net as a Percentage of Available Cash
Shifting the Dialogue
down your Available Cash Sources, Uses and Net Available Cash and benchmarking each of them to the industry at large. This task is straightforward and immediate if you employ financial analysis software, like what is available through Club Benchmarking. If you chose Answer A to the question at the beginning of this section, it is strongly suggested you do an Available Cash Analysis, most simply by using Club Benchmarking
a negative position or you find an imbalance in the proportionate uses of your Available Cash, you will have done your club and its members a great service. You will have decisions to make regarding increasing your Available Cash or allocating it in a different manner, but you will have immediately shifted the dialogue from a tactical F&B centric discussion to the a strategic discussion concerning the Sources and Uses of Available Cash. Your club will be on the right track.

27
Section VI Club and Financial Summary Club Summary The types of clubs participating in the survey included country, golf, tennis, yacht, city and others. Figure 11 Responding Clubs by Type
Nineteen percent of the clubs responding are within a gated residential community. Ninety-six percent of the clubs indicated they were private while four percent indicated they were semi-private. The distribution of clubs in regard to tax status and who oversees the club operations is detailed below.
Golf17%
Country62%
City6%
Yacht9%
Other6%

28
Figure 12 Responding Clubs by Tax Status
TaxableMember-‐Owned
17%
Tax ExemptMember-‐Owned
74%
For Profit9%

29
Figure 13 Club Operations Overseen By
Finance Summary Statistical Icons (Icon) graphically illustrate the statistical distribution of the responses to the survey. The 2014 CMAA Finance and Operations Report utilizes these statistical icons to illustrate the results of the survey. Supplemental explanations are included as needed throughout the report. Each of the icons illustrates the statistical data points (quartiles) for each metric. Icon 1 below shows the variation of Operating Revenue. Please note throughout this report, the term revenue refers to Operating Revenue. It does not include any capital income such as initiation fees, capital dues/assessments or investment income.
Members89%
Mgt. Company6%
Developers1%
Person/Group4%
30
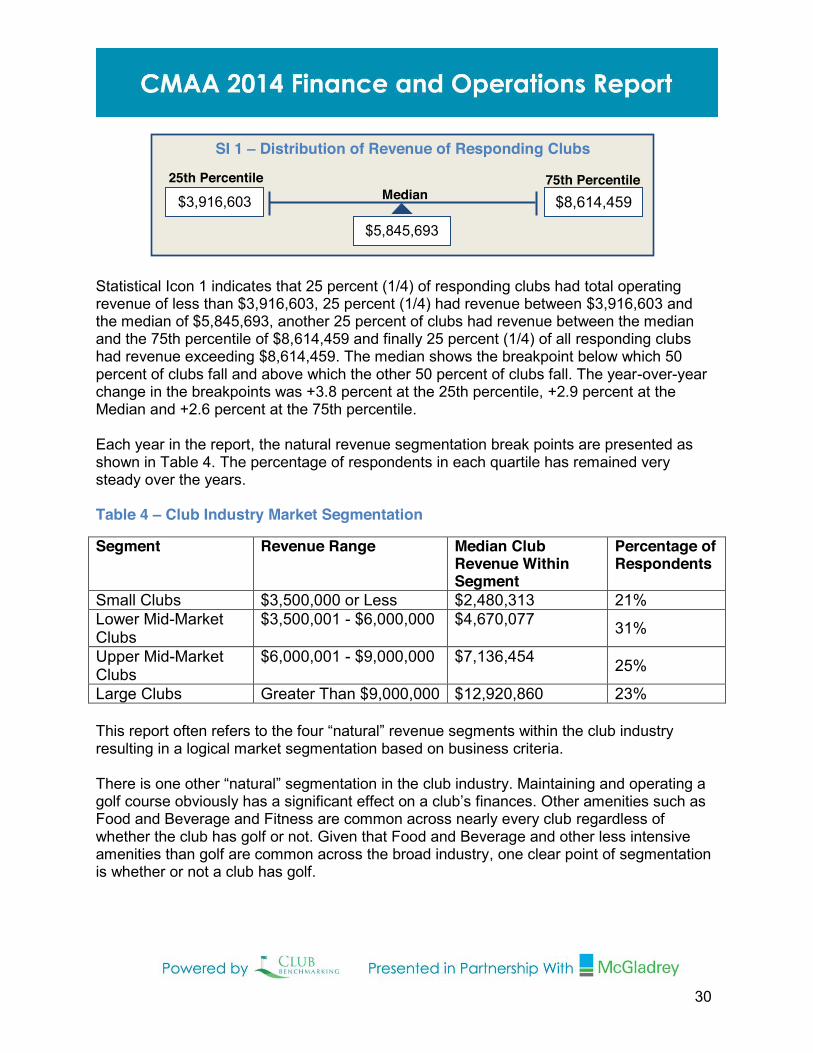
Statistical Icon 1 indicates that 25 percent (1/4) of responding clubs had total operating revenue of less than $3,916,603, 25 percent (1/4) had revenue between $3,916,603 and the median of $5,845,693, another 25 percent of clubs had revenue between the median and the 75th percentile of $8,614,459 and finally 25 percent (1/4) of all responding clubs had revenue exceeding $8,614,459. The median shows the breakpoint below which 50 percent of clubs fall and above which the other 50 percent of clubs fall. The year-over-year change in the breakpoints was +3.8 percent at the 25th percentile, +2.9 percent at the Median and +2.6 percent at the 75th percentile. Each year in the report, the natural revenue segmentation break points are presented as shown in Table 4. The percentage of respondents in each quartile has remained very steady over the years. Table 4 Club Industry Market Segmentation
Segment Revenue Range Median Club Revenue Within Segment
Percentage of Respondents
Small Clubs $3,500,000 or Less $2,480,313 21% Lower Mid-Market Clubs
$3,500,001 - $6,000,000 $4,670,077 31%
Upper Mid-Market Clubs
$6,000,001 - $9,000,000 $7,136,454 25%
Large Clubs Greater Than $9,000,000 $12,920,860 23%
resulting in a logical market segmentation based on business criteria.
Food and Beverage and Fitness are common across nearly every club regardless of whether the club has golf or not. Given that Food and Beverage and other less intensive amenities than golf are common across the broad industry, one clear point of segmentation is whether or not a club has golf.
Median 75th Percentile
$3,916,603 $8,614,459
$5,845,693
SI 1 Distribution of Revenue of Responding Clubs
25th Percentile

31
s of data led to the development of The Available Cash Model for Clubs. The Available Cash Model is described in Section V of this report. The model shows clearly a common business model in the club industry clubs are not different. In fact, the operating and financial profiles of clubs are very consistent. The center of consistency is the proportionate sources and uses of cash. The data shows conclusively that proportionate sources and uses of cash do not vary based on the size or geographic location of a club. This is a critical finding resulting from having a centralized data-sharing platform for the industry. Segmentation regarding whether a club maintains and operates a golf club is logical and is also shown by the data to overlay with The Available Cash Model. Essentially, the model has been developed for the two most basic market segments clubs with golf and clubs without golf. In an attempt to draw out pertinent information for each reader while also discerning meaningful differences between segments, this report will carry forward investigation and presentation of statistics and the business model based on revenue segmentation and the segmentation as to whether a club does or does not have golf. You will want to pay particular attention to the a Balance Sheet and Capital In this section, analysis of selected, critical balance sheet metrics are presented.
Icon 2 depicts the distribution of total debt across the club industry and Icon 3 shows the distribution of cash and cash equivalents with 25 percent of responding clubs having less than $271,284 cash on hand at the end of 2013.
Referring to Icons 2 and 3 above, the reader should consider where their own club lies.
Median 25th Percentile 75th Percentile $291,186 $4,469,721
$1,924,032
SI 2 Total Debt All Clubs (End Fiscal 2013)
Median 25th Percentile 75th Percentile
$271,284 $1,941,417
$780,035
SI 3 Cash and Cash Equivalents All Clubs

32
Figures 14 and 15 below show the distribution of Cash as a Percentage of Operating Revenue and the ratio of Total Debt to Operating Revenue. Figure 14 Cash and Cash Equivalents on Hand as a Percent of Operating Revenue

33
Figure 15 Total Debt to Operating Revenue Ratio
Funding of Capital Investment Sixty-three percent of responding clubs report having a capital improvement fund. There is no meaningful variation across market segments based on revenue segment or club type in relation to this statistic. Figure 16 shows the distribution of the amount of money in the capital improvement fund for those clubs indicating having such a fund. As can be seen, one quarter of the clubs with a fund have no money in the fund.

34
Figure 16 Capital Improvement Fund Balance
There is a near equal split between clubs purchasing capital equipment outright and those that blend purchasing and leasing of capital equipment. The split remains consistent with no significant variation based on market segment or club type.
Purchase (40 percent) Lease (6 percent) Both (54 percent)
Uniform Income Statement The Uniform Income Statement (UIS) section in Club Benchmarking drives all clubs to a common income statement based on the Uniform System of Financial Reporting for Clubs (USFRC). The UIS, as well as all other metrics in the database, are designed to drive a
Coupled with this common framework is the Available Cash Model. The Available Cash Model delivers a compelling view of the sources and uses of the cash available to operate a club. As was detailed in the previous section presenting the Available Cash Model, care must be taken to understand the difference between revenue and Available Cash (which can also be considered Gross Profit). In a club, there is a great disparity in the margin

35
associated with various revenues. Dues revenue comes with 100 percent gross margin no Cost of Goods Sold (COGS), while F&B revenue comes with no gross margin at the average club (the COGS including labor is greater than the revenue). As a result, picturing a
ust be completely aware of the gross profit or contribution generated from the revenue. It is the contribution that is the source of the funds to operate the club. That premise is the heart of the Available Cash Model and the Proportionate Sources and Uses of Cash. Each of the following Figures presents a pie chart that has been produced automatically by the Club Benchmarking platform. The pie chart shows the proportionate sources and uses of cash for clubs with golf, city clubs and yacht clubs. Each of the pie charts shows a blank for My Club a pie chart for a given club would exist in that slot if the report were generated by a CB subscriber. That club could then compare instantly its own proportionate sources and uses of Available Cash in relation to the industry norm. Clarity as to the meaning of each of the below charts is derived by understanding Section V of this report. Figure 17 Sources of Cash Clubs With Golf

36
Figure 18 Uses of Cash Clubs With Golf

37
Figure 19 Sources of Cash City Clubs

38
Figure 20 Uses of Cash City Clubs

39
Figure 21 Sources of Cash Yacht Clubs

40
Figure 22 Uses of Cash Yacht Clubs
There are a few clear takeaways from the charts above: Dues drive the Available Cash regardless of club type. Dues are 78 percent of Available Cash in clubs with golf, 84 percent in yacht clubs and 66 percent in city clubs. The sources and uses of cash are common across the three club types with the exception of the functions related to golf in clubs with golf. Understanding the proportionate sources and uses of Available Cash is the common,
budgeting.

41
Capital Income Statistical Icons 4-6 show the distribution of Capital Income across all respondents.
Median 25th Percentile 75th Percentile
$62,259 $623,285
$225,000
SI 4 Initiation Fee Income
Median 25th Percentile 75th Percentile
$253 $13,048
$2,081
SI 5 Investment Income
Median 25th Percentile 75th Percentile
$133,632 $722,500
$342,976
SI 6 Capital Dues and Assessment Income

42
Section VII Membership This Membership section covers membership statistics and cost of membership. The section on Membership Statistics covers the number of members in clubs and the membership within the various categories. The section on Cost of Membership covers the various charges for joining and being a member at the responding clubs. Membership Statistics Icon 7 shows the distribution of total member count for all responding clubs. The median total member count for all clubs responding to the 2014 survey is 614. The median from the 2013 survey was 642 members. In the 2014 survey, the 25th percentile was 450 and the 75th percentile was 965. In the 2013 survey report, the 25th and 75th percentiles were 481 and 1,006 respectively. All quartile breakpoints showed a decrease from the 2013 survey. The change is not necessarily reflective of a decreasing member count in clubs; it can be as
Digging a little deeper on year-over-year change in member counts, Figure 23 below shows the year-over-year change for clubs that responded to both the 2014 and the 2013 surveys. The data is indicative of great variation across the industry. Half of the clubs experienced growth in membership. In 25 percent of clubs there was significant growth in membership. Unfortunately, on the other side of the coin, 40 percent of clubs saw a decrease in member count and 25 percent of clubs saw a decrease of 1.7 percent or more in member count. The data confirms the view that a segment of the industry remains under stress.
Median 25th Percentile 75th Percentile
450 965
614
SI 7 Total Member Count

43
Figure 23 Year-Over-Year Change in Member Count
In an effort to drive , Club Benchmarking uses Full Member Equivalents (FME). FME is derived by taking the
category as defined in the CMAA and Club Benchmarking survey (FME = Total Dues Revenue/Full Member Annual Dues). Statistical Icon 8 below shows the distribution for FME. The quartile breakpoints for the 2013 survey were 330, 477 and 742 respectively. Again, the change can be the result of different clubs responding.
Median 25th Percentile 75th Percentile
344 712
477
SI 8 Full Member Equivalents (FME)

44
Icons 9 and 10 show the distribution of total member count for clubs with golf and clubs that do not have golf.
Given the clear correlation between membership count and total revenue, Figure 24 shows the distribution of revenue per Full Member Equivalent (FME) across all market segments. To be clear, operating revenue does not include any capital income meaning no initiation fee income, capital dues/assessment income or investment income. The breakpoints in 2013 were $9,412 (25th Percentile), $13,256 (Median) and $16,760 (75th Percentile).
Median 25th Percentile 75th Percentile
335 655
456
SI 9 Full Member Equivalents Clubs With Golf
Median 25th Percentile 75th Percentile
333 1,028
594
SI 10 Full Member Equivalents Clubs Without Golf

45
Figure 24 Distribution of Total Revenue Per Full Member Equivalent All Respondents
Membership Turnover Statistics Icons 11 13 show the key statistics for membership turnover. The data collected is focused
11, the club at the median experienced six percent turnover in the Full Member category. The turnover measurement is based on member exits (Turnover = Full Member Exits/Total Full Members). The breakpoints for Membership Turnover in the 2013 report were 2, 5 and 8 percent respectively. Icons 12 and 13 show the distribution of the quantity of relinquished memberships and new activations in this category.
Median 25th Percentile 75th Percentile
3 10
6
SI 11 Unrestricted Membership Turnover Percentage

46
Age of Membership Statistics The average age of membership does not vary based on club type or club revenue market segment. The median for average member age at all responding clubs is 58 years. Table 5 shows the distribution of age demographics for all responding clubs. The table depicts the percentage of the membership comprised of the given age grouping. These numbers show the variation in percentages across all respondents by age group. Table 5 Distribution of Membership Age
Age Group 25 Percent of Clubs (Have less than in this group)
50 Percent of Clubs (Have between & ____ in this group)
25 Percent of Clubs (Have more than in this group)
22 30 Years 1% 1% and 5% 5% 31 45 Years 10% 10% and 21% 21% 46 60 Years 27% 27% and 39% 39% 61 80 Years 27% 27% and 43% 43% More Than 80 Years 4% 4% and 12% 12%
Cost of Membership This section will undertake analysis of the cost of membership by looking at initiation fees
requests the fees for a family composed of a primary member (age represents typical age of a primary member), a spouse and three children ages 9, 12 and 16. The items for which the fees were requested included initiation fees, annual dues, annualized minimum spending requirement, capital dues and special capital assessment and any house charge (level service fee) if one is levied.
Median 25th Percentile 75th Percentile
13 38
22
SI 12 Number of Relinquished Unrestricted Memberships
Median 25th Percentile 75th Percentile
15 42
25
SI 13 Number of New Unrestricted Membership Activations

47
Initiation Fees Icons 14 and 15 show the distribution of initiation fees for Clubs With and Without Golf respectively.
The year-over-year change in Initiation Fees shows a decline at all breakpoints. The change is most likely a result of the mix of responding clubs as opposed to a dramatic
survey Figure 25 below shows most held their initiation fee steady with about 5 percent dropping the fee and about 5 percent increasing it.
Median 25th Percentile 75th Percentile
$5,000 $45,000
$16,000
SI 14 Initiation Fees Clubs With Golf
Median 25th Percentile 75th Percentile
$2,000 $14,500
$6,000
SI 15 Initiation Fees Clubs Without Golf

48
Figure 25 Percent Change in Initiation Fee at Clubs Responding in 2014 and 2013
Membership Dues and Recurring Fees The data presented below is the median for each of the recurring annual fee items. Table 6 shows the median fees for clubs with golf by revenue market segment. Table 7 shows the median fees for city/athletic clubs and yacht clubs. Table 6 Recurring Fees at Clubs With Golf by Revenue Market Segment
Fee Median by Market Segment
Small (0-$3.5M)
Lower-Mid ($3.5-$6.0M)
Upper-Mid ($6.0-$9.0M)
Large (Greater Than $9.0M)
Annual Dues $4,740 $6,120 $7,104 $7,440 Annual Minimum F&B Spend $600 $750 $800 $600
Capital Dues $360 $420 $558 $420

49
Table 7 Recurring Fees by Club Type
Fee Median by Club Type City Clubs Yacht Clubs
Annual Dues $3,000 $2,595 Annual Minimum F&B Spend $0 $450

50
Section VIII Food and Beverage Overview The Food and Beverage (F&B) portion of the Club Benchmarking database is composed of three sections: Financial metrics, Operational metrics and a Market Basket. The financial section covers the financial results of F&B; revenue from á la carte and banquet operations with expenses including payroll (salaries and wages and payroll taxes and benefits), uniforms laundry and linens, equipment maintenance and repair, entertainment and other F&B expenses. The Operational section includes metrics covering cover counts, number of banquets, service charges and Full Time Equivalent (FTE) employees. Finally, the market basket section covers the pricing for an array of six common beverage items and five common food items. Impact of F&B on Club Finances As documented in Section V of this report on the Available Cash Model, the most critical
old question as to whether F&B is an amenity or a profit center. The data shows conclusively that F&B is an amenity, not a profit center. An extremely detailed analysis of the impact of F&B can be found in the CMAA Finance and Operations Report published in 2012. In far too many clubs, the board perceives governance as centering on asking the question
industry regardless of size or level of quality. The Available Cash Model delivers context for the financial implications of F&B by measuring the bottom line in F&B (be it deficit or surplus) as a proportion of the Available Cash a club has to operate. Figure 26 shows the distribution of F&B Income as a Percentage of Available Cash across the industry. As can be seen from the chart, in 80 percent of the clubs in the industry F&B less than 10 percent of the cash a club has to operate with the clear bias towards subsidizing an F&B deficit. The club at the median uses three percent of the cash it has to operate to subsidize its F&B deficit. Fifty percent of the clubs in the industry range between using eight percent of the
mere one operating cash as a result of an F&B surplus. Too often, club boards focus on the F&B operation as though it has a significant effect on a
. The data in Figure 26 proves conclusively that for 80 percent of the clubs in the industry, F&B has a minimal Misplaced focus on F&B obfuscates the real financial issues in a club, be they dues revenue or the use of cash on various other functional areas such as G&A, Buildings Maintenance & Operation, Course Maintenance, etc. Club managers must, armed with proper facts, wrestle control of this issue in the boardroom and lead the board to focus on the financial issues of strategic

51
significance. For the vast majority of clubs, the financial results of F&B are NOT a strategic issue. The qualitative aspect of the F&B operation atmosphere of the club and its ability to help attract and retain members is a strategic issue. The Available Cash Model has been proven to be a fact-based framework that can serve as a catalyst for shifting the financial dialogue away from F&B to where it matters. The most effective approach to shifting the dialogue is to understand the Available Cash Model and Figure 26. The financial and operating metrics presented in the remainder of this section should all be viewed with the strategic perspective of understanding F&B as an amenity as opposed to a profit center. Figure 26 Distribution of F&B Bottom Line as a Proportion of Available Cash All Respondents
Figure 27 shows the distribution of absolute results of F&B operations in terms of revenue and net income for all respondents. One line shows the distribution of total F&B revenue while the other line shows the distribution of F&B income or loss. Each of the lines shows

52
the 25th and 75th percentiles and the median (the chart extends from the 5th to the 95th percentile). The figure shows $1,814,236 as the median for F&B revenue and a deficit of $98,984 in F&B operations. Half of the respondents had F&B revenue above the median and half had revenue below, while half had deficits greater than the median of $98,984 and half had a smaller deficit than $98,984 ranging to a surplus. The median revenue in F&B grew from $1,805,252 in the 2013 report while the median deficit shifted from a loss of $83,319 to a loss of $98,984 Figure 27 Distribution of F&B Revenue and Net Income All Respondents

53
While the proper understanding of F&B from a financial perspective requires placing the 16 through 19 are
presented as a resource to the reader. The presentation of the absolute bottom line results in F&B very obviously support the premise that larger clubs, with more dues revenue, are more able to absorb greater subsidies of F&B.
Median 25th Percentile
-$88,184 $46,884
-$34,322
SI 16 F&B Income/Loss - Less Than $3.5M Club Revenue
75th Percentile
Median 25th Percentile 75th Percentile
$168,160 $33,218
-$54,462
SI 17 F&B Income/Loss - $3.5M - $6M Club Revenue
Median 25th Percentile 75th Percentile
-$346,473 $34,108
-$162,979
SI 18 F&B Income/Loss - $6M-$9M Club Revenue
Median 25th Percentile 75th Percentile
-$768,665 -$64,636
-$358,043
SI 19 F&B Income/Loss - Greater Than $9M Club Revenue

54
Figure 28 presents F&B revenue as a percentage of Total Club Operating Revenue. The club at the median derives 32 percent of its operating revenue from F&B. The quartiles in the 2013 report were 25 percent, 32 percent and 37 percent respectively. The similarity shows how consistent the business and operating model of clubs is from year to year. Figure 28 Distribution of F&B as a Percentage of Total Club Operating Revenue All Respondents

55
Market Basket The Market Basket survey queried prices for a fairly common basket of F&B items as listed in Table 8 below. Table 8 Market Basket Prices Median Across All Respondents
Market Basket Item Median Price (2014 Report) Median Price (2013 Report) Domestic Bottled Beer $3.50 $3.50 Imported Bottled Beer $4.50 $4.50 House Red Wine - Glass $6.00 $6.00 House White Wine - Glass $6.00 $6.00 Grey Goose Cosmopolitan $9.00 $8.60 Johnny Walker Black $8.50 $8.25 Cheeseburger $10.00 $9.95 Grilled Chicken Sandwich $9.75 $9.00 Salmon Entree $22.00 $22.00 Filet Mignon $29.95 $29.00 Slice of Cheesecake $6.00 $6.00

56
Cost of Food and Beverage Figure 29 shows the distribution of F&B Cost of Goods Sold (COGS) for all respondents. Figure 29 F&B Cost of Goods Sold Distribution Across All Respondents
The calculation of food cost is the cost of food for food revenue derived from á la carte member dining and from all banquets divided by total food revenue. The food costs are exclusive of costs associated with employee meals and the revenue is exclusive of any minimum spending income or any other non-food revenue. The calculation of beverage cost is the cost of beverage for beverage revenue derived from á la carte member dining and from all banquets divided by total beverage revenue. The cost of beverage calculation is exclusive of any bulk wine sales by the case. The operating metric that most closely correlates to the bottom line in F&B is the F&B Labor to F&B Revenue Ratio. The distribution for this measure across the industry is presented in Figure 30. The median for the industry is a ratio of 64 percent. Clubs that are in the upper
mission of providing ample, high-quality service. It is also this group of clubs that tend to run more significant F&B deficits. On the other hand, the clubs that are in the lower quartile tend
-even or better.
by the lower Labor to Revenue ratio.

57
Figure 30 Distribution of F&B Labor to F&B Revenue - All Respondents
Table 9 Key F&B Cost of Goods Sold Ratios 2013 vs. 2014
Cost of Food (Quartile Breakpoints)
Cost of Beverage (Quartile Breakpoints)
Labor to Revenue Ratio (Quartile Breakpoints)
2013 Report 38%, 41%, 45% 29%, 32%, 37% 55%, 61%, 68% Current Year 2014 Report 38%, 42%, 46% 29%, 33%, 37% 57%, 64%, 71%
Table 9 (above) presents the year-over-year comparisons of Cost of Food, Cost of Beverage and F&B Labor to Revenue Ratio.

58
Service Charge Rates Icons 20-22 present the distribution of service charges across the entire industry.
Annual Minimum Spending Requirement Figure 31 presents the distribution for F&B minimum spend requirement (for the family membership scenario) while Figure 32 presents the distribution of unused F&B minimum spend income.
Median 25th Percentile 75th Percentile
18% 20%
18%
SI 20 Member Dining All Clubs
Median 25th Percentile 75th Percentile
18% 20%
20%
SI 21 Member Parties All Clubs
Median 25th Percentile 75th Percentile
20% 20%
20%
SI 22 Sponsored Parties All Clubs

59
Figure 31 Distribution of F&B Minimum Spend Requirement Family Membership All Respondents

60
Figure 32 Distribution of F&B Unspent Minimum Income All Respondents
Table 10 Key Annual F&B Minimum Spending Statistics
Minimum Spend Covers Minimum Spending Billing Period
Food Only 42% Both Food and Beverage 58%
NA 24% Monthly 18% Quarterly 32% Semi-Annually 6% Annually 20%

61
Section IX General and Administrative This section covers various financial aspects of the General and Administrative (G&A) function including employee counts and total club salary and wages. Table 11 below summarizes employee counts and club labor expenses by revenue market segment. Table 11 General and Administrative
Segment
Median of Respondents
Total G&A Expenses
Peak Employee Count
Total Full Time Equivalents at Club
Total Club Salary, Wages, Payroll Taxes and Benefits (2013)
Total Club Salary, Wages, Payroll Taxes and Benefits (2012)
% Change in Payroll Growth Year-over-Year
Small $359,577 66 35 $1,393,031 $1,350,068 3.2% Lower Mid-Market $661,031 110 53 $2,596,978 $2,506,643 3.6% Upper Mid-Market $912,240 130 82 $3,840,030 $3,926,717 -2.2% Large $1,694,297 234 149 $7,335,096 $6,888,000 6.5% The components of General and Administrative costs are captured with the quartile distribution listed below. Icons 23-29 show the variation of G&A costs across all revenue segments.
Median 25th Percentile 75th Percentile
$11,930 $29,873
$19,750
SI 23 Audit/Review Fees
Median 25th Percentile 75th Percentile
$7,233 $47,940
$21,802
SI 24 Legal and Professional Fees

62
Median 25th Percentile 75th Percentile
$268,801 $599,845
$408,046
SI 25 Salary and Wages for G&A Employees
Median 25th Percentile 75th Percentile
$55,841 $145,198
$92,775
SI 26 Payroll Taxes and Benefits for G&A Employees
Median 25th Percentile 75th Percentile
$23,363 $158,540
$69,595
SI 27 Total Membership and Marketing Expenses
Median 25th Percentile 75th Percentile
$88,896 $286,894
$161,910
SI 28 Total Other G&A Expenses
Median 25th Percentile 75th Percentile
4 8
6
SI 29 Full Time Equivalent G&A Employees

63
The survey also captured three key components accounted for within the category of Total Other G&A Expenses. Those three components: Total Club Healthcare Insurance Premium, Total Club these expenses across all market segments are shown below in Icons 30-32.
Median 25th Percentile 75th Percentile
$117,942 $349,404
$209,144
SI 30 Total Club Healthcare Premium Expense
Median 25th Percentile 75th Percentile
$26,342 $85,005
$44,259
SI 31 Total Club Workmen's Comp Premium Expense
Median 25th Percentile 75th Percentile
$18,566 $49,625
$32,317
SI 32 Total Club Information Technology (IT) Expense

64
Section X Facilities and Recreation Clubhouse and Buildings Table 12 summarizes the Buildings and Maintenance expenses, clubhouse size, expense of buildings maintained and the median cost per square foot of maintained building. Please note: the cost per square foot is a derived number and does not reflect actual data from a given club. Table 12 Overview of Buildings and Maintenance
Segment
Median of Respondents
Total Buildings and Maintenance Expense
Square Feet of Clubhouse
Total Square Feet of Maintained Buildings
Cost Per Square Foot At the Median
Small $184,540 20,000 25,100 $9 Lower Mid-Market $469,147 27,000 42,000 $10
Upper Mid-Market $753,099 42,000 57,000 $13
Large $1,493,977 62,280 102,000 $16 The survey contained a number of specific metrics regarding the breakdown of building and maintenance expenses. Icons 33-39 detail the quartile distribution of the expense breakdown, square footage of buildings and age of clubhouse. The distribution covers all respondents.
Median 25th Percentile 75th Percentile $107,870 $347,671
$194,055
SI 33 In-House Cleaning/Maintenance Payroll Expenses
Median 25th Percentile 75th Percentile $136,688 $331,358
$212,186
SI 34 Energy and Utilities Expenses

65
Median 25th Percentile 75th Percentile
$61,541 $200,496
$108,392
SI 35 All Other Building Operation and Maintenance Expenses
Median 25th Percentile 75th Percentile
$15,166 $121,926
$53,238
SI 36 Locker Room Supplies and Operation Expenses
Median 25th Percentile 75th Percentile
18 88
47
SI 37 Main Clubhouse Age
Median 25th Percentile 75th Percentile
23,000 55,000
36,091
SI 38 Main Clubhouse Size Square Feet
Median 25th Percentile 75th Percentile
34,250 81,500
54,551
SI 39 Square Footage of all Maintained Buildings

66
Guest Rooms Fourteen percent of all respondents reported having guest rooms. Clubs With Golf 11 percent of responding clubs with golf reported having guest rooms. Clubs Without Golf 30 percent of responding clubs without golf reported having guest rooms. Table 13 Guest Room Penetration by Revenue Market Segment
Segment Percentage of Respondents reporting Guest Rooms
Small Clubs 6% Lower Mid-Market Clubs
10%
Upper Mid-Market Clubs
14%
Large Clubs 24% Icons 40-42 below show the quartile distribution of data for all clubs that have indicated having guest rooms.
Median 25th Percentile 75th Percentile
$71,028 $722,453
$239,019
SI 40 Guest Room Revenue
Median 25th Percentile 75th Percentile
$49,508 $508,716
$204,141
SI 41 Guest Room Expense

67
The data indicates the median of annual revenue is $239,019. Half of the clubs that had overnight room revenue in 2013 fell below that number. The median for number of rooms is 16. At the high end of the distribution, clubs at the 75th percentile and over can be characterized as having a rooms operation with more than 25 rooms and more than $725,000 in overnight room revenue. Recreation Table 14 shows the proportion of responding clubs with the given recreational amenity. Table 14 Clubs With Given Recreational Amenity by Revenue Market Segment
Proportion of Responding Clubs with:
All Respondents
Tennis (Outdoor Courts) 74% Tennis (Indoor Courts) 14% Swimming (Outdoor Pool) 76% Swimming (Indoor Pool) 7% Fitness 60%
Table 15 shows the proportion of responding clubs with the given recreational amenity by club type. Table 15 Clubs With Given Recreational Amenity by Club Type
Proportion of Responding Clubs in Segment With:
Clubs With Golf
Clubs Without Golf
Tennis (Outdoor Courts) 80% 47% Tennis (Indoor Courts) 14% 9% Swimming (Outdoor Pool) 83% 44% Swimming (Indoor Pool) 5% 17% Fitness 63% 47%
Median 25th Percentile 75th Percentile
7 25
16
SI 42 Number of Guest Rooms

68
The following financial and operational analysis of recreational amenities is presented based on the scale of the given amenity at a club independent of club type or revenue market segment. Tennis The filtering mechanism applied to complete the tennis analysis is the number of courts. The revenue, costs and activities of a tennis operation are more closely tied to the number of courts than to the club type or revenue size of the club (although it is likely that larger revenue clubs tend to have more courts). Table 16 presents key tennis metrics grouped in accordance with number of tennis courts. Table 16 Key Tennis Metrics Grouped by Number of Courts
Number of Courts (Inclusive) 1-5 6-11 More Than 12 Median Number of Courts in Given Grouping 4 8 15
Median Revenue from Racquet Sports $20,598 $80,901 $288,353
Median Expense for Racquet Sports $62,747 $190,425 $542,472
Median Club Revenue $5,356,529 $6,952,689 $11,684,310
Ownership of Tennis Shop Pro 22% Club 26% No Shop 38%
Pro 57% Club 38% No Shop 4%
Pro 31% Club 69% No Shop 0%
Median Weekend Guest Play Fee $10 $10 $10

69
Aquatics The filtering mechanism applied to complete the aquatics analysis is the total aquatic sports expense. Some clubs operate expansive aquatic operations as part of the club membership fee, while other clubs charge additionally for aquatic activities. Given this variation, from a benchmarking standpoint, the best way to observe comparisons is to use the one constant: Expense. Table 17 summarizes key metrics regarding swimming finances and operations grouped by the total aquatic expense. Table 17 Key Aquatic Operation Metrics Grouped by Total Aquatic Expense
Total Aquatic Expense Less than $100,000
$100,000 to $200,000
More Than $200,000
Proportion of Clubs in Given Aquatic Sports Expense Group
59% 28% 13%
Median Aquatic Expense $49,563 $136,928 $273,870 Median Aquatic Revenue $6,092 $22,864 $72,846 Median Club Revenue $5,642,963 $7,717,378 $12,971,960
Icons 43-48 show the percentile distribution for the other key aquatic sports metrics (across all revenue market segments).
Median 25th Percentile 75th Percentile
$3 $8
$5
SI 43 Weekend Guest Fee for Pool Use
Median 25th Percentile 75th Percentile
$31,236 $81,384
$54,332
SI 44 Salary and Wages for Aquatics

70
Median 25th Percentile 75th Percentile
$3,084 $14,758
$7,590
SI 45 Payroll Taxes and Benefits for Aquatics
Median 25th Percentile 75th Percentile
0 4
2
SI 46 Full Time Equivalent Employees for Aquatics
Median 25th Percentile 75th Percentile
$6,676 $23,416
$12,936
SI 47 Pool Maintenance and Equipment Expenses
Median 25th Percentile 75th Percentile
$2,653 $21,232
$9,166
SI 48 Other Aquatic Expenses

71
Fitness The filtering mechanism applied to complete the fitness analysis is the total fitness expense. Higher expense is tied to greater fitness activities and operation. Some clubs operate expansive fitness operations as part of the club membership fee, while other clubs charge additionally for fitness activities. Given this variation, from a benchmarking standpoint it seems the best way to observe comparisons is to use the one constant: Expense. Table 18 summarizes key metrics regarding fitness finances and operations grouped by the total fitness expense. Table 18 Key Fitness Operation Metrics Grouped by Total Fitness Expense
Total Fitness Expense Less than $100,000
$100,000 to $500,000
More Than $500,000
Proportion of Clubs in Given Fitness Expense Group 30% 47% 23%
Median Fitness Expense $27,577 $212,174 $874,039 Median Fitness Revenue $6,455 $118,894 $642,818 Median Square Footage of Fitness Center 1,343 4,000 14,403
Percent of Clubs With Fitness Retail Shop 3% 22% 62%
Median Club Revenue $5,359,150 $8,614,459 $18,575,180

72
Icons 49-52 show the percentile distribution for salary and wages, payroll taxes and benefits, equipment and maintenance expense and all other fitness center expenses.
Median 25th Percentile 75th Percentile
$70,728 $342,727
$155,693
SI 49 Salary and Wages for Fitness
Median 25th Percentile 75th Percentile
$13,561 $66,229
$30,247
SI 50 Payroll Taxes and Benefits for Fitness
Median 25th Percentile 75th Percentile
$2,030 $11,736
$4,631
SI 51 Fitness Maintenance and Equipment
Median 25th Percentile 75th Percentile
$7,128 $59,186
$20,302
SI 52 Other Fitness Expenses

73
Section XI Course Maintenance Table 19 below shows a simple segmentation of the golf operations season by market segment. Table 19 Golf Operations Season by Revenue Segment
Segment Proportion of Clubs 11 or 12 Month Course Operation
Proportion of Clubs 10 Months or Less Course Operation
Small 55% 45% Lower-Mid 55% 45% Upper-Mid 70% 30% Large 85% 15%
Larger clubs tend to be located in regions with longer golf course operation seasons. Course Maintenance Budget Breakpoints There tend to be natural breakpoints in course maintenance (CM) budgets; thus course maintenance analysis is based on the following groupings of 2013 CM spending:
Less than $800,000 Between $800,000 and $1,200,000
Between $1,200,000 and $1,700,000 More than $1,700,000
The analysis presents the characteristics of clubs based on their Course Maintenance spending. Table 20 below summarizes the analysis.

74
Table 20 Course Maintenance Spending Analysis
Course Maintenance Spending
Less than $800K
$800,000 - $1.2M
$1.2M - $1.7M
More Than $1.7M
1 Median CM Expense in Grouping $667,367 $983,791 $1,521,872 $2,310,078 2 Median Club Revenue $3,453,530 $5,570,148 $6,945,026 $11,383,590 3 Median Available Cash $2,126,209 $3,116,747 $4,293,593 $6,837,447
4 CM Expense as Percent of Available Cash 28% 30% 29% 31%
5 Median Number of Holes 18 18 18 36 Club Characteristics
6 Median Full Member Equivalent 362 438 486 642
7 Median Full Member Dues $4,884 $6,347 $7,140 $8,772 Analyzing Course Maintenance Budget Drivers Another ongoing debate in the club business centers on the amount required to maintain a golf course. The answer is said to depend on the number of acres, the type of grass, the geographic location and other factors. A scientific approach to answering the question based on analyzing the course maintenance budgets at hundreds of clubs leads to a completely different conclusion: The amount it costs to maintain a golf course is the amount a given club can afford. In referring to Table 20, please take a moment to review Row 4 while considering how widely the absolute amount spent varies as shown in Row 1. The consistency of the proportion of available cash being used for course maintenance has been proven to be independent of geography, size of club or seasonality. The Club Benchmarking Available Cash Model has proven the average proportionate use of cash at a club to maintain the course is 30 percent of the Available Cash (the money available to cover fixed expenses). Any number of data points can be used as facts to support the conclusion. As an example, please review Figures 33 and 34 below. Figure 33 shows the distribution of acreage maintained for 18-hole courses spending less than $1,100,000 and Figure 34 shows the same distribution for 18-hole courses with spending over $1,100,000. There are actually more clubs with more than 200 acres to maintain in the lower spending group. Clearly one can conclude the driver of expense is not maintained acres. Said another way, size is not a cause affecting maintenance spending. Such an example controverts theories based on size. Ultimately, the variation has been proven to be driven by the variation in Available Cash (the amount of money a club has to cover its fixed expenses.) Simply, clubs spend what they can afford.
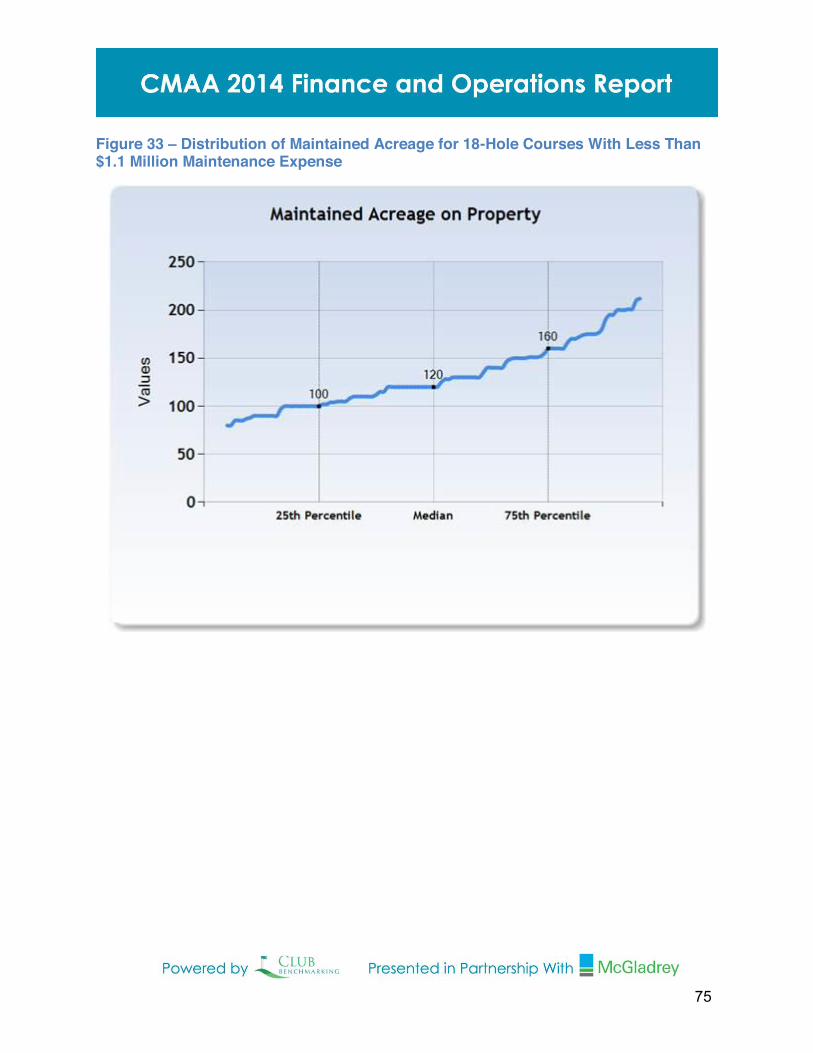
75
Figure 33 Distribution of Maintained Acreage for 18-Hole Courses With Less Than $1.1 Million Maintenance Expense

76
Figure 34 Distribution of Maintained Acreage for 18-Hole Courses With Less Than $1.1 Million Maintenance Expense
Course Maintenance Labor Distribution Icons 53-60 summarize the spending on course maintenance labor by Course Maintenance budget grouping.
Median 25th Percentile 75th Percentile $278,837 $395,155
$349,349
SI 53 Salary and Wages Less Than $800K Budget

77
Median 25th Percentile 75th Percentile
$51,332 $76,729
$62,360
SI 54 Payroll Taxes and Benefits Less Than $800K Budget
Median 25th Percentile 75th Percentile $478,252 $574,130
$520,528
SI 55 Salary and Wages $800K - $1.2M Budget
Median 25th Percentile 75th Percentile
$81,840 $119,454
$101,707
SI 56 Payroll Taxes and Benefits $800K - $1.2M Budget
Median 25th Percentile 75th Percentile $644,134 $807,846
$692,276
SI 57 Salary and Wages $1.2M - $1.7M Budget
Median 25th Percentile 75th Percentile $131,557 $188,697
$164,652
SI 58 Payroll Taxes and Benefits $1.2M - $1.7M Budget

78
As can be seen in Figure 35, at the median, 63 percent of Course Maintenance expense is allocated to labor while 37 percent is allocated to non-labor. Figure 35 Course Maintenance Summary Labor vs. Non-Labor
Median 25th Percentile 75th Percentile $919,319 $1,714,571
$1,066,762
SI 59 Salary and Wages More Than $1.7M Budget
Median 25th Percentile 75th Percentile $208,122 $408,120
$285,090
SI 60 Payroll Taxes and Benefits More Than $1.7M Budget

79
Figure 36 shows the distribution of Full Time Equivalents (FTEs) per 18-hole course equivalents across the entire spectrum of course maintenance expense respondents. The median is for a crew of 15 FTEs to maintain an 18-hole course with 12 and 19 FTEs as the 25th and 75th percentiles respectively. Figure 36 Course Maintenance FTEs Per 18-Hole Course
Non-Labor Expense Distribution Breakdown A number of graphical charts appear below showing the distribution of non-labor Course Maintenance expenses by geographic region. There are five regions shown: Northeast, Southeast, Midwest, Southwest and West. Appendix 1 details the states within each region.
-labor expense distribution would be shown if you subscribed to Club Benchmarking. The most significant takeaway is that water expense is the one expense that is tied to regional variations. It is of course important to note that while the water expenses vary by region, the proportionate use of Available Cash for course maintenance does not.

80
Figure 37 Average Distribution of Non-Labor CM Expenses West Region

81
Figure 38 Average Distribution of Non-Labor CM Expenses Southwest Region

82
Figure 39 Average Distribution of Non-Labor CM Expenses Midwest Region

83
Figure 40 Average Distribution of Non-Labor CM Expenses Southeast Region

84
Figure 41 Average Distribution of Non-Labor CM Expenses Northeast Region

85
Course Characteristics Figures 42-44 comprise square footage of greens, acres of fairway and number of bunkers; all indexed to 18-hole course equivalents. Club Benchmarking subscribers would see their own course characteristics highlighted on the distribution. Figure 42 Square Feet of Greens Per 18 Holes

86
Figure 43 Acres of Fairway Per 18 Holes

87
Figure 44 Number of Bunkers Per 18 Holes

88
Section XII Golf Operations and Golf Shop Unlike many industry surveys, this analysis separates Pro Shop revenue from Golf Operations revenue. There are essentially two types of revenue in golf operations: greens fees and golf car fees that are basically 100 percent margin, and pro shop revenue which tends to be around 25 percent margin. They have very different effects on the Available Cash. In the golf operations function, the dominant sources of revenue are greens fees from
on a Monday or Thursday), golf car/trail fee revenue, pro shop revenue and revenue from sundry golf operations areas (such as handicap, driving range, etc.). Greens fee revenue and golf car/trail are high margin revenue, while pro shop revenue is low margin revenue given the high cost of goods sold in the pro shop and the fact that not all clubs own the pro shop. Distribution of pro shop ownership is shown in Table 21 in accordance with the market revenue segmentation. The obvious takeaway is the proportion changes materially in the small revenue market segment with no appreciable change across the other revenue segments. Table 21 Distribution of Pro Shop Ownership
Segment Pro Owns Golf Shop Club Owns Golf Shop Small 53% 47% Lower-Mid 38% 62% Upper-Mid 35% 65% Large 26% 74%
This analysis will break golf operations revenue into its high and low gross margin components by zeroing in on high gross margin (Available Cash) revenue and low gross margin revenue. Golf Shop Revenue and Gross Margin Icons 61 64 below show the distribution of pro shop revenue within each of the market segments.
Median 25th Percentile 75th Percentile $150,069 $196,089
$181,565
SI 61 Golf Shop Revenue $0M - $3.5M Club Revenue

89
Table 22 shows the gross margin in the pro shop at the median for each of the market segments. As a rule of thumb, the median for pro shop gross margin is close to 25 percent. Table 22 Golf Shop Revenue and Gross Margin by Club Revenue Segment
Segment Gross Margin at the Median
Small 23% Lower-Mid 23% Upper-Mid 25% Large 27%
Median 25th Percentile 75th Percentile $196,836 $322,244
$260,353
SI 62 Golf Shop Revenue $3.5M - $6M Club Revenue
Median 25th Percentile 75th Percentile $240,525 $403,132
$302,000
SI 63 Golf Shop Revenue $6M - $9M Club Revenue
Median 25th Percentile 75th Percentile $460,641 $815,371
$609,863
SI 64 Golf Shop Revenue More Than $9M Club Revenue

90
Golf Operations Revenue and the Available Cash Model Golf operations revenue includes greens fee revenues (from guest and outings) and golf car/trail fee revenue. Such revenue accrues to the club with very close to 100 percent margin. While it does cost money to run the golf operations function, the costs are necessary whether or not there were greens fees from guests and outings since the vast majority of rounds and activities are centered on members. Thus, golf operations staff is
Model). While there are no doubt incremental costs associated with golf operations revenue, they are marginal costs making the margin associated with golf operations revenue quite significant. In fact, the average club with golf generates 15 percent of its available operating cash from golf operations. Table 23 below summarizes key golf operations metrics by revenue market segment. Table 23 Key Golf Operations Metrics
Golf Operations Revenue Grouping Small Lower-
Mid Upper-Mid Large
1 Median Golf Operations Revenue Within Grouping $430,202 $648,278 $788,680 $1,546,795
2 Median Number of Total Rounds Played 15,619 18,676 22,000 31,590
3 Median Golf Operations Revenue Per Round Played (Based on Total Rounds Played)
$27 $41 $43 $53
4 Median Weekend Guest Green Fee $70 $75 $90 $105 5 Median Car Fee Per Member $18 $21 $20 $22
Golf Operations Labor Icon 65 shows the distribution, across all market segments, for the number of PGA certified professionals on staff. Icons 66 and 67 show the distribution for golf operations and golf shop salaries and wages and payroll taxes and benefits labor across all respondents.
Median 25th Percentile 75th Percentile
2 4
3
SI 65 Number of PGA Professionals on Staff

91
Figure 45 shows the distribution of Full Time Equivalents (FTEs) in the Golf Operations function across all market segments. Figure 45 Golf Operations Full Time Equivalents Employees
Median 25th Percentile 75th Percentile $217,027 $451,318
$306,712
SI 66 Salary and Wages for Golf Operations and Shop Staff All Respondents
Median 25th Percentile 75th Percentile
$43,433 $102,224
$63,715
SI 67 Payroll Taxes and Benefits for Golf Operations and Shop Staff All Respondents

92
Sundry Golf Operations Items Table 24 reports the responses to various items in the golf operations function. Table 24 Sundry Golf Operations Items
Survey Item All Respondents
1 Head Professional Is an Employee/Independent Contractor
Emp. - 75% Cont. - 4% Both - 21%
2 Walk and Carry Allowed Yes - 93%, No 7% 3 Pull/Speed Carts Allowed Yes - 77%, No 22% 4 Golf Programs Supported 98% Senior 63% Junior 90%
5 Club Holds a Professional Tour Event No - 90%, Yes 10%
6 Club Has a Caddy Program No 68%, Yes - 32% Icons 68-71 show the distribution of charges for locker rental, bag storage, driving range and handicap management. The format follows the standard quartile distribution. The distributions shown are for all market segments.
Median 25th Percentile 75th Percentile
$76 $180
$125
SI 68 Annual Locker Fees
Median 25th Percentile 75th Percentile
$85 $130
$108
SI 69 Annual Bag Storage Fees

93
Golf Cars Icons 72-74 show the percentile distribution associated with the various golf car metrics. The distribution shown is for all market segments.
Median 25th Percentile 75th Percentile
$0 $154
$0
SI 70 Annual Driving Range Fees
Median 25th Percentile 75th Percentile
$21 $35
$30
SI 71 Annual Handicap Fees
Median 25th Percentile 75th Percentile
50 74
60
SI 72 Number of Golf Cars
Median 25th Percentile 75th Percentile $131,431 $317,886
$207,019
SI 73 Total Golf Car/Trail Fee Revenue
Median 25th Percentile 75th Percentile
$2,355 $15,488
$6,267
SI 74 Golf Car Maintenance and Operation Expense

94
Clubs control golf car revenue 90 percent of the time while the golf professional controls it at five percent of the responding clubs and the club pays the golf professional a commission at five percent of the responding clubs. Figure 46 shows the manner of acquisition of golf cars across all market segments. Figure 46 Manner of Golf Car Purchase
Purchased33%
Leased64%
Both3%

95
Section XIV Appendix State Grouping in Regions West California, Arizona, Nevada, Hawaii, Oregon, Washington, Alaska, Wyoming, Montana, Idaho (10 States) Southwest Utah, Colorado, New Mexico, Kansas, Oklahoma, Texas, Arkansas, Louisiana (8 States) Southeast Florida, Georgia, North Carolina, South Carolina, Tennessee, Alabama, Mississippi, Virginia, West Virginia, Kentucky, Washington DC (10 States plus DC) Midwest North Dakota, South Dakota, Nebraska, Missouri, Iowa, Minnesota, Wisconsin, Illinois, Indiana, Ohio, Michigan (11 States) Northeast Maine, Vermont, New Hampshire, Massachusetts, Rhode Island, Connecticut, New York, New Jersey, Pennsylvania, Delaware, Maryland (11 States)

96