Embed Size (px)
Citation preview

Power-to-gas
Short term and long term opportunities to leverage synergies
between the electricity and transport sectors
through power-to-hydrogen
Study authors
Wouter Vanhoudt ∙ Hinicio
Frederic Barth ∙ Hinicio
Jean-Christophe Lanoix ∙ Hinicio
Joel Neave ∙ Hinicio
Patrick R Schmidt ∙ LBST
Werner Weindorf ∙ LBST
Tetyana Raksha ∙ LBST
Jan Zerhusen ∙ LBST
Jan Michalski ∙ LBST
A joint expertise to the Fondation Tuck by
Hinicio S.A.
Rue des Palais, 44
1030 Brussels
Belgium
and
LBST ∙ Ludwig-Bölkow-Systemtechnik GmbH
Daimlerstr. 15
85521 Munich-Ottobrunn
Germany
Brussels/Munich ∙ 19 February 2016 ∙ Final Report

Acknowledgements
The study authors greatly thank Fondation Tuck for funding this expertise.
IDENTIFICATION
Program call: The future of energy: leading the change – A research
program analysing how to implement a successful energy
transition – Call for Projects 2014
Call topic addressed: Topic 2 – Technical and economic potential
of power-to-gas technologies
Project title: Power-to-gas – Short term and long term opportunities to
leverage synergies between the electricity and transport
sectors
Grantee: Hinicio SA and
LBST ∙ Ludwig-Bölkow-Systemtechnik GmbH
Contact: Wouter Vanhoudt
Director EMEA
Rue des Palais 44, bte 71. B-1030 Brussels, Belgium
[email protected], (t) +32 2 211 34 14
RECOMMENDED CITATION
Vanhoudt, W., Barth, F. (Hinicio), Schmidt, P., Weindorf, W. (LBST), et al.: Power-to-gas
– Short term and long term opportunities to leverage synergies between the electricity
and transport sectors through power-to-hydrogen; Brussels/Munich, 19 February 2016.

ABSTRACT
In this study by environmental expert consultancies Hinicio and LBST for the Tuck
Foundation scientific program « Future of Energy », two power-to-gas
applications are presented: green hydrogen for use in refinery processes and
the implementation of a semi-centralised power-to-hydrogen system
supporting local hydrogen mobility.
The two hydrogen applications have been analysed – the depth of analysis
depends on the power-to-hydrogen application – regarding their contributions
to greenhouse gas emission reductions, energy efforts, specific costs, and
cumulated investments.
Furthermore, sensitivities have been tested given the uncertainty of future
regulatory conditions. Strategic implications are discussed for the short to mid-
term deployment of power-to-gas technologies and recommendations
derived to this end.

CONTENTS
Identification......................................................................................................................... ii
Recommended citation ...................................................................................................... ii
Abstract ............................................................................................................................... iii
Contents ...............................................................................................................................iv
Tables ...................................................................................................................................vi
Figures ................................................................................................................................ viii
Executive Summary ........................................................................................................... xii
1 Background, Objectives and Approach ................................................................. 1
2 Setting the Scene ....................................................................................................... 3
2.1 Power-to-gas in the energy landscape ..................................................... 5
2.1.1 Renewables on the rise....................................................................................... 5
2.1.2 Power-to-gas constitutes a cost-effective source of flexibility that can
benefit the energy system as a whole and help improve power
generation economics ....................................................................................... 6
2.1.3 Power-to-gas can also help address balancing needs at short time
scales .................................................................................................................... 11
2.1.4 Power-to-gas can support the integration of renewables at any point in
the T&D system ................................................................................................... 12
2.1.5 Hydrogen injection into the natural gas grid enhances a power-to-Gas
system’s ability to provide grid services ........................................................ 15
2.2 Regulatory framework ............................................................................... 16
2.2.1 Policy targets....................................................................................................... 16
2.2.2 EU ........................................................................................................................... 18
2.2.3 Germany – National implementation of RED and FQD ............................. 19
2.2.4 France – National implementation of RED and FQD ................................. 21
2.3 Power system .............................................................................................. 23
2.3.1 Cost structure of electricity .............................................................................. 23
2.3.2 Provision of ancillary grid services and associated revenue .................... 28
3 Detailed Analysis and Comparison of Selected Power-to-Gas Applications for
France and Germany .............................................................................................. 35
3.1 APPLICATION A: Hydrogen from power-to-gas for use in refineries ....... 35
3.1.1 Regulatory framework ...................................................................................... 35
3.1.2 Refinery landscape ........................................................................................... 37
3.1.3 Hydrogen use in refineries ................................................................................ 42

3.1.4 Renewable electricity potentials .................................................................... 56
3.2 Discussion on green hydrogen for use in refineries ................................. 60
3.2.1 Conclusions ......................................................................................................... 60
3.2.2 Recommendations ............................................................................................ 60
3.2.3 Fields for further research ................................................................................. 60
3.3 APPLICATION B: Semi-centralised power-to-hydrogen business cases 61
3.3.1 The cost of the electricity ................................................................................. 61
3.3.2 Feed-in tariffs (FiT) ............................................................................................... 72
3.3.3 Semi-centralised power-to-hydrogen business model description ......... 74
3.3.4 Semi-centralised power-to-hydrogen business case analysis results ...... 77
3.4 Conclusions from the semi-centralised power-to-hydrogen business
case analyses ............................................................................................. 86
3.4.1 Conclusions ......................................................................................................... 86
3.4.2 Recommendations ............................................................................................ 87
4 Literature ................................................................................................................... 89
ANNEX ................................................................................................................................ 94

TABLES
Table 1: Characteristics of PEM and Alkaline electrolysers (source: Hinicio) ... 12
Table 2: Environmental policy targets in France, Germany and international
(amended from [MFS 2015]) ....................................................................... 17
Table 3: Greenhouse gas intensities of hydrogen from various sources for use in
fuel cell electric vehicles based on FQD ANNEX I (2015/652/EU) ....... 19
Table 4: Characteristics of electricity tariffs and taxes in France ....................... 24
Table 5: Characteristics of fees and taxes in price components (Source:
netztransparenz.de) ..................................................................................... 26
Table 6: Legal basis ...................................................................................................... 27
Table 7: Main characteristics of the French tertiary reserve (source: [RTE, 2015])
.......................................................................................................................... 30
Table 8: Average prices on the tertiary reserve in France from 2012 to 2015
(source: http://clients.rte-
france.com/lang/fr/visiteurs/vie/mecanisme/histo/tendances.jsp) . 30
Table 9: German balancing power market conditions (Source:
regelleistung.net) .......................................................................................... 32
Table 10: Average prices for balancing power in Germany (Source:
http://balancepower.de/regelleistung.html) ......................................... 34
Table 11: Overview regulatory framework EU FQD, German BImSchG/V and
French Code de l’énergie .......................................................................... 36
Table 12: Hydrogen demand and production of French crude oil refineries
(kt/yr) ............................................................................................................... 44
Table 13: Hydrogen demand and production of German crude oil refineries
(kt/yr) ............................................................................................................... 45
Table 14: Greenhouse gas emissions from the supply of hydrogen via natural gas
steam-methane reforming .......................................................................... 48
Table 15: Greenhouse gas emissions from the supply of hydrogen via water
electrolysis with renewable power (wind, PV) ........................................ 48
Table 16: Costs of hydrogen supply from renewable electricity .......................... 50
Table 17: Scenario results for hydrogen use in refineries in France and Germany
(source: LBST).................................................................................................. 53
Table 18: Avoided refinery GHG emissions expressed in passenger car uses per
year .................................................................................................................. 54
Table 19: Technical renewable electricity potentials in France (source: LBST
based on [ADEME 2015], [EEA 2009], [IWES 2012], [ADEME 2014], [LBST
2015]) ............................................................................................................... 57

Table 20: Technical renewable electricity potentials in Germany (source: LBST)
.......................................................................................................................... 58
Table 21: Techno-economic data for different power plant types (maximal
costs, i.e. for highest expected market prices and lowest efficiency)
(source: [RTE 2015b]) .................................................................................... 64
Table 22: Dispatchable capacities available in 2020 and 2030 (source: [RTE
2015b])............................................................................................................. 64
Table 23: Renewable power generation in 2020 and 2030 (source: [RTE 2015b])
.......................................................................................................................... 64
Table 24: TURPE total annual cost breakdown for a 2,000 kW subscription and an
8,000 MWh consumption (source: Hinicio, based upon [ERDF 2015]) 65
Table 25: CSPE reduction rate depending on energy intensity per unit of added
valie for électro-intensif companies (source: Article 266 quinquies C du
Code des Douanes) ..................................................................................... 67
Table 26: Summary of French energy taxes, fees and tariffs as applied to the
electrolyser in the reference scenario (source: Hinicio) ....................... 68
Table 27: Techno-economic data for different power plant types (maximal
costs, i.e. for highest expected market prices and lowest efficiency)
.......................................................................................................................... 70
Table 28: Dispatchable capacities available in 2020 and 2030 ........................... 70
Table 29: Renewable power generation in 2020 and 2030 ................................... 70
Table 30: Price components for PtG system including exemptions in 2016 as per
November 2015 (Source: netztransparenz.de) ....................................... 72
Table 31: Definition of technology readiness levels (TRLs) according to HORIZON
2020 [EC-RTD 2014] ....................................................................................... 94

FIGURES
Figure 1: Methodology ................................................................................................... 2
Figure 2: Power-to-X taxonomy .................................................................................... 3
Figure 3: Overview on power-to-gas technologies and applications (source:
LBST) ................................................................................................................... 4
Figure 4: IEA scenarios for GHG emissions reduction in the power sector – [IEA
2015] ................................................................................................................... 5
Figure 5: Global light duty vehicles sales by type in the 450 scenario [IEA 2015]
............................................................................................................................ 6
Figure 6: Power consumption during two days in France in Jan and Feb 2013.
Actual VRE production on these days multiplied by 10 (source: Hinicio
based on data from RTE)............................................................................... 7
Figure 7: Illustration of the potential impact of power-to-gas on compensating
the effects of intermittent power production on a 24-hour period
(source: Hinicio) ............................................................................................... 8
Figure 8: Corresponding power consumed by the electrolyser to mitigate
variable renewable power production on a 24-hour period (source:
Hinicio) ............................................................................................................... 8
Figure 9: Curtailed renewable electricity volumes in Germany (LBST based on
[BNetzA 2015] data) ....................................................................................... 9
Figure 10: Total cost of hydrogen produced by a power-to-hydrogen system
(source: Hinicio) ............................................................................................. 10
Figure 11: Renewable power capacities connected to the grid in Germany as
per July 2014 (source: LBST based on data from energymap.info).... 13
Figure 12: Installed capacity of power-to-gas pilot plants – (source: Hinicio from
[Gahleitner 2013]) ......................................................................................... 13
Figure 13: Illustration of various power-to-hydrogen configurations (source:
Hinicio) ............................................................................................................. 15
Figure 14: Federal regulatory framework for energy in Germany [BMWi 2014] . 25
Figure 15: Crude oil refineries in France (source: LBST based on [MEDDE 2015, no
14, fig 8] data) ............................................................................................... 37
Figure 16: Crude oil imports to France in 2014 in 1000 t/yr by world region (source:
LBST based on [MEDDE 2015, no 11, fig 6] data) .................................... 38
Figure 17: Fuel refineries in Germany (source: LBST based on [MWV 2015] data)
.......................................................................................................................... 38
Figure 18: Crude oil imports to Germany in 2014 in million tons per year by world
region (source: LBST based on [MWV 2015] data) ................................. 39

Figure 19: Major refining and processing capacities in Europe (source: LBST
based on [E3M et al. 2015, p12] data) ..................................................... 40
Figure 20: Share of crude oil qualities in European refineries [EXERGIA et al. 2015,
p166] ................................................................................................................ 41
Figure 21: European refineries’ product mixes (%, left scale) and diesel-to-
petroleum ratios (D/P, without unit, right scale) [EXERGIA et al. 2015,
p170] ................................................................................................................ 42
Figure 22: Synthetic refinery France (source: LBST refinery model) ....................... 43
Figure 23: Hydrogen sources and uses in refineries (source: LBST) ........................ 46
Figure 24: Schematic of the pathways for the supply of gasoline and diesel
including hydrogen supply from natural gas (fossil energy-based
reference) (source: LBST) ............................................................................. 47
Figure 25: Schematic of the pathways for the supply of gasoline and diesel
including hydrogen supply from renewable electricity (source: LBST)
.......................................................................................................................... 47
Figure 26: Comparison of greenhouse gas emissions from the supply of gasoline,
kerosene, and diesel (source: LBST) .......................................................... 49
Figure 27: Development of the installed capacity of electrolysis plants in France
and Germany (source: LBST) ...................................................................... 50
Figure 28: Comparison of the costs for the supply of gasoline and diesel (source:
LBST) ................................................................................................................. 51
Figure 29: Sensitivity analysis of annual electricity systems full costs (y-axis) with
variable PV share (x-axis) and variable PV costs (red = baseline,
blue = -10% PV costs, green = -20% PV costs) [ISE 2013, p 31] ............. 52
Figure 30: Greenhouse gas mitigation costs of renewable fuels from non-
biogenic sources (full cost assessment ‘well-to-tank’ Germany) [LBST
2015] ................................................................................................................. 55
Figure 31: Technical renewable electricity potentials in France (source: LBST) . 57
Figure 32: Technical renewable electricity potentials in Germany (source: LBST)
.......................................................................................................................... 59
Figure 33: Historical and projected marginal-cost based price duration curves for
France (source: Hinicio & LBST based on data from [RTE 2015b]) ...... 63
Figure 34: Historical and projected marginal cost-based price duration curves
Germany (source: LBST based on data from [Nitsch et al., 2010]) ..... 69
Figure 35: The different components of the semi-centralised PtH2 value chain
and their price and revenue components (source: Hinicio) ............... 75
Figure 36: Example of scenario results graphic representation (source: Hinicio)
.......................................................................................................................... 78
Figure 37: Reference Scenario: Revenues and Costs (source: Hinicio) ............... 80
Figure 38: Low H2 market demand with H2 injection into the NG grid: Revenues
and Costs (source: Hinicio) ......................................................................... 81

Figure 39: Low H2 market demand without injection into the NG grid: Revenues
and Costs (source: Hinicio) ......................................................................... 81
Figure 40: Direct purchase from an onshore wind electricity producer: Revenues
and Costs (source: Hinicio) ......................................................................... 82
Figure 41: German electricity market conditions: Revenues and Costs (source:
Hinicio) ............................................................................................................. 83
Figure 42: Direct purchase from an onshore wind electricity producer in 2030:
Revenues and Costs (source: Hinicio) ...................................................... 85
Figure 43: 2030 horizon electrolyser characteristics with spot market electricity
purchase: Revenues and Costs (source: Hinicio) ................................... 86

Acronyms & Abbreviations
AFID EU Alternative Fuels Infrastructure Directive
API Unit to measure the crude-oil gravity
BEV Battery Electric Vehicle
BImSchG/V Federal Immission Protection Law/Ordinances
(“Bundes-Immissionsschutzgesetz“)
CGH2 Compressed Gaseous Hydrogen
CH4 Methane
CO2eq Carbon dioxide equivalents
CPT Clean Power for Transport (EU strategy)
EEG Renewable Energy Law “Erneuerbare-Energien-Gesetz“
FCEV Fuel Cell Electric Vehicle
FCC Fluid Catalytic Cracking
FQD EU Fuel Quality Directive
GHG Greenhouse Gas
GoO Guarantees of Origin
H2 Hydrogen
HFO Heavy Fuel Oil
ICE Internal Combustion Engine Vehicle
LBST Ludwig-Bölkow-Systemtechnik
LCA Life-Cycle Assessment
LHV Lower heating value
LTE Loi de Transition Energétique
NG Natural Gas
PtG Power-to-Gas (synthesised hydrogen/methane)
PtL Power-to-Liquid (synthesised methanol, gasoline, kerosene, diesel)
RED EU Renewable Energy Directive
SMR Steam Methane Reforming
SNBC Stratégie Nationale Bas Carbone
TWh Terawatt hours
WtT Well-to-Tank
WtW Well-to-Wheel
yr Year

EXECUTIVE SUMMARY
As part of its research program “The future of energy: leading the change”, Fondation
Tuck sponsored a study performed jointly by Hinicio and LBST between September and
December 2015 which evaluates the technical and economic potential of power-to-
gas technologies.
Coupling the electricity sector to the gas, mobility and industry sectors; power-to-gas
is viewed by many experts as key in a future energy system characterised by a large
share of intermittent wind and solar energy generation.
Indeed, power-to-gas provides a route for channelling substantial amounts of
renewable energy to sectors that have been, until now, dependent on fossil energy
sources - as required for meeting adopted climate goals. Power-to-gas also
introduces a systemic flexibility resource which can, once implemented at large scale,
significantly improves the operating conditions of needed dispatchable power
generation by reducing the magnitude of load variations related to changing
weather, while also decreasing curtailment of wind or solar power generation.
Furthermore, Power-to-gas can help maintain local balance between power
generation and consumption where distributed power generation is added to the
distribution grid, hence allowing to avoid power grid expansion for absorbing excess
production.
The main condition for realising this potential is deployment ramp-up and continued
scale-up. It is therefore essential to identify particular applications and associated
conditions of implementation where this deployment could be market-driven already
in the short term, considering also the policy environment.
Two particular applications have been identified and studied in order to evaluate their
potential for supporting this power-to-gas technology ramp-up, considering in
particular the framework conditions in France and in Germany respectively.
Green hydrogen in refineries is a promising means to reduce the greenhouse gas
emission intensity of established transportation fuels in the short term, and a potential
option to meet the requirements of the EU Fuel Quality Directive. In a scenario for
France and Germany, it was assumed that the refineries’ net hydrogen demand –
today typically provided via steam methane reforming of natural gas – is to be
supplied from green hydrogen from renewable electricity via water electrolysis by
2025.
With this process, a typical French and German refinery can reduce its greenhouse
gas emissions ’gate-to-gate’ by 14.1% and 7.2% respectively compared to today. In
absolute terms, this is equivalent to the reduction of 1.33 and 1.50 million tons of CO2eq
per year with just 20 refineries, making this option highly effective. Indeed, this is a
significant contribution to the ~10 Mt/yr CO2eq emissions reduction that needs to be
achieved in 2020 versus today to comply with the EU Fuel Quality Directive both in
France and in Germany.
Full cost assessments show that green hydrogen in refineries is cost-efficient with
greenhouse gas mitigation costs below German infringement costs and in the range
of or even below other measures in transportation. Furthermore, it can be

implemented in the short-term, because bulk quantities of hydrogen are already used
in refineries, there is a track record in France and Germany with regard to the
deployment of renewable power plants, and both countries have strong industry
players in the electrolyser and hydrogen value chain.
From a wider perspective, bulk green hydrogen demand from refineries is of high
strategic importance. Activating the electrolyser cost reduction potentials through
capacity and learning-curve effects from the deployment of 1600 MWe (France) and
1800 MWe (Germany) cumulated electrolyser capacity entails long-term benefits for
all power-to-gas and power-to-liquid applications that are needed for the energy
transition. In line with the ‘polluter pays principle’, the cost burden to get the
electrolysis technology through the economic ‘valley of death’ is shared among many
fuel users with a knock-on effect on the fuel sales prices in the order of 0.8 and 0.5 cent
per litre of diesel equivalent in France and Germany respectively.
To pave the way for green hydrogen use in refineries, it is recommended to:
Adapt the EU Fuel Quality Directive and national regulatory frameworks to
facilitate and encourage green hydrogen use in refineries;
Improve the data basis on hydrogen use in refineries through further research
activities; and
Support business case analyses for individual refineries and regional roadmaps
for renewable power and hydrogen infrastructure deployment.
Semi-centralised power-to-hydrogen systems could become an effective and
economically viable way of developing the supply of renewable or low-carbon
hydrogen to emerging fuel cell electric vehicle (FCEV) fleets with co-benefits for the
local energy system by facilitating the integration of renewables and enhancing local
energy autonomy and strengthening the local economy.
These systems combine electrolysers at MW scale with means of distribution of
compressed hydrogen to nearby points of utilisation, such as hydrogen refuelling
stations or industrial facilities consuming hydrogen. Addressing the needs of multiple
points of hydrogen consumption with a single hydrogen production plant provides
economies of scale while facilitating the provision of grid services. Furthermore, the
location of the unit can be chosen for maximization of operational management
synergies with other industrial activities and for optimal interfacing with the power and
natural gas grids. This set-up, which can be implemented with the current technology
offer, allows the provision of multiple energy services resulting in the combination of
complementary revenue streams. Combining multiple revenue streams is a key
condition of economic balance and financial risk management, as the delay in local
hydrogen demand ramp-up for mobility applications is typically a key hurdle to
overcome.
Starting from a reference set of hypotheses (on electricity prices, technology costs
etc.), and examining different variations, the following conclusions can be drawn from
the techno-economic analysis of the semi-centralised power-to-hydrogen system:

Assuming the application of a certain number of favourable regulatory
conditions which are considered defendable1, achieving economic balance
seems feasible for short-term deployments in France; therefore, with some
further support -for instance in the form of investment subsidies- such
deployments could attract private investment.
The French fee regime (as applied in this study) would be particularly
favourable for Power-to-gas. In contrast, the grid fee regime currently applied
in Germany handicaps Power-to-gas. In the short-term, the study concludes
that the economics of Power-to-gas are therefore more attractive in France
rather than in Germany.
Injection into the natural gas grid can generate two complementary revenue
streams – from sales to the gas grid, and from services to the power grid
performed when injection is taking place - which reduces exposure to
uncertainty of revenues from the hydrogen market.
A potentially attractive alternative to purchasing the needed electricity on the
spot market is to contract its supply directly from a renewable power producer.
Since consumption would take place only when this electricity has the lowest
market value (i.e. during the hours for which the spot market prices are typically
extremely low), the producer could accept a high level of discount for supply
under such conditions, in return of visibility on the sales price. In the short term,
a power-to-hydrogen system could afford to pay 30% of the full cost of
renewable electricity under such a scheme. Taking into account technological
improvements2 and cost reduction of power-to-hydrogen and power
generation from renewables expected by 2030, a power-to-hydrogen system
could afford to pay the full average cost of renewable electricity (although it
would only be consuming it in absence of strain on demand).
The study shows that an economic balance could potentially be achieved
without public financial support by 2030 in both the French and German market
environments thanks to technological improvements.
For the development of power-to-gas as a key component in energy transition, the
study authors recommend to:
Create a feed-in tariff for the injection of green or low-carbon hydrogen into
the natural gas grid of a level comparable to that of biomethane in France;
In France, grant the hyperélectro-intensif status to hydrogen power-to-gas
production;
In Germany, provide similar tax, EEG appropriation, and grid fee benefits to
hydrogen production by electrolysis as the hyperélectro-intensif status;
In Europe, further develop sustainability criteria, certification procedures and
accountability of green or low-carbon hydrogen towards EU targets, especially
1 Exemption of grid fees and taxes for the electricity used to produce low-carbon hydrogen that is injected
into the natural gas grid, a feed-in-tariff comparable to that applied to biomethane, and application of
the conditions (exemption of grid fees) that are applicable to “electro-intensive” facilities.
2 These technological improvements are an increase in electrolyser efficiency, the extension of stack
lifetime and the reduction of electrolyser capital costs.

with regard to the EU Renewable Energies Directive (RED) and the EU Fuel
Quality Directive (FQD);
Exempt electricity used to produce green or low-carbon hydrogen injected into
the natural gas grid from grid fees and energy taxes;
Financially support the implementation of supplying hydrogen to fuel cell
electric vehicles.
---------

The future of energy ▪ Power-to-gas 1
1 BACKGROUND, OBJECTIVES AND APPROACH
As part of its research program “The future of energy: leading the change”, the
Fondation Tuck is sponsoring a project to evaluate the Technical and Economic
potential of power-to-gas technologies (Topic 2).
As set in the call, the project aims to address the core question: “Is the conversion of
surplus electricity to gas a technologically and economically feasible option to
mitigating intermittency?”
Generally, power-to-gas technically allows for the coupling of hitherto largely
unconnected energy sectors by converting electricity into a chemical energy carrier.
In this study, we plan to assess potential opportunities to address intermittency by
leveraging synergies between the electricity, the transport and industry sectors
through the use of power-to-gas technology whilst taking technical and economic
dimensions into account.
Current investments in power-to-gas technologies face the challenge of low hydrogen
prices. When injecting the resulting gas into the gas grid or when using it as a feedstock
for industry, achievable prices are essentially set by the natural gas price. Marketing
hydrogen as a future fuel in the mobility sector would in principle allow for higher
prices, but the number of fuel cell vehicles is still very small and will grow only slowly in
the coming years. On the other hand, the potential coupling of the electricity sector
to the gas, mobility and industry sectors provided by power-to-gas is viewed by many
experts as one of the key technologies in a future energy system characterised by a
large share of intermittent wind and solar energy generation. To properly prepare for
the future today, it is vital to analyse potential applications and identify
complementary revenue streams allowing for an early economically balanced
operation of power-to-gas installations. In this study, such opportunities are discussed
along with requirements on the market, technology, and policy environments.
In doing so, this study will focus on two applications targeting an eventual use of
power-to-gas in the transport sector in the short-term:
The study was structured into three Work Packages (WP), each comprising a set of
tasks as shown in Figure 1 and described in greater detail below:
WP 1: Setting the Scene.
WP 2: Detailed analysis and comparison of selected power-to-gas applications
for France and Germany.
WP 3: Roadmap considerations and policy recommendations at national and
EU level.

The future of energy ▪ Power-to-gas 2
Figure 1: Methodology
Application A: The possibilities to use large amounts of green hydrogen, derived from
power-to-gas, in refineries producing transport fuels, thereby reducing the specific
greenhouse gas emissions of the resulting fuels and offering significant potential to
address intermittency by an adaptive operation of the power-to-gas plants is
evaluated.
Application B: The implementation of a semi-centralised power-to-hydrogen system
supporting the deployment of fuel cell electric vehicles is evaluated, with a focus on
the associated business case.
In analysing these applications, we will compare situations in France and Germany,
two nations driving the change in the European energy sector where power-to-gas
applications are poised to grow in the near future but with different backgrounds and
contexts. For both applications, we will look into the regulatory framework at a national
and European level, into technology requirements and costs, and the corresponding
environmental performance with a focus on greenhouse gas (GHG) emissions3. On this
basis, we will outline requirements for an economic operation of power-to-gas plants
and provide recommendations targeting further development of policies and
technologies.
3 Analogous to [JEC 2014] the energy use and associated greenhouse gas emissions from the
manufacture of power plants, steam methane reformers, electrolysers, refineries, etc., and vehicles for
the distribution of the final fuel has not been taken into account.
So
urc
e: H
inic
io &
LB
ST 2
015

The future of energy ▪ Power-to-gas 3
2 SETTING THE SCENE
This section provides an overview of power-to-gas introducing:
the technologies involved and associated levels of maturity and costs;
their main application fields.
This will provide a technological, economic and environmental background for the
discussions in the subsequent sections.
Power-to-Gas designates the production of a high energy density gas from electricity
via water electrolysis, constituting a subcategory of the conversion of electrical power
into another form of energy or into a chemical, as shown in Figure 2.
Figure 2: Power-to-X taxonomy
Except for power-to-Heat, all the conversions indicated in Figure 2 initially require the
conversion of power into hydrogen via water-electrolysis.
This study focuses on the conversion of electrical power-to-hydrogen for subsequent
use as such in various applications, as indicated in Figure 3 showing the integration of
a power-to-gas system in the energy system.
So
urc
e: LB
ST 2
015

The future of energy ▪ Power-to-gas 4
Figure 3: Overview on power-to-gas technologies and applications (source: LBST)
In a first step, we will briefly describe the technologies required for a power-to-gas
application including a view on their maturity, typical cost, and any noteworthy
boundary conditions. Key technologies include: electrolyser plant, hydrogen
conditioning, hydrogen storage, and hydrogen transport and distribution. We will also
cover methanation, but will mainly focus on the production and use of hydrogen
within this project.
Along with the above technology characterisations, we will also address current
challenges and the expected developments within the coming decade.
In a second step, we will give an overview on the most relevant applications for power-
to-gas including the production of fuels for mobility, feedstock for refineries and
industry, injecting the gas into the grid, and using power-to-gas for long-term electricity
storage and grid balancing.
For each of these applications, we will briefly outline the underlying concept,
operational modes and requirements, and the main elements of the value chains
involved. We will also highlight key issues in current discussions around the applications,
Mo
bility
Fue
ls
Electricity
Gas turbine / CCGT
GG
Gas
Fuel cell
Fuel CellFuel Cell
H2
Refuelling stations
Refineries
Methanation
Electricity grid
Renewable electricity
Gas grid
Electrolysis
Ch
em
icals
Industry
Hydrogen
Electricity infrastructure
Hydrogen infrastructure
Gas infrastructure
H2 storage
Underground storage
H2 supply chain
Hydrogen applications
Focus of this study
So
urc
e: L
BST 2
015

The future of energy ▪ Power-to-gas 5
including environmental aspects where relevant, and give examples for relevant pilot
projects, aiming to provide tangible examples of technology implementations.
The application overview will motivate why we have chosen to analyse the following
two applications in more detail: A) using green hydrogen derived from power-to-gas
in refineries producing transport fuels, and B) power-to-gas as a means to couple the
electricity sector with the mobility and industry sectors.
2.1 Power-to-gas in the energy landscape
2.1.1 Renewables on the rise
According to the IEA’s 450 ppm scenario, achieving a global temperature increase of
no more than 2° Celsius is conditional upon several objectives, two of which are
particularly relevant to this study:
1. Increasing the share of renewable energy production beyond the levels
currently set within national climate mitigation plans defined in the Intended
Nationally Determined Contributions (INDCs).
Figure 4 illustrates the additional greenhouse gas (GHG) emissions reductions that are
needed to that end (IEA 450 Scenario4) in the power generation sector compared to
the reductions provided by the INDCs
Figure 4: IEA scenarios for GHG emissions reduction in the power sector – [IEA
2015]
Moving from the INDC pathway to the 450 ppm scenario requires an increase in
renewable electricity generation investments from B$270/yr in 2014 to B$400/yr in 2025.
Indeed, the 450 ppm scenario implies installed capacity grows from 450 GW today to
3300 GW in 2040. As a result, variable renewables increase from 3% of generation to
more than 20% by 2040.
4 Limiting the temperature increase to 2°C requires the atmospheric CO2 concentration to be limited to
450 ppm.

The future of energy ▪ Power-to-gas 6
2. Electrification of transport
Figure 5: Global light duty vehicles sales by type in the 450 scenario [IEA 2015]
In the 450 Scenario, sales of electric vehicles (EV) cover more than 40% of total
passenger car worldwide sales in 2040, almost matching current total passenger car
sales.
While this shift in drive-train technology contributes modestly to carbon emissions
decrease before 2040, it creates the conditions for achieving the needed reductions
beyond 2040.
As the amount of biomass that can sustainably be made available for the production
of biofuels is limited, moving away from fossil fuels for the decarbonisation of transport
will require resorting to electricity as a secondary energy source. Fuelling transport with
electricity will require additional low carbon power generation, in an amount which
will strongly depend on the powertrain technologies mix.
According to [IEA 2015], assuming the prevalence of battery and fuel cell electric
drive trains for passenger vehicles (requiring significantly less electricity than internal
combustion engine vehicles powered by electricity-based synthetic fuels),
decarbonisation of transport entails an additional electricity consumption in EU-28 of
approximately 2,000 TWh beyond the current consumption levels for stationary
applications of 2,800 TWh.
2.1.2 Power-to-gas constitutes a cost-effective source of flexibility that can benefit
the energy system as a whole and help improve power generation economics
As illustrated by Figure 6, the substantial variable renewables power production
increase negatively impacts the operating conditions of the dispatchable power
generation capacity that is needed to maintain grid balance, putting at risk its
economic viability, as a result of:

The future of energy ▪ Power-to-gas 7
– sharp variations of residual load,
– periods of operation at very low load, potentially requiring curtailment
of renewable electricity
– degraded load factors.
Figure 6: Power consumption during two days in France in Jan and Feb 2013. Actual
VRE5 production on these days multiplied by 10 (source: Hinicio based on
data from RTE)
In this context, capacity remuneration mechanisms are being discussed as a means
to ensure the availability of the dispatchable generation capacity that is needed to
ensure the security of supply (power generation adequacy).
Consider now a further addition of variable renewable capacity in order to supply 50%
of the electricity needs of transport through power-to-gas consuming 20 GW on
average (i.e. electricity consumption increased by 1/3), potentially exacerbating the
systemic issues listed above.
However, the power-to-gas system can be operated in a way that strongly alleviates
most of these issues suffered in the pre-existing system: (i) residual load is smoothened
as the needed flexibility is mainly provided by demand response of the power-to- gas
systems and (ii) the load factor of dispatchable power is improved, supplying 50% of
the added electricity consumption.
This is illustrated by Figure 7, showing consumption and energy production profiles for
the studied configuration.
5 VRE: variable renewable energy
0
20 000
40 000
60 000
80 000
100 000
120 000
00
:00
01
:00
02
:00
03
:00
04
:00
05
:00
06
:00
07
:00
08
:00
09
:00
10
:00
11
:00
12
:00
13
:00
14
:00
15
:00
16
:00
17
:00
18
:00
19
:00
20
:00
21
:00
22
:00
23
:00
00
:00
01
:00
02
:00
03
:00
04
:00
05
:00
06
:00
07
:00
08
:00
09
:00
10
:00
11
:00
12
:00
13
:00
14
:00
15
:00
16
:00
17
:00
18
:00
19
:00
20
:00
21
:00
22
:00
23
:00
MW
Time (hour)
Consumption, VRE production an residual load - without PtoG
Residual load VRE production Consumption CR moyenne
Low loadfactor
Low minimumload

The future of energy ▪ Power-to-gas 8
Figure 7: Illustration of the potential impact of power-to-gas on compensating the
effects of intermittent power production on a 24-hour period (source:
Hinicio)
Figure 8: Corresponding power consumed by the electrolyser to mitigate variable
renewable power production on a 24-hour period (source: Hinicio)
Starting from the situation shown in Figure 7, the implementation of power-to-gas
results in an additional consumption of 20 GW, on average. Half of this is provided by
additional VRE. The other half is provided by the existing dispatchable capacity.
Power-to-gas load is adjusted to minimise fluctuations of residual load.
Thanks to the buffering capability provided by the gas supply chain, Power-to-gas
provides flexibility which is not constrained by energy end-use. Consequently, Power-
to-gas can help strongly reduce contingency of the load of dispatchable generation
on the fluctuating climatic conditions.
0
20 000
40 000
60 000
00
:00
01
:00
02
:00
03
:00
04
:00
05
:00
06
:00
07
:00
08
:00
09
:00
10
:00
11
:00
12
:00
13
:00
14
:00
15
:00
16
:00
17
:00
18
:00
19
:00
20
:00
21
:00
22
:00
23
:00
00
:00
01
:00
02
:00
03
:00
04
:00
05
:00
06
:00
07
:00
08
:00
09
:00
10
:00
11
:00
12
:00
13
:00
14
:00
15
:00
16
:00
17
:00
18
:00
19
:00
20
:00
21
:00
22
:00
23
:00
MW
Time (hour)
Power to H2
Power-to-H2 load - instantaneous Power-to-H2 load - average
0
20 000
40 000
60 000
80 000
100 000
120 0000
0:0
0
01
:00
02
:00
03
:00
04
:00
05
:00
06
:00
07
:00
08
:00
09
:00
10
:00
11
:00
12
:00
13
:00
14
:00
15
:00
16
:00
17
:00
18
:00
19
:00
20
:00
21
:00
22
:00
23
:00
00
:00
01
:00
02
:00
03
:00
04
:00
05
:00
06
:00
07
:00
08
:00
09
:00
10
:00
11
:00
12
:00
13
:00
14
:00
15
:00
16
:00
17
:00
18
:00
19
:00
20
:00
21
:00
22
:00
23
:00
MW
Time (hour)
Consumption, VRE production an residual load - with PtoG
New residual load VRE production Additional VRE
Mean resiudal load Consumption w/o PtoG Consuption with PtoG
Increased minimum load
LessVariation
Improvedload factor
0
20 000
40 000
60 000
00
:00
01
:00
02
:00
03
:00
04
:00
05
:00
06
:00
07
:00
08
:00
09
:00
10
:00
11
:00
12
:00
13
:00
14
:00
15
:00
16
:00
17
:00
18
:00
19
:00
20
:00
21
:00
22
:00
23
:00
00
:00
01
:00
02
:00
03
:00
04
:00
05
:00
06
:00
07
:00
08
:00
09
:00
10
:00
11
:00
12
:00
13
:00
14
:00
15
:00
16
:00
17
:00
18
:00
19
:00
20
:00
21
:00
22
:00
23
:00
MW
Time (hour)
Power to H2
Power-to-H2 load - instantaneous Power-to-H2 load - average
0
20 000
40 000
60 000
80 000
100 000
120 000
00
:00
01
:00
02
:00
03
:00
04
:00
05
:00
06
:00
07
:00
08
:00
09
:00
10
:00
11
:00
12
:00
13
:00
14
:00
15
:00
16
:00
17
:00
18
:00
19
:00
20
:00
21
:00
22
:00
23
:00
00
:00
01
:00
02
:00
03
:00
04
:00
05
:00
06
:00
07
:00
08
:00
09
:00
10
:00
11
:00
12
:00
13
:00
14
:00
15
:00
16
:00
17
:00
18
:00
19
:00
20
:00
21
:00
22
:00
23
:00
MW
Time (hour)
Consumption, VRE production an residual load - with PtoG
New residual load VRE production Additional VRE
Mean resiudal load Consumption w/o PtoG Consuption with PtoG
Increased minimum load
LessVariation
Improvedload factor

The future of energy ▪ Power-to-gas 9
Furthermore, the ability provided by power-to-gas to maintain production also helps
avoid curtailment of variable renewable energy production.
In 2014, in Germany, the volume of electricity (1.58 TWh) which had to be curtailed
almost tripled compared to the preceding year (0.55 TWh), and amounted to 1.16 %
of the renewable electricity production remunerated under the German Renewable
Energy Law (EEG, including direct marketing). As in previous years, wind power
accounted for 77.3 % of curtailed electricity and was thus, again, the renewable
power generation most affected in Germany. The number of PV installations affected
has also risen compared to the previous year (11.8 %) and now accounts for 15.5 % of
unused energy. 96 % of the curtailed electricity is located in the wind-rich northern
federal states, in particular Schleswig-Holstein.
Figure 9: Curtailed renewable electricity volumes in Germany (LBST based on
[BNetzA 2015] data)
One of the main reasons why a Power-to-gas system is well suited for providing
flexibility in comparison to power generation plants is that the cost of operating a
power-to-gas system at partial load (rather than full load, as reflected by the total unit
cost of the hydrogen generated) is fundamentally reduced by the fact that operating
only when electricity is abundant lowers the unit cost of the electricity consumed.
Indeed, as shown in Figure 10, the unit cost of the hydrogen produced can in this case
remain relatively unaffected by operation at partial load. This cost profile can help
provide flexibility at an intrinsically lower cost than that delivered by systems operating
at constant marginal cost, for which a reduction of load entails an increase of product
unit cost.
0.070.13
0.42 0.38
0.55
1.58
1.22
0.25
0.11
0.00
0.20
0.40
0.60
0.80
1.00
1.20
1.40
1.60
1.80
2009 2010 2011 2012 2013 2014
Cu
rtai
led
ele
ctri
city
(TW
h/a
)
Total
Wind Energy
Solar Energy
Biomass
LBST
, 20
15
-12
-04

The future of energy ▪ Power-to-gas 10
Figure 10: Total cost of hydrogen produced by a power-to-hydrogen system6
(source: Hinicio)
Due to the decrease of the average cost of electricity as the load factor decreases
(red curve), the total cost per kg of hydrogen (blue curve) is relatively constant down
to a load factor of 50%, in contrast to the case where the electricity cost does not
decrease with load (green curve).
In conclusion, conversion of power-to-hydrogen can not only support the
decarbonisation of transport via the implementation of decarbonised fuels (gaseous
or liquid), but also constitutes a cost effective source of flexibility benefiting the power
system as a whole and providing improved economics for power generation, thanks
to:
– improved load factors of dispatchable capacity and less curtailment of
variable renewable capacity;
– more predictable and smoother operation of dispatchable capacity.
The improved visibility on load could facilitate investment in the dispatchable
generation capacity that is needed to ensure power generation adequacy,
minimizing the need for capacity remuneration mechanisms.
6 assuming an installed electrolyser cost of 0.55 M€/MW at 2030 horizon, and the electricity price
duration data for France in 2014, including grid charges
0
10
20
30
40
50
60
2,0
2,5
3,0
3,5
4,0
4,5
5,0
0% 20% 40% 60% 80% 100%
Ele
ctri
city
co
st (
€/M
Wh
)
H2
co
st (
€/k
g H
2)
Load factor
H2 production cost in function of electrolyser load factor
H2 cost H2 cost w/constant elect. cost Avg elect. cost

The future of energy ▪ Power-to-gas 11
2.1.3 Power-to-gas can also help address balancing needs at short time scales
Flexibility resources are increasingly required at short timescale to compensate the
difference between forecasted and actual VRE production. This need is exacerbated
by the fact that the relative share in total production of the conventional power plants
that were until now providing the needed reserve capacity is decreasing.
Consequently, there is significant value to be tapped by being able to provide positive
or negative adjustment at very short notice. A flexible capacity can currently double
its revenues by going on the intraday (quarter hour) market, due to the high price
volatility [Lantrain 2015].
Water electrolysis, the technology at the centre of Power-to-gas converting electrical
energy into hydrogen, is very well suited for providing flexibility at short time scales.
While electrolysis has been implemented industrially for almost a century for the
production of hydrogen as a chemical, recent developments have focussed on
exploiting the technology’s potential with regards to energy efficiency and dynamic
response. The table below provides indications on the performance of the incumbent
Alkaline technology using a liquid electrolyte, and on the more recently developed
PEM technology using a solid electrolyte.
PEM technology has intrinsic advantages over Alkaline with regards to current density,
dynamic response, and operation at elevated pressure. The latter feature reduces the
amount of compression required downstream for storage and distribution.
Furthermore, the possibility for a PEM stack to operate at much higher current densities
than the nominal value (which provides the targeted energy efficiency) allows the
stack to be operates momentarily at a peak load which may be as high as 200% of
nominal load. This is a key advantage for offering primary frequency control services
requiring load to be instantaneously turned up or down from the point of normal
operation.
With regards to cost, PEM technology offers very significant cost reduction potential
as it is at the beginning of its development curve. An additional factor is that
manufacturing of the electrolyser stack can be addressed by planar technologies, a
configuration that is favourable for cost reduction as observed for other devices where
planar manufacturing technologies are applied, such as PV solar panels.

The future of energy ▪ Power-to-gas 12
Table 1: Characteristics of PEM and Alkaline electrolysers (source: Hinicio)
Alkaline PEM
Development stage Industrial since 1920s Early stage
commercialization
Maximum capacity
Unit: 3.8 MW/67,7 kg/h
Plant: 100 MW/1900 kg/h
(Zimbabwe)
6 MW/ 120 kg/h
(3 x 2 MW pilot unit)
Current density Up to 0.4 A/cm2
Up to 2 A/cm2
(R&D: 3.2 A cm-2 at 1.8 V at
90oC)7
Dynamic response Less than one minute Within seconds
Peak load 100% 200% (30 min)
Turn down 20 – 40 % <10 %
Operating pressure (typical) A few bars Tens of bars
Investment costs (incl.
installation) 1.1 M€/MW [Stolzenberg
2013] 1.9 M€/MW [FCH JU 2014]
Operating cost 5 - 7 % 4 %
In conclusion, through the combination of high flexibility and large storage capacity,
Power-to-Gas can support balancing at any time scale, from supply of primary reserve
to seasonal storage (with underground storage.) The capability to provide such a wide
range of services further contributes to this function’s cost effectiveness.
2.1.4 Power-to-gas can support the integration of renewables at any point in the
T&D system
As electrolysis technology is highly scalable, power-to-gas can be applied at the scale
that is the most appropriate for addressing particular needs of the hydrogen
application, e.g. fuelling transport in a given area, or the grid balancing needs, e.g.
restoring balance between local electricity consumption and local production
following the addition of VRE generation capacity, reducing the need for grid
expansion.
The latter situation can be expected to be increasingly common as renewable power
capacities are mainly connected to the distribution grid (see Figure 11), which is where
generation capacity addition has the greatest likelihood of resulting in situations where
local production exceeds local consumption.
7 Results of FCH JU funded ElectroHyPem project

The future of energy ▪ Power-to-gas 13
Figure 11: Renewable power capacities connected to the grid in Germany as per July
2014 (source: LBST based on data from energymap.info)
Power-to-gas provides a unique way of achieving balance when average local
production exceeds local average consumption. Indeed, in this case, other flexibility
options such as reversible storage or demand response, which only provide time-shift,
will not allow to restore balance between production and consumption.
Figure 12 illustrates the increasing scale at which power-to-gas projects have been
implemented in the past years, with a relatively balanced deployment of PEM and
alkaline technology in the recent years.
Figure 12: Installed capacity of power-to-gas pilot plants – (source: Hinicio from
[Gahleitner 2013])
0 10000 20000 30000 40000
Low voltage (230/400 V)
MV/LV
Medium voltage (20 kV)
HV/MV
High voltage (110 kV)
VHV/HV
Very high voltage (220/380 kV)
Geothermal Gases Biomass Hydro power Wind power Solar power
Transmission
Distribution
Installed Capacities[MW]
Imag
e: L
BST
, 2014
Dat
a: e
ner
gym
ap.in
fo, 2
014-0
7-2
3
1
10
100
1.000
10.000
2002 2004 2006 2008 2010 2012 2014 2016 2018
Ele
ctro
lyse
r p
ow
er
(kW
)
Year
projets électrolyse alcaline projets électrolyse PEMAlkaline PEM

The future of energy ▪ Power-to-gas 14
Figure 13 illustrates the implementation of power-to-hydrogen systems, including the
hydrogen distribution infrastructure, at different size scales.
In the “on-site” case, the power-to-hydrogen system is dedicated to the production
of hydrogen for a given application on the same location, eliminating the need to
transport the hydrogen.
In the “centralised” case, power-to-hydrogen addressing the needs of hydrogen over
a relatively large geographic area for a relatively large number of points of use,
implying hydrogen transportation over distances which may reach hundreds of km.
While this entails relatively high transportation costs (transportation over 300 km adds
a cost that is roughly equal to the total costs of production and conditioning), the
centralised configuration not only provides economies of scale, but also facilitates the
provision of grid-services and the selection of an optimal location with regards to
interfacing with the electrical and natural gas grids. It is to be noted that hydrogen is
currently typically delivered over such large distances from a limited number of trailer
filling facilities in each country.
The semi-centralised case, where the power-to-hydrogen system addresses needs in
a radius not exceeding 50 km, limits the cost of transportation, but still provides
economies of scale and the possibility of choosing an optimal location for the system
to interface with the electricity and gas infrastructure. With the development of
hydrogen mobility, such a coverage could be optimal, as a 1 MW system allows to fuel
a fleet of about 100 fuel cell electric vehicles8.
In the case hydrogen is not used as such, the function of the power-to-gas system is
only to allow transfer of energy from the electric grid to the natural gas grid. While this
can very effectively support grid balancing, creating the conditions of an
economically balanced business case is more challenging, mainly due to the fact that
the market value of the input (electricity) is higher on average than that of the output
(gas in the natural gas grid).
8 Consuming each 1 kg H2/100 km and driving 15 000 km/yr, assuming an electrolyser energy consumption
of 50 kWh/kg H2.

The future of energy ▪ Power-to-gas 15
Figure 13: Illustration of various power-to-hydrogen configurations (source: Hinicio)
2.1.5 Hydrogen injection into the natural gas grid enhances a power-to-Gas
system’s ability to provide grid services
While there is less value to be tapped from injecting hydrogen into the natural gas grid
than providing hydrogen to the market, this outlet has the advantage of allowing
electrolysis operation to be steered by the provision of balancing services to the grid,
even if the electrolyser’s production capacity exceeds local market demand for
hydrogen, providing additional value.
Direct injection is the most cost effective way to “dump” hydrogen from excess RE into
the gas grid. In this case, hydrogen is blended with natural gas in controlled conditions
to ensure that the natural gas meets the required specifications, especially in terms of
heating value, density, and Wobbe index9.
Depending on the origin of the natural gas, generic natural gas specifications can be
met despite hydrogen contents of up to 15% in volume [DVGW 2011].
However, some gas users have stricter constraints. This is the case for instance for
power plants, where gas turbines are calibrated for a specific heating value, as well
as natural gas vehicles, for which the hydrogen content is limited to the maximum
value considered for the homologation of the on-board CNG fuel tank, which may be
as low as 2 vol-% according to UNECE R110.
9 The Wobbe index is used to compare the combustion energy output of different composition fuel gases
in an appliance (fire, cooker etc.). If two fuels have identical Wobbe Indices then for given pressure and
valve settings the energy output will also be identical.- source Wikipedia

The future of energy ▪ Power-to-gas 16
Also stricter limits may be specified for particular natural gas infrastructure sub-systems,
such as compression stations on the transmission grid, or underground storage facilities.
Therefore, the concentration limits applicable for direct injection of hydrogen into the
natural gas network today need to be determined on a case-by-case basis.
Conversion of hydrogen into synthetic methane prior to injection by combination with
CO2, as step called methanation, eliminates the limit on blending concentration, as
methane can be mixed in any proportion with natural gas without impact on
downstream applications.
This step requires a concentrated CO2 source and introduces additional equipment
costs and energy losses, with a negative impact on the economic justification of
injection of gas derived from electricity into the gas grid. On the up-side, there are
potential synergies with the CO2 generating process to be exploited, as the
methanation process is exothermal.
2.2 Regulatory framework
2.2.1 Policy targets
The implementation of power-to-hydrogen can help address a variety of climate
related objectives:
Reduction of greenhouse gas emissions in transport thanks to the use of low
carbon primary energies, either through reduction of the carbon content of
liquid fuels by use of power based (rather than fossil energy based) feed-stock
for the production of these fuels, or through the implementation of new low
carbon energy carriers such as electricity, hydrogen or electricity-based
methane, which typically requires also a change of drive train technology and
distribution infrastructure
Increase of the share of renewable energies, by facilitating the integration of
variable renewables without compromising power system reliability
Reduce energy consumption by supporting the shift to electric powertrains in
ground transport which are more energy efficient than internal combustion
based powertrains
Power-to-gas is consequently supported by various European and associated national
energy policy targets, presented in Table 2, including those laid out by the Fuel Quality
Directive and the Renewable Energy Directive.
The Fuel Quality Directive is presented in further detail in the following section.

The future of energy ▪ Power-to-gas 17
Table 2: Environmental policy targets in France, Germany and international
(amended from [MFS 2015])
Topic Sector World EU France Germany
Greenhouse
gases
All
sectors
< 2°C
(COP21
)
2020: -20%1990
2030: -40%1990
2030*: -
30%1990
2040: -60%1990
2050: -80/-95
%1990
2030: -
40%1990
2050: -
75%1990
2020: -40%1990
2030: -55%1990
2040: -70%1990
2050: -80/-
95%1990
Transport
2020: -6%2010
(FQD)
2050: -60%2010
(COM 2011
144)
2020: -
10%2010
2028: -
22%2013
2050: -
70%2013
2015: -3.5% 2010
2017: -4% 2010
2020: -6%2010
(BImSchG)
Renewable
energy
All
sectors
2020: 20%
2030: 27%
2020: 23%
2030: 32%
2020: 18%
2030: 30%
2040: 45%
2050: 60%
Electricity
2020: 35%
2030: 50%
2040: 65%
2050: 80%
(EEG 2012)
Transport 2020: 10%
(RED)
2020: 10%
2030: 15%
Energy
consumption
All
sectors
2020: -20%1990
(COM 2011
112)
2030: -27%1990
2030: -
20%2012
2050: -
50%2012
2020: -20%2008
2030: /
2040: /
2050: -50%2008
Transport
2030: -
30%2012 fossil
energy
2020: -10%2008
2030: /
2040: /
2050: -40%2008
SOURCES
[EC-144 2011]
[EC-112 2011]
[loi 2011-12]
[loi 2015-992]
[Code de
l’énergie] [Energiekonzept 2010]
* 2030 without EU-ETS

The future of energy ▪ Power-to-gas 18
2.2.2 EU
Fuel Quality Directive (FQD)
Article 7a 2.a of the Fuel Quality Directive (FQD, 2009/30/EG) defines the following
greenhouse gas (GHG) emission reduction targets for the supply of energy for road
vehicles, non-road mobile machinery, including inland waterway vessels, agricultural
or forestry tractors as well as recreational craft:
2 % by 2015
4 % by 2017
6 % by 2020
By 2020, a 10 % GHG emission reduction has to be achieved compared to a 2010 fossil
fuel baseline standard of 94.1 g CO2equiv./MJ which is defined in Annex II (2015/652/EU).
However, only 6 % GHG emission reductions are mandatory. The remaining 4 % GHG
emission reduction is mentioned in the FQD preface only. Their fulfillment is thus not
binding for EU Member States. The 4 % may be achieved by purchasing credits under
the Clean Development Mechanism (CDM) of the Kyoto Protocol (2 %) and by using
carbon capture and storage (CCS) technology as well as electric vehicles (2 %).
Each Member State shall designate the supplier or the suppliers responsible for
monitoring and reporting the life-cycle GHG emissions of its supplied fuels (Article 7a
2.). The FQD allows pooling, i.e. that a group of suppliers may team up to jointly meet
the reduction obligation (Article 7a 4.).
The emission reduction targets can, in principle, be met with any technology capable
of reducing GHG emission. Hereto, the preface (9) explicitly mentions the use of
biofuels, alternative fuels as well as reductions in flaring and venting at production
sites. For alternative fuels to count towards this policy target, compliance with certain
sustainability criteria as depicted in the FQD Annexes must be given and certified. For
certain fossil fuels Upstream Emission Reductions (UERs) can also be used to fulfill the
reduction obligation (ANNEX I, 2015/652/EU).
FQD sustainability criteria for power-to-hydrogen are still to be implemented. The EU
project CertifHy10 is developing criteria for “sustainable” and “low carbon” guarantees
of origin (GoO) for hydrogen. The GoO concept may serve as a basis for EU
sustainability criteria for renewable hydrogen.
The GHG intensity of hydrogen fuel from electrolysis fully powered by non-biological
renewable energy for the use in a hydrogen fuel cell is 4 g CO2equiv/MJ. It is calculated
based on a life cycle GHG intensity of gaseous hydrogen (9.1 g CO2equiv/MJ) multiplied
by the so-called adjustment factor (AF) for powertrain efficiencies (0.4 for hydrogen
fuel cell electric powertrains). The GHG intensity for other hydrogen sources is listed in
Table 3.
10 http://www.certifhy.eu

The future of energy ▪ Power-to-gas 19
Table 3: Greenhouse gas intensities of hydrogen from various sources for use in fuel
cell electric vehicles based on FQD ANNEX I (2015/652/EU)
Hydrogen source EU default GHG
value well-to-tank
(g CO2equiv./MJ)
Adjustment factor
(AF) for fuel cell
electric vehicles
(ICE ≡ 1)
Resulting GHG
intensity relevant
for obligation
fulfilment
(g CO2equiv./MJ)
Natural gas 104.3 0.4 41.7
Coal 234.4 0.4 93.8
Coal with CCS 52.7 0.4 21.1
The FQD as per 2009 does not stipulate any consequences in case of non-compliance.
However, the new Council Directive (2015/652/EU) laying down methods and
reporting requirements pursuant to the FQD mentions penalties in case of non-
compliance. Article 6 requires Member States to lay down rules on penalties that are
effective, proportionate and dissuasive.
The FQD sets targets up to 2020. There is an ongoing wider EU debate on post-2020
targets. So far, the future of the FQD is open. In order to maintain investment certainty,
the bioenergy industry is pleading to continue the FQD beyond 2020 with minimum
targets not below 2020 levels.
Renewables Energy Directive (RED)
– 2009/28/EC, amended with 2015/652/EU
– 2020: 10 % of renewable energy in transport
– Use sustainable biofuels involving significant GHG reduction in
comparison with fossil fuels (35% nowadays to 60% in 2018)
2.2.3 Germany – National implementation of RED and FQD
On the national level, the FQD is implemented in the “Bundes-Immissionsschutzgesetz
– BimSchG” (Federal Immission Protection Law). Greenhouse gas emission reduction
targets for 2020 and intermediate targets for 2015 and 2017 are defined in §37a
(BImSchG). Fulfilment is mandatory for fuel suppliers in Germany.
Until 2014 (including), suppliers were obliged to achieve certain biofuel shares for
target fulfilment (energy target) which were as following:
4.4 % (energy) biofuel share for diesel
2.8 % (energy) biofuel share for petrol
In total, a minimum share of at least 6.25 % of biofuels was mandatory for target
fulfilment.
Since 2015, GHG emission reduction targets replace the energy targets, in line with the
FQD’s emission-based target setting. The legally binding emission reduction targets for
suppliers in Germany are now:
3.5 % by 2015,
4 % by 2017 and

The future of energy ▪ Power-to-gas 20
6 % 2020.
The achieved emission reduction is calculated by subtracting the real GHG emission
of a given year from a reference value. The reference value is calculated by
multiplying the energy content of non-renewable petrol and diesel fuels (including
biofuels that are sold but do not meet sustainability criteria) with the base value (fossil
comparator) of 83.8 kg CO2-equivalent per Gigajoule (1).
(1) 𝑅𝑒𝑓𝑒𝑟𝑒𝑛𝑐𝑒 𝐺𝐻𝐺 𝑒𝑚𝑖𝑠𝑠𝑖𝑜𝑛 𝑣𝑎𝑙𝑢𝑒 = ∑ (𝑒𝑛𝑒𝑟𝑔𝑦 𝑜𝑓 𝑓𝑢𝑒𝑙 (𝑖))
𝑎𝑙𝑙 𝑓𝑢𝑒𝑙𝑠
𝑖=1
× 83.8 𝑘𝑔𝐶𝑂2𝑒𝑞𝑢𝑖𝑣.
𝐺𝐽
The real GHG emissions are calculated by multiplying the energy content of each
individual fuel with a fuel specific emission factor. The fuel specific emission factor is
defined in the sustainability certificate of each biofuel. Petrol, diesel and other not
eligible fuels are multiplied with the base value of 83.8 kg CO2-equivalent per
Gigajoule. The sum of all fuel GHG emissions equals the real GHG emission (2). The use
of company or other fuel specific emission factors is not included in the BImSchG.
(2) 𝑅𝑒𝑎𝑙 𝐺𝐻𝐺 𝑒𝑚𝑖𝑠𝑠𝑖𝑜𝑛𝑠 𝑣𝑎𝑙𝑢𝑒 = ∑ 𝑒𝑛𝑒𝑟𝑔𝑦 𝑜𝑓 𝑓𝑢𝑒𝑙 (𝑖) × 𝑒𝑚𝑖𝑠𝑠𝑖𝑜𝑛 𝑓𝑎𝑐𝑡𝑜𝑟 (𝑖)
𝑎𝑙𝑙 𝑓𝑢𝑒𝑙𝑠
𝑖=1
The spread (in kg CO2-equivalent) between the reference value and the real value
equals the achieved GHG emission reduction (3).
(3) 𝐸𝑚𝑖𝑠𝑠𝑖𝑜𝑛 𝑟𝑒𝑑𝑢𝑐𝑡𝑖𝑜𝑛 = 𝑅𝑒𝑓𝑒𝑟𝑒𝑛𝑐𝑒 𝐺𝐻𝐺 𝑒𝑚𝑖𝑠𝑠𝑖𝑜𝑛 𝑣𝑎𝑙𝑢𝑒 − 𝑅𝑒𝑎𝑙 𝐺𝐻𝐺 𝑒𝑚𝑖𝑠𝑠𝑖𝑜𝑛 𝑣𝑎𝑙𝑢𝑒
Emission reduction and energy tax obligation are bound together. Meaning, the
responsible entity for energy tax payments is automatically also the responsible entity
for fulfilling the emission reductions. In Germany, the energy tax on fuels is due at the
point where the fuel leaves the premises of the customs-approved fuel producer. This
is usually the refinery making it the tax debtor and thus the emission reduction
responsible entity to this end.
The emission reduction responsible entity can transfer the emission reduction to
another entity. However, the obligation to fulfil a certain emission reduction cannot be
transferred. Analogue to the EU FQD, the German BImSchG allows for two or more
suppliers to create a pool and jointly achieve the required reduction targets.
The reduction targets can be achieved by blending fossil fuels and biofuels (including
biomethane) or by the distribution of neat biofuels. Thus, as yet, electricity and other
alternative fuels, such as hydrogen, cannot be considered in the calculation of
emission reduction (§37a BImSchG) in Germany. The FQD as well as the BImSchG
mention renewable electricity and electricity-derived fuels as possibly eligible fuel.
However, to date, the required legal ordinance to enact this in Germany has not been
passed. §37d (2) of the BImSchG11 defines the possible scope of the legal ordinance.
Here the department being responsible for the ordinance is empowered to extend the
methodology of greenhouse gas emission calculation beyond biofuels – (silent)
agreement by the German Parliament provided – to possibly also include:
renewable electricity (point 11),
11 The legal permissibility for this short-cut procedure is called ”Verordnungsermächtigung”.

The future of energy ▪ Power-to-gas 21
further renewable fuels (point 12) and
additional measures for GHG mitigation (point 13).
The legal ordinance could be the vehicle to include renewable hydrogen used in
refineries in the list of eligible measures for the fulfilment of the greenhouse gas emission
reduction target for fuels.
If the required emission reductions are not achieved, a penalty has to be paid. The
penalty amounts to 0.47 €/kg of missed greenhouse gas emission reduction
(§37c BImSchG), i.e. 470 €/t CO2.
2.2.4 France – National implementation of RED and FQD
National implementation of RED and FQD
The Renewable Energy Directive and Fuel Quality Directives were transposed into
French law in September 2011 [2011-9]
It is to be noted that whereas the FQD strictly requires a 6% reduction in overall fuel
GHG emissions intensity by 2020 (the additional 4% objective being indicative -see
section 2.2.2), the reduction required by French regulation is 10%, taking as reference
the emissions intensity observed in the EU in 2010.
The more specific requirements relative to the renewable content of fuels (in RED) and
the reduction of the GHG emissions intensity of fuels (FQD) referred to, for France, in
[2011-11] are largely similar to those prescribed in the RED and FQD.
These requirements have since been integrated into the Code de l’Energie, a
structured compilation of the regulatory requirements applicable in the area of
energy. GHG emissions intensity reduction is covered by articles L641-7, L641-8 and
R641-12
The 10% GHG emissions intensity reduction requirement is broken down as follows:
6% reduction of the life cycle emissions of gasoline, diesel, and E85;
2% (indicative) through the use of electrical energy in any type of vehicle
(including off-road and non-land) or the use of any technology, including CCS,
reducing GHG emissions over the life cycle of the fuel or the energy used in the
vehicle;
2%(indicative) through the purchase of carbon credits.
Using hydrogen produced from low carbon electricity in refineries would contribute to
the 6% reduction of the life cycle emissions of gasoline diesel and E85. Therefore, in
the short term, providing green hydrogen to refineries would allow them to contribute
to this objective.
Article L641-8 of Code de l’Energie refers to the preparation of a ministerial decree
specifying the content of the annual report to be provided by fuel producers, the
methods to be applied for calculating the GHG emissions over the whole lifecycle of
the fuel, and the means of controlling the aforementioned calculation, however this
decree has not yet been published.

The future of energy ▪ Power-to-gas 22
It is to be noted that the implementing directive laying down at EU level calculation
methods and reporting requirements pursuant to the FQD (EU 2015/652) was only
enacted in April 2015, and that the member states have until 2017 to transpose it into
their regulation.
Loi de Transition Energétique (LTE)
The Loi de Transition Energétique pour la Croissance Verte [LTE 2015], which was voted
through in 2015, aims to provide France with the means to fight against climate
change, to preserve the environment and to reinforce its energy security whilst
maintaining competitive energy prices and guaranteeing energy access to all. To this
aim, the LTE sets legally binding strategic objectives at the 2050 horizon for GHG
emissions’ reduction, reducing final energy consumption, reducing fossil primary
energy, increasing the share of renewable energy and limiting the share of nuclear
power.
The LTE provides new policy tools, such as the low carbon strategy (SNBC) which sets
maximum emission levels for transport, energy production, agriculture and the
construction sector over the next fifteen years divided into three 5-year carbon
budgets. The SNBC will be regularly updated to guarantee that the 2020 and 2030
climate and energy objectives are met. Furthermore, the multiannual planning
procedure in the area of energy (which sets out government investment policy in the
energy sector) was modified to further its impact by bringing together electricity, gas
and heat under a single umbrella with five-year revision cycles. The main economic
instrument supporting the LTE is a new carbon tax for which prices have been set at 56
€/t in 2020 and 100 €/t in 2030.
The LTE emphasises the importance of developing clean transport to improve air
quality and achieve healthier living conditions. The fulfilment of this ambition is based
on the development of less polluting modes of transport, improving energy efficiency,
encouraging the deployment of renewable energies, reducing GHG emissions and
atmospheric pollution as well as measures aimed at improving air quality.
The means to tackle these issues in the transport sector include a series of compulsory
measures. By 2025, the national and local public administration light vehicles, light
commercial and heavy vehicles’ fleet must be composed of at least 50% low carbon
emission vehicles. By 2020, 50% of newly procured vehicles in public transport
companies with a fleet of more than 20 busses must be low emissions. At the same
time horizon, 10 % of all new vehicles purchases by taxi and car rental companies
operating a fleet of ten cars or more must be “low consumption” vehicles. Further
indicative incentives are proposed such as the creation of designated parking spots,
discounted motorway tariffs and lanes dedicated to low carbon vehicles. Cities are
given the possibility of restricting downtown access on the basis of vehicle emissions.
All the articles pertaining to transport within the LTE are technology neutral. Therefore,
the application decrees ought to apply to hydrogen.
Article 121 refers specifically to hydrogen use for energy storage. The LTE states that,
within 12 months from the date of implementation, the government will submit to
parliament a strategy for the development of decarbonised hydrogen storage for
renewable energy which will specifically present:

The future of energy ▪ Power-to-gas 23
1) The implementation of a business case for renewable electricity storage using
hydrogen, aiming to encourage renewable energy producers to contribute to
the availability and the implementation of the reserves required for reliable
operation of the public transport and distribution networks, as well as conditions
of remuneration of these services
2) Incentive measures aimed at promoting technological innovation, notably for
fuel cells, for the electric vehicle market
3) The deployment of a network of hydrogen refuelling stations
4) The changes of regulation required for allowing the deployment of these new
hydrogen applications, such as power-to-gas.
2.3 Power system
The key aspects of the French and German power system impacting economic
balance of a Power-to-gas system are described hereafter.
2.3.1 Cost structure of electricity
France
In France, like in many countries, the price of electricity to the end-user is composed
of three parts: the cost of electricity production (including management and
marketing costs), the cost of electricity transportation and taxes.
In France, for many end users, the price per kWh (or tariff) of electricity is regulated,
set upon government decision, as is the price of electricity transport. The level of these
power consumption tariffs are set so as to ensure that the price of electricity covers
the costs of the electricity system. For example, the grid fee tariff at level which covers
the actual transport costs and reimburses the grid operators’ investment costs. The
Commission de Régulation de l’Energie (CRE) calculates these costs. Annually, the
CRE provides the government with recommendations as to the rate to set. Thereafter,
the government modifies these rates.
Whereas, before 2016, all users could benefit from a government-set per kilowatt hour
price of electricity, today, consumers with power subscriptions below 36 kVA may
choose whether they wish to purchase electricity at the regulated tariff (provided by
EDF) or at a different price set by market conditions (via an alternative electricity
provider). For consumers subscribing to more than 36 kVA, the price of electricity is set
by the market.
The power transport costs are covered by a grid fee: the Tarif d’Utilisation des Réseaux
Publics d’Electricité (Tariff for the use of public electricity networks) or TURPE.
The TURPE is based upon 4 guiding principles:
1) The tariff is the same for the entire national territory;
2) The tariff is independent of the distance covered between the point of injection
and the point of withdrawal;

The future of energy ▪ Power-to-gas 24
3) The tariff depends upon the supply voltage, subscribed power and withdrawn
energy;
4) For some versions of the TURPE, the tariff varies depending on the season, day
of the week and/or hour of the day.
The third price component are taxes. Until recently, electricity taxes were: the CSPE,
the TCFE, the CTA and (for non-professional customers) VAT (for an overview of each
tax see Table 4). However, following the promulgation of the LTE, energy fiscal policy
is being reformed. A carbon price will be integrated into the tax on the final
consumption of energy (TCFE). Also, the CSPE will be integrated to the TCFE. Although
the main elements of energy fiscal reform are known, the application decrees which
define the detailed modifications and applications have, as yet, not been published.
Therefore, the taxes and rates which are being presented are based on best available
data, but may not be representative of future conditions.
Table 4: Characteristics of electricity tariffs and taxes in France
Component Explanation
CSPE (Contribution
to the social use of
public energy)
The CSPE is a levy which covers the costs of Feed-in-tariffs for
renewable energy production, the reduced social tariff for
low income individuals, and ensures that the per kWh price
of electricity is the same for all individual consumers who live
in French territories which are not connected to the main
electricity grid. Its per MWh rate is fixed by the French
government.
CTA (contribution to
the transport tariff)
The CTA finances electric and gas industries employee
pensions. The CTA is a lump sum levy which varies
depending on the subscribed power, the type of meter…
and is additional to the cost of subscription.
TCFE (Tax on the
final consumption
of electricity)
The TCFE is a tax on power consumption. It is collected by
electricity providers and redistributed to the departmental
and communal public bodies. Its rate therefore depends on
local conditions and is re-evaluated on an annual basis.
TURPE (tariff for the
use of electricity
networks)
The TURPE covers the network running and investment costs.
It is paid by all consumers. Its rate depends largely on the
supply voltage, the contracted power capacity and the
amount of energy actually consumed. There are several
TURPE tariff options some to provide additional services (such
as emergency support) or the possibility of subscribing to a
tariff which varies depending on the time (season, day, hour
in the day) when the consumer uses the network.
VAT For individual consumers, VAT is reduced to 14% on the price
of the subscription, but is at 21% for the electricity consumed.
Non-residential consumers are exonerated from VAT.
The majority of consumers are subject to these taxes. However, highly energy intensive
companies subject to international competition can benefit from tax reductions and

The future of energy ▪ Power-to-gas 25
exonerations under the électro-intensif regime. The eligibility conditions for this status
and its associated tax and grid tariff exemptions will be presented in section Grid fees
and Taxes as they are particularly pertinent for the business case evaluation of Power-
to-gas in France.
Germany
The regulatory framework for electricity – as part of the energy sector – is very complex.
Figure 13 gives a schematic overview over acts and ordinances that have been put
in place over time to implement the energy concept of the German federal
government.
Figure 14: Federal regulatory framework for energy in Germany [BMWi 2014]
Elements of this complex Figure 14 are discussed in this study as far as relevant to the
business cases analysed in chapter 0. It has to be noted, that the regulatory framework
has been developing and regularly changing in the course of the past 20+ years of

The future of energy ▪ Power-to-gas 26
“Energiewende” (energy transition) and the lessons-learnt from that. It can be
expected that further significant adaptations are to be made within the next 5 to 10
years. This makes energy regulatory a volatile, moving target, which has strong
repercussions on the robustness of business model results. To get a methodological grip
on these uncertainties, transparency is given by depicting the relevant cost/price
components in the business models.
With regard to fees and taxes that are due when consuming electricity, Table 5 and
Table 6 give an overview over relevant regulations in Germany.
Table 5: Characteristics of fees and taxes in price components (Source:
netztransparenz.de)
Component Explanation
EEG-Appropriation The EEG-appropriation results from the compensation and
market premiums that must be payed to the network
suppliers by the energy providers.
Network use fees Fees for network use (Network infrastructure, Energy
transport loses) that are charged by the energy providers
are dependent on the amount of voltage used by the
network providers.
KWK-Appropriation
(cogeneration)
Nationwide balance with regard to the payment from the
KWK-surcharges (to promote the coupling of power and
heat) through the network provider (surcharge on the NNE).
Offshore-
Appropriation
Results from the damage reimbursement payed to the
suppliers of Offshore energy for disruption of network
connectivity which can be charged to the network
providers.
StromNEV
§19 Appropriation
Lost revenues from the network provider resulting from
individual network fees. Nationwide distribution.
Concession fee Fees for use of public transit for the construction and
distribution of electrical wires, with the respective municipal
consent on delivery rates to be payed to the municipalities.
Supply
management
Reduction of the RES-/cogeneration-supply resulting from
network overload is to be compensated by the energy
suppliers. Costs can be re-directed to the network
consumers. Without nationwide distribution.
Costs according to
§ 10 SysStabV
Upgrades to solar panels, to be provided by network
distributors – up to 50% of the associated costs re-directed to
the network consumers, without nationwide distribution.
Electricity tax Taxation of electrical energy consumption in German tax
regions. The tax is applied when an end consumer extracts
energy from a tax region resident supplier’s energy supply.

The future of energy ▪ Power-to-gas 27
Table 6: Legal basis
Component Legal basis
EEG-Appropriation § 60 Paragraph 1 EEG 2014 (Erneuerbare-Energien-Gesetz
from 21 Juli 2014 (BGBl. I, p1066)), previously changed
through Article 1 in the law from 22 December 2014 (BGBl. I,
p2406). Implementation: § 3 Paragraph 3 and 4 plus § 6
AusglMechV. In a separate regulation according to § 91 no.
7 EEG 2014 is controlled by self-powered energy generation.
Network use fees Regulations for charges for the access to electricity supply
networks (StromNEV) from 25 July 2005 (BGBl. I, p2225),
previously changed through Article 312 in the regulations
from 31 August 2015 (BGBl. I, p1474).
KWK-Appropriation § 9 Kraft-Wärme-Kopplungsgesetzes/KWKG from 19 March
2002 (BGBl. I, p1092), previously changed through Article 4
Paragraph 5, 7 of the law from 7 August 2013 (BGBl. I, p3154).
Offshore-
Appropriation
§ 17f EnWG (Energiewirtschaftsgesetz) from July 7, 2005
(BGBl. I, p1970, 3621), previously changed through Article 3
Paragraph 4 of the law from October 4, 2013 (BGBl. I, p3746).
StromNEV §19
Appropriation
The lost revenues are re-allocated to all end consumers
according to § 19 Paragraph 2 Sentence 14 StromNEV
corresponding to § 9 KWK-G.
Concession fee Concession fee regulations from January 9, 1992 (BGBl. I,
p12, 407), previously changed through Article 3 Paragraph 4
of the regulation from 1 November 2006 (BGBl. I, p2477) and
§ 48 EnWG.
Supply
management
§ 15 EEG 2014
Costs according to
§ 10 SysStabV
Costs according to § 10 of the system stability ordinance
(SysStabV) from 20 July 2012 (BGBl. I, page 1635), previously
changed through Article 1 of the regulation from 9 March
2015 (BGBl. I, p279).
Electricity tax § 5 Paragraph 1, p1, Stromsteuergesetz (StromStG) from 24
March 1999 (BGBl. I, p378; 2000 I, p147), previously changed
through Article 242 of the regulation from 31 August 2015
(BGBl. I, p1474).
Case-specific, different exemptions from taxes and fees apply to reduce the electricity
costs. These cost items for electricity supply are thus described in the following
chapters 2.3.1, 2.3.2, and 3.3.3.

The future of energy ▪ Power-to-gas 28
2.3.2 Provision of ancillary grid services and associated revenue
Provision of services to the power grid can constitute a significant part of the revenues
of a power-to-gas system. The revenue prospects and conditions for becoming and
actor on this market are described below for France and Germany respectively.
France
In France the Transmission System’s Operator (TSO), RTE, has the obligation to ensure
the equilibrium between offer and demand, the quality of electricity, its availability
and the security of the network. To do so, RTE relies on system services. There are two
types of system services: the regulation of frequency and the regulation of tension.
Both frequency and tension must be maintained at a given level (or within a given
bandwidth) for electrical equipment to function optimally, to ensure offer and
demand equilibrium at all times and to guarantee the security of the network.
Hereafter, only frequency services will be discussed as it is the only system service the
semi-centralised power-to-hydrogen system is eligible to.
To guarantee balance at all times between electricity production and consumption,
RTE has three reserves at its disposal: the primary reserve, the secondary reserve and
the tertiary reserve (also known as the adjustment mechanism). RTE can either use the
reserves to inject or to withdraw power from the grid. RTE draws upon these reserves
as needed depending on the circumstances of disequilibrium. As a result, the required
capacity volumes are different as are the actors which may contribute to these
reserves. Lastly, prices on the primary and secondary reserves are not set in the same
way as they are on the tertiary reserve. In this section, first, the use of each reserve
will be presented as will its capacity requirements for France. Thereafter, who can
contribute to the primary reserves and how they are remunerated will be presented.
The secondary capacity market for primary and secondary reserves which was
introduced in 2014 will also be presented. Finally, we shall present the actors eligible to
provide capacity in the tertiary reserve and how prices are set. This will allow us to
explain the services the electrolyser can contribute to.
For any disequilibrium within a 15-minutes timeframe, frequency is regulated
automatically, within the 15 to 30 seconds following instability, via the primary reserve
which is connected to the European Synchronous Continental plate.
Set at European level, the primary reserve levels must reach 3 000 MW; France being
responsible of guaranteeing 600 MW.
The primary reserve is activated temporarily (for a maximum of 15 minutes) to restore
equilibrium as soon as unbalance appears, providing time for the activation of
secondary reserves which are needed for restoring nominal frequency and for
providing the required adjustment as long as needed. For longer disruptions, tertiary
reserve is activated in order to restore the availability of secondary reserve for
addressing new potential sources of unbalance.
In France, the secondary reserve power capacity requirement varies depending on
the time of day and year from 500 MW up to 1500 MW. It is calculated on a half hourly
basis. Both primary and secondary reserves are automatically activated.
Tertiary reserve capacity is composed of two lots: one mobilisable within 15 minutes
and the other within 30 minutes. The required capacity for each of these lots varies on

The future of energy ▪ Power-to-gas 29
an annual basis. On average, the 15-minute reserve capacity amounts to 1000 MW
and the second to 500 MW.
In France, two types of actors contribute to the primary and secondary reserves:
obligated actors and voluntary actors. All power generation units connected to the
high frequency network must contribute to the primary frequency reserves if their
capacity is beyond 40 MW for new plants and 120 for old units -i.e. built before the 30th
of December 1999. Equally, all power production units beyond 120 MW must
contribute to the secondary frequency reserve. However, non-obligated actors who
wish to contribute to the primary and secondary reserves may do so by entering a
contract with RTE. Whether obligated or contributing voluntarily to these reserves, the
Responsable de Réserve (hereafter ARP) enters a contractual relationship with RTE.
Irrespective of the obligatory or voluntary contribution, any actor must meet given
criteria to play a part on the primary and secondary reserve.
For both reserves, the Reserve Entity (ARP), must be able to provide a minimum of 1
MW for a half-hourly time frame. No one actor can contribute more than 150 MW
capacity to the primary reserve. The level of obligation is split amongst all contributors
to primary and secondary reserves depending on their production capacity.
Conditions for access to the tertiary reserve are different.
In July 2014, a secondary market for capacity withdrawal was set up on an
experimental basis. As a result, individual actors may bid their power on the primary
and secondary markets. Under these new rules, ARPs may fulfil their primary and
secondary reserve obligations by purchasing withdrawal capacity via over-the-
counter contracts. However, as this is an experimental scheme, the TSO has capped
the maximum amount of capacity which may be contracted by obligated actors.
Currently, only 80 MW capacity may be contracted. Furthermore, no given individual
obligated actor may contract more than 40 MW.
In the primary and secondary reserve, the price for capacity and power is fixed by the
TSO. In compensation for the provision of capacity, the TSO provides the ARPs with a
fixed compensation based on the capacity they offer and a fixed compensation for
the power they provided to restore equilibrium. The set price for capacity for 2016 is
9.098 € per MW per half hour or 18€ per MW per hour. If the capacity is called upon,
then the ARP receives an additional payment for the energy supplied which is set is
10.474 € per MWh [RTE 2015].
For the tertiary reserve, only actors with a capacity of minimum 10 MW may contribute
to the 15-minute reserve capacity. As of 2016, actors with a capacity between 1 MW
and 10 MW can contribute to the 30-minute tertiary reserve capacity [RTE 2015].
Providing capacity volumes for the tertiary reserve is voluntary. The required levels for
this reserve are set a year ahead of time via public tenders published in January.
Actors declare the amount of capacity they wish to provide (whether injector or
withdrawal or both) over the next year to the TSO and enter into a contractual
relationship. Thereafter, on a daily basis, the actor must provide the TSO with its
available capacity for either injection or withdrawal for the following day on a half-
hourly basis at one of the online desks at 16h, 22h and 23h on day-1. Power producers,
and power producers alone, must provide a production programme by 16h on day-
1. Within the day, until 21h, actors may modify the submitted capacity offer.

The future of energy ▪ Power-to-gas 30
The capacity offer is composed of a direction (injection or withdrawal), a validity
period and, eventually of a different price over six 4-hour time frames.
The TSO will evaluate the required capacity to ensure that frequency can be
regulated for any half-hour on its entire perimeter. The placed bids are then organised
following the economic optimum with the cheapest bids being called upon first, as
needed. Actors on the tertiary reserve are remunerated if their capacity is called upon
at the price they bid.
Table 7: Main characteristics of the French tertiary reserve (source: [RTE, 2015])
Product Tender
period
Minimum
lot size
Duration Compensation market
size 2013
Tertiary
reserve
daily +/- 1 MW four 6-
hour time
slots
pay-as-bid
(power and capacity
price)
?
Prices on the adjustment mechanism therefore depend on the type of imbalance and
whether the provided capacity is for injection or withdrawal. The figure below presents
the average price of capacity on the tertiary reserve market in France for injection
and withdrawal of power from 2012 to 2015.
Table 8: Average prices on the tertiary reserve in France from 2012 to 2015 (source:
http://clients.rte-
france.com/lang/fr/visiteurs/vie/mecanisme/histo/tendances.jsp)
(€/MWh) Tertiary reserve
positive negative
2012 51.687 39.522
2013 48.759 30.685
2014 38.383 30.889
2015 41.912 37.909
2030 * *
The semi-centralised power-to-hydrogen can provide system services both by selling
its adjustment capacity (withdrawal or injection by increasing or reducing load) on
the secondary frequency regulation market or by bidding its capacity (whether for
injection or withdrawal) onto the adjustment mechanism.
The first option would provide, a priori, both greater foresight and amounts of revenues
as prices are set in MW/hour. However, since this market is an over-the-counter market,
the price paid by ARP’s for withdrawal capacity is not readily available. Nonetheless,
seeing as frequency regulation services are remunerated on average 18 €/MW per
hour, it would be safe to assume that the contracted capacity price would be similar.

The future of energy ▪ Power-to-gas 31
The electrolyser, with its 1 MW capacity, could bid into the tertiary reserve. However,
in the context of this study, only the option to provide system services to the primary
and secondary reserves via the secondary market was taken into consideration as
calculating the French adjustment requirement needs for each half-hour of the year
was considered beyond the scope of this study.
Germany
Energy reserves [control power /operating reserve/controlling power range] are
required to keep current consumption and power supply in equilibrium at all times and
compensate for any deviations in the short term. The TSO (Transmission System
Operator) obtains [contracts] the used [required] energy reserves [control
power/operating reserve/controlling power range] on the open market. The
procurement of energy reserves [control power/operating reserve/controlling power
range] occurs through competitive bidding on a tender basis in the German control
power market with the participation of numerous suppliers (both power plant
generators and consumers).
To obtain access to the respective markets potential suppliers have to undergo a
technical prequalification. They must prove that they can guarantee the necessary
requirements to ensure the security of supply for the provision of one or more types of
energy reserves [control power/operating reserve/controlling power range]. For all
types of control energy prequalification is carried out exclusively by the TSO, in whose
control area the respective technical units are connected, regardless of the voltage
level grid.
In principle, all technical units which meet the prequalification requirements can
prequalify for participating in the balancing power market regardless of the
technology. This can include e.g. electric motors or electrolysers (PtG).
Revenues may be generated with power-to-gas plants through the provision of
ancillary grid services.
The national legal framework covers the control and balancing [imbalance] energy
in the Electricity Network Access Ordinance (StromNZV) as well as directly the Energy
Industry Law (EnWG). The Renewable Energy Law (EEG) lays down rules for the
participation of electricity generation plants based on renewable energies for
balancing energy markets.
The market regulations and conditions for access to the individual control
performance qualities are determined by the Federal Network Agency (resolutions BK
6-10-097, BK 6-10-098, BK 6-10-09, dated November 2015).
Table 9 gives an overview of the main currently applicable framework conditions.

The future of energy ▪ Power-to-gas 32
Table 9: German balancing power market conditions (Source: regelleistung.net)
Product12 Tender
period
Minimum
lot size
Duration Compensation market
size
2013
Primary
control
reserve
(PCR)
weekly 1 MW 1 week pay-as-bid
(power price)
n.a.
Secondary
control
reserve
(SCR)
weekly +/- 5 MW Mon-Fri:
8 – 20;
and
remaining
time
pay-as-bid
(power and working
price)
354
Mio. €
Minute
reserve
(MR)
daily +/- 5 MW six 4-hour
time slots
pay-as-bid
(power and working
price)
155
Mio. €
Based on the "The ordinance on Interruptible Load Agreements” (AbLaV), dated
28.12.2012, providers of dispatchable loads can be contractually bound for the
purpose of maintaining the network and system security. Interruptible loads are here
regarded as large/major consumption units which are connected to the high and
ultra-high voltage network (transmission grid). With these units, large amounts of
electricity are nearly constantly drawn and they can, upon notice, reduce their
consumption at short notice and for a pre-defined minimum duration. Products:
immediately interruptible loads and fast interruptible loads. The AbLaV is an instrument
for ensuring security of supply. The AbLaV as per 28 December 2012 (BGBl. I, p2998)
changed by Article 316 of the ordinance of 31.08.2015 (BGBl. I, p1474) is expected to
be prolonged until the 30 June 2016. A corresponding ordinance modifying the AbLaV
is currently in legislative procedure.
For the delivery of the required ancillary service inputs, the transmission system
operator (TSO) pays the providers appropriate remuneration according to contractual
arrangements. The investments into plant components needed in order to provide
ancillary services are borne by the supplier.
The regulatory framework with regard to fees/taxes and ancillary services has been
changing regularly over the past 10 years. Further changes in the governing regulatory
mechanisms are likely – including fundamental ones – with further deployment of
renewable power plants, additional electricity consumption for heat, transport, etc,
and not least with new integration options reaching technical maturity.

The future of energy ▪ Power-to-gas 33
For the power-to-gas business cases, relevant fees and taxes as well as potential
revenues from ancillary grid services are depicted in chapters 2.3.1. and 2.3.2.
Power-to-gas plants connected to the public grid13 may generate additional revenues
if tapping newly developing control power markets for ancillary grid services in
Germany.
The control power markets differentiate between positive control power (i.e. load
reduction), and negative control power (i.e. load increase).
From a technical point of view, the electrolyser 1 MW, 10 MW respectively, meets the
requirements of all types of control reserve (compare chapter 2.2.3). If necessary, the
PtG operator has to offer pooling with other technologies / provider. The offered
product size for all product types doesn’t have to be supplied by one single unit, but
can be achieved by so-called pooling of several units by a central location.
However, the provision of primary control reserve is carried out as a symmetrical
product that is both positive as well as negative control reserve has to be permanently
provided. Since PEM electrolysers can be operated at 150% to 200% of nominal load
for the duration required (30 minutes), the electrolyser will always be able to provide
power to the primary control reserve.
Secondary control reserve and the minute reserve are easier to be offered insofar as
positive and negative control reserve is separately tendered.
According to current rules and regulations, for both, the primary as well as the
secondary control reserve the tendering period is one week, so the operator has to
ensure provision for one week in the production period. The minute reserve is tendered
on every workday.
Provision of reserve control is reimbursed at performance price and in the case of
secondary control and minute reserve the additional request of this service is
reimbursed with a contract price. At first the bid prices of the tenderers are collected
for the performance price and sorted in ascending order. The award for the service
provision (power supply) will be made independently of the contract price, however
is pre-requisite for a possible service provision. For the tenderers being awarded the
service provision, offered contract prices are sorted in a way, that tenderer with low
contract prices win the bid at first.
As demand is difficult to predict, the amount of hydrogen produced in the control
reserve market is difficult to calculate in advance. This fact could be an obstacle to
possible supply contracts asking for a certain amount of production volume.
Revenue generated in the control reserve market depends decisively on the offered
performance price. If the performance price is low, the bidder will lose part of the
possible revenues. If the demand rate is too high, it can be that the bid will not be
rewarded at all.
With regards to the performance prices, there are extreme differences between the
types of control reserve, the months and years and the different product time slices. In
the table below you can see the annual total and the average performance prices
from the control reserve auctions.
13 Provision of ancillary grid services without connection to the public electricity grid is not possible.

The future of energy ▪ Power-to-gas 34
The following Table 10 depicts the average prices of different German balancing
power products.
Table 10: Average prices for balancing power in Germany (Source:
http://balancepower.de/regelleistung.html)
(€/MW) Secondary control reserve Minute reserve
positive negative positive negative
2012 21,900 100,120 5,370 26,610
2013 66,150 99,970 8,310 50,040
2014 65,830 43,410 4,640 33,780
2015 (01-09) 38,080 17,160 4,240 9,910
2030 * * * *
* No assumptions made as any assumption is highly speculative.
While Table 10 gives the annual average prices, it has to be noted that the intra-annual
volatility of balancing power prices is high. Furthermore, prices are sensitive to the
development of the regulatory framework, energy technology progress and not least
the market behavior of bidders.
In the past, the secondary control reserve market was the most attractive because of
the level of prices. Control reserve markets are subject to considerable fluctuations of
prices difficult to predict which have led to a low price level in the most recent past.
Increasing competitive pressure can lead to decreasing revenues for the tender as
well.

The future of energy ▪ Power-to-gas 35
3 DETAILED ANALYSIS AND COMPARISON OF SELECTED POWER-TO-GAS
APPLICATIONS FOR FRANCE AND GERMANY
Based on the study teams’ experience from earlier works in the power-to-gas field and
on current discussions and market developments, the study team has chosen two
applications with a significant potential to leverage the benefits of power-to-gas and
help the sector reach the economies of scale needed to reduce technology cost in
an accelerated way:
Application A: Green hydrogen for use in refineries (3.1)
Application B: Semi-centralised power-to-gas system supporting hydrogen
mobility - business case studies (3.3)
In particular, both applications bridge two sectors that until now have been addressed
separately: the power and the transport sector.
For both applications, the following elements will be reviewed in more detail and
compared for Germany and France.
Boundary conditions (energy system, infrastructure, policies, other);
Value chains and major stakeholders involved;
Requirements for an economically balanced operation;
Environmental benefits (focus on GHG emissions);
Deployment potential and (resulting) impact on addressing intermittency.
3.1 APPLICATION A: Hydrogen from power-to-gas for use in refineries
Refineries are major hydrogen consumers. Today, about 30% of global hydrogen
demand for industrial use is hydrogen in refineries. Quasi all of this hydrogen stems from
fossil sources. In the short term, there is an interesting potential to use large amounts of
‘green’ renewable hydrogen in refineries within the gasoline or diesel production
process, thus effectively reducing their specific greenhouse gas (GHG) emissions and
reducing specific electrolyser investments.
3.1.1 Regulatory framework
With regard to Application A, i.e. the use of green hydrogen in refineries, key regulatory
elements are the EU Fuel Quality Directive (FQD) and its national implementations in
France and Germany. In the chapter 2.2.4, details on the regulatory framework are
laid out. For a condensed overview and comparison of regulatory elements relevant
to the use of green hydrogen in refineries, selected aspects of the EU FQD, the German
BImSchG/V and French Code de l’énergie implementation are depicted in Table 11.

The future of energy ▪ Power-to-gas 36
Table 11: Overview regulatory framework EU FQD, German BImSchG/V and French
Code de l’énergie
Criteria EU
FQD
France
Code de l’énergie
Germany
BImSchG/V
Lifetime 2020 2020
GHG targets -2 % by 2015
-4 % by 2017
-6 % by 2020
-10% by 2020:
-3.5 % by 2015
-4 % by 2017
-6 % by 2020
Responsibility Supplier Energy tax
responsible entity
(usually the fuel
refinery)
Energy tax
responsible entity
(usually the fuel
refinery)
Options
upstream: Flaring/venting
Flaring/venting –
refinery: – Refinery GHG
emissions reduction
–
downstream: Biofuels and
alternative fuels
from non-biological
sources
Biofuels, electricity Biofuels
Hydrogen Eligible as
transportation fuel
21.1 – 93.8
g CO2equiv./MJ,
depending on
hydrogen source
(2015/652/EU,
ANNEX I)
Not for use in
refineries yet
H2 not yet eligible as
transportation fuel
Reduction of
refinery emissions
through use of low
carbon hydrogen is
eligible
H2 not yet eligible;
‘further renewable
fuels’ (e.g. PtG) and
‘other measures’
are subject to
enforcement of a
legal ordinance
(§37d (2), point 13
Infringement Subject to national
implementation,
which shall be
‘effective,
proportionate and
dissuasive’
Not yet defined 470 €/t CO2equiv.
Fuel baseline
standard 2010
94.1 g/MJ Not yet defined 83.8 g/MJ
With 470 €/t CO2equiv., the penalties for non-compliance are significant in Germany.
What might look excessive at first sight is in fact a necessary level of fines as

The future of energy ▪ Power-to-gas 37
greenhouse gas mitigation options related to renewable fuels and improved/novel
powertrains typically are in the order of many hundreds of Euros per ton of avoided
greenhouse gas emissions.
For the time being, there are no regulatory grounds for renewable hydrogen to be
used in refineries and accounted for in greenhouse gas emission reduction targets,
neither with the FQD, nor with the German BImSchG. For France, the French Code de
l’Energie does not specify eligible technologies; hydrogen may therefore be
considered as a possible option.
3.1.2 Refinery landscape
France
There are eight crude oil refineries currently operating in France, plus one in France
territory Martinique. Refinery installed capacity ranges from 4.9 to 12.2 million tons per
year. Major refinery operators and fuel distributors in France are Total and ExxonMobil.
Figure 15 depicts where refinery capacities are installed in France.
Atmospheric distillation capacity
[x 1000 tons/year]
(1) Raffinerie de Fos (Fos-sur-Mer)
(2) Raffinerie de Donges
(3) Raffinerie de la Mede
(4) Raffinerie de Feyzin
(5) Raffinerie de Normandie
(Gonfreville L’orcher)
(6) Raffinerie de Grandpuits
(7) Raffinerie de Lavéra
(8) Raffinerie de port-Jérôme-Gravenchon
Not on map:
Raffinerie des Antilles
(Fort-de-France, Martinique)
Total capacity: 68.4 million t/yr
Figure 15: Crude oil refineries in France (source: LBST based on [MEDDE 2015, no 14, fig
8] data)
According to [MEDDE 2015, no 11, fig 6] France imported in 2014 a total of 53.6 million
tons of crude oil. Key exporting countries to France were Saudi Arabia (11.1 million t or
20.7%), Kazakhstan (7.1 million t or 13.3%), Nigeria (6.1 million t or 11.4%), Russia (5.2
million t or 9.8%), Norway (4.3 million t or 8%), Algeria (3.7 million t or 6.9%), Angola (3.2

The future of energy ▪ Power-to-gas 38
million t or 5.9%), Libya (3.0 million t or 5.6%), Azerbaijan (2.6 million t or 4.8%), UK (1.4
million t or 2.5%), et al. (2.8 million t or 5.2%). Figure 16 depicts French crude oil origins
by world region.
Figure 16: Crude oil imports to France in 2014 in 1000 t/yr by world region (source: LBST
based on [MEDDE 2015, no 11, fig 6] data)
Germany
Currently, there are 12 refineries operating in Germany. The installed refinery capacity
ranges from 4.5 to 12 million tons per year. Figure 17 depicts the refineries, capacities
and their location in Germany.
Atmospheric distillation capacity (1) Raffinerie Heide
[x 1000 tons/year] (2) Shell Rheinland Raff. Wessling
(3) Shell Rheinland Raff. Godorf
(4) OMV Deutschland (Burghausen)
(5) Gunvor Raffinerie Ingolstadt
(6) Miro Karlsruhe
(7) Ruhr Oel (Gelsenkirchen)
(8) Bayernoil (Vohburg)
(9) Erdölraffinerie Emsland (Lingen)
(10) Total Raffinerie Mitteldeutschland
(Spergau)
(11) PCK Raffinerie Schwedt
(12) Elbe Mineralölwerk Harburg &
Holborn Europa Raffinerie
Total capacity: 103,4 million t/yr
Figure 17: Fuel refineries in Germany (source: LBST based on [MWV 2015] data)
15.0
12.811.9
7.7
5.90.5
Former Soviet Rep.
Middle East
Africa - subsahara
Africa - north
North Sea
Others
Crude oil exporters to France in 2014 [million tons per year]
LBST
, 20
15
-12
-03
53.8 milion t/a(2014)

The future of energy ▪ Power-to-gas 39
In 2014, Germany imported 89.4 million tons of crude oil. Key exporting countries to
Germany are Russia (30.0 million t or 33.6%), Norway (15.2 million t or 17.0%), Great
Britain (9.7 million t or 10.9%), Nigeria (7.1 million t or 8.0%), Kazakhstan (68 million t or
7.6%), Azerbaijan (4.1 million t or 4.6%), Algeria (3.6 million t or 4.1%), and Libya
(3.2 million t or 3.6%). Figure 18 depicts German crude oil origins by world region.
Figure 18: Crude oil imports to Germany in 2014 in million tons per year by world region
(source: LBST based on [MWV 2015] data)
Comparison
France and Germany are among the ‘top 5’ countries in Europe with regard to the
number of refineries and the total installed refinery capacity as Figure 19 shows.
41.1
16.5
15.2
11.3
2.72.6
0.0
CIS States
Africa
Europe (else)
European Union
America
Near East
Asia
Crude oil exporters to Germany in 2014 [million tons per year]
LBST
, 20
15
-12
-03
89.4 milion t/a(2014)

The future of energy ▪ Power-to-gas 40
Figure 19: Major refining and processing capacities in Europe (source: LBST based on
[E3M et al. 2015, p12] data)
Germany is the leading refinery location in Europe, by installed distillation capacity as
well as by the number of refineries installed in Germany, followed suit by Italy. Close to
the UK, France ranks fourth in Europe by number and capacity. Together, Germany
and France correspond to a share of 20 % capacity and 23 % of refineries in Europe.
Generally, there is a trade-off between costs and quality with crude-oil as refinery
feedstock. The processing of lower quality crude-oil requires a different refinery layout
than vice versa. Hence, the processes installed in refineries today have been
established and developed over decades and are fine-tuned to strike the balance of
costs versus feedstock quality. From Figure 20, it can be observed that a wide range
of crude-oil quality portfolios are used in European refineries. The average crude-oil
gravity is 36.1 API with an average sulphur content of 0.7 % by weight [EXERGIA et al.
2015, p167].

The future of energy ▪ Power-to-gas 41
Figure 20: Share of crude oil qualities in European refineries [EXERGIA et al. 2015, p166]
The crude-oil qualities processed in France (36.0 API gravity and 0.7 wt.-% sulphur on
average [EXERGIA et al. 2015, p167]) are very representative for the spectrum of
qualities processed in European refineries.
The crude-oil qualities processed in Germany tend to be on the lighter side with an
average of 37.3 API gravity and 0.5 wt.-% sulphur [EXERGIA et al. 2015, p167]. Some
85 % of crude-oil processed in Germany is of ‘sweet crude’ type, i.e. have an API
gravity greater 35 and sulphur content below 0.8 wt.-%. This leads to lower needs for
desulphurisation and upgrading compared with the majority of other EU Member
States. Only countries like Bulgaria, Denmark, Finland, Lithuania and Slovakia source
and process lighter crude-oils than Germany, whereas neighbouring countries Austria,
Italy and Poland process significantly heavier crude-oils.
The efforts for crude-oil processing are likely more pronouncedly rising in Germany than
in France in the future.
Figure 21 depicts the product portfolios of European refineries.

The future of energy ▪ Power-to-gas 42
Figure 21: European refineries’ product mixes (%, left scale) and diesel-to-petroleum
ratios (D/P, without unit, right scale) [EXERGIA et al. 2015, p170]
The product mix from European refineries is diesel oriented (31-49% diesel, 13-30%
gasoline, 1-12% kerosene – in % of total refinery output). There are only marginal
differences between the French and German refineries’ product mixes. Both are well
within the average of European refinery product mixes and are thus representative of
the European refining sector.
3.1.3 Hydrogen use in refineries
To produce gasoline, kerosene, and diesel from crude oil refining, hydrogen is required
in several processes. In this study the impact of substitution of hydrogen from natural
gas steam reforming by hydrogen from renewable electricity has been assessed.
Role of hydrogen in refineries
In refineries, hydrogen is produced as a by-product from the reformer/platformer and
from the Fluid Catalytic Cracking (FCC) process, and used to manage the sulphur,
benzene, and aromatic contents of the final products in processes like
desulphurisation and hydrotreating, and to convert heavy products to lighter products
via hydrocracking. However, the hydrogen from the FCC has not been taken into
account because it is used as fuel for heat supply within the refinery due to the
relatively low amount and low purity.
Each refinery is unique with regard to refinery design and applied processes. However,
typically there remains a lack of hydrogen supply (‘net H2 demand’) that is filled with
dedicated hydrogen production from natural gas via steam-methane reforming
(SMR).

The future of energy ▪ Power-to-gas 43
Net hydrogen demand from refineries increases with the density (API gravity) and
sulphur content of the crude oil. Furthermore, decreasing demand of heavy products
(HFO) and increasing demands of lighter products (gasoline, kerosene, diesel) result in
conversion of HFO in hydrocracking plants for which additional hydrogen is required.
Stricter emission standards are a driver for this, e.g. in maritime shipping.
France
From the capacity of the different refinery processes used in French crude oil refineries
indicated in [MEDDE 2015] and the specific hydrogen consumption and production of
these processes the net hydrogen demand can be calculated. The net hydrogen
demand of the refineries which has to be met by an additional hydrogen source such
as natural gas steam reforming is lower than the hydrogen production capacity
indicated in various literature sources (e.g. [DOE 2015]).
A synthetic ‘refinery France’ has been modelled. Figure 22 shows the various processes
for the ‘Refinery France’.
Figure 22: Synthetic refinery France (source: LBST refinery model)
For the average crude oil properties used in French refineries indicated in [Exergia et
al 2015] the amount of vacuum distillate is lower than the capacity of hydrocracking
Isomerization
HDS
HDS
Atm. residue: 29.1 Mt
Vaccuum residue
Visbreaker
FCC
Crude
oil
68.4 Mt
0.7% S
36 API
HydroCracker
H2
H2
Atm.distillation
Catalyticreformer
Reformatefractionation
and hydrogenation
H2
Diesel
Heavy naphtha
Light naphtha
Visbreaker
diesel
Diesel
Diesel/Lt.
heating oil
Gasoline
Visbreaker
kerosene
Kerosene
Isomerate
Isomerate
FCC naphtha
Alkylate
iC4/nC4
To naphtha HDS: 0.4 Mt
To kerosene HDS
To diesel HDS
Diesel
GasSep. plant
C4 & lighter
H2
C4 & lighter
C4 & lighter H2
Reformate
FCC naphtha
C3/iC4
C1/C2
Visbreaker
NaphthaLt. naphtha
Lt. naphtha
Heavy naphtha
Refinery France
HDS
H2H2S
C1/C2
H2S
H2S
Vacuumdistillation
HDS
H2H2SVacuum
distillate: 16.9 Mt
C4 & lighter: 0.2 Mt
C4 & lighter
Diesel/
lt. heating oil:
21.5 Mt
Gasoline:
14.9 Mt
Heavy fuel oil: 5.2 Mt
Claus plant
H2S
SHeavy fuel oil/
Feed bitumen plant: 6.9 Mt
C3
Kerosene10.5 Mt
(13.0 Mt)
6.4 Mt
(6.7 Mt)
5.3 Mt
7.9 Mt
0.9 Mt
17.6 Mt
0.4 Mt
LPG: 1.6 Mt Crude naphtha: 7.6 Mt
2.5 Mt
KeroseneJet fuel:
7.8 Mt
AlkylationAlklylate
iC4
1.4 Mt
1.1 Mt
ETBE: 0.1 Mt

The future of energy ▪ Power-to-gas 44
and fluid catalytic cracking (FCC) plants indicated in [MEDDE 2015] which could treat
this streams. Probably the capacity of the hydrocracking and FCC plants is adapted
for more flexible refinery operations varying crude oil qualities.
In this study the hydrogen demand has been calculated based upon the specific
hydrogen demand of the various processes (hydrocracking, FCC, vacuum distillate
desulphurization, middle distillate desulphurisation, and naphtha desulphurisation)
which depends on the sulphur content of the feedstock of these processes. The sulphur
content of the feedstock of these processes depends on the sulphur content of the
crude oil. According to [Exergia et al 2015] the average sulphur content of the crude
oil mix used in French refineries amounts to about 0.7% (mass). At the atmospheric
distillation and the vacuum distillation stage the sulphur is enriched in the heavier
fraction. The equations for calculation of the sulphur content of the different fractions
have been derived from [FZJ 1994].
Table 12 shows the hydrogen demand and supply of crude oil refineries.
Table 12: Hydrogen demand and production of French crude oil refineries (kt/yr)
Refinery process H2 demand H2 production Net H2 demand
Hydrocracking 220.3
Vacuum distillate desulfurisation 29.2
Middle distillate desulfurisation 48.9
Naphtha desulfurisation 21.7
FCC cracker - 0*
Catalytic reformer - 158.9
Total 320.1 158.9 161.3**
* Hydrogen from fluid catalytic cracking (FCC) plus other gases for heat supply
** Assumed to be supplied by steam-methane reformer (SMR)
In France, the net hydrogen input of crude oil refineries amounts to about 0.24% of the
crude oil input based on the mass of hydrogen and crude oil or about 0.66% based
on the lower heating value (LHV) of hydrogen and crude oil. As a result, an additional
hydrogen generation capacity of about 161 kt per year (or 204,600 Nm³/h) is required.
Since the equivalent full load period of crude oil refineries (and also steam methane
reforming plants) is lower than 8760 hours per year the annual hydrogen is slightly
lower.
Germany
Using the capacity of the different refinery processes used in German crude oil
refineries indicated in [MWV 2015] and the specific hydrogen consumption and
production of these processes, the net hydrogen demand can be calculated. The net
hydrogen demand of the refineries which has to be met by an additional hydrogen
source such as natural gas steam reforming is lower than the hydrogen production
capacity indicated in various literature sources (e.g. [DOE 2015]).
For the calculation of the hydrogen demand the same approach have been applied
as for France. The sulphur content of the crude oil used in German refineries amounts
to about 0.5% (mass) [Exergia et al 2015].

The future of energy ▪ Power-to-gas 45
In Germany there are also gasification plants which convert visbreaker residue to
synthesis gas which consists of hydrogen and carbon monoxide. The gasifiers are
located in Wesseling, Gelsenkirchen, and Spergau/Leuna. This hydrogen source has
not been taken into account because the hydrogen is used for processes outside the
refinery. Methanol synthesis plants are located onsite the gasification plants.
Furthermore, a part of the hydrogen from the gasification plant in Spergau is probably
sent to a hydrogen liquefaction plant with a capacity of 5 t of hydrogen per day at
the Leuna chemical complex.
Table 12 shows the hydrogen demand and supply of crude oil refineries.
Table 13: Hydrogen demand and production of German crude oil refineries (kt/yr)
Refinery process H2 demand H2 production Net H2 demand
Hydrocracking 327.2
Vacuum distillate
desulphurisation 22.3
Middle distillate desulphurisation 65.1
Naphtha desulphurisation 37.0
FCC cracker 0*
Catalytic reformer 307.7
Total 452.1 307.7 144.4**
* Hydrogen from fluid catalytic cracking (FCC) plus other gases for heat supply
** Assumed to be supplied by steam-methane reformer (SMR)
In Germany, the net hydrogen input of crude oil refineries amounts to about 0.14% of
the crude oil input based on the mass of hydrogen and crude oil or about 0.39% based
on the lower heating value of hydrogen and crude oil. As a result, an additional
hydrogen generation capacity of about 144 kt per year (or 183,200 Nm³/h) is required.
Since the equivalent full load period of crude oil refineries (and also steam methane
reforming plants) is lower than 8760 hours per year the annual hydrogen is slightly
lower.
LCA hydrogen pathways and use in refineries (per MJ fuel out)
Figure 23 depicts the calculation boundaries of main refinery inputs and outputs.

The future of energy ▪ Power-to-gas 46
Figure 23: Hydrogen sources and uses in refineries (source: LBST)
The net hydrogen demand is calculated from the balance of refinery internal
hydrogen streams:
Net H2 demand = H2 process sources – H2 process uses
Desulphurisation is a sensitive parameter to the net hydrogen demand in refining. By
tendency, the crude oil quality is further deteriorating (increasing sulphur content).
From the latest US EIA and IEA statistics it can be derived, that the share of
conventional crude oil in the world mix was about 84 % in 2005 (peak year of
conventional crudes). In 2014, the share of conventional crude oil was about 75 %. At
the same time, the overall amount of crude oil increased by about 8 million barrel per
day between 2005 and 2014. Furthermore, the demand for heavy fuel oils (HFO) is
prospectively decreasing due to the extension of maritime emission control areas
(ECAs) where fuel burn in ships is restricted to low-sulphur and higher-value fuels.
For the hydrogen supply, the following pathways have been investigated:
H2 from piped natural gas (fossil hydrogen reference)
H2 from renewable electricity (wind, solar)
Figure 24 and Figure 25 show schematics of the pathways for the supply of gasoline
and diesel including hydrogen supply from natural gas (fossil reference) and
renewable power, respectively.
Refinery
H2 Sources
Reformer/
Platformer
H2 Uses
Desulphurisation
Hydrotreating
Hydrocracking
Crude oil
H2
H2
Gasoline
Kerosene
Diesel
Other
LBST, 27.10.2015
Net H2 demand

The future of energy ▪ Power-to-gas 47
Figure 24: Schematic of the pathways for the supply of gasoline and diesel including
hydrogen supply from natural gas (fossil energy-based reference) (source:
LBST)
Figure 25: Schematic of the pathways for the supply of gasoline and diesel including
hydrogen supply from renewable electricity (source: LBST)
The greenhouse gas (GHG) emissions from the supply of natural gas in France (13.9 g
CO2 equivalent per MJ of natural gas) and Germany (14.0 g CO2 equivalent per MJ
of natural gas) have been derived from [Exergia et al 2015].
About 55.1 g CO2 per MJ of natural gas is generated by the combustion of natural
gas. The natural gas consumption of large natural gas steam reforming plants amounts
to 1.315 MJ per MJ of hydrogen based on the lower heating value [FW 1996] leading
to about 72.4 g CO2 per MJ of hydrogen (or 8.7 kg per t of hydrogen). Furthermore,
small amounts of CH4 (~0.016 g per MJ of hydrogen) are generated in the burner of
the steam reformer. Table 14 shows the greenhouse gas emissions from the supply of
hydrogen via natural gas steam reforming.
Extraction Transport Refuelling station
Steam reforming
H2
Natural gas
Extraction & processing Transport
Natural gas
Crude oil Crude oilGasolineDiesel
GasolineDiesel
Nat
ura
l gas
Cru
de
oil
DistributionRefinery
LBST
, 20
15
-12-
09
Electrolysis Compression & storage
Photovoltaic
Wind power
Extraction Transport Distribution Refuelling station
H2
H2Electricity
Electricity
Crude oil Crude oilGasolineDiesel
GasolineDiesel
Re
new
. ele
ctri
city
Cru
de
oil
RefineryLB
ST, 2
01
5-1
2-09

The future of energy ▪ Power-to-gas 48
Table 14: Greenhouse gas emissions from the supply of hydrogen via natural gas
steam-methane reforming
[g CO2 equivalent/MJH2] France Germany
Natural gas supply 18.3 18.4
Steam methane reforming 72.8 72.8
Total 91.1 91.3
The supply of hydrogen from natural gas steam methane reforming leads to about 91
g CO2 equivalent per MJ of hydrogen based on the lower heating value. The
greenhouse gas emissions from the supply of hydrogen via water electrolysis using
electricity from renewable energy source are zero.
The electricity requirement for hydrogen production via water electrolysis decreases
from 1.733 MJ per MJ of hydrogen based on the lower heating value today to 1.538 MJ
per MJ of hydrogen in 2020 and afterwards. Since the energy use from construction of
wind and photovoltaic power stations, electrolysers and vehicles have not been taken
into account the GHG emission from renewable hydrogen production is zero.
Table 15: Greenhouse gas emissions from the supply of hydrogen via water
electrolysis with renewable power (wind, PV)
[g CO2 equivalent/MJH2] France Germany
Renewable electricity 0 0
Hydrogen production 0 0
Total 0 0
The introduction of renewable hydrogen in the refinery decreases the greenhouse gas
emissions from crude oil refining. For the calculation of the impact of renewable
hydrogen, allocation by energy has been applied to allocate the greenhouse gas
emission savings to the different products of the refinery. Refinery products such as
gasoline, kerosene, and diesel have been considered for the allocation but not heavy
products like heavy fuel oil (HFO) and bitumen.
Figure 26 shows the impact of the substitution of hydrogen from natural gas steam
methane reforming by hydrogen from renewable electricity via water electrolysis. As
reference the fossil fuel comparator indicated in ANNEX II of the Fuel Quality Directive
[FQD 2015] has been used.

The future of energy ▪ Power-to-gas 49
Figure 26: Comparison of greenhouse gas emissions from the supply of gasoline,
kerosene, and diesel (source: LBST)
Compared to the fossil fuel comparator, the greenhouse emissions decrease by about
0.70% (France) or 0.45% (Germany) respectively. This represents about one tenth of the
FQD’s 6% greenhouse gas emission reduction required as a minimum for fuel supply by
2020.
It has been assumed that the electricity is derived from wind and photovoltaic power
plants nearby the refinery site. Until 2030, the costs of electricity from a mix of 60% wind
power (onshore) and 40% photovoltaic power based on the rated power decrease
from today about 0.073 €/kWh to about 0.066 €/kWh (France) or 0.075 €/kWh to 0.068
€/kWh (Germany) respectively.
The specific investment has been calculated based on a progress ratio of 0.87 and a
world market for electrolysis plants. Until 2025 the cost reduction for electrolysis plants
decreases at about 45% from today about 1320 €/kWe to about 730 €/kWe in 2025 and
about 550 €/kWe in 2030. For the calculation of the cumulative investment in France
and Germany until 2030 a logistic curve has been modelled for the installed capacity
over time. Figure 27 shows the development of installed capacity for electrolysis plants
at refineries.
94.1 93.4 93.7
0
10
20
30
40
50
60
70
80
90
100
Reference Renwable PtH2 Renwable PtH2
Fossil fuel comparator France Germany
GH
G (
g C
O2
eq
uiv
ale
nt/
MJ f
inal
fue
l) -0.70% -0.45%
LBST
, 20
15
-12
-15

The future of energy ▪ Power-to-gas 50
Figure 27: Development of the installed capacity of electrolysis plants in France and
Germany (source: LBST)
Table 16 show the costs of hydrogen from renewable electricity. The hydrogen plant
consists of the electrolysers, the hydrogen storage loading compressor, and the
hydrogen storage.
Table 16: Costs of hydrogen supply from renewable electricity
France (€/kg)
2015 >2030
Germany (€/kg)
2015 >2030
Electricity costs 4.24 3.42 4.39 3.54
Capital costs H2 plant 1.62 0.90 1.61 0.88
Maintenance H2 plant 1.26 0.73 1.26 0.72
Total 7.13 5.05 7.26 5.14
At a natural gas price of 0.03 € per kWh the costs for hydrogen from large scale natural
gas steam methane reforming amount to about 1.4 € per kg of hydrogen which has
been used as benchmark.
Figure 28 shows the cost of the supply of gasoline and diesel if hydrogen from natural
gas steam methane reforming is substituted by hydrogen from renewable electricity.
0
200
400
600
800
1,000
1,200
1,400
1,600
1,800
2,000
2015 2020 2025 2030
Inst
alle
d c
apac
ity
(MW
e)
Year
France
Germany

The future of energy ▪ Power-to-gas 51
Figure 28: Comparison of the costs for the supply of gasoline and diesel (source: LBST)
The costs for the production of gasoline, kerosene, and diesel will increase by about
0.8 ct per litre Diesel-equivalents (1.4%, France) and 0.5 ct per litre Diesel-equivalents
(0.9%, Germany) if hydrogen from natural gas steam methane reforming is substituted
by hydrogen from renewable electricity. The greenhouse gas abatement costs
amount to 331 (France) to 339 € (Germany) per t of CO2 equivalent. The import price
for gasoline and diesel indicated by [MWV 2015] has been used to calculate the price
of the mix of gasoline and diesel.
If greenhouse emission reduction at refinery site could be applied to partly fulfil the EU
Fuel Quality Directive less biofuel admixture would be required.
Further greenhouse gas emissions reduction can be achieved ‘upstream’ the refinery,
i.e. by the reduction of flaring and venting at the oil fields and export of the associated
gases, e.g. as liquefied natural gas (LNG) or gas-to-liquids (GTL). The use of hydrogen
from renewable electricity in fuel cell vehicles (FCEV) can substitute gasoline and
diesel vehicles and save greenhouse gas emissions from gasoline and diesel supply
and combustion. The production of synthetic gasoline and diesel from hydrogen from
renewable electricity (power-to-liquids) can substitute crude oil based gasoline and
diesel leading to specific high greenhouse gas emission reduction down to
approximately zero. A part of the refinery processes (distillation, hydrocracking) can
still be used as components of the power-to-liquids plant.
Scenarios for greenhouse gas mitigation, associated electricity demands and
cumulated investments
In the following, the greenhouse gas mitigation potential, electricity demands and
cumulated investments are calculated as sensitivities from the bandwidth of net
hydrogen demand in refineries in France and Germany substituted with hydrogen
produced from renewable electricity sources. As renewable electricity sources,
photovoltaics and wind power are assumed on a 40/60 basis (by installed capacities).
15.58 15.80 15.73
0
2
4
6
8
10
12
14
16
18
H2 from SMR Renwable PtH2 Renwable PtH2
Reference France Germany
Co
sts
(€/G
J fin
al f
ue
l)+1.4% +0.9%

The future of energy ▪ Power-to-gas 52
For this study, we calculate with onshore wind as a conservative assumption with
regard to siting/accessibility aspects and annual equivalent full load hours.
Figure 29: Sensitivity analysis of annual electricity systems full costs (y-axis) with
variable PV share (x-axis) and variable PV costs (red = baseline,
blue = -10% PV costs, green = -20% PV costs) [ISE 2013, p 31]
To give the 40/60 assumption some foundation, above-captioned Figure 29 shows that
a 40% share of installed PV capacities in a PV and wind power generation mix result in
somewhat minimum system full costs. The reason is that wind and PV electricity are
most complementary to each other at this ratio leading to minimum storage
requirement. However, the minima are quite flat, meaning that in practice also 30/70
or 50/50 mixes will give robust low system costs compared to PV dominant or wind
dominant deployments scenarios. This strain of analyses has been taken on board in
France, too, notable in [ADEME 2015].
The specific greenhouse gas emissions for per MJ of crude oil indicated in [Exergia et
al 2015] have been multiplied with the annual amount of crude oil throughput in
energy terms. The GHG emissions from crude oil refining amounts to about 4.3 MJ per
MJ of crude oil in France and to about 5.0 g per MJ of crude oil in Germany. The lower
heating value (LHV) of crude oil is assumed to be 42.6 MJ per kg. The equivalent full
load period amounted to about 6600 hours per year in France [CPDP 2015]. For
Germany it has been assumed that the equivalent full load period amounts to about
8300 hours per year as indicated in [FZJ 1994].
Table 17 gives the results for France and Germany for a scenario where all hydrogen
from SMR is substituted by hydrogen from renewable electricity.

The future of energy ▪ Power-to-gas 53
Table 17: Scenario results for hydrogen use in refineries in France and Germany
(source: LBST)
40 % PV : 60 % wind onshore
France Germany
Net H2 input per crude oil input 0.66 % (LHV) 0.39 % (LHV)
GHG mitigation of refinery emissions 1.33 Mt CO2eq/a 1.50 Mt CO2eq/a
14.1 % 7.2 %
H2 demand 4.06 TWhH2/a
122 ktH2/a
4.56 TWhH2/a
137 ktH2/a
Required electrolyser capacities 1.58 GWe 1.78 GWe
Electrolyser cost reduction 2025 45 %2015 45 %2015
Cumulated investments electrolysis
[€] 1.5 billion € 1.6 billion €
Electricity demand H2 production 6.24 TWhe/a 7.02 TWhe/a
Required RES plant capacities
Wind onshore
Photovoltaics
3.14 GWe
1.90 GWe
1.24 GWe
3.73 GWe
2.24 GWe
1.49 GWe
Cumulated investments RES plants 4.4 billion € 5.4 billion €
About 1.33 million t of CO2 emissions could be avoided in France if hydrogen from
natural gas steam reforming at refineries were substituted by hydrogen from water
electrolysis using renewable electricity. This can be compared with the CO2 emissions
of passenger vehicles. If the real world (not NEDC) gasoline consumption of a typical
C segment (e.g. Renault Mégane, VW Golf) passenger car is assumed to be 7 l of
gasoline per 100 km and the annual mileage is assumed to be 14,000 km per year,
about 2.31 t of CO2 per vehicle and year will be emitted (‘tank-to-wheel’)14. As a result,
the GHG emission savings from the substitution of hydrogen from natural gas steam
methane reforming would be the same as the tailpipe CO2 emissions of about 575,000
passenger cars. In case of a diesel fuelled C segment passenger vehicle with a real
world fuel consumption of about of 5.5 l of diesel equivalent the GHG emission savings
would be equivalent to 658,000 passenger cars in France15.
About 1.50 million t of CO2 emissions could be avoided in Germany if hydrogen from
natural gas steam reforming at refineries were substituted by hydrogen from water
electrolysis using renewable electricity. As a result, in Germany the GHG savings would
be the same as the removal of about 648,000 of gasoline fuelled C segment passenger
vehicles or about 740,000 of diesel fuelled C segment passenger vehicles from the
road.
Table 18 gives a summary overview over avoided greenhouse gas emission
equivalents in terms of C segment vehicles, differentiated by consumption (gasoline,
diesel) and location (France, Germany).
14 Gasoline: LHV = 43.2 MJ/kg; density = 0.745 MJ/l; combustion: 73.3 g CO2/MJ [JEC 2014]
15 Diesel: LHV = 43.13 MJ/kg; density = 0.832 kg/l; combustion: 73.2 g CO2/MJ [JEC 2014]

The future of energy ▪ Power-to-gas 54
Table 18: Avoided refinery GHG emissions expressed in passenger car uses per year
Segment Consumption France Germany
Numbers of ‘C segment’
cars (Renault Mégane,
VW Golf, …)
Gasoline car @7.0 l/100km 575,000 648,000
Diesel car @5.5 l/100km 658,000 740,000
The supply of green hydrogen to cover the net hydrogen demand in refineries reduces
refiners ‘gate-to-gate’ emissions by 14.1 % in France and 7.2 % in Germany
respectively. Introducing green hydrogen in refineries is thus a tangible action also with
regard to corporate social responsibility (CSR).
The investment for the electrolysis plant includes hydrogen storage which consists of
underground storage tubes (operated between 0.7 and 10 MPa) and a compressor
for loading of the hydrogen storage. Underground storage tubes are not location
specific as compared to e.g. hydrogen storage in underground salt caverns for which
suitable formations have to be available. With regard to the economics, underground
storage tubes are a conservative assumption.
The cumulated investments in renewable power and hydrogen production plants
needed to provide 100 % green hydrogen to cover the net hydrogen demand from
French and German refineries are 5.9 billion € and 7.0 billion €, respectively. While the
absolute investment volumes may sound excessive at first, they have to be put into
context. For example, in order to achieve the same annual greenhouse gas emission
reduction with electric vehicles (BEV, FCEV), some 19.5 billion € is needed (650,000
electric vehicles 30 k€/vehicle).
The use of green hydrogen in refineries corresponds to specific greenhouse gas
mitigation costs of 331 €/t CO2eq and 339 €/t CO2eq in the France and Germany,
respectively. This is significantly below the German penalty of 470 €/t CO2eq which is
due in case of non-compliance with the Federal Immission Protection Law (BImSchG).
Greenhouse gas mitigation costs are generally high in the transport sector. Figure 30
gives an overview over a wide portfolio of power-to-transportation fuels.

The future of energy ▪ Power-to-gas 55
Figure 30: Greenhouse gas mitigation costs of renewable fuels from non-biogenic
sources (full cost assessment ‘well-to-tank’ Germany) [LBST 2015]
From Figure 30 it can be seen that greenhouse gas mitigation costs of fuels from
renewable electricity sources are in the range of 600 to 1700 €/t CO2eq in the short to
medium-term. Even long-term, fuel specific GHG mitigation costs are not expected to
drop below 400 €/t CO2eq.
0
20
0
40
0
60
0
80
0
10
00
12
00
14
00
16
00
18
00
20
00
Gasoline/kerosene/diesel
EE-PtL methanol route
EE-PtL FT route
EE-PtL SOEC methanol route
EE-PtL SOEC-FT route
EE-CH4 (CNG)
EE-CH4 (LNG)
EE-CH4 (CNG) SOEC
EE-CH4 (LNG) SOEC
EE-CGH2 (onsite)
Electricity for BEV
Liqu
id fu
elsreferen
ceLiq
uid
fuels (P
tL)G
aseou
s fuels (P
tG)
Electricity
FOSSIL
REN
EWA
BLE
GHG avoidance costs (€/tCO2 equivalent)
20
15
20
20
2030
20
40
2050
LBST, 2015-12-22
Ben
chm
arks: Fu
els from
cru
de
oil
(0 €
/t CO
2 )
-58
%-5
7%
-67
%-6
7%
-58
%
-61
%
-62
%
-65
%-6
7%
-23
%

The future of energy ▪ Power-to-gas 56
Technology development of low-temperature electrolysis has been brought to a
maturity level from which further cost reductions cannot be achieved with research
and development efforts only. The further reduction of specific investments for
electrolysers will require capacity deployments. No cost reductions are expected if no
or only a few electrolysis plants are being deployed.
3.1.4 Renewable electricity potentials
France
The technical production potential from renewable electricity sources in France is
derived from a meta-analysis of available studies, and complemented with own
calculations. Figure 31 and Table 19 give the bandwidth of technical renewable
electricity generation potentials found for France, depicted by power source.
Technically, there are vast renewable electricity generation potential from
photovoltaics as well as onshore/offshore wind power in France.
Onshore wind energy can play a major role in achieving the renewable energy
targets. The environmental and social constraints potential taken into consideration
appear to have a limited impact on the wind energy potential. Nonetheless, for
reasons of public acceptance, we assume a technical onshore wind potential of
374 TWhe per year, which is close to the lower end of the bandwidth cited in study
literature.
There are the five areas along the 5800 kms of coastline in France where offshore
wind farms may be deployed: However, environmental constraints limit potential
deployment. Indeed, there are noteworthy concerns addressed regarding the noise
and visual impact of wind power, as well as the deaths of birds and bats that fly into
rotor blades. The electricity generation potential for offshore wind power was assumed
to be 270 TWhe per year (including floating wind power plants) in this study.
Hydro power is the largest renewable source of electricity in France. Large hydro
power is already highly developed – Dam deployment on French rivers are considered
as having reached a maximum. France has major marine energy resources, however,
this potential remains untapped because the technologies are still immature
[GENI 2011]. Taking a conservative assumption, we include only the lower bandwidth
of the technical electricity potentials from hydro power.
In this study, only a small share of the technical potential for geothermal power is
assumed.
In Table 19 and Figure 31 an overview of the bandwidth and total technical potential
for renewable electricity deployment is provided.

The future of energy ▪ Power-to-gas 57
Table 19: Technical renewable electricity potentials in France (source: LBST based on
[ADEME 2015], [EEA 2009], [IWES 2012], [ADEME 2014], [LBST 2015])
Technology
Long-term sustainable technical potential
TWhe/a Renewable
power
production
today**
TWhe/a
Literature data Assumptions
for this study Lower
bandwidth
Upper
bandwidth
Hydro power* 119 222 119 63
Wind onshore 281 680 374 17
Wind offshore 200 820 270 0
Photovoltaics 299 466 382 6.4
Geothermal 0.2 1.2 0.7 0.083
TOTAL 899 2189 1146 86
* including marine energy (tidal and wave)
** data from [SOeS 2015] for 2014
Figure 31: Technical renewable electricity potentials in France (source: LBST)
Based on [ADEME 2015] we come to the conclusion, that a conservative assumption
for technical renewable electricity potentials in France is 1,146 TWhe per year. To
provide a comparative order of magnitude, in 2013 the net electricity consumption in
France was 486 TWhe, of which approximately17% from renewable energy sources.
Technically, 100% electricity production from renewable energy in France seems
possible. The future electricity demand will, amongst other factors, depend on what
0
100
200
300
400
500
600
700
800
900
1000
Wind/onshore Wind/offshore PV Hydro Geothermal
Tech
nic
al p
ote
nti
al T
Wh
e/y
r
Net electricity consumption France 2013: 486 TWh/yr
Data: [IEA 2013], [ADEME 2014], [ADEME 2015], [EEA 2009], [IWES 2012], [LBST 2015]
Maximum
Minimum
Bandwidth for technical renewableenergy potentials
Assumption this study: ∑ 1146 TWh/yr
Potential already exploite: ∑ 86 TWh/yr
LBST
, 20
15
-12
-02

The future of energy ▪ Power-to-gas 58
the transportation sector will require in terms of catenary lines, charging of battery-
electric vehicles and not least for the production of power-to-fuels (PtH2, PtCH4, PtL).
In 2012, close to 6% of all agricultural land in use in France was dedicated to the
production of biomass for bioenergy purposes [UFIP 2012].
Germany
The technical production potential from renewable electricity sources in Germany is
derived from a literature meta study and complemented with calculations developed
for the purpose of this study. The methodology and data are explained in more detail
in [LBST 2015]. Table 20 and Figure 32 show the bandwidth of technical renewable
electricity generation potentials found for Germany, depicted by renewable power
source.
Table 20: Technical renewable electricity potentials in Germany (source: LBST)
Technolgy
Long-term sustainable technical potential
TWhe/a Renewable
power
production
today
TWhe/a
Literature data Assumptions
for this study Lower
bandwidth
Upper
bandwidth
Hydro power 25 42 25 19.6
Wind onshore 195 2897 390 55.9
Wind offshore 64 300 200 1.4
Photovoltaics 309 471 390 36.1
Geothermal 15 300 15 0.03
TOTAL 608 4010 ~1000 113

The future of energy ▪ Power-to-gas 59
Figure 32: Technical renewable electricity potentials in Germany (source: LBST)
Technically, there are vast renewable electricity potentials from onshore wind power
in Germany. For reasons of public acceptance, we assume a technical onshore wind
potential of 390 TWhe per year, which is close to the lower end of the bandwidth cited
in study literature.
In this study, we include only a small share of the technical potentials from geothermal
power. Most of geothermal heat potentials in Germany would require a stimulation
process, i.e. hydraulic fracturing (‘fracking’) for heat extraction. There is no public
acceptance for fracking in Germany.
Renewable electricity generation potential from photovoltaics could be significantly
higher compared to what is shown in Figure 32. As a conservative assumption, we
have not included PV, neither from brown nor green fields nor conversion areas.
We come to the conclusion, that a conservative number for technical renewable
electricity potential in Germany is 1,000 TWhe per year16. For the sake of comparison,
in 2014 the net electricity consumption in Germany was 521 TWhe [BDEW 2015]. Today,
only about 11% of this renewable electricity potential is currently exploited in Germany.
Based upon the assessment of technical renewable electricity generation potentials
in France and Germany, we can conclude that exploiting these potentials is more
constrained by public acceptance for renewable power plants and balance of
system installations (grid, storage) than by technical feasibility or cost.
16 Assuming more progressive installation density and yield parameters could more than quadruple this
figure and result in renewable electricity supply potentials of some 4,000 TWhe/year in Germany.
0
500
1000
1500
2000
2500
3000
Wind/onshore Wind/offshore PV Hydro Geothermal
Tech
nic
al p
ote
nti
al T
Wh
e/y
r
Net electricity consumption 2014: 511 TWh/yr *
LBST
, 20
15
-12
-05
Maximum
Minimum
Bandwidth for technical renewableenergy potentials
Assumption in this study
1000 TWh/yr
Potential already exploited∑ 113 TWh/yr
Data: [BMU 2010], [BMU 2012], [BWE 2013], [ISE 2015], [IWES_PV 2012], [IWES 2012], [Quaschning 2013], [TAB 2003], [UBA 2013], AGEB 2015]* 2014 data: [AGEB 2015] provisional as per 11/2015

The future of energy ▪ Power-to-gas 60
Comparisons
For our 100 % green hydrogen scenario to cover the net hydrogen demand in French
and German refineries, an annual renewable electricity supply of 6.24 TWhe and 7.02
TWhe respectively is needed. In 2014, some 86 and 113 TWhe were produced from
renewable source in France and Germany respectively. Both values have to be
compared against the more than 1,000 TWhe per year of technical renewable
electricity generation potentials in France and Germany (see the previous section).
To give an example of the number of renewable power plants needed: in the French
scenario early (2020) renewable electricity demand for the hydrogen supply of a
single refinery is equivalent to the annual electricity production of eight 4 MW wind
power plants and 20 MW of installed PV capacity. To supply the total net hydrogen
refinery demand, which is assumed in the scenario by 2025, an equivalent of 584 MW
wind power plants and 151 MW of installed PV capacity would be needed in average
per refinery in France.
3.2 Discussion on green hydrogen for use in refineries
3.2.1 Conclusions
From the results of Application A ’Hydrogen from power-to-gas for use in refineries’,
the following conclusions can be drawn:
Green H2 in refineries is an attractive GHG mitigation option;
A portfolio of options will be needed post-2020 at the latest;
It would mean introduction of green H2 in an established bulk H2 application;
Volume production of H2 reduces electrolyser costs;
Electrolysers ‘valley of death’ is bridged by all fuel users.
From a macro-economic perspective, the deployment of electrolysers for refineries is
an energy-strategic move entailing long-term benefits for all hydrogen uses.
Furthermore, it is a stepping stone for refiners into future power-to-liquids processing.
3.2.2 Recommendations
Based on the results and conclusions from the analysis of the potential role of green
hydrogen in refineries, the study authors recommend to:
Establish regulatory grounds for the accountability of green hydrogen in
refineries at EU level;
A fast-track implementation may however be rather given at national level
because EU FQD had recently been updated;
Green hydrogen sustainability criteria need to be defined and voted at EU and
national level.
3.2.3 Fields for further research
For Application A full-cost analysis was chosen as the most appropriate method for a
fair high-level comparison in order to explore the potentials from green hydrogen in

The future of energy ▪ Power-to-gas 61
refineries. Analytical next steps are, with a view to short-term implementation and
hardware deployment:
Refinery specific business case analyses;
Regional renewable electricity supply scenarios;
Synergies between electricity, refinery, H2 infrastructure.
3.3 APPLICATION B: Semi-centralised power-to-hydrogen business
cases
As explained in section 2, Power-to-gas provides an effective coupling mechanism
between the electricity, transport and industrial sectors, providing new powerful ways
to address intermittency and an abundant supply of storable low-carbon energy,
especially to decarbonise transport.
The particular configuration analysed here is a semi-centralised power-to-gas system.
Such a system is advantageous in that it can address multiple needs of a local energy
system whilst producing economies of scale and avoiding high hydrogen
transportation costs due to relatively short delivery distances.
The business case for such a system is analysed for various sets of hypotheses,
regarding, for instance, the equipment costs, the electricity energy cost profile and
grid charges, hydrogen market uptake, the existence of a feed-in-tariff for injection of
hydrogen into the natural gas grid, etc.
3.3.1 The cost of the electricity
The cost of the electricity consumed by the electrolyser can be decomposed into (i)
a purely energy based component corresponding to the cost per energy unit when
electricity is purchased on the electricity market, and (ii) grid charges (assuming
connection to the grid) along with the various applicable fees and taxes. These
elements, which are -to a large extent- determined by the national context, are further
described below for France and Germany.
As the energy-based cost component of electricity purchased on the spot market is
time dependent, it is represented by a price distribution, containing all the prices
observed in a year (over a 1-hour time span) ranked in ascending order, called, in this
study, the price-duration curve.
To determine the business case at 2030 horizon, electricity price duration curves were
created for France and Germany based upon two acknowledged capacity mix
scenarios.
First, the methodology to model the electricity supply curves will be presented.
Thereafter, the determinants of the price of electricity will be presented for France and
Germany.

The future of energy ▪ Power-to-gas 62
Methodology for modelling the electricity supply curve:
As the factors determining the price-duration are multiple and their evolution difficult
to predict, it is not possible to realistically predict the price-duration curve at the 2030
horizon. Nonetheless, a cost curve based on the marginal cost of electricity production
assuming utilisation of the projected generation capacity for the projected
consumption profile based on merit order can be developed.
The expected electricity prices are based on a simplified modelling framework of the
German and French electricity systems. First, the model calculates a step-wise linear
merit-order curve (i.e. an increasing production costs curve) for each hour of the year
by taking the marginal costs of each type of power plant into account (i.e. based on
fuel costs, corresponding efficiency and CO2 costs) and by assuming costs linearity
between the different generation technologies17. For each hour of the year, the
intersection between the merit-order curve and the residual demand (i.e. actual
electricity demand less renewable feed-in18 and less ‘must-run’ production19)
represents the uniform market clearing price.
At this point, it is important to mention that for the sake of simplicity the model
represents cost minimisation of a simple electricity system without any flexibility options
such as demand side management or electricity storage. In reality, in the future the
energy systems may be characterised by an increasing share of additional measures
for system flexibility potentially influencing the actual electricity prices. However, until
2030, the increase in renewable energy generation is unlikely to be so important as to
require a large-scale deployment of these flexibility options. Therefore, the impact of
these options on the power market dynamics are not taken into account. In addition,
the model assumes that the price mechanism based on marginal costs (i.e. so-called
‘energy-only’ market design) remains unchanged until 2030.
17 In reality the merit-order curve is estimated by calculating the marginal costs of each generation unit
representing a step function. However, for the sake of numerical tractability the underlying model is based
on 7 generic power plants types and linear increase of marginal costs between two consecutive
technologies.
18 The model assumes that the marginal generation costs of fluctuating renewable power plants (such as
wind and solar) are close to zero and have priority when satisfying the demand.
19 ‘Must-run’ production is provided by specific power plants which are operated in the base-load mode
in almost all hours of the year either for technological (e.g. such as geothermal or run-of river power
plants) or economic reasons (i.e. due to ramp-up and ramp-down costs of rather inflexible units such as
coal power plants).

The future of energy ▪ Power-to-gas 63
France
Electricity price-duration curve
Figure 33: Historical and projected marginal-cost based price duration curves for
France (source: Hinicio & LBST based on data from [RTE 2015b])
The figure above represents the two price load duration curves for France. The first is
based on the European Power Exchange (EPEX) French day ahead spot price for 2014.
The second price duration cover is modelled on the basis of RTE’s Nouveau Mix20
scenario using the aforementioned methodology.
The nouveau mix scenario is a widely accepted scenario developed by the French
electricity network operator in its long-term market equilibrium projections. This
scenario is the only scenario which achieves all the energy targets set in the Energy
Transition law (LTE) enacted in 2015. The price of carbon of 95 €/ ton of carbon is also
a hypothesis taken from the nouveau mix scenario and reflects current government
policy. Fuel prices are taken from the 450 ppm World Energy Outlook (WEO)
projections.
All of the modelling assumptions are summarised in tables 16 to 18. Furthermore, the
estimated total energy consumption is 480 TWh.
20 For a detailed description of the scenario please see: RTE, Bilan prévisionnel de l’équilibre offre-
demande d’électricité en France, 2014 edition, pp. 160 to 174.
-50
0
50
100
150
200
250
300
0% 20% 40% 60% 80% 100%
Pric
e (
EU
R/M
Wh
)
Hours per year (%)
French electricity price duration curve
Historical
electricity price
(2014)
Projected
electricity price
(2030)

The future of energy ▪ Power-to-gas 64
Table 21: Techno-economic data for different power plant types (maximal costs, i.e.
for highest expected market prices and lowest efficiency) (source: [RTE
2015b])
Parameter Unit Hydro Coal/
waste CCGT**
Gas
turbine Nuclear Tidal
Prices
primary
energy
€/MWh 0 37.8 22.68 37.8 10 0
Prices CO2
certificates €/tCO2 95 95 95 95 95 95
Efficiency
(LHV*) % 100% 46% 58% 39% 40% 100%
* LHV = Lower heating value. ** CCGT = Combined cycle gas turbine
Table 22: Dispatchable capacities available in 2020 and 2030 (source: [RTE 2015b])
Parameter Unit Nuclear Hydro Coal/
waste CCGT
Gas
turbine
Capacity 2030 GW 37.6* 4.92* 1.8 9.4** 11.4
* 100% of installed capacity is must-run. ** 25% thereof is must-run.
Table 23: Renewable power generation in 2020 and 2030 (source: [RTE 2015b])
Parameter Unit Wind onshore Wind offshore PV
Generation 2030 GWh 62,441 9,934 27,445
The results for 2030 imply a price of electricity close to zero for beyond 8000 hours a
year which can be explained by the combination of nuclear and variable renewable
energy production which have a short-term marginal cost of electricity production
close to zero.
This estimated price duration curve represents an extreme scenario based upon the
merit order for the nouveau mix scenario. At best, it represents the electricity prices on
the spot market at the 2030 horizon which provides only a limited picture of electricity
prices as currently over two thirds of production is contracted. The nouveau mix
scenario assumes important energy efficiency measures and requires the deployment
of demand response measures which the model does not account for. Because the
results for the 2030 price duration curve are not considered as reflecting a likely
electricity price projection, it was not used for evaluating the power-to-hydrogen
business case in the 2030 horizon.
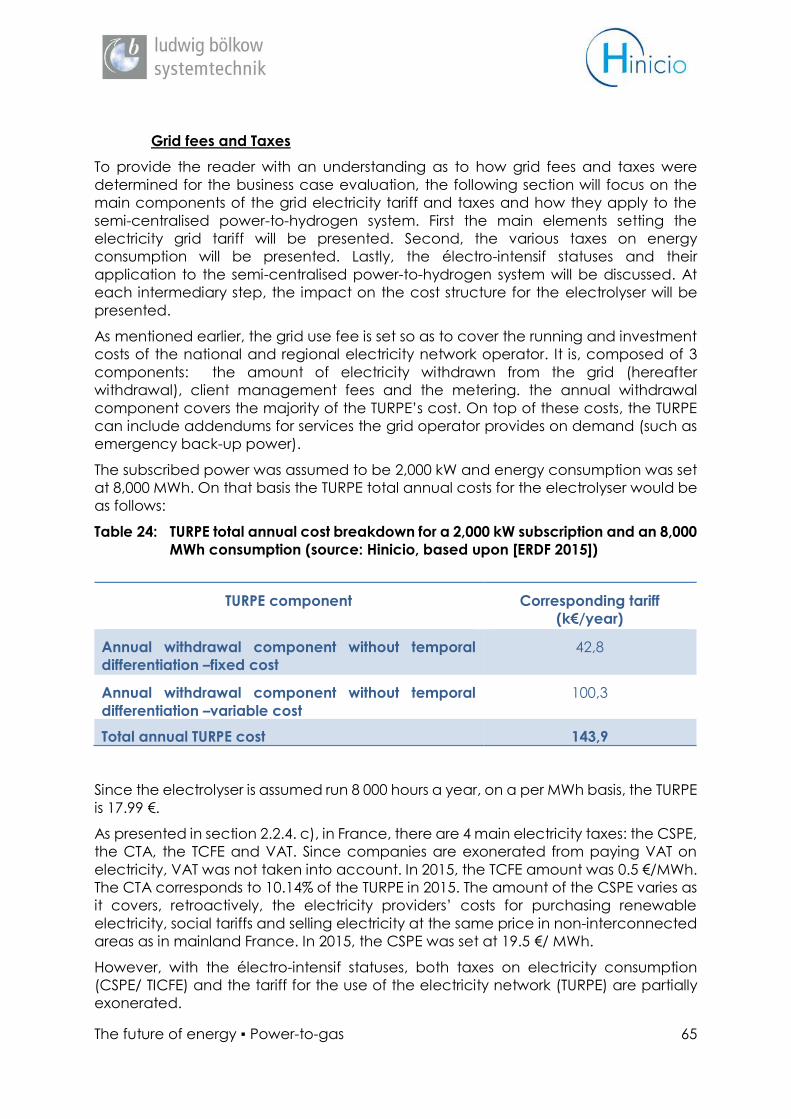
The future of energy ▪ Power-to-gas 65
Grid fees and Taxes
To provide the reader with an understanding as to how grid fees and taxes were
determined for the business case evaluation, the following section will focus on the
main components of the grid electricity tariff and taxes and how they apply to the
semi-centralised power-to-hydrogen system. First the main elements setting the
electricity grid tariff will be presented. Second, the various taxes on energy
consumption will be presented. Lastly, the électro-intensif statuses and their
application to the semi-centralised power-to-hydrogen system will be discussed. At
each intermediary step, the impact on the cost structure for the electrolyser will be
presented.
As mentioned earlier, the grid use fee is set so as to cover the running and investment
costs of the national and regional electricity network operator. It is, composed of 3
components: the amount of electricity withdrawn from the grid (hereafter
withdrawal), client management fees and the metering. the annual withdrawal
component covers the majority of the TURPE’s cost. On top of these costs, the TURPE
can include addendums for services the grid operator provides on demand (such as
emergency back-up power).
The subscribed power was assumed to be 2,000 kW and energy consumption was set
at 8,000 MWh. On that basis the TURPE total annual costs for the electrolyser would be
as follows:
Table 24: TURPE total annual cost breakdown for a 2,000 kW subscription and an 8,000
MWh consumption (source: Hinicio, based upon [ERDF 2015])
TURPE component Corresponding tariff
(k€/year)
Annual withdrawal component without temporal
differentiation –fixed cost
42,8
Annual withdrawal component without temporal
differentiation –variable cost
100,3
Total annual TURPE cost 143,9
Since the electrolyser is assumed run 8 000 hours a year, on a per MWh basis, the TURPE
is 17.99 €.
As presented in section 2.2.4. c), in France, there are 4 main electricity taxes: the CSPE,
the CTA, the TCFE and VAT. Since companies are exonerated from paying VAT on
electricity, VAT was not taken into account. In 2015, the TCFE amount was 0.5 €/MWh.
The CTA corresponds to 10.14% of the TURPE in 2015. The amount of the CSPE varies as
it covers, retroactively, the electricity providers’ costs for purchasing renewable
electricity, social tariffs and selling electricity at the same price in non-interconnected
areas as in mainland France. In 2015, the CSPE was set at 19.5 €/ MWh.
However, with the électro-intensif statuses, both taxes on electricity consumption
(CSPE/ TICFE) and the tariff for the use of the electricity network (TURPE) are partially
exonerated.

The future of energy ▪ Power-to-gas 66
The energy intensive status has been in place in France since 2010, although its legal
status is only currently being set. As a result, the fiscal and tariff reductions it was
granted varied over time and were largely dependent on circumstances.
The électro-intensif status was defined following the creation of a legal exception for
the provision of electricity via a long-term contract granted to a consortium of
companies named Exeltium. In 2005, Exeltium, a consortium of 26 industrial actors was
exceptionally granted the right to purchase electricity on a 25-year contract. At the
time, the consortium was not granted any tax reductions although it was a source of
political debate. However, this event set a definition of the électro-intensif. Companies
with an electricity consumption of 2.5 kWh per euro of added value were considered
électro-intensif.
In 2014, the Commission for the Regulation of Energy (CRE) which is in charge of
controlling energy markets, granted électro-intensif companies a retro-active 50%
reduction on the TURPE because revenues from the TURPE for the previous year
exceeded costs. The surplus was passed on to electro-intensive companies to improve
their economic competitiveness. This exemption from the electricity grid fee was the
first case where the électro-intensif status was associated with an exoneration.
Currently, within the context of the LTE, the status of électro-intensif will be legally
defined. Although status’ characteristics are, as yet, not settled, the main elements
associated to these new statuses are as follows. Two statuses have been proposed:
one for électro-intensif companies and another for hyperélectro-intensif companies.
The eligibility criteria associated with these statues will follow the past criteria, namely
a given level of electricity consumption for each euro of added value but will further
require companies to commit to reducing their energy intensity. Depending on the
company’s energy intensity, partial grid fee and energy taxes will be provided.
More specifically, companies or sites with an annual consumption of more than 7 GWh
per year and for which the TICFE is equal to at least 0.5% of their added value may be
granted this status. The reduction rate varies depending on the amount of electricity
consumed per unit of added value as follows:

The future of energy ▪ Power-to-gas 67
Table 25: CSPE reduction rate depending on energy intensity per unit of added valie
for électro-intensif companies (source: Article 266 quinquies C du Code des
Douanes)21
Electricity consumption per unit of
added value (kWh/€)
CSPE amount (€/
MWh
Less than 3 kWh 1
Between 1.5 kWh and 3 kWh 2.5
Less than 1.5 kWh 5.5
Furthermore, companies for which electricity consumption is more than 6 kWh/€ of
value added and with a strong exposed carbon leakage22 risks because of
international competition, the may be granted the hyperélectro-intensif status. In this
case, the level of CSPE is 0.5 €/ MWh.
In the case of the electrolyser, electricity represents more than 6 kWh/€ value added.
In the reference scenario, the electrolyser is assumed to run 8,000 hours. The
electrolyser therefore fulfils the first hyperélectro-intensif eligibility criteria. However,
hydrogen production is not subject to international competition; carbon leakage is
not an issue. Nevertheless, for the purpose of evaluating the business case of power-
to-hydrogen, it was assumed that the project could, considering its innovative nature
and conditional upon negotiations with the CRE, benefit from the hyper electro-
intensive status.
To provide a comparative vision of the advantages linked to the hyperélectro-intensif
status, all energy taxes and the grid tariff are presented below on a per MWh basis
assuming a 2,000 kW capacity and 8 GWh consumption per year:
21http://www.legifrance.gouv.fr/affichCodeArticle.do?idArticle=LEGIARTI000023216102&cidTexte=LEGITE
XT000006071570&dateTexte=vig
22 As defined by the European Commission. See: C(2009 10251: Commission Decision of 24 December
2009 determining, pursuant to Directive 2003/97/EC of the European Parliament and of the Council, a list
of sectors and subsectors which are deemed to be exposed to a significant risk of carbon leakage.

The future of energy ▪ Power-to-gas 68
Table 26: Summary of French energy taxes, fees and tariffs as applied to the
electrolyser in the reference scenario (source: Hinicio)
Name of the
energy tax or grid
tariff
Price without
hyperélectro-
intensif status
(€/MWh)
Prices supposing
hyperélectro-intensif
status (€/MWh)
Prices which
informed the
reference
business case
TURPE
17.99 1.8 17.99
CSPE/TICFE 19.50 0.50 0.50
CTA 1.80 .18 1.80
Total 39.20 2.40 22.30
Without tax and grid reductions, total energy consumption taxes were estimated at
39.2 €/MWh. With the hyperélectro-intensif status, total energy taxes and grid access
would be 2.4 €/MWh.
Within the initial business case for the semi-centralised power-to-hydrogen system, we
assumed that the electrolyser would benefit from the hyperélectro-intensif regime.
Total energy taxes and grid tariffs for the reference scenario were thus 22.3 €/MWh.
It was further assumed that electricity consumed to produce hydrogen which would
be injected into the natural gas grid to provide would be exonerated from the TURPE.

The future of energy ▪ Power-to-gas 69
Germany
Electricity price-duration curve
Figure 34: Historical and projected marginal cost-based price duration curves
Germany (source: LBST based on data from [Nitsch et al., 2010])
The figure above portrays electricity price duration curves for Germany for the years
2013, 2020 and 2030. The 2013 price duration curve is based the observed prices in
2013. The price duration curves for 2020 and 2030 were derived using the methodology
presented in subsection a).
For the projected price duration curves, the techno-economic assumptions for
different power generation technologies were derived from [Nitsch et al. 2010a] and
[Nitsch et al. 2010b]. The fundamental assumptions on the system design (available
dispatchable capacities, actual electricity demand, renewable generation as well as
expected prices for fossil fuels and CO2 certificates) are based on Scenario A23 of the
German “Leitstudie”, a widely accepted study on the future energy system in
Germany conducted for the German Federal Ministry for the Environment (see [Nitsch
et al. 2012a] and [Nitsch et al. 2012b]). The generic demand and renewable feed-in
profiles are based on publically available historical data from 2012 provided by
[ENTSO-E 2013] and German transmission system operators.
All assumptions are summarised in Table 27 through Table 29. Furthermore, the
expected overall electricity demand in 2030 is 564 TWh in 2020 and 549 TWh.
23 The interested reader is referred to [Pregger et al. 2013] for a detailed definition of scenario A.
-150
-100
-50
0
50
100
150
PR
ice
(EU
R/
MW
h)
Hours per year (%)
German Electricity price duration curve
Historical
electricity price
(2013)
Projected
electricity price
(2020)
Projected
electricity price
(2030)

The future of energy ▪ Power-to-gas 70
Table 27: Techno-economic data for different power plant types (maximal costs, i.e.
for highest expected market prices and lowest efficiency)
Parameter Unit Geo-
thermal Hydro Lignite
Coal/
waste CCGT** Biogas
Gas
turbine
Prices
primary
energy
€/MWh 0 0 4.82 17.64 29.16 29.16 29.16
Prices CO2
certificates €/tCO2 27 27 27 27 27 27 27
Efficiency
(LHV*) % 100% 100% 43% 46% 58% 39% 40%
* LHV = Lower heating value. ** CCGT = Combined cycle gas turbine
Table 28: Dispatchable capacities available in 2020 and 2030
Parameter Unit Geo-
thermal Hydro Lignite
Coal/
waste CCGT Biogas
Gas
turbine
Capacity
2020 GW
0.30* 4.70* 13.26** 21.11*** 27.66 8.43 9.22
Capacity
2030 GW
1.00* 4.92* 6.37** 28.82 15.00*** 10.13 9.61
* 100% of installed capacity is must-run. ** 50% thereof must-run. *** 25% thereof is must-run.
Table 29: Renewable power generation in 2020 and 2030
Parameter Unit Wind onshore Wind offshore PV
Generation 2020 GWh 82,355 33,152 45,366
Generation 2030 GWh 108,262 96,130 59,417
Grid fees and Taxes
An introduction to German electricity sector’s regulatory framework is given in the
introductory chapter.
For Germany, basically, two different sets of grid fees and taxes apply depending on
the legal setup (power contract) and physical setup (with or without grid connection)
of the business case. The first case is purchase on the electricity market with a
connection to the public grid. The second case is typical for direct power contracts,
i.e. electricity supplied from dedicated renewable production facilities, here assumed
to be without the use of the public electricity grid (a few kilometres long electricity line
between power production and consumption may be included, provided that it is
project-dedicated and not connected to the public electricity grid).
In the following, the possible cost components associated to either case are briefly
introduced and conditions for their (non-)applicability described.

The future of energy ▪ Power-to-gas 71
If there is no public grid used for electricity delivery AND if both supply and demand-
side are the same operating entities, THEN PtG electricity consumption is exempted
from Renewable Energy Sources Act (EEG) appropriation according to EEG
appropriation EEG 2014 § 61 (22) N° 2 and N°3.
According to the Energy Industry Act (EnWG) §118 (6), all electricity storage plants that
(i) are newly built after December 2008 and (ii) that started operation from August
2011 (iii) within 15 years are exempted from grid fees for 20 years from the operation
start date onwards. This exemption applies to water electrolysis in power-to-gas plants
under the consideration of EnWG §118 (6) sentence 7.
There are currently no exemptions from CHP appropriation (KWK-Umlage), offshore
wind appropriation (Offshore-Umlage) and grid appropriation (Stromnetzentgelt-
verordnung – StromNEV) – they are fully applicable. However, the regulatory ground
hereto is not 100 % settled. Wheter §118 Abs. 6 may allow an exemption from certain
grid fees which support CHP appropriation, offshore wind appropriation, or the grid
appropriation is currently being discussed.
Power-to-gas plants are regularly fully exempted from electricity tax based on
StromStG §9a sentence 1.
In the case of own production/consumption, public grids are typically not used.
Operators of power-to-gas plants are thus freed from concession fees. In the case of
a power line connecting the supply and demand side and crossing public grounds,
concession fees have to be negotiated with the relevant community. In the case
where the public electricity grid is used, concession fees apply.
With regards to the applicability of CHP appropriation, offshore wind appropriation,
and electricity grid appropriation, the key indicator is the connection to the public
grid. If the power-to-gas operator is not using public grids, there is no obligation to pay
the aforementioned appropriations.
As a summary, Table 30 gives an overview of applicable electricity price
components/exemptions for power-to-gas systems. The situation for the year 2016 is
depicted based on the latest regulatory changes. The following PtG plant parameters
were assumed: 1 MW installed nominal PEM electrolyser (2 MW peak) with an
electricity consumption of 7 GWh per year.
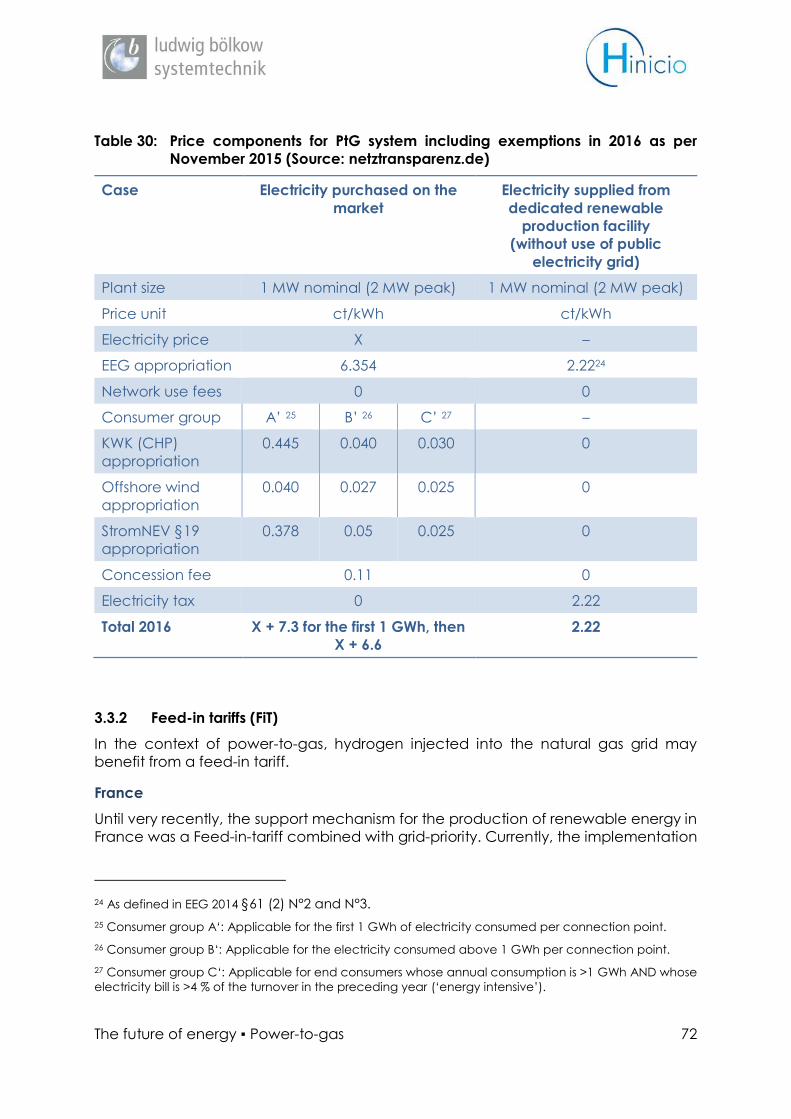
The future of energy ▪ Power-to-gas 72
Table 30: Price components for PtG system including exemptions in 2016 as per
November 2015 (Source: netztransparenz.de)
Case Electricity purchased on the
market
Electricity supplied from
dedicated renewable
production facility
(without use of public
electricity grid)
Plant size 1 MW nominal (2 MW peak) 1 MW nominal (2 MW peak)
Price unit ct/kWh ct/kWh
Electricity price X –
EEG appropriation 6.354 2.2224
Network use fees 0 0
Consumer group A’ 25 B’ 26 C’ 27 –
KWK (CHP)
appropriation
0.445 0.040 0.030 0
Offshore wind
appropriation
0.040 0.027 0.025 0
StromNEV §19
appropriation
0.378 0.05 0.025 0
Concession fee 0.11 0
Electricity tax 0 2.22
Total 2016 X + 7.3 for the first 1 GWh, then
X + 6.6
2.22
3.3.2 Feed-in tariffs (FiT)
In the context of power-to-gas, hydrogen injected into the natural gas grid may
benefit from a feed-in tariff.
France
Until very recently, the support mechanism for the production of renewable energy in
France was a Feed-in-tariff combined with grid-priority. Currently, the implementation
24 As defined in EEG 2014 §61 (2) N°2 and N°3.
25 Consumer group A‘: Applicable for the first 1 GWh of electricity consumed per connection point.
26 Consumer group B‘: Applicable for the electricity consumed above 1 GWh per connection point.
27 Consumer group C‘: Applicable for end consumers whose annual consumption is >1 GWh AND whose
electricity bill is >4 % of the turnover in the preceding year (‘energy intensive’).

The future of energy ▪ Power-to-gas 73
of the European Directive on State aid is modifying the renewable energy support
mechanisms. As renewable energy penetration increases in the electricity market and
the cost of producing renewable electricity decreases, renewable energy is
progressively subjected to market conditions. To encourage intermittent renewable
energy producers to manage their production according to market conditions, the
new mechanism will be an ex-post premium complementing the market price. Energy
providers will no longer have the obligation to purchase all the energy produced via
renewable technologies. At first, the modification of the support modalities for the
production of renewable energy will only concern large installations (more than 500
kW). Progressively, this new mechanism is set to replace the existing FIT mechanism.
However, some installations and technologies, such as onshore wind, will continue to
receive economic support via the FiT. The decrees specifying which technologies
continue to receive the FiT remain to be published. Nonetheless, support for immature
renewable energy technologies will continue to be a FiT.
In 2011, France introduced a FiT for the injection renewable gas (namely biomethane)
into the natural gas grid. The injection of biomethane from agricultural, household or
food production as well as the processing of industry waste into the natural gas grid is
remunerated via a feed-in tariff of between 45 and 125 €/MWh, varying depending
on the installation’s capacity and the type of waste used for biomethane production.
This FiT price is guaranteed for 15 years.
Germany
A key component for the development of renewable electricity production in
Germany is the Federal EEG (Renewable Energy Law):
A preferential up-take of electricity from renewable sources in the grid is
granted.
Fixed – but regularly updated – feed-in tariffs (FiT)guaranteed for 20 years for a
wide range of renewable power plants (solar, wind, hydro, geothermal,
biomass, CHP); competitive tendering is increasingly being trialled for larger
renewable power plant installations.
All FiT-remunerated renewable electricity is sold on the spot market. The green
attribute hereby becomes ‘grey’ in order to avoid double-counting; direct
marketing is increasingly being introduced.
Currently, there are some development lines that may eventually render the EEG
superfluous in the future:
Recently, the FiT reduction has been coupled with a ‘deployment corridor’ that
states an annual minimum and maximum capacity for new installations. Even
renewable power plants that are realised outside the FiT scheme (and
connected to the electricity grid) count towards the corridor.
With regard to electricity from biogas, the FiT tariff was increased a couple of
years ago as biogas feedstock prices had been rising. For the last two years,
the number of newly-deployed biogas plants has significantly decreased. LBST
considers the market for maize-fed biogas plants to be mature. Waste
feedstocks require higher FiT and are thus not attractive at current FiT levels.
Today, the vast majority of biogas power plants still generate and feed
electricity into the grid in a base-load manner. Only recently, an additional FiT
supplement has been implemented for more flexible (i.e. electricity demand

The future of energy ▪ Power-to-gas 74
oriented) feed-in of electricity generation from biogas as additional heat
storage and/or power production capacities are needed. Financing storage
and flexibility of electricity from biogas is in fact closer to a capacity
mechanism.
While in the past most of the installed renewable power plants in the FiT scheme
have been built by individuals, associations, and small investors, the Federal
Ministry for the Economics – the legislative body responsible for the EEG law – is
successively replacing FiT schemes by via several alternatives such as direct
marketing and project auctioning.
Most importantly, renewable power technologies are successively breaking-
even with average electricity prices that private individuals and companies are
paying. Wind onshore and PV are already lower-cost alternatives than newly-
built fossil and nuclear power plants (including lignite if carbon capture and
storage is assumed for a level-playing comparison).
3.3.3 Semi-centralised power-to-hydrogen business model description
This section aims to provide the reader with a clear picture of the power-to-hydrogen
business model in three dimensions: components of the value chain, how the system
is dimensioned and what the cost structure for each component of the system is.
The structure of the following section is broken down into three parts. First the
dimensioning of the production is explained and its associated costs are presented.
Thereafter, the logic underpinning the dimensioning of the transport and storage
element is detailed and its costs presented. The business case for the semi-centralised
power-to-Hydrogen is largely dependent upon the cost of electricity which largely
determines the cost of hydrogen. This section will therefore conclude with a focus on
the hypotheses developed to evaluate this cost by presenting the price duration
curves which are taken into consideration and the fiscal regime for end-consumers in
France and Germany. Each of these sections, representing a segment of the value
chain, are divided into 3 subsections: capital investment costs (or CAPEX), operation
and maintenance costs (or OPEX) and revenues.
Main components of a semi-centralised power-to-hydrogen system
The semi-centralised power-to-hydrogen system covers the hydrogen production and
supply. Hydrogen is produced via a PEM electrolyser. Following production, the
hydrogen is compressed to 200 bar using a compression skid. An injection skid is added
to the hydrogen production site if the hydrogen is injected into the natural gas grid.
Once compressed, the hydrogen is stored in tube trailers which are transported from
the production site to the hydrogen refuelling stations. Of the latter, only the storage
system into which the hydrogen is delivered is considered to be part of the power-to-
hydrogen system.
Hydrogen production requires investments in an electrolyser, a compression and an
injection skid as well as storage. Transport and supply of the hydrogen, requires
investment in tube trailers and storage systems for receiving and storing the product
at the point of use. Transport operations are assumed to be outsourced to a transport
company providing the means of transports (i.e. trailers).

The future of energy ▪ Power-to-gas 75
Revenues from hydrogen sales are redistributed along the value chain based upon an
initial hypothesis of the price at which the kilogram of hydrogen for mobility is sold to
hydrogen refuelling stations. To model the business case for the system, capital
investment cost per unit capacity and running costs were associated to each
component of the value chain (the electrolyser, the compression skid, the injection
skid, transport and storage). The first step consists in dimensioning the hydrogen
production and distribution system. Then, on the basis of technology unitary prices,
investment and operational costs were calculated.
Figure 35 presents the different components of the semi-centralised power-to-
hydrogen system with their associated cost structure.
Figure 35: The different components of the semi-centralised PtH2 value chain and their
price and revenue components (source: Hinicio)
System dimensioning: starting from the demand
In theory, the electrolyser is dimensioned to satisfy a given demand. However, to
evaluate the business case for a given hydrogen production capacity, the electrolyser
capacity was set at 1 MW. This corresponds to a daily market demand of 325 kgH2
assuming an electrolyser energy efficiency of 50 kWh per kgH2, 95% availability, a
performance decrease rate of 10% over the lifetime of the electrolyser and a required
25% excess capacity to cover losses of useable operating time due to the
discontinuous nature of hydrogen logistics.
This daily demand is set to be met 10 years after the project is operational, starting
from an initial demand of 100 kg/day.
Consolidated Business Case
Production
1 MW
Conditioning Storage and
transport
Distribution
CAPEX
H2 cost
€/kg
OPEX
Revenues
H2 production &
conditioning
kgH2
€/kgH2
M€ M€ M€
k€/yr k€/yr k€/yr
€/kgH2 €/kgH2 €/kgH2
- - k€/yr
X
X
X
X
So
urc
e: H
inic
io 2
01
5

The future of energy ▪ Power-to-gas 76
The electrolyser location is set to ensure electricity and natural gas grid interaction, to
answer hydrogen needs within a given area and to optimise operations and logistics.
In the case under scrutiny, the electrolyser is assumed to satisfy demand within a 50
kilometre radius. Two distribution points are assumed to regroup the local hydrogen
demand. These are situated at 40 and 20 kilometres from the point of production.
Costs and revenues of the electrolyser and hydrogen conditioning centre
Capex
The investment cost of the 1 MW installed capacity PEM electrolyser, in 2015, is
estimated at 1.9 M€ and, at the 2030 horizon at 0.55 M€. The hydrogen production unit
further includes a compressor and an injection skid which bring total investment costs
at 2.5 M€ in 2015 (excluding installation costs). By 2030, total cost of these technologies
is considered to have decreased as a result of market uptake to 1.2 M€.
Opex
The main operational cost of producing hydrogen is the cost of electricity. Two
different means of procuring electricity are taken into consideration. Either electricity
is purchased on the spot market or it is purchased directly from an intermittent onshore
wind energy producer via a take or pay fixed fee contract (for further details on the
price of electricity based on the price duration curve, see section 3.3.1a)).
Hydrogen production also incurs operation and maintenance costs. These are
assumed to be fixed and are set at 6% of capital costs per year.
Revenues
Revenues generated for the production of hydrogen come from three sources:
hydrogen sales for mobility, the injection of hydrogen into the natural gas grid and the
ancillary services the electrolyser provides to the electricity grid. Hydrogen injection
into the natural gas grid is assumed to benefit from an injection tariff which is set at 90
€/ MWh. The price for providing system services is estimated to be at 18 €/ MW per
hour.
Hydrogen storage and distribution system
To dimension the hydrogen storage and distribution system, the model follows a 3-step
method. First, the size of storage at each distribution point is determined by calculating
the optimum considering the cost of delivering the hydrogen from the point of
production to the individual demand point and the per kilogram cost of a storage
capacity unit. In the model, the optimum leads to a delivery every 3 to 4 days at full
trailer capacity. Second, the trailer capacity is set. It is chosen in order to ensure that
the filling time at the point of production is less than one day. Finally, the number of
trailers is calculated based upon the average time required to complete a total
delivery cycle (trailer filling, hydrogen transport and delivery to demand point, return
to the production unit, and preparation for refill) and the required daily demand
divided by the trailer capacity. For the first project year, a single 200 kg trailer is
sufficient to answer daily demand. However, when full electrolyser capacity is
reached, 3 tube trailers are required.

The future of energy ▪ Power-to-gas 77
Costs and revenues of logistics and storage
Capex
The investment cost for the trailer depends on the number of required trailers multiplied
by the cost of one trailer. The cost of a 200 kg capacity trailer is considered to be
125 k€. The capital investment for the trailers therefore increases over the project
lifetime from 125 k€ to 375 k€.
Storage capacity at points of delivery is assumed to be equal to 4 days of
consumption, as derived from the optimal logistics calculation. The associated total
annualised capital investment costs are 19.6 k€.
Opex
The operational cost for hydrogen transport is based on a fixed hourly rate and a fixed
per kilometre rate. Based upon these prices, the cost of transporting the hydrogen to
each point of demand is calculated. The total operational costs correspond to the
total cost of delivery multiplied by the required number of deliveries which depend on
the evolution of demand at each HRS station. The cost of delivery is set at 45€/hour
and 1 €/km.
Revenues
The price of hydrogen sales at 300 bar is set at 8 €/kg at the point of delivery.
3.3.4 Semi-centralised power-to-hydrogen business case analysis results
To determine the conditions under which the semi-centralised hydrogen production
system reaches an economic balance, 11 scenarios were developed, based upon a
central scenario. In the following section, the scenarios providing the most useful
insights are presented. These scenarios are grouped together in order to answer the
following questions:
i) What is the impact of having the possibility of injecting hydrogen into the
natural gas grid as opposed to a scenario where such an option is not
available?
ii) What is the impact of choosing to purchase electricity via the spot market
as opposed to purchasing electricity directly from an onshore wind energy
producer via a fixed fee tariff?
iii) What is the sensitivity to regulatory tariff conditions and electricity prices?
iv) What is the business case for the semi-centralised power-to-hydrogen
system at the 2030 horizon?
The metric used to establish whether or not the power-to-hydrogen business case
reaches economic balance is the project’s Internal Rate of Return (IRR) over the first
10 years of operation -i.e. that is to say the length of time assumed for hydrogen sales
to reach the demand level for which the electrolyser was dimensioned.
Following the explanation of the inputs and approach used for the construction of the
reference scenario, the scenarios which answer the questions set hereabove are
analysed.

The future of energy ▪ Power-to-gas 78
The reference scenario
The reference scenario provides the meter against which to measure the other
scenarios. Indeed, the reference scenario was constructed for the IRR to be equal to
0 thereby defining what the bottom-line conditions are to ensure the semi-centralised
power-to-hydrogen business case are.
The results are presented under graphic form. For each year, t2 accumulated bars
represent revenues and costs, respectively. The costs include grid services, injection
market and H2 GoO sales. On the right hand side, the bar representing costs includes
all the operational costs (hydrogen production and transport) fixed and variable costs
as well as the capital investment costs. The capital costs are divided into the capital
costs for logistics (trailers and storage) and the capital costs for hydrogen production
(electrolyser, conditioning,). These capital costs are annualised over the first 10 years
of the project.
Figure 36: Example of scenario results graphic representation (source: Hinicio)
Reference scenario assumptions
In the reference scenario, hydrogen demand for mobility corresponds to our central
assumption, namely, an initial demand of 100 kg/d in 2015 rising to 325 kg/d in 2025-
an annual growth rate of 25 kg/d. The electricity price is based upon the French 2014
day ahead spot electricity price. A feed-in tariff for hydrogen injection of 90 €/MWh is
assumed. The initial scenario is based upon the energy tax regime and tariffs currently
in place in France and it is assumed that the electrolyser would benefit from the
hyperélectro-intensif status which is to say that the contribution for the public service
0
200
400
600
800
1.000
1.200
1.400
2015 2016 2017 2018 2019 2020 2021 2022 2023 2024
k€
/y
Year
Reference scenario : Revenues and Costs
Log. annualized capex
Prod annualized capex
Injection fixed costs
Market fixed costs
Injection var.cost
Market var. log. costs
Market var. prod.cost
H2 GoO's
Grid services
Injection sales
Market sales
So
urc
e: H
inic
io 2
01
5

The future of energy ▪ Power-to-gas 79
of energy (CSPE) is reduced to 0.5 €/MWh. Lastly, the electricity used to produce
hydrogen for injection into the natural gas grid is exempt from any tax or grid charge28.
In the reference scenario, the hydrogen mobility market consumes 1/3 of electrolyser
capacity in 2015 which would correspond to the consumption of 100 passenger
vehicles in commercial services. As the share of hydrogen for mobility rises, the
hydrogen injected into the natural gas grid decreases, corresponding, in 2024, to 20%
of the electrolyser capacity (residual capacity is assumed not to be usable for
deliveries to the market due to the fact that this is a batch process). Between 2015
and 2024, the revenues from injection into the natural gas grid compensate for the
global system investment and operating costs. With a FiT for hydrogen injection into
the natural gas grid at 90 €/MWh, the electrolyser can produce hydrogen for injection
the whole time as the maximum marginal cost of producing hydrogen (when
electricity price is highest) is less than 90 €/ MWh. The ability to inject hydrogen into the
natural gas grid complements the revenue streams during the project uptake phase
when the fuel cell vehicle target demand is met. Additionally, this extends the
electrolyser’s operating time, thereby increasing the time during which it can provide
frequency control services through increase or decrease of load by 100%29, valued at
18 €/MW/h.
In both countries, the hydrogen producer is subject to paying taxes for electricity
consumption and the use of the electricity grid. The tax and tariff burden varies
depending on the country’s regulation. In the case of Germany, the hydrogen
producer must pay a 70 €/MWh fee to support the deployment of renewable energy
technologies but is exempt from paying a grid use fee. In France, total energy
consumption taxes were estimated at 39.3 €/MWh or at 20.3 €/MWh depending
whether the electrolyser benefits from the tax exemptions associated to the
hyperélectro-intensif status or not. In the first case, the tax for the contribution to the
public energy service (CSPE) is set at the 2014 level of 19.5 euros per MWh. However,
with the hyperélectro-intensif status, this tax rate is reduced to 0.5 €/MWh.
The figure below represents the costs and revenues for the reference scenario on the
entire project lifetime.
28 The justification of this being that injection into the natural gas grid helps serves the grid by helping to
achieve balance without generating any additional cost for the grid operator.

The future of energy ▪ Power-to-gas 80
Figure 37: Reference Scenario: Revenues and Costs (source: Hinicio)
The reference scenario illustrates the advantage of having alternative revenue
streams from hydrogen injection into the natural gas grid and by providing grid
services to compensate for the limited market demand for hydrogen. An economic
equilibrium for a semi-centralised power-to-hydrogen system could be made in France
if economic-support measures were put in place; namely, an injection FIT for hydrogen
of 90 €/MWh, the possibility of the electrolyser to benefit from the tax rebates
associated to the hyperélectro-intensif status and an exemption for electricity grid fees
and taxes for electricity used to produce hydrogen injected into the grid.
But what is the impact on the business case if such an option were not available? The
following 2 scenarios seek to address this issue.
Natural gas injection or not
In both these scenarios, market sales uptake is slower than in the reference scenario,
increasing annually by 7 kg/d instead of 25 kg/d. The first scenario presents the case
with the possibility of injecting into the natural gas grid whilst the second presents the
same case without this option.
The figure below presents the costs and revenues for the business case with low market
demand but with hydrogen injection into the natural gas grid.
0
200
400
600
800
1.000
1.200
1.400
2015 2016 2017 2018 2019 2020 2021 2022 2023 2024
k€
/y
Year
Reference scenario : Revenues and Costs
Log. annualized capex
Prod annualized capex
Injection fixed costs
Market fixed costs
Injection var.cost
Market var. log. costs
Market var. prod.cost
H2 GoO's
Grid services
Injection sales
Market sales
So
urc
e: H
inic
io 2
01
5

The future of energy ▪ Power-to-gas 81
Figure 38: Low H2 market demand with H2 injection into the NG grid: Revenues and
Costs (source: Hinicio)
The IRR -2% for the first 10 years of operation with a payback period of 11 years.
The figure below shows the costs and revenues for the business with low hydrogen
market demand and without the possibility of injecting hydrogen into the natural gas
grid.
Figure 39: Low H2 market demand without injection into the NG grid: Revenues and
Costs (source: Hinicio)
0
100
200
300
400
500
600
700
2015 2016 2017 2018 2019 2020 2021 2022 2023 2024
k€
/y
Year
Low H2 market demand with H2 injection in NG grid : Revenues and costs
Log. annualized capex
Prod annualized capex
Injection fixed costs
Market fixed costs
Injection var.cost
Market var. log. costs
Market var. prod.cost
H2 GoO's
Grid services
Injection sales
Market sales
0
100
200
300
400
500
600
700
2015 2016 2017 2018 2019 2020 2021 2022 2023 2024
k€
/y
Year
Low H2 market demand without injection in NG grid : Revenues and costs
Log. annualized capex
Prod annualized capex
Injection fixed costs
Market fixed costs
Injection var.cost
Market var. log. costs
Market var. prod.cost
H2 GoO's
Grid services
Injection sales
Market sales
So
urc
e: H
inic
io 2
01
5 So
urc
e: H
inic
io 2
01
5

The future of energy ▪ Power-to-gas 82
The IRR for this scenario is -12% with a payback period of 19 years.
First, it is worthwhile noting that slower market sales push back the break-even point
by 1 year with hydrogen injection revenues. Considering a market growth rate less
than 1/3 that of the reference scenario, the business case with the possibility of
injection does not seem particularly affected by a less positive market evolution. This
is because the reduction in hydrogen for mobility sales is compensated by increased
revenues from the injection into the natural gas grid. In the second scenario (no
injection) however, the revenue stream is entirely dependent on market sales. The
amortization of initial investments requires 9 more years than the reference scenario.
Hydrogen injection therefore reduces the risk associated to the market sales projection
used to set the size the electrolyser.
Purchasing electricity directly from an onshore wind producer
Since the cost of electricity is a key variable in the cost of hydrogen production, would
purchasing electricity from a producer via a take-or-pay contract improve the
business case?
The second technical choice open to the electrolyser operator is the procurement of
electricity. Because intermittent renewable energy producers are progressively
subject to market rules, fixed fee long term electricity sales contracts are increasingly
used by intermittent energy producers to ensure that their production is sold.
This scenario reflects the case where a fraction of the production of an on-shore wind
farm is purchased through a take-or-pay agreement whilst maintaining all of the
reference scenario’s other characteristics. Figure 40presents the costs and revenues
for the semi-centralised power-to-hydrogen system purchasing electricity directly from
an onshore wind producer.
Figure 40: Direct purchase from an onshore wind electricity producer: Revenues and
Costs (source: Hinicio)
0
200
400
600
800
1.000
1.200
1.400
2015 2016 2017 2018 2019 2020 2021 2022 2023 2024
k€
/y
Year
Direct purchase from an onshore wind electricity producer- Revenues
and Costs
Log. annualized capex
Prod annualized capex
Injection fixed costs
Market fixed costs
Injection var.cost
Market var. log. costs
Market var. prod.cost
H2 GoO's
Grid services
Injection sales
Market sales
So
urc
e: H
inic
io 2
01
5

The future of energy ▪ Power-to-gas 83
To achieve breakeven point by year 10, the price of the contracted electricity must
be 26 €/MWh i.e. 30% of the current total cost of electricity generated by an onshore
wind turbine, estimated at 86.5 €/MWh. The discount would be justified by the fact that
consumption would take place only when this electricity has the lowest market value.
When comparing to the EPEX spot day ahead prices for France in 2014, prices were
below 26 €/MWh for a little less than 2500 hours. The scheme provides greater security
to the producer ensuring that all his production will be sold.
Such an agreement considerably modifies the cost structure of the power-to-
hydrogen system. Indeed, the variable cost of production of hydrogen –which is mostly
comprised of the cost of electricity- is greatly reduced. On the other hand, fixed costs
are increased as the electricity is pre-purchased on a take-or-pay basis. For example,
in 2020, total variable costs are approximately 10 k€ in this scenario, when, in the
reference scenario, the corresponding cost is 225 k€/yr. The number of hours during
which the marginal cost of hydrogen production is lower than the FIT is slightly
increased compared to the reference case, increasing revenues from injection and
grid services.
This modification in the cost structure of the project may also be worth pursuing in
cases where the cost of capital is very low, for instance, in the case of public
investment.
Applying the German market conditions
In order to establish the impact both of different grid tariffs and energy taxes as well
as the sensitivity to the price of electricity, this scenario models the business case in the
German context based on the 2013 spot market electricity prices. The end-user EEG
appropriation for the financing of renewable energy in Germany are set at 70 €/ MWh.
Figure 41presents the costs and revenues associated to this scenario over the project
lifetime.
Figure 41: German electricity market conditions: Revenues and Costs (source: Hinicio)
0
200
400
600
800
1.000
1.200
1.400
2015 2016 2017 2018 2019 2020 2021 2022 2023 2024
k€
/y
Year
German electricity market conditions : Revenues and Costs
Log. annualized
capexProd annualized
capexInjection fixed costs
Market fixed costs
Injection var.cost
Market var. log. costs
Market var. prod.cost
H2 GoO's
Grid services
Injection sales
Market sales
So
urc
e: H
inic
io 2
01
5

The future of energy ▪ Power-to-gas 84
Because of the high energy tax, the electricity price for which the injection FIT
compensates hydrogen production is reached only for a limited number of hours, also
resulting in less available time for providing grid services The limited number of running
hours the electrolyser can produce hydrogen for injection coupled to the high
variable cost of production lead to an IRR of -28%. Without exemption from the energy
consumption tax regime, the project would require an injection FIT of 190 €/ MWh or a
price of hydrogen for mobility of 9.5 €/kg (an 18% increase).
Power-to-hydrogen: the business case at the 2030 horizon in France and Germany
This scenario evaluates the business case at 2030 horizon whilst purchasing electricity
directly from a wind energy producer. A number of further assumptions, replicating
best-guess estimations as to future evolutions by 2030 structure this scenario. In 2030,
market deployment has led to a significant decrease in the price of a 1 MW PEM
electrolyser (from 1.9 M€ in 2015 to 0.55 M€ in 2030). Research and development efforts
have improved the PEM electrolyser efficiency from 66% to 75% as well as stack lifetime
from 4 to 10 years. The FIT for injection no longer exists as such, but the price of carbon
and increased price of natural gas provide a low carbon premium for hydrogen
injection worth 55.8 €/MWh30. Electricity produced via onshore wind turbines has
dropped to 60 €/MWh. The projected electricity requirement is purchased upfront at
the full cost of production for a wind turbine which is connected to the hydrogen
production system but not to the electricity grid. As a result, assuming current
conditions hold, the grid tariffs and taxes paid by the wind power producer would be
0 €.
Figure 42 presents the costs and revenues associated with this scenario.
30 This value is based upon the IEA’s 2030 estimation of the price of gas combined to the projected cost
of carbon for natural gas.

The future of energy ▪ Power-to-gas 85
Figure 42: Direct purchase from an onshore wind electricity producer in 2030:
Revenues and Costs (source: Hinicio)
With an IRR of 0%, this scenario demonstrates the impact of technological
improvements and the future potential which the semi-centralised hydrogen
production system may hold.
A scenario pendant to the one above, estimates the business case at 2030 horizon
with the same technological and cost evolution but with electricity purchased on the
spot market assuming the 2030 price duration curve calculated for Germany along
with the taxes currently applicable in that country.
0
200
400
600
800
1.000
1.200
1.400
2030 2031 2032 2033 2034 2035 2036 2037 2038 2039
k€
/y
Year
Direct Purchase from an onshore wind electricity producer in 2030:
Revenues and Costs
Log. annualized capex
Prod annualized capex
Injection fixed costs
Market fixed costs
Injection var.cost
Market var. log. costs
Market var. prod.cost
H2 GoO's
Grid services
Injection sales
Market sales
0
200
400
600
800
1.000
1.200
2030 2031 2032 2033 2034 2035 2036 2037 2038 2039
k€
/y
Year
2030 horizon electrolyser characteristics with spot market electricity
purchase:- Revenues and Costs
Log. annualized capex
Prod annualized capex
Injection fixed costs
Market fixed costs
Injection var.cost
Market var. log. costs
Market var. prod.cost
H2 GoO's
Grid services
Injection sales
Market sales
So
urc
e: H
inic
io 2
01
5So
urc
e: H
inic
io 2
01
5

The future of energy ▪ Power-to-gas 86
Figure 43 represents the costs and figures of the system at the 2030 horizon, supposing
technological improvement and that electricity is purchased from the spot market.
Figure 43: 2030 horizon electrolyser characteristics with spot market electricity
purchase: Revenues and Costs (source: Hinicio)
Although the variable cost of hydrogen production remains high (4.52 €/kg in 2020 as
compared to 1.92 €/ kg in the reference scenario), the capital cost, as a result of the
increased stack lifetime and the electrolyser’s improved efficiency, is considerably
decreased. Indeed, in the reference scenario, the annualised capital cost is 297 k€/
year, whereas it is approximately 90 k€/year for this scenario. This change in the cost
structure leads to an IRR of 0% over the first ten years of the project. This scenario
demonstrates that with technological improvements high variable costs can be
overcome, even without an injection FiT and could, on the basis of the assumptions,
make the business case balanced at 2030 horizon in Germany.
3.4 Conclusions from the semi-centralised power-to-hydrogen
business case analyses
3.4.1 Conclusions
From the results of Application B “Semi-centralised power-to-hydrogen system-
business case studies”, the following conclusions can be drawn:
0
200
400
600
800
1.000
1.200
2030 2031 2032 2033 2034 2035 2036 2037 2038 2039
k€
/y
Year
2030 horizon electrolyser characteristics with spot market electricity
purchase:- Revenues and Costs
Log. annualized capex
Prod annualized capex
Injection fixed costs
Market fixed costs
Injection var.cost
Market var. log. costs
Market var. prod.cost
H2 GoO's
Grid services
Injection sales
Market sales
So
urc
e: H
inic
io 2
01
5

The future of energy ▪ Power-to-gas 87
Assuming the application of a certain number of favourable regulatory
conditions which are considered defendable31, achieving economic balance
seems feasible for short-term deployments in France; therefore, with some
further support, for instance in the form of investment subsidies, such
deployments could attract private investment.
The French fee regime -applied as assumed above in this study-, would be
particularly favourable for power-to-hydrogen. In contrast, the grid fee regime
currently applied in Germany handicaps power-to-hydrogen. In the short-term,
the study concludes that the economics of power-to-hydrogen are therefore
more attractive in France rather than in Germany.
Injection into the natural gas grid can generate two complementary revenue
streams – from sales to the gas grid, and from services to the power grid
performed when injection is taking place - which reduces exposure to
uncertainty of revenues from the hydrogen market.
A potentially attractive alternative to purchasing the needed electricity on the
spot market is to contract its supply directly from a renewable power producer.
Since consumption would take place only when this electricity has the lowest
market value (i.e. during the hours for which the spot market prices are typically
extremely low), the producer could accept a high level of discount for supply
under such conditions, in return of visibility on the sales price. In the short term,
a power-to-hydrogen system could afford to pay 30% of the full cost of
renewable electricity under such a scheme.
The study shows that an economic balance could potentially be achieved in
both market environments and without public financial support by 2030 thanks
to technological improvements32.
3.4.2 Recommendations
Based on the results and conclusions from the analysis of the potential role semi-
centralised power-to-hydrogen, the study authors recommend to:
Create a feed-in tariff for the injection of green or low-carbon hydrogen into
the natural gas grid of a level comparable to that of biomethane in France;
In France, grant the hyperélectro-intensif status to hydrogen power-to-gas
production;
In Germany, provide similar tax, EEG appropriation, and grid fee benefits to
hydrogen production by electrolysis as the hyperélectro-intensif status;
In Europe, further develop sustainability criteria, certification procedures and
accountability of green or low-carbon hydrogen towards EU targets, especially
31 Exemption of grid fees and taxes for the electricity used to produce low-carbon hydrogen that is
injected into the natural gas grid, a feed-in-tariff comparable to that applied to biomethane, and
application of the conditions (exemption of grid fees) that are applicable to “electro-intensive” facilities.
32 These technological improvements are an increase in electrolyser efficiency, the extension of stack
lifetime and the reduction of electrolyser capital costs.

The future of energy ▪ Power-to-gas 88
with regard to the EU Renewable Energies Directive (RED) and the EU Fuel
Quality Directive (FQD);
Exempt electricity used to produce green or low carbon hydrogen injected into
the natural gas grid from grid fees and energy taxes;
Financially support the implementation of supplying hydrogen to fuel cell
electric vehicles.

The future of energy ▪ Power-to-gas 89
4 LITERATURE
[2011-9] Ordonnance no 2011-1105 du 14 septembre 2011 portant
transposition des directives 2009/28/CE et 2009/30/CE du
Parlement européen et du Conseil du 23 avril 2009 dans le
domaine des énergies renouvelables et des biocarburants
[2011-11] Décret n° 2011-1468 du 9 novembre 2011 pris pour
l’application de l’ordonnance portant transposition des
directives 2009/28/CE et 2009/30/CE du Parlement européen
et du Conseil du 23 avril 2009 dans le domaine des énergies
renouvelables et des biocarburants
[ADEME 2014] French Environment and Energy Management Agency
(ADEME): Energy Transition Scenarios 2030-2050; May 2014
[ADEME 2015] French Environment and Energy Management Agency
(ADEME): Un mix électrique 100% renouvelable? Analyses et
optimisations; Rapport final, 2015
[AGEB 2015] Arbeitsgemeinschaft Energiebilanzen (AGEB): Strom-
erzeugung nach Energieträgern 1990-2014 (Stand 03.08.2015)
– Bruttostromerzeugung in Deutschland ab 1990 nach
Energieträgern. Last accessed: 18.12.2015, http://www.ag-
energiebilanzen.de
[BDEW 2015] Bundesverband der Energie- und Wasserwirtschaft e.V.
(BDEW): Energiedaten – Nettoelektrizitätsverbrauch nach
Verbrauchergruppen. Last accessed: 05.10.2015,
https://www.bdew.de/internet.nsf/id/DE_Energiedaten#cat/
Daten%2FGrafiken\Energie%20allgemein\Energiedaten\3.%
20Stromversorgung/3-12-netto-elektrizitaetsverbr-nach-
verbrauchergruppen-de
[BNetzA 2015] Bundesnetzagentur für Elektrizität, Gas, Telekommunikation,
Post und Eisenbahnen (BNetzA): Monitoringbericht 2015;
Bonn, November 2015
[DOE 2015] U.S. Department of Energy (DOE), Hydrogen Analysis Resource
Centre: Worldwide Hydrogen Production Capacity at
Refineries; 2015;
hydrogen.pnl.gov/sites/default/files/data/Worldwide_refiner
y_hydrogen_production_capacities_by_country_2014.xlsx
[DVGW 2011] DVGW, Power to Gas: Untersuchungen im Rahmen der
DVGW-Innovationsoffensive zur Energiespeicherung, April
2011
[E3M et al. 2015] Capros, P. (E3M Lab), exergia, COWI: Carbon Intensities of Oil
Products consumed in the EU transport sector; Presentation at
the Final Workshop ‘Study on actual GHG data for diesel,
petrol, kerosene and natural gas’, Brussels, 8 July 2015; Last
accessed: 20.10.2015,

The future of energy ▪ Power-to-gas 90
http://ec.europa.eu/energy/en/events/study-actual-ghg-
data-diesel-petrol-kerosene-and-natural-gas-%E2%80%93-
workshop
[EC-112 2011] European Commission (EC): A Roadmap for moving to a
competitive low carbon economy in 2050; COM(2011) 112
final; Brussels, 08.03.2011
[EC-144 2011] European Commission (EC): WHITE PAPER – Roadmap to a
Single European Transport Area – Towards a competitive and
resource efficient transport system; COM(2011) 144 final;
Brussels, 28.03.2011
[EC-RTD 2014] European Commission (EC): HORIZON 2020 – WORK
PROGRAMME 2014-2015 – General Annexes; Extract from Part
19 – Commission Decision C(2014)4995; last accessed:
15.05.2015;
http://ec.europa.eu/research/participants/data/ref/h2020/
wp/2014_2015/annexes/h2020-wp1415-annex-g-trl_en.pdf
[EEA 2009] European Environment Agency (EEA): Technical report –
Europe's onshore and offshore wind energy potential l – An
assessment of environmental and economic constraints;
Copenhagen, 2009
[Energiekonzept 2010] Federal German Government: Energiekonzept für eine
umweltschonende, zuverlässige und bezahlbare Energie-
versorgung; Berlin, 28.09.2010
[ERDF 2015] ERDF: Tarif d’Utilisation du Réseau Public de Distribution d’Electricité, TURPE
4 HTA/BT, Tarifs en vigueur au 1er août 2015, 2015. Available
online at:
http://www.erdf.fr/sites/default/files/ERDF_Turpe_bareme_20
15.pdf
[ENTSO-E 2013] ENTSO-E (2013): Hourly load values of a specific country for a
specific month, Consumption data by European Network of
Transmission System Operators for Electricity (ENTSO-E), May
2013.
https://www.entsoe.eu/data/data-portal/consumption/
[EXERGIA et al. 2015] EXERGIA S.A., E3M-Lab, COWI A/S: Study on actual GHG data
for diesel, petrol, kerosene and natural gas; ENER/C2/2013-
643, July 2015; Last accessed: 20.10.2015,
https://ec.europa.eu/energy/sites/ener/files/documents/Stu
dy%20on%20Actual%20GHG%20Data%20Oil%20Gas%20Final
%20Report.pdf
[FCH JU 2014] FCH JU, Study on development of water electrolysis in the EU,
E4Tech, element energy, final report, February 2014
[FQD 2015] COUNCIL DIRECTIVE (EU) 2015/652 of 20 April 2015 laying
down calculation methods and reporting requirements
pursuant to Directive 98/70/EC of the European Parliament

The future of energy ▪ Power-to-gas 91
and of the Council relating to the quality of petrol and diesel
fuels; Official Journal of the European Union, 25.4.2015
[FW 1996] Foster Wheeler: Decarbonisation of Fossil Fuels; Report Nr.
PH2/2; Prepared for the Executive Committee of the IEA
Greenhouse Gas R&D Programme; March 1996
[FZJ 1994] Hedden, K.; Jess, A.; Engler-Bunte-Institut, Universität Karlsruhe
(TH), Bereich Gas, Erdöl, Kohle: Bereich Raffinerien und
Ölveredelung; Studie im Rahmen des IKARUS-Projektes,
Teilprojekt 4 "Umwandlungssektor"; Forschungszentrum Jülich
GmbH (FZJ); Dezember 1994
[Gahleitner 20131 Gerda Gahleitner, Hydrogen from renewable electricity: An
international review of power-to-gas pilot plants for stationary
applications, international journal of hydrogen energy 38
(2013) 2039e2061
[GENI 2011] Global Energy Network Institute (GENI): Is 100% Renewable
Energy Possible in France by 2020?; August 2011
[IEA 2013] International Energy Agency (IEA): Statistics – France:
Electricity and Heat for 2013; Last accessed: 02.12.2015,
http://www.iea.org/statistics/statisticssearch/report/?country
=FRANCE&product=electricityandheat&year=2013
[IEA 2015] International Energy Agency (IEA): World Energy Outlook 2015
Special Report on Energy and Climate Change
[ISE 2013] Fraunhofer ISE: Energiesystem Deutschland 2050; Freiburg,
Germany, November 2013
[IWES 2012] Fraunhofer IWES: Windenergie Report Deutschland 2011;
Kassel, Germany, April 2012
[Lantrain 2015] Flexibility and French regulation – Aurore Lantrain, Senior
Analyst Product Design – OFAEnR Berlin, 24/11/2015
[LBST 2016] Schmidt, P., Zittel, W., Weindorf, W., Raksha, T. (LBST):
RENEWABLES IN TRANSPORT 2050 – Empowering a sustainable
mobility future with zero emission fuels from renewable
electricity – Europe and Germany; Study for the Research
Association for Combustion Engines e.V. (FVV), 2016
[MEDDE 2015] Ministère de l’Écologie, du Développement durable et de
l’Énergie (MEDDE): Panorama énergies-climat – Edition 2015;
26 August 2015 ; Last accessed: 03.12.2015,
http://www.developpement-
durable.gouv.fr/IMG/pdf/Panorama_energie_climat_2015_c
omplet_mis_a_jour_le_26_aout_2015_2_.pdf
[MFS 2015] Kreyenberg, D., Lischke, A. (DLR), et al.: Erneuerbare Energien
im Verkehr – Potenziale und Entwicklungsperspektiven
verschiedener erneuerbarer Energieträger und
Energieverbrauch der Verkehrsträger; Study by DLR, IFEU, LBST

The future of energy ▪ Power-to-gas 92
and DBFZ for the German Federal Transport Ministry (BMVI);
10.03.2015
[MWV 2015] Minderalölwirtschaftsverband e.V.: Jährliche Kapazitäts-
erhebung vom 31.12.2014; Statistics available:
http://www.mwv.de/index.php/daten/statistikeninfoportal;
Download: October 2015
[Nitsch et al. 2010a] Nitsch, J., Pregger, T., Scholz, Y., Naegler, T., Sterner, M.,
Gerhardt, N., von Oehsen, A., Pape, C., Saint-Drenan, Y.-M.
and B. Wenzel, (2010a): Langfristszenarien und Strategien für
den Ausbau erneuerbarer Energien in Deutschland bei
Berücksichtigung der Entwicklung in Europa und global.
Report, December 2010.
[Nitsch et al. 2010b] Nitsch, J., Pregger, T., Scholz, Y., Naegler, T., Sterner, M.,
Gerhardt, N., von Oehsen, A., Pape, C., Saint-Drenan, Y.-M.
and B. Wenzel, (2010b): Langfristszenarien und Strategien für
den Ausbau erneuerbarer Energien in Deutschland bei
Berücksichtigung der Entwicklung in Europa und global. -
Datenanhang II zum Schlussbericht. Appendix with technical
data, December 2010.
[Nitsch et al. 2012a] Nitsch, J., Pregger, T., Naegler, T., Heide, D., de Tena, D., Trieb,
F., Scholz, Y., Nienhaus, K., Gerhardt, N., Sterner, M., Trost, T.,
von Oehsen, A., Schwinn, R., Pape, C., Hahn, H., Wickert, M.,
and B. Wenzel, (2012a): Langfristszenarien und Strategien für
den Ausbau erneuerbarer Energien in Deutschland bei
Berücksichtigung der Entwicklung in Europa und global.
Report, March 2012.
[Nitsch et al. 2012b] Nitsch, J., Pregger, T., Naegler, T.,Heide, D., de Tena, D., Trieb,
F., Scholz, Y., Nienhaus, K., Gerhardt, N., Sterner, M., Trost, T.,
von Oehsen, A., Schwinn, R., Pape, C., Hahn, H., Wickert, M.,
and B. Wenzel, (2012b): Langfristszenarien und Strategien für
den Ausbau erneuerbarer Energien in Deutschland bei
Berücksichtigung der Entwicklung in Europa und global. -
Datenanhang II zum Schlussbericht. Appendix with technical
data, March 2012.
[Pregger et al. 2013] Pregger, T., Nitsch, J. and T. Naegler. (2013): Long-term
scenarios and strategies for the deployment of renewable
energies in Germany, in: Energy Policy, 59, 350-360.
[SCF 2014] Société Chimique de France (SCF); data collated from IHS,
IFP, Actualité chimique n°347, CETH2, last accessed:
26.10.2015,
http://www.societechimiquedefrance.fr/extras/donnees/min
e/hyd/texhyd.htm
[RTE 2014] Bilan prévisionnel de l’équilibre offre-demande d’électricité
en France, 2014, pp. 160 to 174. Available online:

The future of energy ▪ Power-to-gas 93
http://www.rte-
france.com/sites/default/files/bilan_electrique_2014.pdf
[RTE 2015] RTE, Règles Services système, 2015. Available online:
https://concerte.fr/system/files/concertation/20140319%20R
%C3%A8gles%20Services%20Syst%C3%A8me%20vf_0.pdf
[RTE 2015b] RTE, Bilan Prévisionnel de l’équilibre offre-demande
d’électricité en France, édition 2015. Available online at:
http://www.rte-france.com/sites/default/files/bp2015.pdf
[Stolzenberg et al.] K. Stolzenburg, R. Hammelmann, M. Wietschel et al,
Integration von Wind-Wasserstoff-Systemen in das
Energiesystem, NOW GmbH (PLANET Planungsgruppe Energie
und Technik GbR, fachhochschule lübeck PROJEKT-GMBH,
Fraunhofer-Institut für System- und Innovationsforschung,
Institut für Energie und Umwelt e.V. an der Fachhochschule
Stralsund, KBB Underground Technologies GmbH), 31 March
2014,
[SOeS 2015] SOeS, d'après les sources par filière: Production brute
d'électricité renouvelable; 2015
[UFIP 2012] Union Française des Industries Pétrolières (UFIP): Les
biocarburants en France en France – Dossier d’information;
August 2012; last accessed: 28.10.2015,
http://www.ufip.fr/uploads/documents/Les_biocarburants_e
n_France_08_2012.pdf
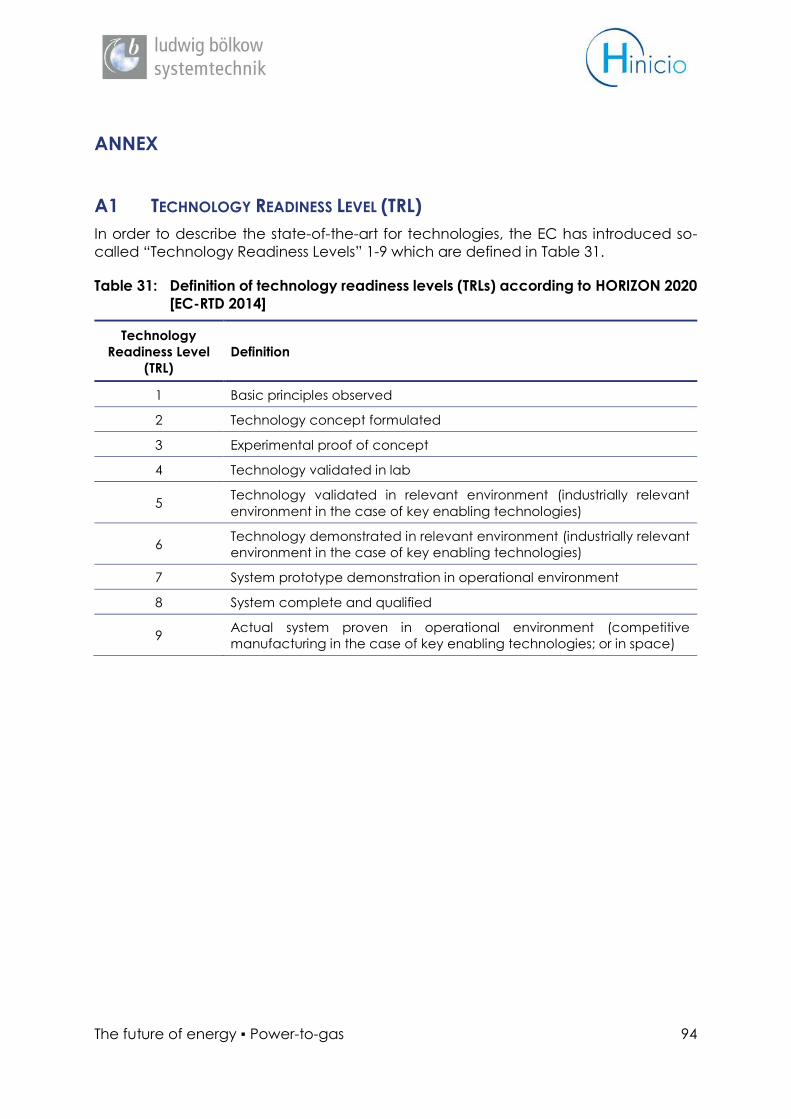
The future of energy ▪ Power-to-gas 94
ANNEX
A1 TECHNOLOGY READINESS LEVEL (TRL)
In order to describe the state-of-the-art for technologies, the EC has introduced so-
called “Technology Readiness Levels” 1-9 which are defined in Table 31.
Table 31: Definition of technology readiness levels (TRLs) according to HORIZON 2020
[EC-RTD 2014]
Technology
Readiness Level
(TRL)
Definition
1 Basic principles observed
2 Technology concept formulated
3 Experimental proof of concept
4 Technology validated in lab
5 Technology validated in relevant environment (industrially relevant
environment in the case of key enabling technologies)
6 Technology demonstrated in relevant environment (industrially relevant
environment in the case of key enabling technologies)
7 System prototype demonstration in operational environment
8 System complete and qualified
9 Actual system proven in operational environment (competitive
manufacturing in the case of key enabling technologies; or in space)


![Original Research Short-Term Power Load Forecasting Based ... to develop power load forecasting techniques to achieve a more accurate simulation result [4-5]. Thus far, short-term](https://img.dokumen.tips/doc/110x75/5fbbc9c6addc4258b902950f/original-research-short-term-power-load-forecasting-based-to-develop-power-load.jpg)