Embed Size (px)
Citation preview

Power System Restoration and Operation of Island Grids with Fre-quency Dependent Active Power Control of Distributed GenerationChristian Hachmanna, Gustav Lammerta, Darío Laffertea, and Martin Brauna,b
aUniversity of Kassel, GermanybFraunhofer Institute for Wind Energy and Energy System Technology, Kassel, Germany
Abstract
Distributed Generators (DGs), e.g. PV systems, connected to low voltage networks in Germany have to reduce theiractive power feed-in at over frequency with a gradient of 40 % per Hz starting at 50.2 Hz. In consequence, at 51.5 Hzthere is still a feed-in of 48 % of their available power. Since all power plants (including conventional ones) are requiredto disconnect at 51.5 Hz, small island grids may collapse due to over frequency without the full potential of powerreduction from DGs being realised. This is particularly relevant for power system restoration from small islands withinthe distribution system. This paper presents a simple island test system, consisting of a 50 MW gas turbine, some loadand distributed generation. The new contribution of this work is an active power control scheme that provides an im-proved frequency behaviour in small island grids without any impact on the overall system behaviour in normal operation.
Keywords - Overfrequency active power reduction, black start, island operation, power system restoration, distributedgeneration, photovoltaic systems, frequency control, frequency stability, gas turbine.
1 Introduction
Over frequency arises in power systems when there is moregeneration than consumption of active power. Normally,the excursions are small and generator controls adjust theirpower to keep the frequency within a narrow range aroundthe nominal value. When the frequency exceeds 50.2 Hz,Distributed Generators (DGs) are required to reduce theiractive power feed-in in order to counteract the imbalance.The requirements for this have been developed with focuson the stability of the bulk power system in normal oper-ation [1]. The focus of this work is the behavior of DGsconnected to Low Voltage (LV) networks in Germany, ac-cording to present regulation [2], when operated as part ofa small island network. According to the present grid codesthe required change in active power is:
∆PPstart
= mf · ( fstart − f ) for fstart ≤ f ≤ 51.5Hz (1)
where Pstart is the active power at 50.2 Hz. With the gra-dient mf = 40%/Hz and the starting frequency fstart =50.2Hz.At the frequency f = 51.5Hz, together with the aforemen-tioned settings, DGs have to reduce their power by
40%/Hz · (51.5Hz−50.2Hz) = 52%. (2)
This means that at the system frequency of f = 51.5Hz,DGs are allowed to feed-in 48 % of their available powerinto the grid. Since power plants in continental Europe areonly required to operate up to 51.5 Hz [3], there is a risk ofpower system collapse without using the full capability forpower reduction of DGs.
State-of-the-art inverters (e.g. [4]) usually have a soft-ware setting that can be configured for other starting pointsthan fstart = 50.2Hz as well as gradients different frommf = 40%/Hz. This paper investigates this flexibility toimprove frequency dynamics in small island grids. Whilethe example presented here includes a gas turbine CHPplant connected via a high voltage network, there are alsoapproaches to form island grids within medium voltagenetworks such as [5] where the proposed scheme can alsobe applied.
2 Modelling of the test system
2.1 TopologyThe test system for this investigation is an island grid con-sisting of a 50 MW gas turbine power plant connected withsome local load and some further medium voltage feedersas a combination of LV connected load and generation.The generator is connected directly with some local loadand via a 110 kV line and transformers to further loads andDGs as shown in Figure 1. Table 1 shows some compo-nent parameters.Note that for the scheme discussed in section 4 there is asecond Feeder B that is not connected to the island system.The DGs connected there can be configured in a way thatthe overall system behaviour is maintained during normaloperation.
2.2 Low and medium voltage networksDue to the computational burden of the simulation of net-works with a large number of differential algebraic equa-
This paper was presented at NEIS conference 2017, Hamburg, Germany and is published in the conference proceedings.The copyright has VDE Verlag GmbH.

Table 1 Component parameters of the test system.
Element ValueMachine transformer 80 MVA, 110/10.5 kVLoad transformer 64 MVA, 110/20 kVLine 1 3 km cable, N2XS(FL)2Y 1x1000RM/50Local load 4 MWAggregate load A 5 MW / 1 MVarAggregate load C 10 MW / 0 MVarLoad disconnected at t0 15 MW / 0 MVarAggregate DGs A 8 MWpeak, 8 MW availableGas turbine 62.5 MVA/50 MW generator, inertia constant: 9 s
tions, the low voltage and medium voltage networks arerepresented by an equivalent. The dynamic equivalent rep-resents phenomena during normal operation but also af-ter reconnection following a blackout. Therefore, the timescale from several seconds up to a couple of minutes isconsidered. The equivalent model of the low voltage andmedium voltage networks is divided into a distributed gen-eration part and a load part, as represented by feeder A inFigure 1.
2.2.1 LoadsThe load represents the aggregate consumption of the lowvoltage and medium voltage grids and is modelled as anexponential load according to [6]. Furthermore, the load isfrequency dependent, i.e., P( f ) and Q( f ), and voltage de-pendent, i.e., P(V ) and Q(V ), as described in the followingequations:
P = P0
(VV0
)α
· (1+ kpf ·∆ f ) (3)
Q = Q0
(VV0
)β
· (1+ kqf ·∆ f ) (4)
where P and Q are the active and reactive power, respec-tively, consumed by the load at the bus voltage V . P0 andQ0 are the active and reactive power, respectively, underthe reference voltage V0, also referred to as the initial op-erating conditions. The exponents α and β depend on thetype of load. The parameters kpf and kqf describe the fre-quency dependency of the load.The exponents for the voltage dependency are based on [7]and include the dynamics of induction motors. The self-regulating effect of the load is considered with kpf = kqf =
G
HV busbar, 110 kV
MV busbar, 20 kV
Load Transformer
Line 1
Machine Transformer
Local Load Gas turbine
Aggregated DGs A Aggregated Load A
Load disconnected at t0
Aggregated Load C
Feeder A
Machine busbar, 10.5 kV
DG
HV busbar, 110 kV
Feeder B
DG
Openswitch
Figure 1 Topology of the test system.
1%/Hz which correlates with 1%/Hz of the nominal ac-tive and reactive power. All the relevant parameters can befound in Table 2.
Table 2 Parameters of the load model.
Description Symbol Value UnitActive power voltage dependency α 0.62 [-]Reactive power voltage dependency β 0.96 [-]Power factor PF 0.98 [-]Active power frequency dependency kpf 1 [%/Hz]Reactive power frequency dependency kqf 1 [%/Hz]
In general, the dynamic behavior of the load model canbe divided into normal operation and reaction after severedisturbances such as reconnection after blackouts. For thelatter mode of operation the model also considers underfrequency load shedding as well as cold load pickup. How-ever, for the investigation carried out in this paper, only thenormal operation mode is considered.
2.2.2 Distributed generationThe representation of DGs, i.e., low voltage and mediumvoltage grid connected PV systems, can be divided intodistribution-connected (small-scale) PV systems [8] andcentral station (large-scale) PV plants [9] according to thesize of the system. In this investigation, the former mod-elling approach is considered. The DGs, i.e., low voltageand medium voltage grid connected PV systems, are repre-sented by an aggregated generation model according to [8].Similar to the load, the aggregated generation model can bedivided into two modes of operation, i.e., normal operationand reconnection. Active power reduction during over fre-quency, which is the focus of this investigation, is part ofthe normal operation mode.The Phase-Locked Loop (PLL) has a simplified structureand consists of a proportional-integral (PI) controller. Theparameters for the proportional and integration gain are 1and 0.1, respectively.
2.3 Gas turbineThe massive integration of DGs into power systems rep-resents a challenge for the system operation due to thehigh fluctuations of non-conventional renewable resources,such as solar and wind power. Open-cycle gas turbines(OCGTs) have become a viable fast-start generation tech-nology to cope with the variability of the renewable gener-ation [10].For the test system, the conventional thermal generationis represented by a 50 MW OCGT power plant, whichhas been developed in DIgSILENT PowerFactory [11].This power plant model consists of a synchronous gen-erator, an AVR as excitation system, a prime mover anda speed governor. The OCGT modelling is based on theRowen’s model. The accuracy of this model to evaluatefrequency response has been verified exhaustively [10],[12]. An OCGT with a single shaft was implemented asprime mover and governor system based on [10], [13]. TheOCGT model includes controllers for speed, temperatureand combustion process. The speed control comprises adroop governor [14] with a secondary PI controller [15].

1
1
W Xs
Ys
spcout
H
NLF
F2
F1 1
DC
sG
1
1 sB
TCL
Max
MIN
PI Controller
Governor
Low Value Select
Fuel Control
Gain
Fuel ControlDelay
No-load Fuel
Valve Positioner
Gas Fuel System
Combustion Reaction
Delay
Compressor Discharge Lag
Torque Function
Turbine and Exhaust System Transport
Delay
Turbine Exhaust Temperature Function
Radiation Shield
Thermocouple
Exhaust Temperature Control
Temperature Controller
pt
SetP
reference
gen
fW
f1W
f2W
maxg
ming
srK
s
fdsTe
V
1
1 sTf
1
1 sTcrsE
e
tdsEe
t
1 sA
sT
C
1
1 sT
Figure 2 Open-cycle gas turbine (OCGT) model implemented in DIgSILENT PowerFactory.
Speed Governor
with PI Controller
Exhaust Temperature Measurement and
Control System
Low Value Select
Combustor System
Torque and Turbine Power
Calculation tp
Temperature controller
output
Speed controller output
Fuel flow
gen
gen
gen
reference SetP
Figure 3 Open-cycle gas turbine (OCGT) block diagram.
In droop governors, the output is proportional to the speederror. The secondary PI controller will integrate in a cor-rective direction until the speed error will be zero. For theexcitation system, the AVR IEEE Type-1 was chosen [16].Figure 3 and Figure 2 illustrate the gas turbine block di-agram and the OCGT model implemented in DIgSILENTPowerFactory.During the open-cycle operation, the exhaust temperatureof OCGTs cannot be controlled at an optimal value becauseof the absence of a heat recovery system and therefore vari-able inlet guide vanes are not used. The exhaust tempera-ture of the turbine F1 can be determined using the followingexpression [10]:
F1 = Tr −390(1−Wf
)+306 ·∆ω (5)
where Tr, Wf and ∆ω represent the turbine rated exhausttemperature in ◦C, the per unit fuel flow and the speed er-ror, respectively. However, the OCGT turbine power out-put is mainly determined by the torque function F2 [10]:
F2 = 1.3 ·(Wf −0.23
)+0.5 ·∆ω (6)
The OCGT can modify its exhaust temperature based onthe power output of the generator. The fuel demand for theOCGT will be determined according to the minimum valuebetween the signals of the speed governor and the exhausttemperature measurement and control system. A governordroop of 4 % and a PI secondary controller was adjusted.Table 3 shows all the parameters used in the OCGT dy-namic model.
Table 3 Open-cycle gas turbine (OCGT) model parame-ters.
Description Symbol Value UnitSpeed governor gain W 25 p.u.Speed governor lead time constant X 0.479 sSpeed governor lag time constant Y 0.4 sDemand upper limit gmax 1.79 p.u.Demand lower limit gmin -0.15 p.u.Fuel control delay time Tfd 0.0625 sTurbine exhaust temperature control TCL 510 ◦CTemperature controller time constant Tt 450 sValve positioner time constant Tv 0.05 sFuel system time constant Tf 0.4 sFuel system delay Ecr 0.01 sCompressor discharge time constant EC 0.1 sTurbine exhaust transport delay Etd 0.01 sFuel control gain H 0.77 p.u.No-load fuel NLF 0.23 p.u.Temperature controller gain A 3.3 p.u.Thermocouple time constant B 2.5 sRadiation shield parameter C 0.8 p.u.Radiation shield gain D 0.2 p.u.Radiation shield time constant G 15 sTemperature controller maximum limit value Mac 1.79 p.u.Turbine rated exhaust temperature Tr 510 ◦CSecondary frequency controller gain Ksr 2.2 p.u.
3 Case studies
In this investigation, the sudden loss of 15 MW of load wasanalyzed. Such an event can be caused by the tripping ofprotection equipment at a line or transformer. It can alsooccur as the result of a prior imbalance in load and genera-tion with subsequent under frequency load shedding.The RMS simulation is performed in DIgSILENT Power-Factory [11].
3.1 Base case with mf = 40%/HzThis case study analyzes the standard P( f )-characteristicof DGs according to the German grid code VDE-AR-N4105 [2] ( fstart = 50.2Hz and mf = 40%/Hz).Figure 4 shows the resulting frequency and powers. Att = 0s the 15 MW load is disconnected from the system.Due to the sudden loss of consumption the frequency rises

Figure 4 Power and frequency after loss of 15 MW con-sumption (at f = 0s) with standard P( f )-characteristic ofmf = 40%/Hz according to [2].
Figure 5 Power and frequency after loss of 15 [MWconsumption (at time 0 s) with P( f )-characteristic of80 %/Hz.
until 51.5 Hz within about 2 s. The increase is only stoppedby the tripping of the DGs over frequency protection. Atthis point the generator protection of the gas turbine mightalso trip, which would result in a complete collapse of theisland power system.
3.2 Case with mf = 80%/HzFigure 5 shows the frequency and powers for a gradient ofmf = 80%/Hz. With this setting, the frequency rises onlyuntil 51.14 Hz. At this point the DGs have reduced theiractive power feed-in by more than 75 % of their availablepower. From this operating point, the frequency control ofthe turbine slowly brings the frequency and thus the feed-inof the DGs to its steady-state value.
3.3 ComparisonHaving a P( f )-characteristic with a higher gradient mf atover frequency clearly improves the frequency behavior ofthe island grid in case of a sudden loss of load. In othercases, such as a loss of generation, the frequency shouldstay well below 50.2 Hz. Therefore, no detrimental effectson normal operation are to be expected.Furthermore, additional simulations were carried out in or-der to evaluate other values of the gradient mf. Figure 6
Figure 6 P( f )-characteristics for results shown inFigure 7. Frequency fstart = 50.2Hz and gradientsmf = [40;500 ]%/Hz.
Figure 7 Frequency after loss of load (at time 0 s) withdifferent P( f )-characteristics.
shows the corresponding P( f )-characteristics. In Figure 7the effect of the different characteristics can be seen forthe same test case. The higher the value of the gradientmf, the lower the maximum frequency. Moreover, it canbe observed that the frequency controller of the gas turbineneeds more time to bring the frequency back to nominal forhigher gradients mf of DGs.Figure 8 shows the maximum frequency excursion as afunction of the gradient mf based on 101 simulations cov-ering the range of m f = [0;500]%/Hz in steps of 5%/Hz.Table 4 contains the corresponding values for the maxi-mum frequency and minimal DG active power feed-in ac-cording to the gradients mf = [40;500 ]%/Hz. For gra-dients up to 45 %/Hz the frequency rise is only stoppedwhen the DGs disconnect at 51.5 Hz. As the gradient mfis increased further, there is a sharp decline in maximalfrequency that eventually levels out. With a gradient of200 %/Hz the active power feed-in of the DGs is already0 MW during the peak frequency as shown in Figure 9.From then on, a faster reduction of active power feed-inhas little effect on the magnitude of the frequency excur-sion in the considered test system.The frequency shown in Figures 4 to 7 is the electricalfrequency at the terminals of the generator. The frequencymeasured by the PLL of the DGs is slightly different due tothe changing voltage angles across impedances in the grid.Because of this the DGs disconnect when the frequencyat the generator terminals is still slightly below 51.5 Hz.Since this effect depends on the topology and the loca-tion of the loss of load it can not be relied on. Also thedifferences are within the allowed range of uncertainty offrequency measurement for the relevant protection devicesand there are also tolerances for disconnection delays [2].
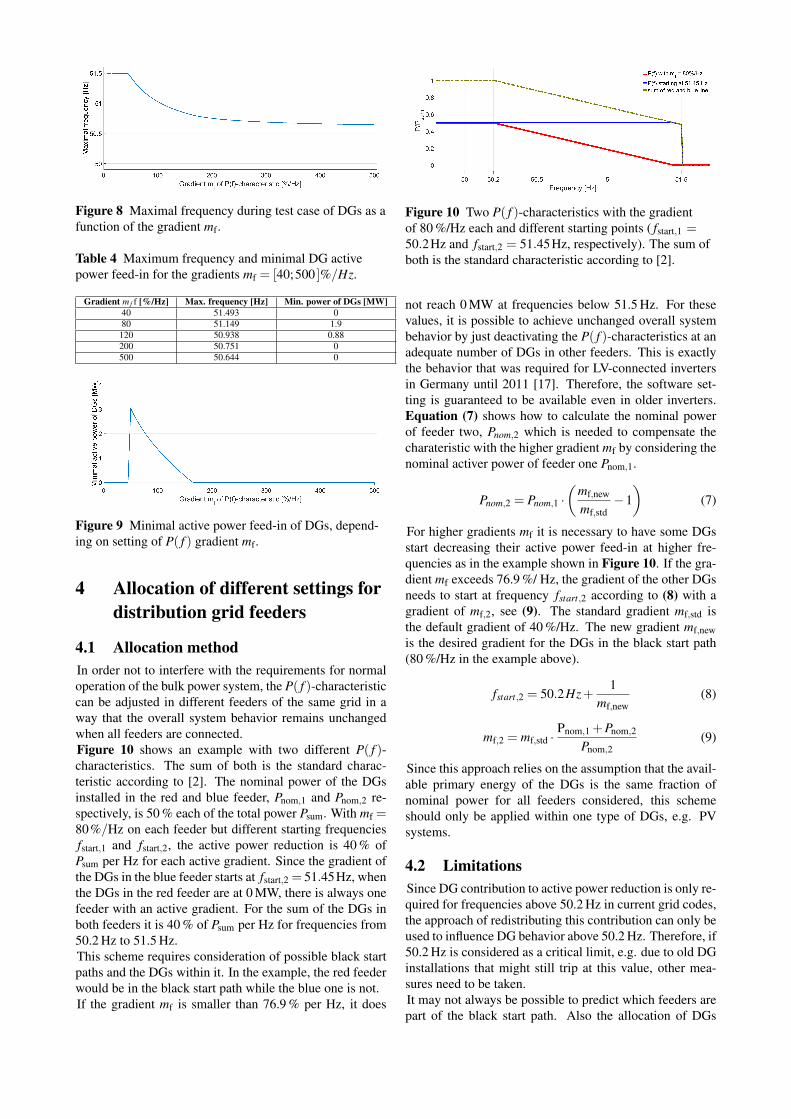
Figure 8 Maximal frequency during test case of DGs as afunction of the gradient mf.
Table 4 Maximum frequency and minimal DG activepower feed-in for the gradients mf = [40;500 ]%/Hz.
Gradient m f f [%/Hz] Max. frequency [Hz] Min. power of DGs [MW]40 51.493 080 51.149 1.9
120 50.938 0.88200 50.751 0500 50.644 0
Figure 9 Minimal active power feed-in of DGs, depend-ing on setting of P( f ) gradient mf.
4 Allocation of different settings fordistribution grid feeders
4.1 Allocation methodIn order not to interfere with the requirements for normaloperation of the bulk power system, the P( f )-characteristiccan be adjusted in different feeders of the same grid in away that the overall system behavior remains unchangedwhen all feeders are connected.Figure 10 shows an example with two different P( f )-characteristics. The sum of both is the standard charac-teristic according to [2]. The nominal power of the DGsinstalled in the red and blue feeder, Pnom,1 and Pnom,2 re-spectively, is 50 % each of the total power Psum. With mf =80%/Hz on each feeder but different starting frequenciesfstart,1 and fstart,2, the active power reduction is 40 % ofPsum per Hz for each active gradient. Since the gradient ofthe DGs in the blue feeder starts at fstart,2 = 51.45Hz, whenthe DGs in the red feeder are at 0 MW, there is always onefeeder with an active gradient. For the sum of the DGs inboth feeders it is 40 % of Psum per Hz for frequencies from50.2 Hz to 51.5 Hz.This scheme requires consideration of possible black startpaths and the DGs within it. In the example, the red feederwould be in the black start path while the blue one is not.If the gradient mf is smaller than 76.9 % per Hz, it does
Figure 10 Two P( f )-characteristics with the gradientof 80 %/Hz each and different starting points ( fstart,1 =50.2Hz and fstart,2 = 51.45Hz, respectively). The sum ofboth is the standard characteristic according to [2].
not reach 0 MW at frequencies below 51.5 Hz. For thesevalues, it is possible to achieve unchanged overall systembehavior by just deactivating the P( f )-characteristics at anadequate number of DGs in other feeders. This is exactlythe behavior that was required for LV-connected invertersin Germany until 2011 [17]. Therefore, the software set-ting is guaranteed to be available even in older inverters.Equation (7) shows how to calculate the nominal powerof feeder two, Pnom,2 which is needed to compensate thecharateristic with the higher gradient mf by considering thenominal activer power of feeder one Pnom,1.
Pnom,2 = Pnom,1 ·(
mf,new
mf,std−1
)(7)
For higher gradients mf it is necessary to have some DGsstart decreasing their active power feed-in at higher fre-quencies as in the example shown in Figure 10. If the gra-dient mf exceeds 76.9 %/ Hz, the gradient of the other DGsneeds to start at frequency fstart,2 according to (8) with agradient of mf,2, see (9). The standard gradient mf,std isthe default gradient of 40 %/Hz. The new gradient mf,newis the desired gradient for the DGs in the black start path(80 %/Hz in the example above).
fstart,2 = 50.2Hz+1
mf,new(8)
mf,2 = mf,std ·Pnom,1 +Pnom,2
Pnom,2(9)
Since this approach relies on the assumption that the avail-able primary energy of the DGs is the same fraction ofnominal power for all feeders considered, this schemeshould only be applied within one type of DGs, e.g. PVsystems.
4.2 LimitationsSince DG contribution to active power reduction is only re-quired for frequencies above 50.2 Hz in current grid codes,the approach of redistributing this contribution can only beused to influence DG behavior above 50.2 Hz. Therefore, if50.2 Hz is considered as a critical limit, e.g. due to old DGinstallations that might still trip at this value, other mea-sures need to be taken.It may not always be possible to predict which feeders arepart of the black start path. Also the allocation of DGs
to the feeders may change over time. Therefore, an im-plementation of the proposed scheme may need regular re-view. It might be the best and most feasible solution tolimit the changes to the immediate electrical environmentof a black start plant. The effort to change the settingscould also be minimized by limiting changes to PV-plantsabove a certain size.Furthermore, today there is no regulatory framework thatallows distribution system operators to require adjustedsettings of the P( f )-characteristic.
5 Conclusion and future work
The contribution of DGs to improve the frequency dynam-ics of the system in case of over frequency can be sig-nificantly improved by increasing the gradient mf of theirP( f )-characteristic. For the operation of island grids, thiscan be achieved by changing the P( f )-settings of DGs indifferent feeders in a way that does not affect normal op-eration since the changes cancel out if all feeders are con-nected. This can be especially useful for black start plansstarting with a single power plant in an area with relativelyhigh penetration of DGs.The proposed changes can be implemented by changingthe software settings of PV inverters already available onthe market. For gradients up to 76.9 %/Hz the compen-sation can even be done with older inverters since it onlyrequires the P( f )-characteristic to be deactivated and theover frequency disconnection setting to be 51.5 Hz.It should be noted that the proposed settings might alsoincrease the probability of unintentional islanding. Thusfurther research is needed before these changes can be im-plemented in sections of a distribution grid where uninten-tional islanding after a system split is of concern.Additionally, the different requirements for DGs con-nected in the medium voltage level are not considered inthis contribution. While it is possible to do the adjustmentonly for LV connected DGs the effect could be increased ifDGs on other voltage levels were included.
6 Acknowledgements
This work was supported by the German Federal Ministryfor Economic Affairs and Energy and the ProjekttraegerJuelich GmbH (PTJ) within the framework of the projectNETZ:KRAFT (FKZ: 0325776J).
7 Literature[1] J. Boemer, K. Burges, P. Zolotarev, J. Lehner, P. Wajant,
M. Fürst, R. Brohm, and T. Kumm, “Overview of germangrid issues and retrofit of photovoltaic power plants in ger-many for the prevention of frequency stability problems inabnormal system conditions of the entso-e region continen-tal europe,” in 1st International Workshop on Integration ofSolar Power into Power Systems, Aarhus, Oct 2011.
[2] VDE-AR-N 4105, “Erzeugungsanlagen am Niederspan-nungsnetz (Guideline for the Connection and Parallel Op-
eration of Generation Units at Low Voltage Level),” August2011.
[3] EUROPEAN COMMISSION, “Commission regulation(eu) 2016/631, establishing a network code on requirementsfor grid connection of generators,” Official Journal of theEuropean Union, 2016.
[4] SMA Solar Technology AG. (accessed 2017, Mai)Operating parameters sunny boy sunny mini central windyboy, version 6.0. [Online]. Available: http://files.sma.de/dl/1348/SB_SMC_WB_Par-TB-TEN113160.pdf
[5] D. Lafferte, A. Klingmann, D. Fetzer, G. Lammert,C. Hachmann, T. Paschedag, and M. Braun, “Black start andisland operation of distribution grids with significant pene-tration of renewable resources,” in Large-Scale Grid Inte-gration of Renewable Energy in India, New Delhi, Septem-ber 2017.
[6] T. Van Cutsem and C. Vournas, Voltage Stability of ElectricPower Systems, Springer 2008.
[7] J. V. Milanovic, K. Yamashita, S. M. Villanueva, S. Ž.Djokic, and L. M. Korunovic, “International Industry Prac-tice on Power System Load Modeling,” IEEE Transactionson Power Systems, vol. 28, no. 3, pp. 3038–3046, Aug 2013.
[8] Western Electricity Coordinating Council (WECC) Re-newable Energy Modeling Task Force. (2012, September)WECC Solar PV Dynamic Model Specification. [On-line]. Available: https://www.wecc.biz/Reliability/WECC%20Solar%20PV%20Dynamic%20Model%20Specification%20-%20September%202012.pdf
[9] G. Lammert, L. D. Pabón Ospina, P. Pourbeik, D. Fetzer,and M. Braun, “Implementation and Validation of WECCGeneric Photovoltaic System Models in DIgSILENT Pow-erFactory,” in 2016 IEEE Power & Energy Society GeneralMeeting, Boston, July 2016, pp. 1–5.
[10] L. Meegahapola, “Characterisation of gas turbine dynam-ics during frequency excursions in power networks,” IETGeneration, Transmission Distribution, vol. 8, no. 10, pp.1733–1743, October 2014.
[11] DIgSILENT GmbH, “DIgSILENT PowerFactory,” Version2016.
[12] N. Kakimoto and K. Baba, “Performance of gas turbine-based plants during frequency drops,” IEEE Transactionson Power Systems, vol. 18, no. 3, pp. 1110–1115, Aug 2003.
[13] W. Rowen, “Utility experience with gas turbine testing andmodeling,” Journal of Engineering Power, vol. 105, pp.865–869.
[14] L. M. Hajagos and G. R. Berube, “Utility experience withgas turbine testing and modeling,” in 2001 IEEE Power En-gineering Society Winter Meeting. Conference Proceedings(Cat. No.01CH37194), vol. 2, 2001, pp. 671–677 vol.2.
[15] A. J. Schwab, Elektroenergiesysteme: Erzeugung, Übertra-gung und Verteilung elektrischer Energie. Springer-Verlag,2015.
[16] IEEE Committee Report, “Computer representation of ex-citation systems,” IEEE Transactions on Power Apparatusand Systems, vol. PAS-87, no. 6, pp. 1460–1464, June 1968.
[17] DIN VDE 0126-1-1, “Selbsttätige freischaltstelle zwischeneiner netzparallelen erzeugungsanlage und dem öffentlicheniederspannungsnetz (automatic disconnection device be-tween a grid parallel power-generating system and the pub-lic low voltage grid),” 2006.