Embed Size (px)
Citation preview

White Paper
Power Measurements and Analysis: Challenges and Solutions Selu Gupta HW Design Engineer Tektronix, Inc. Beaverton, Oregon USA ABSTRACT: The job of a switch mode power supply and power electronics engineer has become quite challenging. Stringent efficiency and performance requirements, along with increasing power density, all contribute to a variety of measurement and analysis challenges. Faster switching speeds of modern power semiconductors add to the challenge of making accurate voltage and current measurements, followed by tedious calculations for a sophisticated analysis. This paper looks at issues around essential measurements such as Turn-on/Turn-off losses, Safe Operating Area and Dynamic ON resistance. Magnetic components, when subjected to high switching frequencies, also play an important role in the performance of power electronics systems. Issues associated with inductance measurements and evaluating magnetic properties and magnetic power losses are examined. Input/Output Analysis measurements such as Ripple and Noise, Current Harmonics, Power Quality, and Compliance needs are also discussed. After a review of these measurement issues, the paper focuses on overcoming these challenges with the help of Tektronix Power Measurement and Analysis Solution. The DPO7000 series oscilloscope coupled with DPOPWR Power Analysis Software and TCP0030, P5205 current and high-voltage probes have been developed with the power electronics engineer in mind.
I. Introduction The demand for power has increased exponentially over the last century. This has increased the emphasis on the performance and efficiency of supplies used in everyday electronics as well as sophisticated electronic and communication systems. Switch mode power supplies (SMPS) have become the dominant architecture of the supplies used in most electronic systems today. Besides being more efficient, SMPS have a wide AC input voltage range, lower weight, smaller size, and reduced costs for larger amounts of power being delivered when compared to traditional rectifiers and linear DC-DC converters. Switching supplies are also better at handling changing loads efficiently. The key component of a SMPS is the switching device, which may be a Metal Oxide Semiconductor Field Effect Transistor (MOSFET) or an Insulated Gate Bipolar Transistor (IGBT). The magnetic components of the SMPS include inductors and transformers. Proper characterization and measurement of the losses associated with these key components gives the SMPS designer a good understanding about the performance of the supply.

White Paper
2
Figure 1: A simplified schematic of a Switch-mode Power Supply. TP1 and TP2 are measurement test points
across the MOSFET The paper starts out with an introduction defining key terms and a description of the critical measurements associated with the performance of a switching supply. This is followed by an overview of the components of the Tektronix measurement system that is designed to make power analysis easier and more accurate. The third section of this paper discusses measurement methods needed to characterize the power supply, using the Tektronix measurement system. The last section provides some general tips to make more informed and accurate measurements. Even though this paper will focus on the performance analysis and characterization of SMPS, similar measurement terms and concepts apply to other power systems as well.
II. Switch Mode Power Supply Basics Before any measurement can be made, it is important to understand the definition of terms used to characterize the performance and quality of an SMPS. These essential measurements may be divided into 3 categories – electrical characteristics, magnetic characteristics and input/output analysis parameters. Electrical Characteristics These measurements usually involve the characterization and measurement of the voltages across and currents through the switching device in the supply which may be a MOSFET or an IGBT. The measurements of interest are Turn-on loss, Turn-off loss, Power loss, Dynamic ON resistance and Safe Operating Area. Turn-on/Turn off Losses The energy lost in a switching device, such as MOSFET or IGBT, when it transitions from an OFF to ON state is defined as Turn-on loss. Similarly, Turn-off loss is described as the energy lost when the switching device transitions from an ON to OFF state. Transistor circuits lose energy during switching time due to the dissipative elements in the parasitic capacitance and inductance and charge stored in the diode. A proper analysis of these losses is essential to characterize the supply and gauge its efficiency. The challenge in measuring Turn-on and Turn-off losses is to filter out the ringing present on the switching signal. This ringing is often mistaken for an ON or OFF transition. The source of this ringing is parasitic capacitances and inductances in the circuit. Power Loss Power loss is defined as the difference between power input and output as a result of an energy transfer between two points. Switching and conduction losses account for a majority of the power loss in a supply.

White Paper
3
Dynamic ON Resistance The dynamic ON resistance of a switching device is its resistance when it is in the ON state. It is dynamic because the resistance is not constant and may vary with change in voltage or current. Safe Operating Area (SOA) The safe operating area of a transistor defines the conditions over which the device can operate without self damage; specifically how much current can run through the transistor at a given voltage. Exceeding these limits may cause the transistor to fail. The SOA is inclusive of other limitations of the device such as maximum voltage, maximum current, power, junction temperature, secondary breakdown, etc. SMPS designers use the information from the SOA to test the switching device in the power supply over diverse operating conditions.
The challenge with measuring the SOA and the Dynamic ON resistance is to successfully and accurately capture voltage and current data for the device under various load scenarios, operating temperature changes and variations in line input voltages. The more accurately the measurement system captures the voltage and current values, the more accurate this analysis will be.
Magnetic Characteristics Inductors and transformers make up the magnetic components of a switching supply. It is important to understand the loss mechanisms associated with these components in order to accurately characterize the performance of the supply. The measurements of interest are Inductance, Magnetic Power Loss and Magnetic Properties such as B-H Characteristics. Inductance Inductors are commonly used as filters at the input and output of the supply. As transformers, they help sustain oscillation in switching supplies and are used to couple voltage and current from the primary to the secondary while providing isolation between circuit elements. The inductance value depends on the current and voltage source, frequency of operation, excitation signal and wave shape. Hence, it is important for the designer to monitor the behavior of these devices under operating conditions.
Magnetic Power Loss In order to accurately characterize the efficiency, reliability and thermal performance of a switching supply, it is important to have an understanding and awareness of the magnetic power losses that may occur in the supply. Core losses and copper losses are the two kinds of losses associated with magnetic elements. ♦ Copper losses occur due to the resistance of the copper winding wire. ♦ Core losses consist of Eddy current losses and hysteresis losses and may be calculated using the data
sheet from the core element’s manufacturer. These losses are dependent on the frequency of operation and the AC flux swing, and are independent of DC flux.
Magnetic Properties and B-H Characteristics The B-H curve is important to the design of the inductor or transformer used in an SMPS. This curve provides the relationship between the flux density B and the magnetic field intensity H of the core material. The slope of this characteristic is the permeability m of the core material, which influences the inductance. Inductance and permeability of the core material is greatly reduced at high flux densities, when it saturates. The measurement of the B vs. H curve provides verification of the core loss and saturation (or lack thereof) of the magnetic elements in a switching supply. It also provides a measure of the energy lost per cycle in a unit volume of core material. Other magnetic properties of interest include the Magnetic Field strength (H), Saturation Flux density (BS), Remanence (Br), Coercive force (Hc) and Initial Permeability (�i). Input/Output (I/O) Analysis The analysis and comparison of the voltage and current at the Input and Output of the supply is essential in understanding the overall quality of performance of the supply as well as its efficiency. Ripple, Noise, Harmonics and Power Quality measurements are all important parameters for an accurate I/O analysis.
White Paper
4
Ripple Ripple is the AC voltage that is superimposed onto the DC output of a power supply. It is expressed as a percentage of the normal output voltage or as peak to peak volts. Linear power supplies usually see a ripple that is close to twice the line frequency (~120 Hz), whereas switching power supplies may see a switching ripple in the hundreds of kHz. Noise High dv/dt and di/dt slew rates, parasitic inductance and capacitance, layout geometry and the switching frequency all contribute to the noise at the output of the switching supply. In general, noise in the SMPS may be correlated with the switching frequency or it may be broad-band. Power System Harmonics and Distortion Harmonics may be defined as sinusoidal components that have a frequency that is an integral multiple of the fundamental frequency. Distortion is defined as any deviation of a system’s output signal waveform from that which should result from the input signal’s waveform. Distortion may be caused by non-linearities in the active device such as the op-amp, or by passive components such as coaxial cables, or by reflections in the propagation path. The term Total Harmonic Distortion (THD) is used to quantify distortion. The term expresses the distortion as a percentage of the fundamental of voltage and current waveforms. In simple terms, a pure sine wave will have no harmonics and no distortion and a non-sinusoidal wave will have both distortion and harmonics. Harmonics are a big concern for power systems. Switching power supplies have the tendency to generate odd-order harmonics, which may find their way back to the power grid. The total percentage of harmonic distortion returned to the grid can rise as the number of switching supplies connected to the grid is increased. The analysis and reduction of harmonics becomes more critical as distortion causes heat buildup in the cabling and transformers of the power grid. Power Quality Ideally, the output of a power supply should not have any switching harmonics or other non-ideal noise components. Realistically, that is not possible. Power Quality measurements such as True power, Apparent (Reactive) Power, Power Factor, Crest Factor Current Harmonics and THD help gauge the quality of the output of the supply. Power Quality measurements are essential to determine the effects of distortions caused by non-linear loads. III. Components of an Effective Power Measurement System In order for a measurement system to be most efficient, there should be seamless transfer of data and information from the device under test (DUT) to the oscilloscope. This is why the oscilloscope-to-probe interface is so important. Tektronix has recently introduced the TekVPI™ interface that takes interface design and performance to the next level. It is designed to provide ease-of-use, versatility and enhanced bidirectional communication between the oscilloscope and the probe. The biggest advantage of such bidirectional communication between the probe and oscilloscope is for the user who would like to make remote measurements. With the help of host’s network communications capabilities using USB, GPIB or Ethernet, TekVPI™ probe setups can even be remotely monitored in the user’s ATE environment. The users will be able to get the most information out of their measurement by having remote access to probe features such as attenuation setting, nulling of DC offset, bandwidth limit filters, and degauss of the residual magnetic fields in current probes. The probe Menu button, on the probe compensation box, enables users to quickly and easily access a graphical probe menu display on the TekVPI™ host oscilloscope. This display provides comprehensive information about the probe such as probe model type and serial number, its operating status and warnings, and diagnostics to aid in troubleshooting events. A noteworthy feature of the new TekVPI™ interface is the new technique for probe power management. This eliminates the need for external power supplies for current probes. As a result, the TCP0030 probe now
White Paper
5
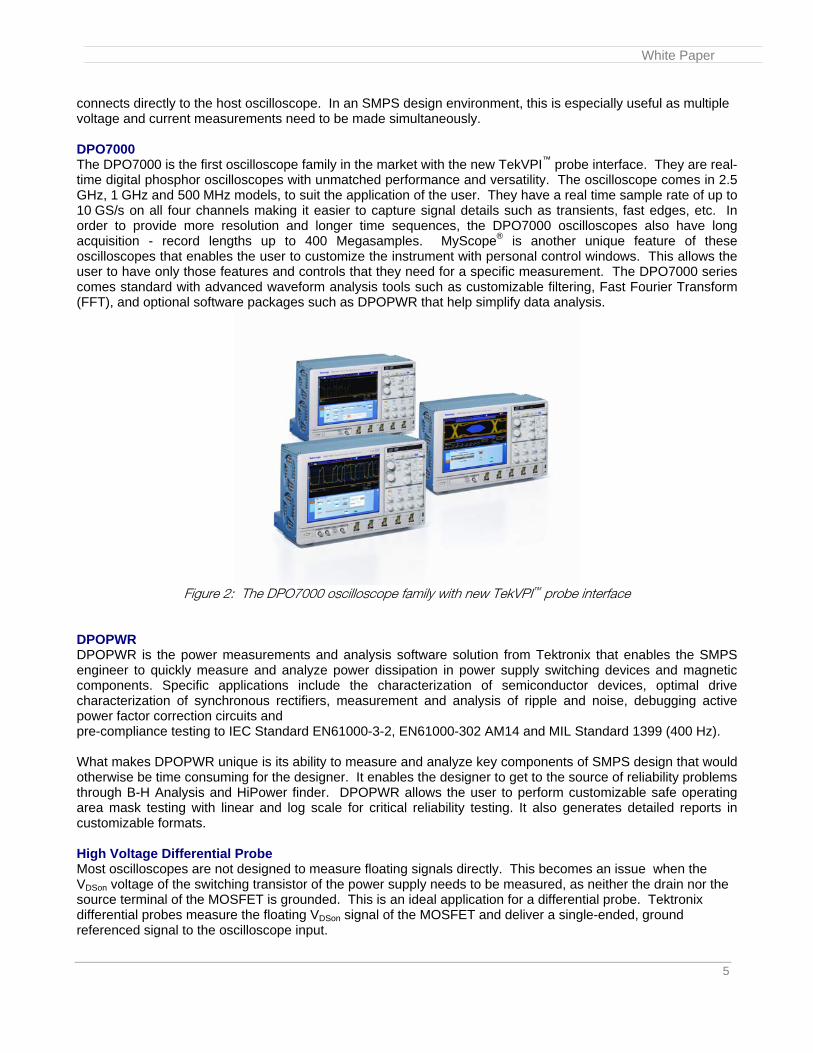
connects directly to the host oscilloscope. In an SMPS design environment, this is especially useful as multiple voltage and current measurements need to be made simultaneously. DPO7000 The DPO7000 is the first oscilloscope family in the market with the new TekVPI™ probe interface. They are real-time digital phosphor oscilloscopes with unmatched performance and versatility. The oscilloscope comes in 2.5 GHz, 1 GHz and 500 MHz models, to suit the application of the user. They have a real time sample rate of up to 10 GS/s on all four channels making it easier to capture signal details such as transients, fast edges, etc. In order to provide more resolution and longer time sequences, the DPO7000 oscilloscopes also have long acquisition - record lengths up to 400 Megasamples. MyScope® is another unique feature of these oscilloscopes that enables the user to customize the instrument with personal control windows. This allows the user to have only those features and controls that they need for a specific measurement. The DPO7000 series comes standard with advanced waveform analysis tools such as customizable filtering, Fast Fourier Transform (FFT), and optional software packages such as DPOPWR that help simplify data analysis.
Figure 2: The DPO7000 oscilloscope family with new TekVPI™ probe interface
DPOPWR DPOPWR is the power measurements and analysis software solution from Tektronix that enables the SMPS engineer to quickly measure and analyze power dissipation in power supply switching devices and magnetic components. Specific applications include the characterization of semiconductor devices, optimal drive characterization of synchronous rectifiers, measurement and analysis of ripple and noise, debugging active power factor correction circuits and pre-compliance testing to IEC Standard EN61000-3-2, EN61000-302 AM14 and MIL Standard 1399 (400 Hz). What makes DPOPWR unique is its ability to measure and analyze key components of SMPS design that would otherwise be time consuming for the designer. It enables the designer to get to the source of reliability problems through B-H Analysis and HiPower finder. DPOPWR allows the user to perform customizable safe operating area mask testing with linear and log scale for critical reliability testing. It also generates detailed reports in customizable formats. High Voltage Differential Probe Most oscilloscopes are not designed to measure floating signals directly. This becomes an issue when the VDSon voltage of the switching transistor of the power supply needs to be measured, as neither the drain nor the source terminal of the MOSFET is grounded. This is an ideal application for a differential probe. Tektronix differential probes measure the floating VDSon signal of the MOSFET and deliver a single-ended, ground referenced signal to the oscilloscope input.

White Paper
6
The existing generation of differential probes for power applications includes the P6246, P6247 and P6248 probes are capable of measuring voltages up to 8.5V differential, and the P5205 and P5210 probes capable of measuring 1300V (DC+pk AC) and 5600V (DC+pk AC) differential, respectively.
Figure 3: P6248 and P5205 Differential probes with TekProbe™ probe interface
The P6246/47/48 family of differential probes boast a typical -3dB bandwidth of up to 1.7 GHz Coupled with two range settings (850mV and 8.5V), a 200MHz bandwidth limiting filter and DC Reject (to eliminate any DC offset in the measured signal), these probes are ideal for testing and troubleshooting SMPS designs. These probes provide versatile DUT connectivity through a small form factor and a variety of other standard accessories. The P5205 probe has a bandwidth of 100MHz, and is capable of measuring a differential voltage of up to 1300V. High input impedance of the probe, switchable attenuation and the 5MHz bandwidth limiting filter make this an excellent probe for debugging and testing SMPS.
TCP0030 Current Probe As mentioned above, one of the new features of the TekVPI™ interface is the new technique for probe power management. The advantage of this new architecture is that it allows current probes with high power consumption to be connected directly to and powered from the oscilloscope, eliminating the (often bulky) external power supply. The TCP0030 is the new current probe from Tektronix, compatible with the TekVPI™ probe interface. This probe connects directly to DPO7000 and DPO4000 series oscilloscopes and provides automatic units scaling and readout on the oscilloscope display. As the case with most Tektronix current probes, it provides easy circuit connection due to its split-core architecture and still maintains a probe head size that is more convenient than other current probes. Also, the shielding in the probe head helps make better measurements in high noise environments, such as ballast design and development.

White Paper
7
Figure 4: TCP0030 Current Probe with TekVPI™ probe interface
This AC/DC current measurement probe provides greater than 120 MHz bandwidth. It is capable of measuring 50 A peak pulse current and even currents as low as 1 mA with high accuracy. This sensitivity, coupled with low noise and low DC drift, make it an ideal probe for accurately measuring power losses in SMPS and other power systems. IV. Making Power Measurements In order to make accurate and easy power measurements, one will need an oscilloscope with high record length such as the DPO7000, an oscilloscope-resident power analysis software such as DPOPWR, a differential voltage probe with a dynamic range suitable for the DUT, (such as the P6247 or P5205), and a current probe with appropriate dynamic range and sensitivity, such as the TCP0030. Electrical Characteristics This section takes a closer look at accurately measuring the power losses and SOA of an SMPS. Turn-on/Turn-off and Power Loss In most power systems, the dynamic range of the signal across the switching device is quite high – varying from tens of millivolts when the device is ON to hundreds of volts when the device is OFF. This transition of voltages across the switching device is used to compute, among other variables, the value of RDSon, which is needed to calculate power losses. The challenge with using 8-bit oscilloscopes is that they lack the range to accurately measure the two extremes simultaneously. The overdrive recovery performance of the probe and oscilloscope may also limit the accuracy of such a measurement. Oscilloscope-resident software analysis packages such as DPOPWR, allow the user to directly enter the value of RDSon, based on the switching device’s data sheet, which is then used for other power calculations. This not only simplifies the power loss analysis, but also ensures a more accurate result. The first step in accurately analyzing the turn-on, turn-off and power losses in a power system is to eliminate the errors caused by the propagation delay differences between the voltage and current probe. This process is known as deskewing. The traditional method recommends calculating the skew between the voltage and current signal and then manually adjusting the skew using the oscilloscope’s deskewing range. The second, much easier method is to simply use a Tektronix oscilloscope and deskew fixture. A third method is to have the DPOPWR software calculate the difference in propagation delay between the two probes, and automatically set up the oscilloscope.

White Paper
8
Figure 5: (a) Differences in propagation delay for the measured voltage and current signal. (b) The difference in
propagation delay is eliminated after using the Auto Deskew operation that is a part of the DPOPWR power analysis software.
Once the probes have been deskewed, the next step is to measure the voltage across and current through the device and capture these waveforms. As the voltage nodes of interest (the drain and source of the switching device) are not referenced to ground, the VDS voltage can easily be measured using a differential probe. A current probe measures the current through the switching device without breaking the circuit. The final step is to use the “switching loss” feature of the DPOPWR software. DPOPWR will measure the minimum, maximum and average power loss at the switching device, based on the acquired data. This data is processed and presented as the Turn-on loss, Turn-off loss and Power loss. DPOPWR even simplifies the analysis of a non-periodic power waveform.
Figure 6: Using DPOPWR to measure the min., max., and average power loss during turn on time at the switching
device.
In order to successfully analyze the power loss in the supply in the case of a dynamically changing load, the “HiPower Finder” feature of the DPOPWR proves to be quite useful. The software analyzes the deep memory data stored by the oscilloscope, then calculates and presents a summary of the number of switching events and max./min. switching loss in the acquired data.

White Paper
9
Figure 7: Using HiPower Finder and the oscilloscope’s zoom feature to analyze the power waveform at the
switching device during load change. Safe Operating Area The task of accurately characterizing the SOA of the switching device is also simplified by DPOPWR in conjunction with probes with good dynamic range, and an oscilloscope with good resolution. The probes are set up to measure VDS and IDS (drain-source voltage and current) or VCE and ICE (collector-emitter voltage and current) in the case of IGBTs. The software is able to generate a plot of the SOA from these measurements.
Figure 8: DPOPWR simplifies the SOA measurement of the Switching Device in an SMPS. (a) SOA calculated from
measured current and voltage waveforms (b) A full screen view of the SOA. Magnetic Characteristics In order to determine the power supply’s stability, it is important to characterize the operating region of the magnetic component while it is operating within the SMPS. Inductance DPOPWR greatly simplifies the measurement of the inductance of the switching supply’s magnetic component. The user simply needs to probe the magnetic component of the live switching supply to measure the voltage across the device and the current through it. The software uses this information to calculate the inductance.

White Paper
10
Figure 9: Inductance measurement using DPOPWR
Magnetic Power Loss The type of magnetic device determines the method for calculating the magnetic power loss in the switching supply, as the device may be a transformer, a single-winding inductor or a multiple-winding inductor. In order to determine the magnetic power losses due to a single- winding inductor, the user needs to measure the voltage across the inductor and measure the current through the inductor. The DPOPWR will automatically compute the power loss figure with this measurement information. In the case of a transformer, the power needs to be measured at the primary and secondary winding(s), using voltage and current probes. The loss is then computed using the following formula:
( )...21 ++−= SSPR PowerLossPowerLossPowerLossLossTotalPower (1) where PR represents the primary winding and S1, S2, etc. represent the secondary windings. As in the case of an inductor in a device with active power factor control, the user may need to determine and characterize the magnetic power loss with non-periodic waveforms or waveforms with burst characteristics. For such situations, DPOPWR also has provisions for making gated measurements over a limited time window. Magnetic Properties and B-H Characteristics The measurement and analysis of magnetic properties of the inductor or transformer in a switching supply is greatly simplified with the use of an oscilloscope with DPOPWR. It is only necessary to measure the voltage across and magnetizing current through the device, and then the software does the rest of the analysis. In the case of a transformer, the current through both the primary and secondary windings needs to be measured so that the software can determine the net magnetizing current. Once this is done, the user needs to enter the number of turns of the inductor (N), the magnetic length (l) and the cross-sectional area of the core (Ae). The software uses this information, along with the voltage and current measurements to create a B-H characteristics plot for the magnetic device. This B-H characteristics plot displays Bpeak, Hmax and permeability. Other magnetic properties such as Coercive force (Hc) and Remanence (Br) are also measured and displayed in the results field.

White Paper
11
Figure 10: B-H Characteristics plot for an inductor
Input/Output Analysis Input/Output Analysis provides information about the quality of the performance of the supply. Ripple and Noise Ripple and noise are the two key measurements of concern when analyzing the output quality of a switching supply. The various acquisition modes, such as sample, envelope, average, Hi-Res and Peak detect, of the DPO7000 greatly simplify this task. When trying to characterize the ripple, the challenge is to successfully and accurately separate the line ripple from the switching ripple. The output ripple of a linear supply is usually twice the line frequency at about 120 Hz whereas switching ripple is in the kHz range and is usually coupled with noise. After the voltage and current probes have been calibrated and deskewed, the “Sample Rate” of the oscilloscope should be set to less than the switching frequency of the system and much greater than the line frequency. Then the acquisition mode should be changed to “Hi-Res”. This will effectively attenuate the switching ripple, and only the low frequency AC line ripple will be displayed on the oscilloscope. This method is quite effective, since in the Hi-Res mode the oscilloscope performs a fast averaging of the waveform. The waveform is averaged over the time interval of interest and the resolution of the captured waveform is increased. This averaging process emulates a low pass filter for the waveform. The cut-off frequency of the filter depends on the horizontal sample rate. The peak detect mode is similar to Hi-Res mode, but different in that the data points that are extreme values of the waveform, are recorded. Noise and switching ripple may be captured and analyzed in this mode.

White Paper
12
(a) (b)
Figure 11: Using DPOPWR to measure (a) Line Ripple and (b) Switching Ripple.
In order to further simply this analysis, there is a selection of hardware bandwidth limiting filters available on both the oscilloscope and voltage probes. The DPO7000 has two hardware bandwidth limits at 250 MHz and 20 MHz and also features User-definable filters. It is important to note that the bandwidth limit filter that is selected, whether on the oscilloscope or the probe, limits the overall bandwidth of the measurement system. The signal conditioning feature of DPOPWR may be used to minimize the effects of inherent probe noise while making noise measurements. Power System Harmonics Fast Fourier Transform (FFT) analysis is a waveform analysis tool that comes standard with the DPO7000. FFT is an excellent tool for line harmonics analysis as it provides the user with a display of signal frequency components, similar to a spectrum analyzer. The FFT menu is located under the MATH button menu and may be performed on active or stored waveforms. In the case of switching supplies, the signal of interest is usually a repeating periodic waveform. The waveform needs to be triggered and displayed on the oscilloscope with the use of a current or voltage probe. The vertical scale should be set so that the entire signal amplitude is visible on the screen. To ensure good frequency resolution, at least five cycles of the signal should be displayed. The next step is to select a window format. For repeating periodic signals, the Hamming window is a good choice. Linear scaling, instead of logarithmic scaling, is a good choice for the vertical scaling selection. The waveform that appears on the screen may further be analyzed with the Zoom function. DPOPWR software may also be used to test Current Harmonics for compliance with the EN61000-3-2 standard AM14 (50 Hz and 60 Hz) and MIL standard 1399 for 400 Hz frequency systems.
White Paper
13
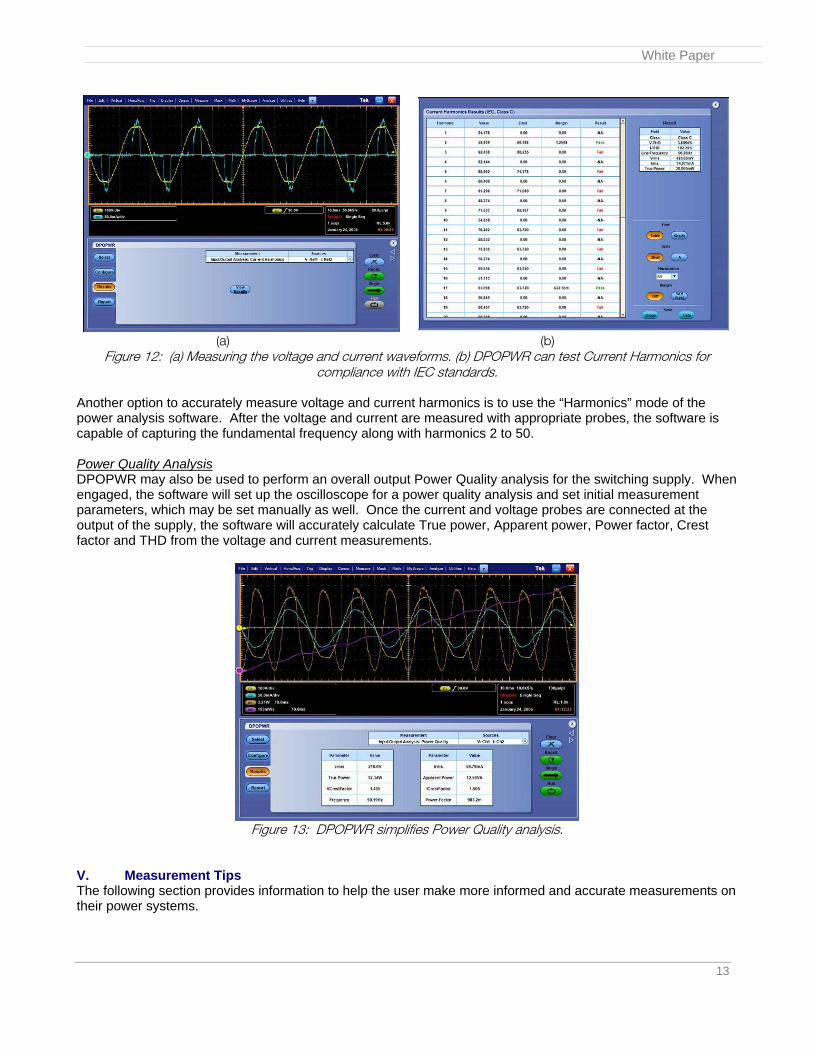
(a) (b)
Figure 12: (a) Measuring the voltage and current waveforms. (b) DPOPWR can test Current Harmonics for compliance with IEC standards.
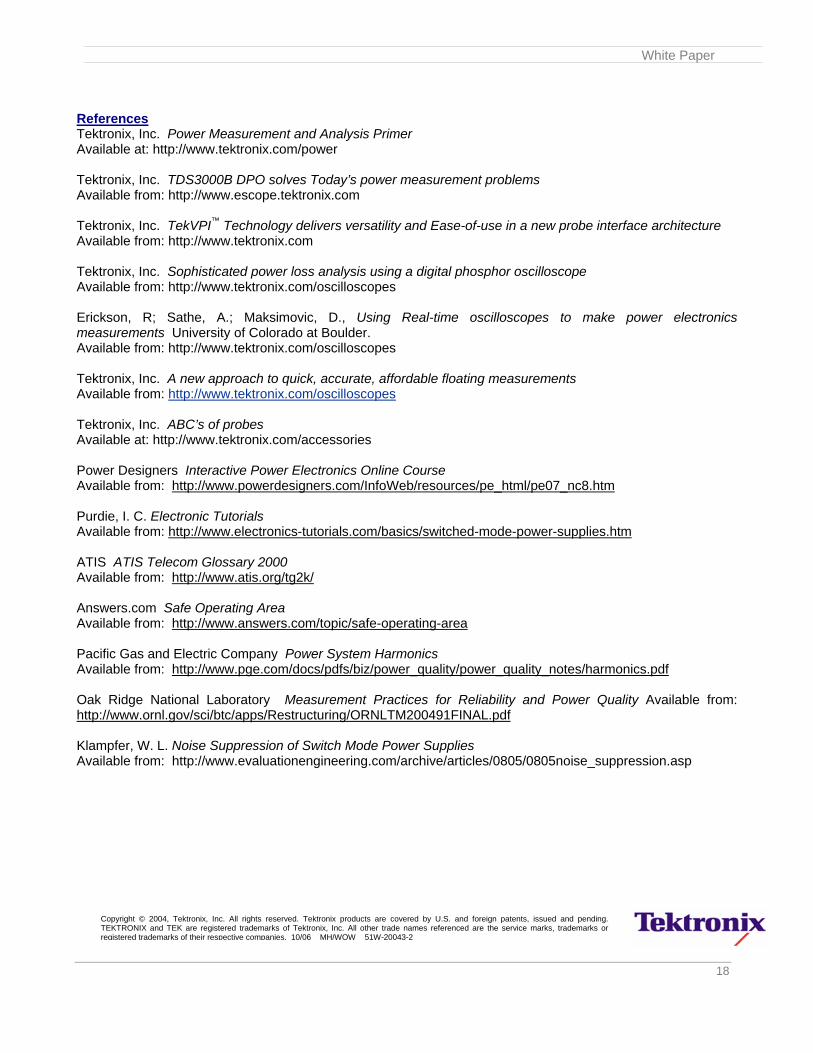
Another option to accurately measure voltage and current harmonics is to use the “Harmonics” mode of the power analysis software. After the voltage and current are measured with appropriate probes, the software is capable of capturing the fundamental frequency along with harmonics 2 to 50. Power Quality Analysis DPOPWR may also be used to perform an overall output Power Quality analysis for the switching supply. When engaged, the software will set up the oscilloscope for a power quality analysis and set initial measurement parameters, which may be set manually as well. Once the current and voltage probes are connected at the output of the supply, the software will accurately calculate True power, Apparent power, Power factor, Crest factor and THD from the voltage and current measurements.
Figure 13: DPOPWR simplifies Power Quality analysis.
V. Measurement Tips The following section provides information to help the user make more informed and accurate measurements on their power systems.

White Paper
14
Understanding the Bandwidth Requirements of the Measurement System Understanding the specification requirements of the measurement system is the first step in making an accurate measurement. It is essential that the bandwidth and rise time at the probe tip exceeds the signal frequency or rise time of the signal to be measured on the DUT.
The bandwidth (BW) of the oscilloscope should be three to five times greater than the bandwidth of the signal you plan to measure, for most applications. Also, the bandwidth of the probe should always equal or exceed the bandwidth of the oscilloscope it is going to be used with; otherwise, the probe will limit the measurement capability of the oscilloscope. By selecting an appropriate probe for the given oscilloscope, the oscilloscope’s bandwidth is essentially extended to the probe tip. As a rule of thumb, the following formula may be used to convert the oscilloscope’s specified bandwidth to rise time:
BWTr /35.0= (2) As in the case of bandwidth, the rise time of the oscilloscope should be three to five times faster than the fastest signal to be measured. The following formula may be used to determine the approximate active probe + oscilloscope system rise time:
222rSCOPErPROBErSYSTEM TTT += (3)
In the case of measuring non-sinusoidal signals, it is important to take harmonics into account. These frequency components extend well above the fundamental frequency of the signal. So, the bandwidth requirement of the measurement system should be based on the highest harmonic to be measured. For example, the 5th harmonic of a 10 MHz square wave is at a frequency of 50 MHz. In order to accurately measure this harmonic, the measurement system needs to have a bandwidth of about 250 MHz. Understanding Differential/Floating Measurements SMPS designers often need to make measurements between two points where neither point is at ground potential. Such measurements are called floating or differential measurements. Floating measurements are usually used in reference with power system measurements such as switching power supplies, motor drives, ballasts, etc. where the common node may be at hundreds of volts in potential, and neither point of measurement is at ground. In many cases, these high common signals need to be rejected in order to see and evaluate the low-level signals riding on them.
A commonly-used technique to make floating measurements involves floating the oscilloscope. This is done by disconnecting the “signal common” from earth ground, by the use of an isolation transformer or defeating the safety grounding system. This enables the chassis of the oscilloscope to assume the same potential as the ground lead connection node of the probe on the DUT. This is NOT a recommended practice for many reasons. First, by doing so, the elevated voltages on the oscilloscope present a shock hazard to the operator. Second, the oscilloscope’s power transformer insulation is stressed, which may lead to future failures such as shock and fire hazards, even if the oscilloscope is returned to its normal state. Finally, measurements made in this manner are often inaccurate, corrupted by ringing and noise. This is mainly due to the fact that when line-powered instruments are floated above ground, they exhibit a large parasitic capacitance. This is because the total capacitance of the oscilloscope chassis becomes directly connected to the node where the ground lead of the probe is connected to the DUT.

White Paper
15
Figure 14: Measurements made by floating the oscilloscope are corrupted by ringing caused by parasitic
inductance and capacitance.
A safer, more accurate and repeatable method of making floating measurements is by using differential or isolated probes. The probe is isolated from the oscilloscope’s chassis ground as neither of the probe’s inputs need to be at ground to make a measurement. Another tool to assist in making floating measurements is an isolated-channel oscilloscope. The TPS2000 series oscilloscope for example, uses IsolatedChannelTM technology to provide true and complete channel-to-channel isolation. The inputs of this oscilloscope are always floating, whether it is powered by battery or through an AC power adapter. Making Differential/Floating Measurements A typical measurement of interest in a switching power supply is the VDSon voltage of a MOSFET. Although this is a typical and necessary measurement for the test and validation of any SMPS, the actual measurement of this voltage is sometimes less than trivial. This is because neither of the two nodes of interest is at ground – requiring the designer to make a floating or differential measurement. Traditionally, differential measurements have been made by using one of two methods. The first and the most common method is to use two single-ended (usually passive) probes to make two single-ended measurements. The difference signal is obtained by measuring both signals to ground and using the oscilloscope’s math function to subtract one from the other. The second method involves using a differential probe to make the measurement. The inputs of the probe are put across the two nodes of interest and the difference voltage is viewed on the screen of the oscilloscope.
There are several concerns with using two single-ended probes to make a differential measurement. The first concern is regarding skew – or amplitude and timing errors. The two probes being used to make the measurement represent two long and independent signal paths through each probe and oscilloscope channel. Time skewing, caused by (propagation) delay differences in the two probes, becomes an issue. In high-speed signals, this may result in amplitude as well as timing errors in the measured differential signal. The best way to minimize this error is to use matched probes, or de-skew the probes before making the measurement. Another issue with this arrangement is that it does not provide adequate common-mode rejection. Channel differences in the oscilloscope have a major impact on the CMRR of the differential measurement made with two single ended probes, which only gets worse with increasing frequency. This results in a noisier differential measurement. However, if the signal being measured is low enough in frequency and high enough in amplitude, noise is usually not a concern and the method may be used with some accuracy.

White Paper
16
Differential measurements made with differential probes not only make the measurement setup much easier, they also provide a more accurate measurement of the difference signal. These probes eliminate the need for any kind of ground connection as they make a true differential measurement. The differential amplifier in the probe head determines the difference voltage and this measured signal is displayed on a single channel of the oscilloscope. These probes are designed to provide high CMRR over a broader frequency range and eliminate most of the noise concerns presented by the previous method. Also, differential probes have a small probe head and come with a variety of DUT connection accessories, which further ease the use of these probes for making differential measurements. DUT Attachment Methods Affect Signal Fidelity It is common practice to solder wire to the lead of a fine-pitch ASIC to provide a more accessible connection point for the probe. Although this may simplify the measurement setup, it can deteriorate the performance of the measurement system, depending on the speed of the signal. Accessories supplied with probes have been designed to improve the usability of the probe by providing alternative ways to connect to the DUT. However, it should not be assumed that these accessories do not impact the performance of the probe. Even a short ground lead that is added to the ground socket of an active probe alters the performance of the probe. This ground lead introduces about 20 nH/inch of inductance into the ground lead return path. This parasitic inductance forms a resonant circuit with the probe input capacitance that can lead to undesirable ringing, particularly when driven by a high-speed, low impedance source. Other accessories such as solder-down accessories, pogo pins, straight pins and variable-spacing adapters, all impact the rise time, bandwidth, and aberrations of the probe. These small parasitic inductance and capacitances from accessories may even have a significant impact on the resonance and overshoot of the measured signal when the probe is coupled to a high-speed signal.
(a) (b)
Figure 15: Accessories impact the performance of the probe they are used with. Using a differential voltage probe with (a) Straight pins and (b) Y-lead square pin adapter has a considerable impact on the measurement being made. As a rule, the user should understand the performance impact of using a particular accessory and ensure that the accessory may be used without sacrificing signal fidelity. This usually depends on the application and the characteristics of the signal under test, particularly rise time. Also, the ground and signal leads of the probe should be always be kept as short as possible. This also means that wires and conductors soldered to ASICs on the board should also be kept as short as possible. VI. Conclusion Switch mode power supplies have become the dominant architecture for the power supplies needed to run communication systems, computers, and other modern day, complex electronic systems. As a result, the quality of performance and efficiency of these supplies has become more important.

White Paper
17
The only way to ensure the proper performance, reliability, stability and safety of such a power supply is to measure, test and analyze every aspect of its performance and behavior – under normal as well as extreme operating conditions. However, dedicated tools and instruments such as power meters and harmonic analyzers are no longer a must to analyze performance and losses in switching supplies. An oscilloscope with exceptional performance in signal acquisition, along with powerful power analysis software and voltage and current probes with excellent signal fidelity create an effective measurement system for power performance and loss analysis. This measurement system not only simplifies the task of complex power system analysis, it also provides fast, repeatable and accurate results, even in dynamic environments.
White Paper
18
References Tektronix, Inc. Power Measurement and Analysis Primer Available at: http://www.tektronix.com/power Tektronix, Inc. TDS3000B DPO solves Today’s power measurement problems Available from: http://www.escope.tektronix.com Tektronix, Inc. TekVPI™ Technology delivers versatility and Ease-of-use in a new probe interface architecture Available from: http://www.tektronix.com Tektronix, Inc. Sophisticated power loss analysis using a digital phosphor oscilloscope Available from: http://www.tektronix.com/oscilloscopes Erickson, R; Sathe, A.; Maksimovic, D., Using Real-time oscilloscopes to make power electronics measurements University of Colorado at Boulder. Available from: http://www.tektronix.com/oscilloscopes Tektronix, Inc. A new approach to quick, accurate, affordable floating measurements Available from: http://www.tektronix.com/oscilloscopes Tektronix, Inc. ABC’s of probes Available at: http://www.tektronix.com/accessories Power Designers Interactive Power Electronics Online Course Available from: http://www.powerdesigners.com/InfoWeb/resources/pe_html/pe07_nc8.htm
Purdie, I. C. Electronic Tutorials Available from: http://www.electronics-tutorials.com/basics/switched-mode-power-supplies.htm ATIS ATIS Telecom Glossary 2000 Available from: http://www.atis.org/tg2k/ Answers.com Safe Operating Area Available from: http://www.answers.com/topic/safe-operating-area Pacific Gas and Electric Company Power System Harmonics Available from: http://www.pge.com/docs/pdfs/biz/power_quality/power_quality_notes/harmonics.pdf Oak Ridge National Laboratory Measurement Practices for Reliability and Power Quality Available from: http://www.ornl.gov/sci/btc/apps/Restructuring/ORNLTM200491FINAL.pdf Klampfer, W. L. Noise Suppression of Switch Mode Power Supplies Available from: http://www.evaluationengineering.com/archive/articles/0805/0805noise_suppression.asp
Copyright © 2004, Tektronix, Inc. All rights reserved. Tektronix products are covered by U.S. and foreign patents, issued and pending. TEKTRONIX and TEK are registered trademarks of Tektronix, Inc. All other trade names referenced are the service marks, trademarks or registered trademarks of their respective companies. 10/06 MH/WOW 51W-20043-2