Embed Size (px)
Citation preview

Journal of Occupational and Environmental Hygiene, 4: 391–399ISSN: 1545-9624 print / 1545-9632 onlineCopyright c© 2007 JOEH, LLCDOI: 10.1080/15459620701326521
Power Hand Tool Kinetics Associated with Upper LimbInjuries in an Automobile Assembly Plant
Chia-Hua Ku, Robert G. Radwin, and Ben-Tzion KarshDepartment of Biomedical Engineering, University of Wisconsin–Madison, Madison, Wisconsin
This study investigated the relationship between pneumaticnutrunner handle reactions, workstation characteristics, andprevalence of upper limb injuries in an automobile assemblyplant. Tool properties (geometry, inertial properties, and motorcharacteristics), fastener properties, orientation relative to thefastener, and the position of the tool operator (horizontal andvertical distances) were measured for 69 workstations using15 different pneumatic nutrunners. Handle reaction responsewas predicted using a deterministic mechanical model of thehuman operator and tool that was previously developed in ourlaboratory, specific to the measured tool, workstation, and jobfactors. Handle force was a function of target torque, tool ge-ometry and inertial properties, motor speed, work orientation,and joint hardness. The study found that tool target torquewas not well correlated with predicted handle reaction force(r = 0.495) or displacement (r = 0.285). The individual tool,tool shape, and threaded fastener joint hardness all affectedpredicted forces and displacements (p < 0.05). The averagepeak handle force and displacement for right-angle tools weretwice as great as pistol grip tools. Soft-threaded fastener jointshad the greatest average handle forces and displacements.Upper limb injury cases were identified using plant OSHA 200log and personnel records. Predicted handle forces for jobswhere injuries were reported were significantly greater thanthose jobs free of injuries (p < 0.05), whereas target torqueand predicted handle displacement did not show statisticallysignificant differences. The study concluded that quantificationof handle reaction force, rather than target torque alone, isnecessary for identifying stressful power hand tool operationsand for controlling exposure to forces in manufacturing jobsinvolving power nutrunners. Therefore, a combination of tool,work station, and task requirements should be considered.
Keywords musculoskeletal disorders, nutrunners, power handtools, repetitive motion injuries, screwdrivers, toolforce, tool torque
Address correspondence to: Robert G. Radwin, University ofWisconsin–Madison, Department of Biomedical Engineering, 1550Engineering Drive, Madison, WI 53706-1608; e-mail: [email protected].
INTRODUCTION
T his study investigates the handle forces acting againstpower screwdriver and nutrunner operators in an
automobile assembly plant. Pneumatic and electric nutrunnersare widely used in automobile assembly line processes. Thesepower hand tools often tighten threaded fasteners to a presetpeak torque (i.e., target torque) using an automatic shut-off orclutch mechanism. The tool is usually adjusted to the targettorque for a specific fastener when the tool is installed in aworkstation and frequently monitored. Many power hand toolsare adjustable over a range of torques and are available innumerous geometries and forms. Therefore a similar tool usedin one workstation might be installed in a different workstationusing a different target torque.
Work-related musculoskeletal disorders (MSD) have beenassociated with risk factors present in occupational power handtool use,(1,2) including forceful exertions.(3–6) Previous studieshave not measured forces associated with industrial nutrun-ner operation but rather estimated exertions using surrogatemeasures, such as psychophysical correlates or EMG.
Freivalds and Eklund(7) investigated power hand tool reac-tion force parameters (i.e., peak torque, rise time, duration,and impulse), muscle activity, and operator discomfort rela-tionships with regard to work surface orientation (vertical andhorizontal), threaded fastener joint hardness, tool RPM, airpressure, and handle orientation. They concluded that peakreaction torque and impulse were correlated with subjectiveratings of perceived exertion.
Based on EMG studies, Radwin et al.(8) observed thatthe tool torque magnitude and buildup time affected gripforce for right-angle nutrunners. Oh and Radwin(9,10) showedthat greater torque reaction force resulted in less stablehandle control and more movement. Longer buildup timecaused greater muscle activity for both horizontal and verticalworkstations. Both torque reaction force and buildup time hadsignificant effects on subjective ratings of perceived exertionand task acceptance rate. Armstrong et al.(11) studied muscleactivity and response to torque buildup and decay of in-line power screwdrivers. The conclusions were similar to theRadwin et al.(8) right-angle tool experiments. Torque decaytimes did not affect peak wrist muscle activity and handleexcursion.
Fennigkoh(6) found a positive relationship between torquemagnitude and grip force using a pistol grip tool simulator.
Journal of Occupational and Environmental Hygiene June 2007 391

Across all conditions, pre-torque grip force, torque duration,thrust force, and gender, the high torque magnitude (6.1 Nm)resulted in higher net changes in grip force than low torquemagnitude (2.6 Nm) did, but grip force was not significantlyaffected by the buildup duration over the 0.5–2 sec range usedin this study.
Schulze et al.(12) were interested in body posture assumedby gender, experience, work piece orientation (angled, current,and low), and tool type (pistol grip and straight grip). Theyconcluded that tool shape and workstation orientation affectedoperator posture. Kihlberg et al.(13) used a modified Borg’s CR-10 rating scale and found that rated discomfort was associatedwith the tool displacement.
Generally, most of the above referenced ergonomic researchinvolved laboratory studies and were limited in workstationorientation, tool size, shape, and characteristics, torque, andthe individual operators. Because these results were limitedin range, they may not be representative of the wide varietyof conditions observed in the manufacturing environment.A practical method is needed for estimating reaction forcesencountered during actual tool operation.
To understand the complex mechanical properties of powerhand tool operators, Lin et al.(14,15) developed a deterministichuman operator model based on Lindqvist’s hypothesis(16) thata power nutrunner operator can be represented mechanically asa single degree-of-freedom mechanical system. The dynamicpassive model considers the tool operator as an equivalentmoment of inertia, a linear rotational spring, and a viscousdamper. An apparatus with known stiffness, damping, andinertial mass was used in the laboratory to estimate thestiffness, damping, and moment of inertia (ksubject, csubject,Jsubject) of the human operator by measuring the variations inthe frequency and angular displacement that human subjectsimpose when grasping the apparatus. The observed tooloperator parameters and the mechanical model are then usedto deterministically estimate the resulting handle displacementand force from a transient torque input in a power hand tooloperation.
The biomechanical model was validated by recalling fivesubjects and having them operate a power hand tool for varyinghorizontal distances, vertical distances, and torque builduptimes.(14) The correlation between the model prediction andthe measurement was r = 0.88. When stiffness was normalizedusing EMG as an index of exertion, the model predicted actualpeak handle displacement within 3%.
The goal of this study was to apply Lin’s dynamic tooloperator model using tool and workstation data collected fromactual assembly operations. This should allow evaluation of avariety of tool geometries, shapes, tool motor characteristics(i.e., free running speed, stall torque), work locations (i.e.,horizontal and vertical distance from the operator), toolorientation (i.e., horizontal or vertical), and threaded fastenertightening operations (joint hardness and target torque) on peakhandle force and displacement, and to compare these handleforces and displacements against the injury experience in theplant.
METHODS
Jobs StudiedAt least one power hand tool was used in 193 of 393
workstations in the trim and chassis departments of an au-tomobile assembly plant in the midwestern United States. Atotal of 69 workstations in the trim and chassis areas of theplant were selected for study. The criterion for selection wasthat the job used only a single pneumatic power nutrunnerand that the tools were installed without a counterbalance orreaction bar. The plant had two daily shifts so at least twooperators worked at each job, involving a total of 138 operators.The tool parameters described below were collected for the15 distinct pneumatic nutrunners that were used in the 69workstations and can be described as right-angle or pistol griptypes.
ProceduresSpecific tool and job parameters were measured to apply
the Lin et al.(14,15,17) tool operator mechanical model forestimating tool handle reaction force and displacement. Thetool parameters measured included tool geometry (i.e., handleand tool lengths), shape (i.e., pistol or right angle), mass(kg), motor free running speed (RPM), motor stall torque(Nm), location of the center of mass (cm), mass moment ofinertia (Kgm2), target torque (Nm), and threaded fastener jointhardness (soft, medium, and hard). The job parameters werefastener horizontal and vertical distances from the operator,and tool orientation (i.e., horizontal or vertical). Measure-ment procedures for each of these parameters are describedbelow.
Tool ParametersTool type, free running speed, target torque, and stall torque
data were obtained from tool manufacturer catalogs and fromplant standard production sheets. An electronic scale (UES64;Universal Enterprises, Beaverton, Ore.) was used to weigh thetools. Threaded fastener joints were classified as hard, medium,or soft according to the materials that were joined. If bothfastened materials were metals, the joint was classified as ahard joint. If a sheet of metal was fastened to a piece of plastic,the joint was classified as a medium joint. A joint was classifiedas soft if tightened materials were both plastic, or there wasfoam or an O-ring between the joined materials.
The free suspension method(18) was used to measure thelocation of the center of mass of pistol grip tools by assumingthe tool cross sections were symmetric. Tools were suspendedby a flexible cable in two different orientations, and theintersection of two vertical plumb lines was used as the locationof the center of mass, as shown in Figure 1. By finding thebalance point for the right-angle tools, the centroid was locatedat the fulcrum, as shown in Figure 2.
The moment of inertia of pistol grip tools was measured byusing the oscillation method.(19) Each pistol grip tool was heldhorizontally by a specially designed apparatus at both ends,as shown in Figure 3. The natural period of oscillation was
392 Journal of Occupational and Environmental Hygiene June 2007

FIGURE 1. The suspension method used for determining the centroid of pistol grip tool.
obtained by swinging the tool. The moment of inertia aboutthe spindle axis can be expressed as
Jspindle = mgh/(2π f )2 (1)
where mg is the weight of the tool (N), h is the distance betweenthe spindle axis and the centroid (m), and f is the oscillationfrequency (Hz), which is the inverse of the oscillation periodof the tool.
The bifilar pendulum method was used to measure themoment of inertia of right-angle tools, which were suspendedhorizontally by two strings as shown in Figure 4. The twostrings were parallel to each other and hung the same distance
from the centroid, denoted as d(m). The distance betweenthe holding bar and right-angle tools was denoted as L (m).Oscillation period was measured by swinging the tool in thelongitudinal direction. The following formula was applied tocalculate the moment of inertia:
Jcm = mg/d(2 f 2π/L)2 (2)
Jtool = Icm + mh2 (3)
where Jcm is the moment of inertia about the center mass axis,Jtool is the moment of inertia about the spindle axis, mg is theweight of the tool (N), f is the oscillation frequency (Hz), d is
FIGURE 2. The centroid of a right-angle tool is located at the balance point.
Journal of Occupational and Environmental Hygiene June 2007 393

FIGURE 3. Pistol grip tools were clamped to a frame as illustrated.
FIGURE 4. Two strings were used to hang a right-angle tool.
394 Journal of Occupational and Environmental Hygiene June 2007

the distance between the string hanging point and the centroid(m), L is the length of the string (m), and h is the distancebetween the spindle axis and the centroid (m).
Operator Mechanical ParametersLin et al.(15) measured the rotational stiffness (ksubject ), mass
moment of inertia (Jsubject ), and the viscous damping (csubject )constants for 25 subjects operating power hand tools in variousvertical and horizontal locations. A linear combination ofmechanical parameters was used to interpolate dimensionssuch that
ksubject = αH + βV + χ H V + δ (4)
where ksubject is the stiffness, H is the horizontal distancemeasured from the operator’s ankle to the joint, V is the verticaldistance measured from the floor to the joint. The variablesα, β, χ , and δ are coefficients derived from the regressionmethod. The coefficients (α, β, χ , and δ) for moment of inertia(Jsubject ) and viscous damping (csubject ) were also determinedusing linear regression in a manner similar to Eq. 4.
In this study, the linear horizontal and vertical distancesof each workstation were measured while operators wereperforming assembly operations. The horizontal distance wasmeasured from the tool handle to the ankles, and the verticaldistance was measured from tool handle to the ground. Ifseveral tasks were performed at different locations, the averageof those horizontal distances and the average of the verticaldistances were calculated to represent the average horizontaland vertical distances of this workstation.
The handle displacement and force were estimated by usingEqs. 5 and 6,(14) where the operator mechanical parameterswere inserted and time setup increment �t was set at 1 ms.
θ i + 1 ={
1Jsubject+J tool
(�t)2 + csubject2�t
}
×[ {
2(Jsubject + Jtool
)(�t)2
}θ i
+{
csubject
2�t
2(Jsubject + Jtool
)(�t)2
}θ i − 1 + T i
](5)
where θ (t) is the variation of angular displacement with time,Jtool is the moment of inertia of the tool about its spindle, andT (t) is the variation of tool torque buildup.
F =(
csubjectdθ (t)
dt+ ksubjectθ (t)
)/L (6)
where F is the hand force and L is the hand location on the toolhandle. A plot of displacement and force against time using thismodel is available in Lin et al.(20)
Plant Injury DataInjury data was collected from the plant OSHA 101 and 200
logs at the manufacturing facility. The time period consideredin this study was 12 months within the automobile modelyear for which the tool data was obtained. Complete OSHAlogs contained employee names, department, bay location, jobstation number, date of injury, and type of injury. An upperextremity MSD was considered if the data indicated a nonacuteinjury to the fingers, hands, wrists, forearms, upper arms,or shoulders. Examples of such disorders included, but werenot limited to, tenosynovitis, epicondylitis, tendonitis, strain,and carpal tunnel syndrome. Because data were not storedelectronically, each OSHA 101 and 200 form was studied andthe data was transcribed into an Access database. Records upthrough 15 months were reviewed to help ensure that most ofthe MSDs occurring within the 12-month period were included.
RESULTS
Handle Force and DisplacementThe type of tool and threaded fastener joint hardness both
had a significant effect on peak handle force and displacement(p < 0.05). Handle force and displacement is summarized inTable I, and Figures 5 and 6. The average peak handle forceranged from 1.37 N to 57.81 N for right-angle tools, and 0.35N to 18.14 N for pistol grip tools. The average displacementranged from 0.32 mm to 38.4 mm for right-angle tools and0.19 mm to 9.21 mm for pistol tools. A wide variation offorces and displacements was also observed within similartypes of tools, which were greatly influenced by workstationand job parameters. The average peak handle force of Tool 1,for instance, was 31.8N, whereas the standard deviation (SD)
TABLE I. Predicted Peak Handle Force and Displacement
Right-Angle Tools Pistol Grip Tools
Tool 1 2 3 4 5 6 7 8 9 10 11 12 13 14 15Jobs (n) 5 3 2 7 2 3 4 1 2 2 27 4 3 2 2Force Mean 31.8 1.37 4.94 19.22 1.83 57.81 25.76 11.54 0.35 6.76 10.74 18.14 13.47 3.65 12.26(N) SD 31.5 .010 5.84 12.91 0.34 19.47 2.39 — 0.00 1.28 10.39 0.22 11.31 0.00 13.61Displacement Mean 25.1 0.32 6.21 17.65 0.38 38.40 11.32 9.21 0.19 5.16 9.34 6.73 1.97 0.42 7.78(mm) SD 29.1 0.00 8.20 14.87 0.07 19.40 0.55 — 0.00 1.24 11.14 0.15 1.41 0.00 9.43
Journal of Occupational and Environmental Hygiene June 2007 395
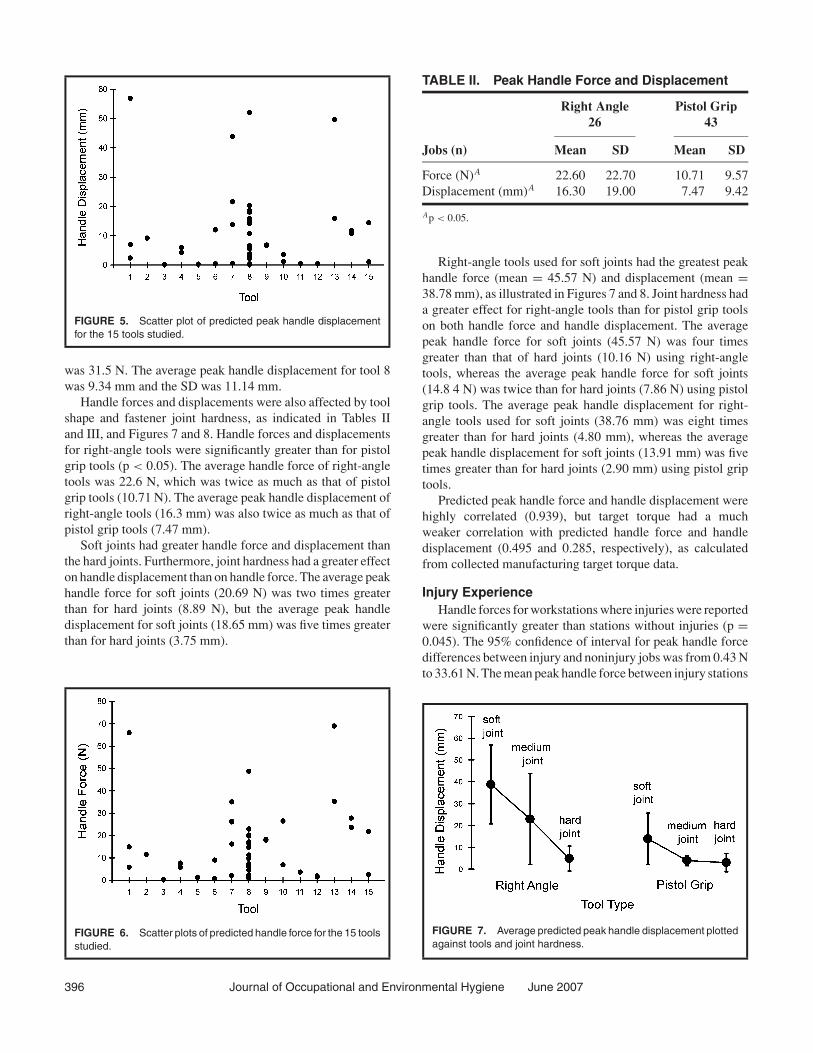
FIGURE 5. Scatter plot of predicted peak handle displacementfor the 15 tools studied.
was 31.5 N. The average peak handle displacement for tool 8was 9.34 mm and the SD was 11.14 mm.
Handle forces and displacements were also affected by toolshape and fastener joint hardness, as indicated in Tables IIand III, and Figures 7 and 8. Handle forces and displacementsfor right-angle tools were significantly greater than for pistolgrip tools (p < 0.05). The average handle force of right-angletools was 22.6 N, which was twice as much as that of pistolgrip tools (10.71 N). The average peak handle displacement ofright-angle tools (16.3 mm) was also twice as much as that ofpistol grip tools (7.47 mm).
Soft joints had greater handle force and displacement thanthe hard joints. Furthermore, joint hardness had a greater effecton handle displacement than on handle force. The average peakhandle force for soft joints (20.69 N) was two times greaterthan for hard joints (8.89 N), but the average peak handledisplacement for soft joints (18.65 mm) was five times greaterthan for hard joints (3.75 mm).
FIGURE 6. Scatter plots of predicted handle force for the 15 toolsstudied.
TABLE II. Peak Handle Force and Displacement
Right Angle Pistol Grip26 43
Jobs (n) Mean SD Mean SD
Force (N)A 22.60 22.70 10.71 9.57Displacement (mm)A 16.30 19.00 7.47 9.42
Ap < 0.05.
Right-angle tools used for soft joints had the greatest peakhandle force (mean = 45.57 N) and displacement (mean =38.78 mm), as illustrated in Figures 7 and 8. Joint hardness hada greater effect for right-angle tools than for pistol grip toolson both handle force and handle displacement. The averagepeak handle force for soft joints (45.57 N) was four timesgreater than that of hard joints (10.16 N) using right-angletools, whereas the average peak handle force for soft joints(14.8 4 N) was twice than for hard joints (7.86 N) using pistolgrip tools. The average peak handle displacement for right-angle tools used for soft joints (38.76 mm) was eight timesgreater than for hard joints (4.80 mm), whereas the averagepeak handle displacement for soft joints (13.91 mm) was fivetimes greater than for hard joints (2.90 mm) using pistol griptools.
Predicted peak handle force and handle displacement werehighly correlated (0.939), but target torque had a muchweaker correlation with predicted handle force and handledisplacement (0.495 and 0.285, respectively), as calculatedfrom collected manufacturing target torque data.
Injury ExperienceHandle forces for workstations where injuries were reported
were significantly greater than stations without injuries (p =0.045). The 95% confidence of interval for peak handle forcedifferences between injury and noninjury jobs was from 0.43 Nto 33.61 N. The mean peak handle force between injury stations
FIGURE 7. Average predicted peak handle displacement plottedagainst tools and joint hardness.
396 Journal of Occupational and Environmental Hygiene June 2007

TABLE III. Peak Handle Force and Displacement for Joint Jobs
Hard Joint Medium Joint Soft Joint27 17 21
Jobs (n) Mean SD Mean SD Mean SD
Force (N)A 8.89 9.63 18.72 9.44 20.69 19.48Displacement (mm)B 3.75 4.96 12.88 17.06 18.65 16.17
Ap < 0.05. B p < 0.01.
(29.99 N) and noninjury stations (12.97 N) is provided inTable IV.
The difference in peak handle displacement between injuryand noninjury work stations did not reach statistical signif-icance (p = 0.077) even though the mean displacement ofinjury stations was 2.5 times greater than for noninjury workstations. Target torque showed no relationship with injury (p =0.688).
Individual work stations were classified into four groupsof increasing increments of 10 N handle force. Injury riskwas calculated by dividing the number of injuries by the totalnumber of workers within each force grouping. Figure 9 showsthat injury risk increased with peak handle force. When peakhandle force increased from the 0–10 N level to the 10–19.9N level, injury risk increased form 1.3% to 10.0%. Injuryrisk was 14.3% when hand force was greater than 30 N. Adirectly proportional increase in injury risk was not observedfor increasing target torque, as illustrated in Figure 10.
Because there was a significant difference in the mean peakhandle force between injury stations and noninjury stations, alogistic regression model was tested to predict injury statusfrom hand force. The model was significant (chi-square =6.398, p = 0.01), and the Hosmer and Lemeshow goodness-of-fit test indicated the model fit the data (chi-square = 3.8180,p > 0.80). The odds of an injury case increased nearly 5% forevery additional Newton of hand force (OR = 1.0465, 95%CI: 1.0101–1.0842). The predicted probability monotonicallyincreased to 0.60 for a 70 N peak hand force, but it did notresemble a sigmoidal function in the studied force range.
DISCUSSION
The deterministic tool operator mechanical model devel-oped by Lin et. al.(14,15,17) was used for estimating peak handleforce and displacement of tools in an automobile manufactur-ing plant using workplace and tool parameters measured in thefield. Target torque, joint hardness, and work orientation allaffected handle force, even for the same pneumatic tools. Forexample, two workstations that had the same pneumatic tooland target torque but different joint hardness and workstationorientations had peak handle forces of 0.87 N and 7.42 N,respectively. Workstations 192 and 237 were similar; both hadthe same pneumatic tool and joint hardness but different targettorque and orientations, and peak handle forces were 40.16 Nand 30.64 N, respectively. Tool type by itself therefore was notthe only important parameter. Target torque, joint hardness, andorientation must be considered all together. The tool operatormodel was useful for taking all of these factors into account.
The model did not, however, account for individual operatordifferences, such as strength, experience, fatigue, and handed-ness. Similarly, the model did not consider tool installationdifferences, such as the effects of air hoses; however, theseeffects were minimized by involving only workstations thatdid not include balancers and other accessories.
The peak handle displacement for injury stations andnoninjury stations were not significantly different in thecurrent study. Wide variation of displacements may explainthis result. Kihlberg et al.(13) concluded that mean correlationbetween rated discomfort and the peak handle displacement
TABLE IV. Peak Gandle Force and Displacement for Injury and Noninjury Jobs
Handle Force (N) Handle Displacement (mm) Target Torque (Nm)
Injury Noninjury Injury Noninjury Injury Noninjury
Jobs (n) 9 60 9 60 9 60Mean 29.99 12.97 22.52 9.04 6.84 6.10SD 21.23 14.92 19.69 12.65 4.86 6.02Median 21.89 6.94 14.45 3.80 6.21 3.19Maximum 66.06 69.05 56.93 51.99 14.69 25.72Minimum 9.77 0.35 6.55 0.15 2.03 0.00
Journal of Occupational and Environmental Hygiene June 2007 397

FIGURE 8. Average predicted handle force plotted against toolsand joint hardness.
was 0.87. Kihlberg’s study was conducted in a laboratory undercontrolled experimental conditions, whereas the current studywas carried out in an actual working environment with greatervariances. The results of the two studies suggest that additionaldata may corroborate these findings.
Fennigkoh(6) found a positive relationship between torquemagnitude and grip force using a pistol grip tool simulator, butthe correlation between target torque and hand (grip) force wasnot strong in that study. Target torque was not the only variableaffecting handle force, as suggested by the current study.
The current study outcome suggested dose-response rela-tionship between injury risk and handle force; however, withlimited data that statement cannot be made with confidence.The risk of injury increased when peak handle force increased,as shown in Figure 9. The greatest difference occurred betweenthe first and the second force levels, whereas the smallestdifference occurred between the third and the highest forceincrements. Jobs could not be classified into smaller forceranges of force due to limitation of the sample size. Future
FIGURE 9. Injury risk plotted against handle force levels.
FIGURE 10. Injury risk plotted against target torque levels.
studies should include a larger sample and focus on the injuryrisk and peak handle force range between 10 N to 20 N.
The results of the logistic regression indicated that as peakhand force increased, there was a significant increase in theodds of an injury case. This is an important finding withclear implications for design. However, these results mustbe interpreted cautiously for a number of reasons. First, thelogistic regression function did not resemble the sigmoidalfunction associated with logistic regression curves in thestudied force range, and the highest predicted probabilityapproached only 0.60. This may be due to the limited number ofinjury cases in the sample and the limited sample size overall.With additional data, the true nature of the relationship betweenhand force and injury status should become more apparent.
Second, and also related to the limited sample size, isthe fact that the logistic regression model contained onlythe one predictor variable: hand force. There are certainlyother variables that have predicted the development of upperextremity musculoskeletal injuries, such as repetition andduration, but sample size precluded their inclusion. Such modelmisspecification may affect the magnitude of the hand force-injury status relationship. Nonetheless, the results suggestan important predictor of upper extremity musculoskeletalinjuries that is need of more in-depth investigation.
Risk of injury was not related to target torque, and anincreasing trend in risk was not observed for torque (Figure10). One explanation is that as torque levels increase, additionalfactors such as mechanical advantages and tool shape are usedfor controlling hand force. This means that measuring targettorque by itself, as often done in practice, may be insufficientfor identifying hazardous jobs. Handle force was the betterindicator and was a function of target torque, work orientation,and joint hardness. Therefore, tool, work station, and taskrequirements all need to be considered for controlling upperextremity MSD.
Handle force was better associated with injury than handledisplacement and target torque. The repetition rate in this studywas not considered, since the production rate was the same forall workstations and no observable differences existed among
398 Journal of Occupational and Environmental Hygiene June 2007

tool operations studied. Also, individual operator parameterssuch as age, working history, body mass index, and physicalcondition (such as fatigue) were not considered in this study.Due to the number of subjects in the 69 workstations, it wasnot practical to record individual operator characteristics in thecurrent study. The use of pneumatic tool characteristics alonecould explain some of the additional variance in the results.(21)
High-handle force tools were observed in some workstationswhere there were no injuries recorded. Furthermore, it waspossible that some of the tools observed may not have been inuse when an injury was recorded, and work methods may havealso been changed. Future research should involve a greaterstudy population with similar high exposures and accountfor additional job factors, including repetitive motions andexertions.
CONCLUSION
T he deterministic tool operator mechanical model success-fully estimated peak handle reaction force and displace-
ment of tools used in an automobile manufacturing plant basedon workplace and tool parameters measured in the field. Thisstudy found a good association between predicted handle forceand upper extremity MSD in assembly jobs involving intensiverepetitive tool use. Target torque by itself, which is sometimesused in practice, was insufficient for identifying hazardousjobs.
ACKNOWLEDGMENT
T his study was sponsored by a grant from the UAW-DaimlerChrysler Joint Committee on Occupational
Safety and Health.
REFERENCES
1. Lowe, B.D., and A. Freivalds: Effect of carpal runnel syndrome on gripforce coordination on hand tools. Ergonomics 42(4):550–564 (1999).
2. Zetterberg, C., and T. Ofverholm: Carpal tunnel syndrome and otherwrist/hand symptoms and signs in male and female car assembly workers.Int. J. Ind. Ergon. 23:193–204 (1999).
3. National Institute for Occupational Safety and Health (NIOSH):Musculoskeletal Disorders and Workplace Factors. Cincinnati, Ohio:NIOSH, 1997.
4. Muggleton, J.M., R. Allen, and P.H. Chappell: Hand and arm injuriesassociated with repetitive manual work in industry: A review of disor-ders, risk factors and preventive measures. Ergonomics 42(5):714–739(1999).
5. Armstrong, T.J., P. Buckle, L.J. Fine, et al.: A conceptual model forwork-related neck and upper-limb musculoskeletal disorders. Scand. J.Work, Environ. Health 19(2):73–84 (1993).
6. Fennigkoh, L., A. Garg, and B. Hart: Mediating effects of wrist reactiontorque on grip force production. Int. J. Ind. Ergon. 23:293–306 (1999).
7. Freivalds, A., and J. Eklund: Reaction torques and operator stress whileusing powered nutrunners. Appl. Ergon. 24(3):158–164 (1993).
8. Radwin, R.G., E. VanBergeuk, and T. J. Armstrong: Muscle responseto pneumatic hand tool torque reaction forces. Ergonomics 32(6):655–673(1989).
9. Oh, S.A., and R.G. Radwin: The effects of power hand tool dynamicsand workstation design on handle kinematics and muscle activity. Int. J.Ind. Ergon. 20(1):59–74 (1997).
10. Oh, S.A., and R.G. Radwin: The influence of target torque and torquebuild-up time on physical stress in right angle nutrunner operation.Ergonomics 41(2):188–206 (1998).
11. Armstrong, T., C. Bir, J. Foulke, B. Martin, L. Finsen, andG. Sjogaard: Muscle responses to simulated torque reactions of hand-held power tools. Ergonomics 42(1):146–159 (1999).
12. Schulze, J.H., R.J. Koppa, and J.J. Congleton: Effect of pneumaticscrewdrivers and workstations on operator body posture. Int. J. Ind. Ergon.8:17–31 (1991).
13. Kihlberg, S., A. Kjellberg, and L. Lindbeck: Pneumatic tool torquereaction: reaction forces, displacement, muscle activity and discomfort inthe hand-arm system. Appl. Ergon. 24(3):165–173 (1993).
14. Lin, J.H., R.G. Radwin, and T.G. Richard: A single-degree-of-freedomdynamic model predicts the range of human responses to impulsive forcesproduced by power hand tools. J. Biomech. 36:1845–1852 (2003).
15. Lin, J.H., R.G. Radwin, and D. Nembhard: Ergonomics applications ofa mechanical model of the human operator in power hand tool operation.J. Occup. Environ. Hyg. 2:111–119 (2005).
16. Lindqvist, B.: Torque reaction in angled nutrunners. Appl. Ergon.24(3):174180 (1993).
17. J.H., R.G. Radwin, and T.G. Richard: Handle dynamics predictionsfor selected power hand tool applications. Hum. Factors 45(4):645–656(2003).
18. Radwin, R.G., and J.T. Haney: An Ergonomics Guide to Hand Tools.Fairfax, Va.: American Industrial Hygiene Association, 1996.
19. Drillis, R., R. Contini, and M. Bluestein: Body segments param-eters: A survey of measurement technique. Artifi. Limbs 8:44–66(1964).
20. Lin, J.H., R.G. Radwin, and T.G. Richard: Dynamic biomechanicalmodel of the hand and arm in pistol grip power hand tool usage.Ergonomics 44(3):295–312 (2001).
21. Faucett, J., and R.A. Werner: Non-biomechanical factors poten-tially affecting musculoskeletal disorders. Work-Related Musculoskele-tal Disorders-Report, Workshop Summary, and Workshop Papers.Washington, D.C.: National Academy Press, pp. 175–199 (1999).
Journal of Occupational and Environmental Hygiene June 2007 399