Embed Size (px)
Citation preview

Power Efficiency Comparison of Enterprise-Class Blade Servers and Enclosures
A Dell Technical White Paper
John Beckett, Robert Bradfield, and the
Dell Server Performance Analysis Team

Power Efficiency Comparison of Enterprise-Class Blade Servers and Enclosures
ii
THIS WHITE PAPER IS FOR INFORMATIONAL PURPOSES ONLY, AND MAY CONTAIN TYPOGRAPHICAL
ERRORS AND TECHNICAL INACCURACIES. THE CONTENT IS PROVIDED AS IS, WITHOUT EXPRESS OR
IMPLIED WARRANTIES OF ANY KIND.
© 2010–2011 Dell Inc. All rights reserved. Reproduction of this material in any manner whatsoever
without the express written permission of Dell Inc. is strictly forbidden. For more information, contact
Dell.
Dell, the DELL logo, and the DELL badge, and PowerEdge are trademarks of Dell Inc. Microsoft,
Windows, and Windows Server are either trademarks or registered trademarks of Microsoft Corporation
in the United States and/or other countries. SPEC and the benchmark name SPECpower are registered
trademarks of the Standard Performance Evaluation Corporation. For more information about
SPECpower, www.spec.org. Benchmark results stated in this white paper reflect results run as of
January 10, 2011. The comparison presented in this paper is based on the enterprise-class blade servers
configured as similarly as possible currently shipping by Dell, HP and IBM. For the latest
SPECpower_ssj2008 benchmark results, visit
http://www.spec.org/power_ssj2008/results/power_ssj2008.html.
Other trademarks and trade names may be used in this document to refer to either the entities
claiming the marks and names or their products. Dell Inc. disclaims any proprietary interest in
trademarks and trade names other than its own.
Revision 1 April 2011

Power Efficiency Comparison of Enterprise-Class Blade Servers and Enclosures
iii
Contents Executive Summary ....................................................................................................... 5
Update: April 2011 ..................................................................................................... 5 Introduction ............................................................................................................. 5 Key Findings ............................................................................................................. 6
Power .................................................................................................................. 6 Performance .......................................................................................................... 6
Testing Details ............................................................................................................. 7 Methodology ............................................................................................................. 7 Results .................................................................................................................... 7 Power Draw on a Per Blade Basis .................................................................................. 12 Workload ............................................................................................................... 14 Overall ssj_ops/watt ................................................................................................. 14
Appendix A—Test Methodology ........................................................................................ 18 SPECpower_ssj2008 Standard ....................................................................................... 18 Configuration .......................................................................................................... 19 Chassis Configuration ................................................................................................ 19 BIOS Settings .......................................................................................................... 19 OS Tuning .............................................................................................................. 20 SPECpower_ssj2008 Configuration ................................................................................. 20 Power Meter Configuration ......................................................................................... 21
Appendix B—Enclosure Configuration Information ................................................................. 24 Appendix C—Blade System Configuration Information ........................................................... 25 Table 6. Blade ....................................................................................................... 25 Appendix D—Blade System Firmware and Drivers ................................................................ 26 Appendix E—SPECpower_ssj2008 Results ............................................................................ 27
Dell M1000e Blade Enclosure/16 x PowerEdge M610 ........................................................... 27 HP BladeSystem c7000/16 x ProLiant BL460c G6 ............................................................... 34 IBM BladeCenter 8852 H-Series/14 x BladeCenter HS22 7870 ................................................ 41
Tables
Table 1. SPECpower_ssj2008 Results for the 16-Blade Dell Solution ....................................... 15 Table 2. SPECpower_ssj2008 Results for the 16-Blade HP Solution ........................................ 16 Table 3. SPECpower_ssj2008 Results for the 14-Blade IBM Solution ....................................... 17 Table 4. Configuration for Testing ............................................................................... 19 Table 5. Enclosure Configuration Information ................................................................. 24 Table 6. Blade System Configuration Information ............................................................. 25 Table 7. Detailed Configuration Information for Blade Server Solutions .................................. 26

Power Efficiency Comparison of Enterprise-Class Blade Servers and Enclosures
iv
Figures
Figure 1. Blade Solution Comparison Chart ....................................................................... 7
Figure 2. Comparison of the Blade Solutions at the Active Idle Power Measurement ..................... 8
Figure 3. Power Usage Comparison of Blade Solutions at 100% Utilization .................................. 9
Figure 4. Average Power Utilization Across Workload Intervals ............................................. 10
Figure 5. Performance Comparison of Watt Ratios Across Workload Intervals ............................ 11
Figure 6. Performance Comparison at 100% Utilization ....................................................... 12
Figure 7. Comparison of the Power Utilization on a per Blade Basis ....................................... 13
Figure 8. Comparison of the Overall ssj_ops/watt Score ..................................................... 14
Figure 9. Power Measurement Diagram for the Dell Blade Solution ........................................ 21
Figure 10. Power Measurement Diagram for the HP Blade Solution .......................................... 22
Figure 11. Power Measurement Diagram for the IBM Blade Solution ......................................... 23

Power Efficiency Comparison of Enterprise-Class Blade Servers and Enclosures
5
Executive Summary
Update: April 2011 In August 2010, Dell published a white paper that compared a mainstream Dell blade solution against
comparable HP and IBM blade solutions on performance, power, and performance/watt using industry-
standard benchmarking methodology. Since that time, HP and IBM have released new Platinum-level
efficiency power supplies and updated fans. These configurations were updated accordingly and have
been re-tested to compare with the Dell results collected in 2010. The Dell result was not re-tested
because the power supplies previously used were already Platinum-level efficiency, and all other
components have remained performance and power neutral.
At the time of the new test, Dell also measured the HP BL460c G7 blade servers and compared this
data with the G6 server data gathered from the previous test. All of the results fell within the same
performance and power level as the previous BL460c G6 results. Thus, it was concluded that the new
G7-generation BL460c blade servers do not appreciably impact the performance or power
characteristics of the HP blade solution as compared to the G6 results.
Introduction With rising energy costs continuing to demand larger portions of organizational budgets, Dell Inc. (Dell)
commissioned its Server Performance Analysis team to use the industry standard SPECpower_ssj2008
benchmark to compare the power draw and performance per watt of blade solutions from Dell, HP, and
IBM. The purpose of the testing was to examine on a level playing field the true power efficiency of the
top three global blades server providers and compare and contrast the results. Each blade
configuration included an enclosure configured as similarly as possible and was fully populated with
each company’s best-selling blade servers1 using identical processor, RAM and hard drive selections and
included Platinum Efficiency Power Supplies for all three vendors.
The results were clear. In like-for-like comparisons, a Dell M1000e enclosure fully populated with 16
M610 blade servers consistently demonstrated significant advantages over both the IBM BladeCenter H
enclosure fully populated with 14 HS22 blade servers and the Hewlett-Packard C7000 enclosure fully
populated with 16 BL460C G6 blade servers in both power draw and performance-per-watt, regardless
of utilization levels. While the actual monetary impact of these savings may vary for a variety of
reasons, such as the regional disparity in cost of electricity and overall data center power and cooling
design efficiency, there is no doubt that the performance and power efficiency of Dell M-series blades
can result in significant operational cost savings.
1IDC Worldwide Quarterly Server Tracker Q1 CY2010 results

Power Efficiency Comparison of Enterprise-Class Blade Servers and Enclosures
6
Key Findings Key findings from the study for power and performance are summarized below.
Power
In the CPU utilization midrange (40–60%), the HP C7000 enclosure fully populated with 16
BL460C G6 blade servers used 11–14% more power per chassis than the Dell M1000e enclosure
fully populated with 16 M610 blades.2 See Figure 4.
When measured full-chassis to full-chassis, the IBM BladeCenter H enclosure fully populated
with 14 HS22 blade servers used 53.2% more power at idle than the Dell M1000e enclosure
fully populated with 16 M610 blade servers, despite having two fewer blade servers.2 See
Figure 2.
A HP C7000 enclosure fully populated with 16 BL460C G6 blade servers used 27.9% more
power than the Dell M1000e enclosure fully populated with 16 M610 blade servers at idle and
9.7% more at 100% CPU utilization.2 See Figure 2 and Figure 3.
The Dell M1000e enclosure fully populated with 16 M610 blade servers used less power per
blade across all load levels than the HP C7000 enclosure fully populated with 16 BL460C G6
blade servers.2 See Figure 7.
In head-to-head testing with fully populated chassis, IBM HS22 blades used 74% more power
per blade at idle than Dell PowerEdge M610 blade servers.2 See Figure 7.
In head-to-head testing with fully populated chassis, IBM HS22 blades used an average of
10.3% more power per blade at 100% CPU utilization than Dell PowerEdge M610 blade
servers.2 See Figure 7.
Performance
The Dell M1000e enclosure fully populated with 16 M610 blade servers achieved a higher
performance to power ratio across all load levels than the HP C7000 enclosure fully
populated with 16 BL460C G6 blade servers or the IBM BladeCenter H enclosure fully populated
with 14 HS22 blade servers.2 See Figure 5.
Despite drawing less power, the Dell M1000e enclosure fully populated with 16 M610 blade
servers provided 14.2% greater performance than the IBM BladeCenter H enclosure fully
populated with 14 HS22 blade servers at 100% utilization.2 See Figure 6.
The Dell M1000e enclosure fully populated with 16 M610 blade servers achieved up to 13.7%
performance/watt than the HP C7000 enclosure fully populated with 16 BL460C G6 blade
servers and up to 16% higher performance/watt than the IBM BladeCenter H enclosure fully
populated with 14 HS22 blade servers.2 See Figure 8.
Test methodology and detailed results are documented in this paper.
2Source: Based on SPECpower_ssj2008 testing conducted by Dell Labs reported in Power Efficiency Comparison of Enterprise-Class Blade Servers and Enclosures, a Dell Technical White Paper (Revised April 2011). Comparisons based on similarly configured full-rack blade servers (Dell: 16 blades, HP: 16 blades, IBM: 14 blades). Actual performance will vary with configuration, usage, and manufacturing variability. For the full white paper, visit http://www.dell.com/downloads/global/products/pedge/en/BladePowerStudyWhitePaper_08112010_final.pdf.
Power Efficiency Comparison of Enterprise-Class Blade Servers and Enclosures
7
Testing Details
Methodology SPECpower_ssj2008 is an industry standard benchmark created by the Standard Performance Evaluation
Corporation (SPEC) to measure a server’s power and performance across multiple utilization levels.
Appendix A details the test methodology used by Dell, Appendices B–D detail configuration for the
tests, and Appendix E provides detailed report data that supports the Results in this paper.
Results The Dell blade solution delivered the best SPECpower_ssj2008 result (see Figure 1), coming in at 2,530
overall ssj_ops/watt compared to the HP blade solution, which came in with 2,226 overall ssj_ops/watt
(Dell 13.7% higher). The IBM blade solution came in last with 2,181 overall ssj_ops/watt (Dell 16%
higher). This result is even more notable due to the fact that IBM is only capable of providing 14 blade
servers per chassis, and thus is providing a solution that, despite drawing equivalent power with the
Dell system through all utilization levels except idle (where it becomes 53.2% worse than the Dell blade
solution), is not capable of the same raw performance per chassis that HP or Dell can provide using
identical processor and memory architectures.
Figure 1. Blade Solution Comparison Chart
1.04 1.00 1.00 1.00
1.14
1.28
0.881.001.00
1.53
0.86 0.88
0.00
0.20
0.40
0.60
0.80
1.00
1.20
1.40
1.60
1.80
100% avg power (lower is better)
Active Idle Power (lower is better)
SPECpower_ssj2008 overall ssj_ops/watt (higher is
better)
100% ssj_ops (higher is better)
No
rmal
ize
d V
alu
es
Normalized Blade Solution ComparisonPower Utilization, Performance/Watt and Performance
Dell 16-Blade Solution HP 16-Blade Solution IBM 14-Blade Solution
Power Efficiency Comparison of Enterprise-Class Blade Servers and Enclosures
8
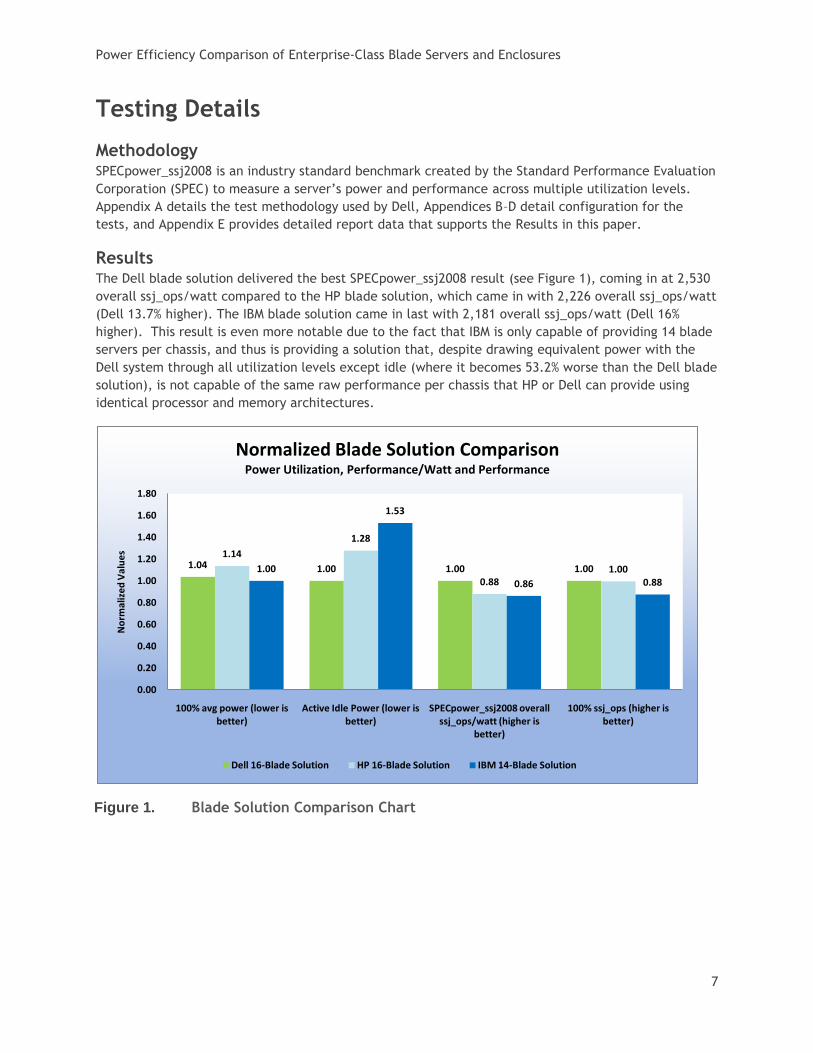
SPECpower_ssj2008 includes a measurement of power while the blades are idle at the final phase of
the benchmark. As Figure 2 shows, the full enclosure of 16 Dell PowerEdge M610 blade servers used
27.9 percent less overall power while idle than the HP blade solution. In addition, the 16 Dell
PowerEdge M610 blade servers used 53.2 percent less overall power while idle than the 14 IBM HS22
blade servers. The 16-blade Dell PowerEdge M610 solution used 1,288 watts at idle, while the 16-blade
HP ProLiant BL460c solution used 1,647 watts at idle. The 14-blade IBM HS22 solution used 1,973 watts
at idle.
Figure 2. Comparison of the Blade Solutions at the Active Idle Power Measurement
1,288
1,647
1,973
0
500
1,000
1,500
2,000
2,500
Dell 16-Blade Solution HP 16-Blade Solution IBM 14-Blade Solution
Ave
rage
wat
ts@
act
ive
idle
SPECpower_ssj2008average watts @ active Idle
(lower watts are better)

Power Efficiency Comparison of Enterprise-Class Blade Servers and Enclosures
9
SPECpower_ssj2008 includes a measurement of power while the blades are at 100% utilization. As
Figure 3 shows, the full enclosure of 16 Dell PowerEdge M610 blade servers used 11.5 percent less
overall power at 100% utilization than the HP blade solution but 4% percent more than the IBM
BladeCenter H enclosure with 14 HS22 blade servers. It is important to note that even though the IBM
blade solution drew less power at 100% utilization than did the Dell blade solution, the IBM solution has
two fewer blades to power than either the Dell or HP blade solutions. The 16-blade Dell PowerEdge
M610 solution used 4,372 watts at 100% utilization, while the 16-blade HP ProLiant BL460c solution
used 4,797 and the 14-blade IBM HS22 solution used 4,219 watts (despite the fact that the IBM blade
solution has 2 less blades than the Dell & HP blade solutions).
Figure 3. Power Usage Comparison of Blade Solutions at 100% Utilization
4,372
4,797
4,219
3,000
3,500
4,000
4,500
5,000
Dell 16-Blade Solution HP 16-Blade Solution IBM 14-Blade Solution
Ave
rage
wat
ts@
10
0%
su
bm
eas
ure
me
nt
SPECpower_ssj2008average watts @ 100% workload
(lower watts are better)

Power Efficiency Comparison of Enterprise-Class Blade Servers and Enclosures
10
Figure 4 shows the average interval power in watts while running the workload at 100% target load
down to 10 percent in stepped 10 percent utilization increments as reported by the SPECpower_ssj2008
benchmark. A full enclosure of 16 Dell PowerEdge M610 blade servers used less power than the 16 HP
ProLiant BL460c G6 blade servers and the 14 IBM HS22 blade servers across all of the
SPECpower_ssj2008 target load levels. The power deltas were greater between the Dell blade solution
and the HP blade solution, where at higher utilization levels (60%–100%) we saw a difference of
between 13 and 18.9% in favor of the Dell blade solution. The IBM blade solution was helped greatly
with the addition of Platinum-level efficiency power supplies, and almost all workload levels were
brought +/- 4% of the Dell blade solution, with the exception of idle which was still 53.2% worse than
the Dell solution. However, the IBM blade solution only had 14 blades versus the Dell and HP solutions’
16 blades, so it is important to keep this in mind when evaluating total chassis power.
Figure 4. Average Power Utilization Across Workload Intervals
0
1,000
2,000
3,000
4,000
5,000
6,000
100% 90% 80% 70% 60% 50% 40% 30% 20% 10% Active Idle
Ave
rage
Po
we
r In
Wat
ts
Workload Percentile
SPECpower_ssj2008Average Power at Each Workload Percentile
Dell 16-Blade Solution HP 16-Blade Solution IBM 14-Blade Solution

Power Efficiency Comparison of Enterprise-Class Blade Servers and Enclosures
11
Figure 5 shows the performance-to-watt ratio results for the target load percentages. Results are the
measured throughput (performance) divided by the average power consumption for each of the
workload intervals. The 16 HP ProLiant BL460c G6 blade servers achieved almost identical 100%
throughput to the 16 Dell PowerEdge M610 blade servers , but used more power at this and every other
workload interval. As a result, the Dell blade solution achieved a higher performance-to-watt ratio
than the HP blade solution across all load levels. The 16 Dell PowerEdge M610 blade servers achieved
14% higher throughput than the 14 IBM BladeCenter HS22 Blade servers, and used close to equivalent
power across all workload intervals. As a result, the Dell blade solution also achieved a higher
performance-to-watt ratio than the IBM blade solution across all load levels.
Figure 5. Performance Comparison of Watt Ratios Across Workload Intervals
0
500
1,000
1,500
2,000
2,500
3,000
3,500
4,000
100% 90% 80% 70% 60% 50% 40% 30% 20% 10%
Pe
rfo
rman
ce t
o W
att
Rat
io
Target Load Percentages
SPECpower_ssj2008Performance To Watt Ratios
(Higher Is Better)
Dell 16-Blade Solution HP 16-Blade Solution IBM 14-Blade Solution

Power Efficiency Comparison of Enterprise-Class Blade Servers and Enclosures
12
SPECpower_ssj2008 includes a measurement of performance at 100% utilization. As Figure 6 shows, the
full enclosure of 16 Hewlett-Packard BL460c blades was almost equivalent in performance to the Dell
PowerEdge M-Series blade solution. However, the 16 Dell PowerEdge M610 blade servers achieved
14.2% higher performance at 100% utilization than the 14 IBM HS22 blade servers. The 16-blade Dell
PowerEdge M610 solution achieved 14,785,342 ssj_ops at 100% utilization, while the 16-blade HP
ProLiant BL460c solution achieved 14,731,173 and the 14-blade IBM HS22 solution was able to reach
12,946,642 ssj_ops.
Figure 6. Performance Comparison at 100% Utilization
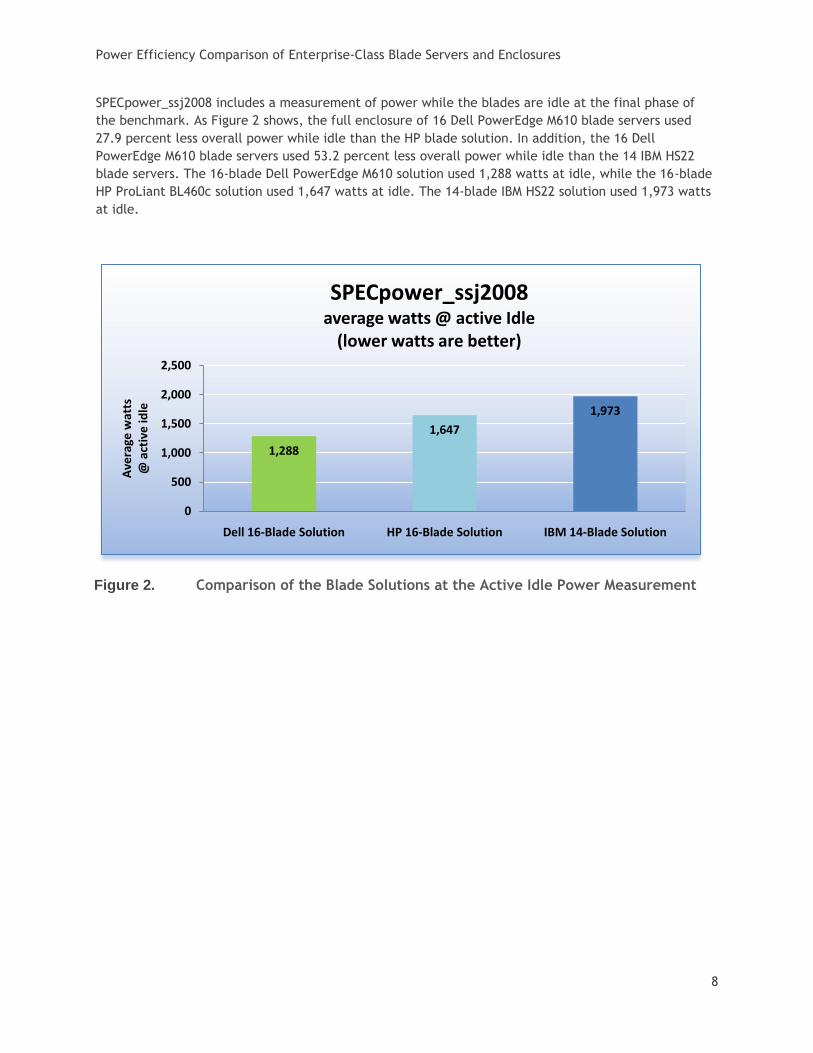
Power Draw on a Per Blade Basis Due to the inequities in the number of blades per chassis between the 14 Blade IBM solution and the 16
Blade Dell and HP solutions, we also looked at the power draw on a per blade basis by dividing the
average power for each SPECpower load level by the number of blades in each chassis. We saw that the
Dell blade solution was more power efficient on a per blade basis at every load level than either the HP
blade solution or the IBM blade solution at every load level. The efficiency differences are especially
striking when comparing the Dell blade solution against the IBM blade solution at the active idle
workload level, where the IBM solution draws 74% more power at idle on a per blade basis as the Dell
blade solution. The Dell blade solution calculated on a per blade basis drew 81W versus 141W for the
14,785,342 14,731,173
12,946,642
12,000,000
12,500,000
13,000,000
13,500,000
14,000,000
14,500,000
15,000,000
Dell 16-Blade Solution HP 16-Blade Solution IBM 14-Blade Solution
ssj_
op
s @
10
0%
su
bm
eas
ure
me
nt
SPECpower_ssj2008ssj_ops @ 100% WorkloadHigher ssj_ops are better
Power Efficiency Comparison of Enterprise-Class Blade Servers and Enclosures
13
IBM blade solution. The HP blade solution used 27% more power on a per blade basis at idle than the
Dell blade solution, where the per blade power utilization was calculated to be 103W for the HP
solution, and 81W for the Dell solution.
In addition, when comparing the Dell blade solution against the IBM blade solution at the 100% load
level on a per blade basis, the IBM blade solution drew 10% more power than the Dell blade solution.
The Dell solution on a per blade basis was calculated to draw 273W versus 301W for the IBM solution.
The HP blade solution drew up to 9.8% more power at the 100% load level than the Dell blade solution
on a per blade basis, where the per blade power utilization was calculated to be 273W for the Dell
blade solution versus 300W for the HP blade solution. See Figure 7.
Figure 7. Comparison of the Power Utilization on a per Blade Basis
0
50
100
150
200
250
300
350
100% 90% 80% 70% 60% 50% 40% 30% 20% 10% Active Idle
Ave
rage
Po
we
r in
Wat
ts
Power Draw per Blade Across All Load LevelsLower watts are better
Dell Per Blade HP Per Blade IBM Per Blade

Power Efficiency Comparison of Enterprise-Class Blade Servers and Enclosures
14
Workload During a SPECpower_ssj2008 run, the system under test runs three calibration phases to determine the
100% workload target ssj_ops. Once this value is determined, then the benchmark runs the 100%
workload interval, collecting performance and power data, and then scales the workload back in 10%
increments until reaching the active idle measurement interval. The active idle interval runs no
workload on the server(s) under test, but the power is collected for 5 minutes and averaged.
The final SPEcpower_ssj2008 score is the server’s performance (in ssj_ops) summed across all workload
intervals, divided by the average power summed across all workload intervals. A higher
SPECpower_ssj2008 ssj_ops/watt score is better.
Overall ssj_ops/watt Figure 8 shows the SPECpower_ssj2008 results for the Dell blade solution, the HP blade solution, and
the IBM blade solution in overall ssj_ops/watt.
Figure 8. Comparison of the Overall ssj_ops/watt Score
2,5302,226 2,181
0
500
1,000
1,500
2,000
2,500
3,000
Dell 16-Blade Solution HP 16-Blade Solution IBM 14-Blade Solution
SPEC
po
we
r_ss
j20
08
Ove
rall
Sco
re
SPECpower_ssj2008 Overall ssj_ops/wattScore Comparison

Power Efficiency Comparison of Enterprise-Class Blade Servers and Enclosures
15
Table 1 shows the SPECpower_ssj2008 results for the Dell PowerEdge solution for each target load.
Table 1. SPECpower_ssj2008 Results for the 16-Blade Dell Solution
Dell PowerEdge M610 (16 total blades)
Performance Power Performance to Power Ratio
Target Load
Actual Load ssj_ops Average Active Power (W)
100% 99.70% 14,785,342 4,372 3,382
90% 90.00% 13,344,934 3,987 3,347
80% 79.90% 11,853,404 3,646 3,251
70% 70.00% 10,380,753 3,359 3,090
60% 60.00% 8,903,133 3,104 2,868
50% 50.00% 7,412,879 2,900 2,556
40% 40.00% 5,928,182 2,692 2,203
30% 30.00% 4,444,109 2,496 1,781
20% 20.00% 2,971,405 2,301 1,292
10% 10.00% 1,481,894 2,067 717
Active Idle 0 1,288 0
∑ssj_ops / ∑power = 2,530

Power Efficiency Comparison of Enterprise-Class Blade Servers and Enclosures
16
Error! Reference source not found. shows the SPECpower_ssj2008 results for the HP blade solution for
each target load. (Lower Watts are better. Higher ssj_ops are better.)
Table 2. SPECpower_ssj2008 Results for the 16-Blade HP Solution
HP Solution (16 total blades)
Performance Power Performance to Power Ratio Target Load Actual Load ssj_ops Average Active Power (W)
100% 99.60% 14,731,173 4,797 3,071
90% 90.00% 13,311,919 4,489 2,965
80% 80.00% 11,829,340 4,209 2,811
70% 70.00% 10,355,907 3,908 2,650
60% 59.90% 8,861,732 3,564 2,486
50% 50.00% 7,391,761 3,263 2,265
40% 40.10% 5,929,365 3,002 1,975
30% 29.90% 4,427,243 2,773 1,596
20% 20.00% 2,958,463 2,558 1,157
10% 10.00% 1,480,831 2,308 642
Active Idle 0 1,647 0
∑ssj_ops / ∑power = 2,226

Power Efficiency Comparison of Enterprise-Class Blade Servers and Enclosures
17
Table 3 shows the SPECpower_ssj2008 results for the IBM blade solution for each target load.
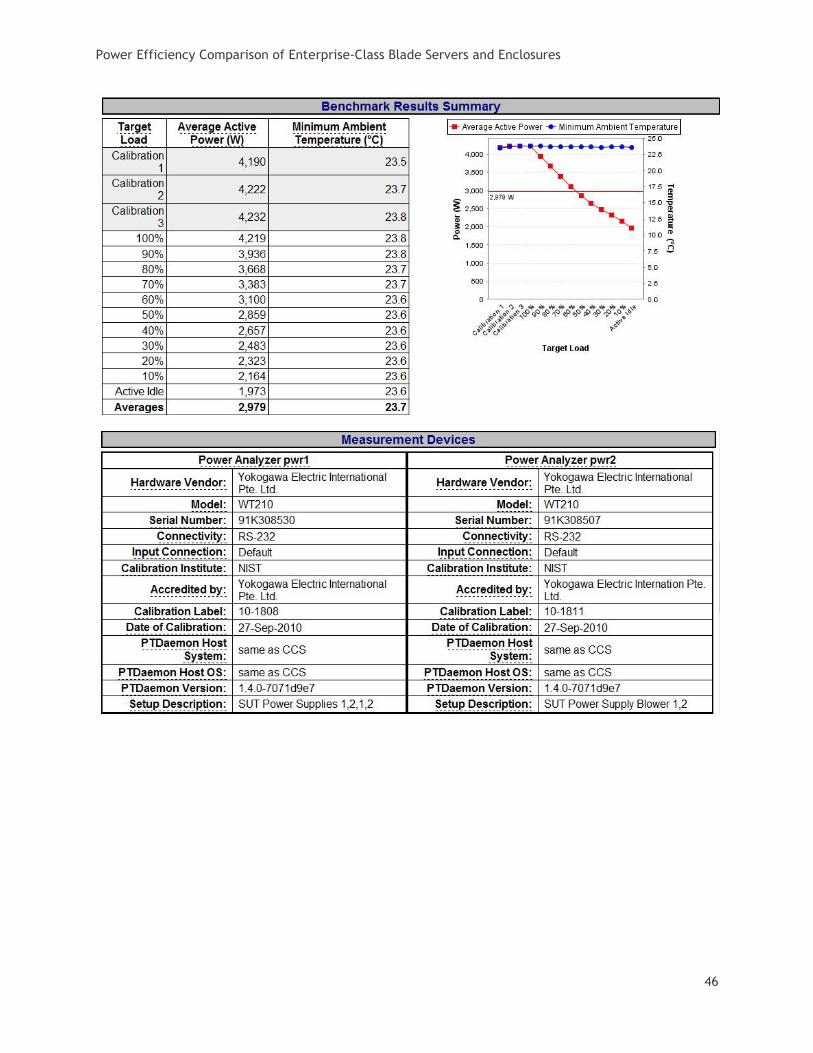
Table 3. SPECpower_ssj2008 Results for the 14-Blade IBM Solution
IBM HS22 (14 total blades)
Performance Power Performance to Power Ratio
Target Load
Actual Load ssj_ops Average Active Power (W)
100% 99.60% 12,946,642 4,219 3,069
90% 90.10% 11,710,021 3,936 2,975
80% 80.00% 10,404,203 3,668 2,836
70% 70.00% 9,103,903 3,383 2,691
60% 60.00% 7,803,387 3,100 2,517
50% 50.00% 6,501,809 2,859 2,274
40% 40.00% 5,200,655 2,657 1,957
30% 30.00% 3,902,419 2,483 1,571
20% 20.00% 2,598,522 2,323 1,118
10% 10.00% 1,303,518 2,164 602
Active Idle 0 1,973 0
∑ssj_ops / ∑power = 2,181

Power Efficiency Comparison of Enterprise-Class Blade Servers and Enclosures
18
Appendix A—Test Methodology
SPECpower_ssj2008 Standard SPECpower_ssj2008 is an industry standard benchmark created by the Standard Performance Evaluation
Corporation (SPEC) to measure a server’s power and performance across multiple utilization levels.
SPECpower_ssj2008 consists of a Server Side Java (SSJ) workload along with data collection and control
services. SPECpower_ssj2008 results portray the server’s performance in ssj_ops (server side Java
operations per second) divided by the power used in watts (ssj_ops/watt). SPEC created
SPEcpower_ssj2008 for those who want to accurately measure the power consumption of their server in
relation to the performance that the server is capable of achieving with ssj2008 workload.
SPECpower_ssj2008 consists of three main software components:
Server Side Java (SSJ) Workload—Java database that stresses the processors, caches and
memory of the system, as well as software elements such as OS elements and the Java
implementation chosen to run the benchmark.
Power and Temperature Daemon (PTDaemon)—Program that controls and reports the power
analyzer and temperature sensor data.
Control and Collect System (CCS)—Java program that coordinates the collection of all the data.
For more information on how SPECpower_ssj008 works, see http://www.spec.org/power_ssj2008/.
All results discussed in this whitepaper are from ―compliant runs‖ in SPEC terminology, which means
that although they have not been submitted to SPEC for review, Dell is allowed to disclose them for the
purpose of this study. All configuration details required to reproduce these results are listed in
Appendices A, B, and C, and all result files from the runs compared are included in Appendix D.
Each blade solution was configured by installing a fresh copy of Microsoft® Windows Server® 2008
Enterprise R2 on each blade with the operating system installed on a two-hard drive RAID 1 (or RAID 1 +
0 in the case of the HP blade solution) choosing the ―full installation‖ option for each.
The latest driver and firmware update packages available to all three blade solutions were installed at
the time the data run for that chassis type. Refer to Appendix B for details.
The Dell Server Performance Analysis Team ran SPECpower_ssj2008 three times per configuration
across all three blade solutions and chose the highest overall ssj_ops/watt score for each configuration
to compare for this study.
Power Efficiency Comparison of Enterprise-Class Blade Servers and Enclosures
19
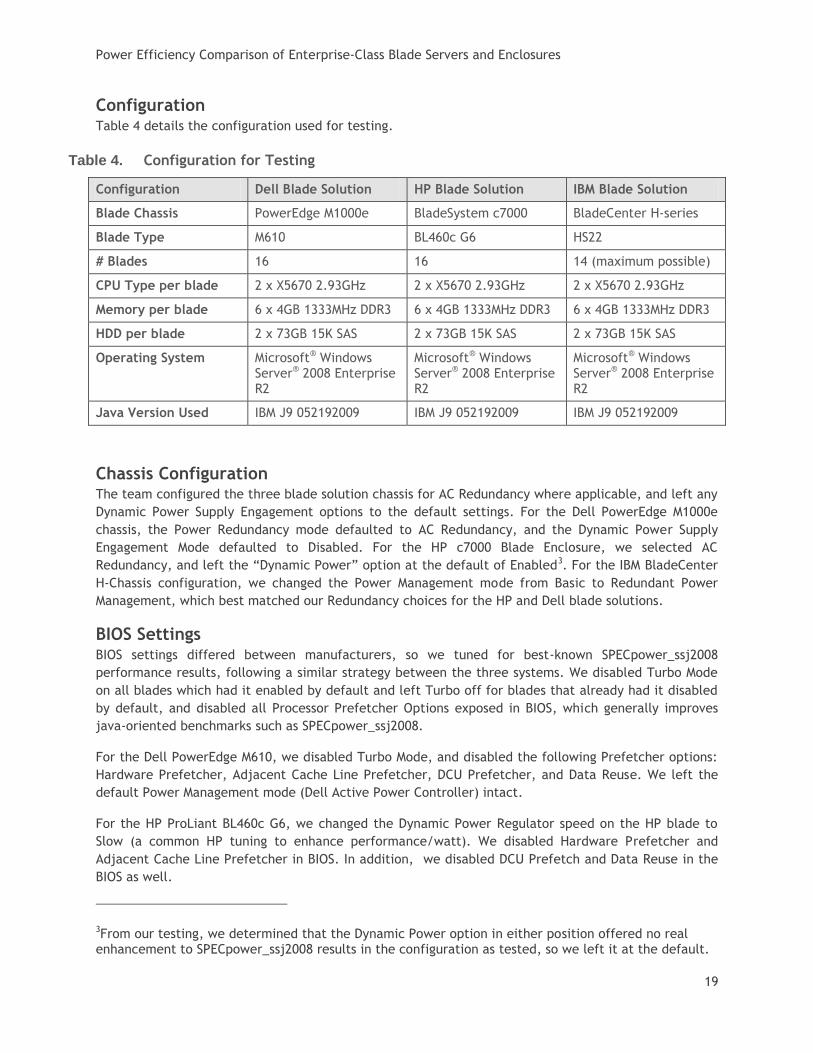
Configuration Table 4 details the configuration used for testing.
Table 4. Configuration for Testing
Configuration Dell Blade Solution HP Blade Solution IBM Blade Solution
Blade Chassis PowerEdge M1000e BladeSystem c7000 BladeCenter H-series
Blade Type M610 BL460c G6 HS22
# Blades 16 16 14 (maximum possible)
CPU Type per blade 2 x X5670 2.93GHz 2 x X5670 2.93GHz 2 x X5670 2.93GHz
Memory per blade 6 x 4GB 1333MHz DDR3 6 x 4GB 1333MHz DDR3 6 x 4GB 1333MHz DDR3
HDD per blade 2 x 73GB 15K SAS 2 x 73GB 15K SAS 2 x 73GB 15K SAS
Operating System Microsoft® Windows Server® 2008 Enterprise R2
Microsoft® Windows Server® 2008 Enterprise R2
Microsoft® Windows Server® 2008 Enterprise R2
Java Version Used IBM J9 052192009 IBM J9 052192009 IBM J9 052192009
Chassis Configuration The team configured the three blade solution chassis for AC Redundancy where applicable, and left any
Dynamic Power Supply Engagement options to the default settings. For the Dell PowerEdge M1000e
chassis, the Power Redundancy mode defaulted to AC Redundancy, and the Dynamic Power Supply
Engagement Mode defaulted to Disabled. For the HP c7000 Blade Enclosure, we selected AC
Redundancy, and left the ―Dynamic Power‖ option at the default of Enabled3. For the IBM BladeCenter
H-Chassis configuration, we changed the Power Management mode from Basic to Redundant Power
Management, which best matched our Redundancy choices for the HP and Dell blade solutions.
BIOS Settings BIOS settings differed between manufacturers, so we tuned for best-known SPECpower_ssj2008
performance results, following a similar strategy between the three systems. We disabled Turbo Mode
on all blades which had it enabled by default and left Turbo off for blades that already had it disabled
by default, and disabled all Processor Prefetcher Options exposed in BIOS, which generally improves
java-oriented benchmarks such as SPECpower_ssj2008.
For the Dell PowerEdge M610, we disabled Turbo Mode, and disabled the following Prefetcher options:
Hardware Prefetcher, Adjacent Cache Line Prefetcher, DCU Prefetcher, and Data Reuse. We left the
default Power Management mode (Dell Active Power Controller) intact.
For the HP ProLiant BL460c G6, we changed the Dynamic Power Regulator speed on the HP blade to
Slow (a common HP tuning to enhance performance/watt). We disabled Hardware Prefetcher and
Adjacent Cache Line Prefetcher in BIOS. In addition, we disabled DCU Prefetch and Data Reuse in the
BIOS as well.
3From our testing, we determined that the Dynamic Power option in either position offered no real enhancement to SPECpower_ssj2008 results in the configuration as tested, so we left it at the default.

Power Efficiency Comparison of Enterprise-Class Blade Servers and Enclosures
20
For the IBM BladeCenter HS22, we disabled both exposed Processor Prefetcher options in BIOS: Cache
Data Prefetch and Data Reuse. In addition, we enabled Processor C-States (disabled by default) to
make the system more comparable to the HP and Dell blade solutions which have this option enabled
by default. Enabling C-States enhances SPECpower_ssj2008 competitiveness by allowing the processor
to reduce power to the cores to save energy at lower utilization levels, especially at idle.
OS Tuning To improve Java performance, large pages were enabled by entering Control Panel->Administrative
Tools->Local Security Policy->Local Policies->User Rights Assignment->Lock Pages in Memory. An option
was changed to add Administrator.
Operating System Power Management mode for all solutions was changed from Balanced (the default)
to Power Saver and Power Saver mode was edited to turn off the Hard Drive after 1 minute. Since the
IBM BladeCenter HS22 does not have a BIOS Power Management algorithm similar to Dell Active Power
Controller or HP Dynamic Power Saver, we changed the minimum processor state of the Power Saver
plan from 5% to 0% and the maximum processor state from 75% to 100%. This tuning mimics other Intel®
Xeon® processor 5600 series based IBM SPECpower disclosures.
We configured each blade with a separate IP address on the same subnet as our SPECpower_ssj2008
controller system where the Director, CCS, and PTDaemon components were located, and connected
each blade to a Dell 24-port Gigabit switch external to the blade enclosure to ensure network
connectivity to the controller system.
SPECpower_ssj2008 Configuration IBM J9 Java Virtual Machine (JVM)4 was used for all three blade solutions, as this JVM provided the best
performance for SPECpower_ssj2008 of any of the available choices at the time that this study was
undertaken.
The following JVM options were used on all three blade solutions, as they are the best-known JVM
tunings for SPECpower_ssj2008 for the IBM J9 JVM when running with larger memory configurations:
-Xmn1400m -Xms1875m -Xmx1875m -Xaggressive -Xcompressedrefs -Xgcpolicy:gencon -
XlockReservation -Xnoloa –Xlp
The following bindings were used to ensure that each of the six JVMs ran on four logical processors:
start /affinity [F,F0,F00,F000,F0000,F00000]
4JVM build 2.4, J2RE 1.6.0 IBM J9 2.4 Windows Server® 2008 amd64-64 jvmwa64 60sr5-20090519_35743
Power Efficiency Comparison of Enterprise-Class Blade Servers and Enclosures
21
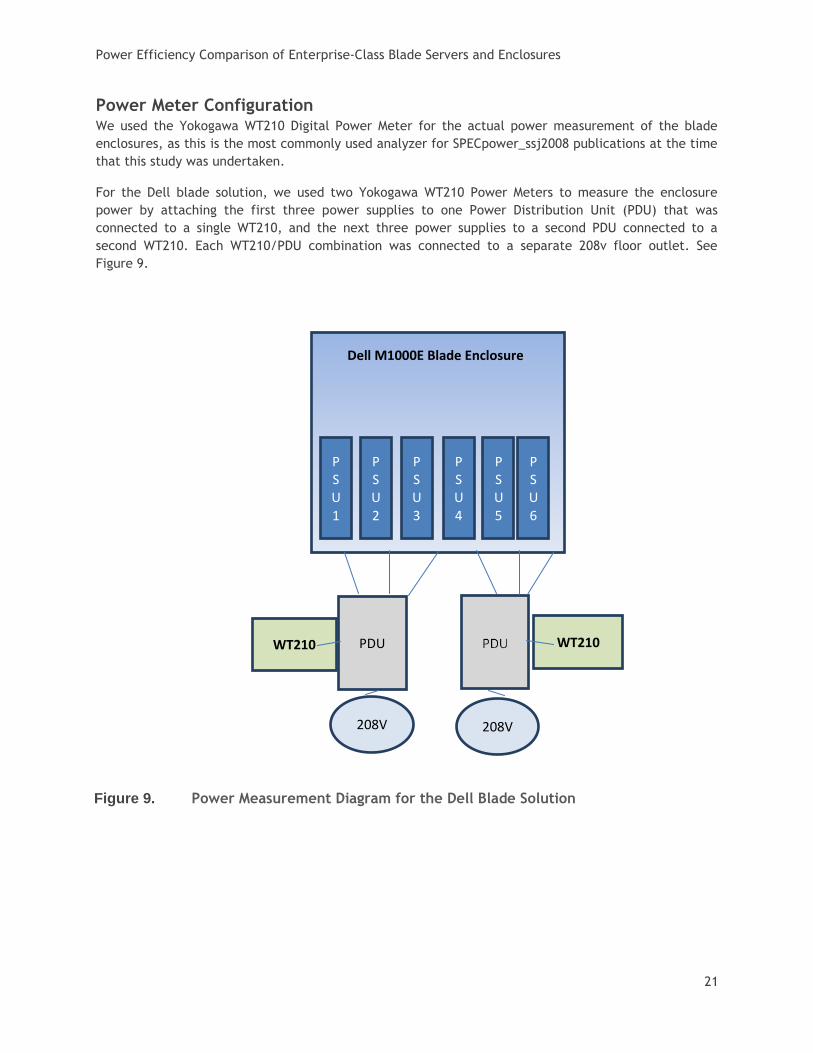
Power Meter Configuration We used the Yokogawa WT210 Digital Power Meter for the actual power measurement of the blade
enclosures, as this is the most commonly used analyzer for SPECpower_ssj2008 publications at the time
that this study was undertaken.
For the Dell blade solution, we used two Yokogawa WT210 Power Meters to measure the enclosure
power by attaching the first three power supplies to one Power Distribution Unit (PDU) that was
connected to a single WT210, and the next three power supplies to a second PDU connected to a
second WT210. Each WT210/PDU combination was connected to a separate 208v floor outlet. See
Figure 9.
Figure 9. Power Measurement Diagram for the Dell Blade Solution
PSU1
PSU2
PSU3
PSU4
PSU5
PSU6
PDU WT210 WT210
208V 208V
Dell M1000E Blade Enclosure

Power Efficiency Comparison of Enterprise-Class Blade Servers and Enclosures
22
For the HP blade solution, we used two Yokogawa WT210 Digital Power Meters to measure the enclosure power by attaching the first three power supplies to one Power Distribution Unit (PDU) that was connected to a single WT210, and the next three power supplies to a second PDU connected to a second WT210. Each WT210/PDU combination was connected to a separate 208v floor outlet. See Figure 10.
Figure 10. Power Measurement Diagram for the HP Blade Solution
The IBM blade solution presented a challenge. The IBM Blade Enclosure has two sets of three power
cables coming from the rear of the unit. Because the power cable connector was different than the Dell and HP Blade Enclosures, we were forced to use a different PDU that would accept the NEMA C20 plug from the IBM enclosure. Each PDU only had two power receptacles to connect power cables, so we used three Yokogawa WT210 Digital Power Meters and three PDUs to measure power from this enclosure. Both of the cable bundles from the rear of the IBM enclosure contained three power cables. The first cable was marked ―PSU 1,2‖, the next marked ―PSU 3,4‖, and the last marked ―Blower.‖ We attached the ―PSU 1,2‖ from the first cable bundle and ―PSU 1,2‖ cable from the second cable bundle to one Yokogawa WT210/PDU combination. The Blower power cables from both bundles were attached to a second Yokogawa WT210/PDU combination. Finally, the ―PSU 3,4‖ power cable from the first cable bundle and the ‖PSU 3,4‖ power cable from the second cable bundle were attached to a third
PSU1
PSU2
PSU3
PSU4
PSU5
PSU6
PDU WT210 WT210
208V 208V
HP c7000 Blade Enclosure

Power Efficiency Comparison of Enterprise-Class Blade Servers and Enclosures
23
Yokogawa WT210/PDU combination. Each WT210/PDU combination was connected to a separate 208v floor outlet.5 See Figure 11.
Figure 11. Power Measurement Diagram for the IBM Blade Solution
5We also tried connecting power cable ―1,2‖ and ―3,4‖ from the first cable bundle to the first Yokogawa WT210/PDU combination, the blower cables to the second WT210/PDU combination, and power cables ―1,2‖ and ―3,4‖ from the second cable bundle to the third Yokogawa WT210/PDU combination, but got slightly lower SPECpower results using this cabling configuration, so we reverted to the above described cabling methodology (pairing similarly marked cables to PDUs).

Power Efficiency Comparison of Enterprise-Class Blade Servers and Enclosures
24
Appendix B—Enclosure Configuration Information
Table 5. Enclosure Configuration Information
Dell PowerEdge M1000e
HP BladeSystem c7000
IBM BladeCenter H-Chassis 8852
Dimensions and Specifications
Height (inches) 17.3 17.5 15.75
Width (inches) 17.6 17.5 17.5
Depth (inches) 29.7 32 29
U size in server rack 10 10 9
Number of blades 16 16 14
Chassis Management Firmware CMC 3.0.0 (build 32)
Onboard Administrator 3.21
Advanced Module Management bpet54p
Power Supplies
Total number 6 6 4
Wattage of each 2700 2450 2980
Power Supply Part Number G803N 570493-101 39Y7414
Cooling Fans
Total number 9 10 2 Blower Modules
I/O Modules in Chassis
Gigabit Pass Through Modules
2 x Dell 16-port Gigabit Pass-Through
2 x HP 16-port Gigabit Pass-Through
2 x IBM 14-Port Gigabit Pass-Through

Power Efficiency Comparison of Enterprise-Class Blade Servers and Enclosures
25
Appendix C—Blade System Configuration Information
Table 6. Blade System Configuration Information
Servers Dell PowerEdge M610 HP ProLiant BL460c G6 IBM HS22 7870 4HU
Memory Modules
Total RAM in system (GB) 24 24 24
Vendor and model number
Samsung M393B5170FHD-CH9
Micron MT36JSZF51272PY-1G4D1AB
Samsung M392B5170EM1-CH9
Type PC3-10600R PC3-10600R PC3-10600R
Speed (MHz) 1333 1333 1333
Speed in system as tested 1333 1333 1333
Timing/latency CAS 9 CAS 9 CAS 9
Number of RAM modules 6 x 4 GB 6 x 4 GB 6 x 4 GB
Rank organization Dual Rank Dual Rank Dual Rank
Hard Disk
Vendor and model number
Hitachi HUC151473CSS600 Seagate ST973452SS Seagate ST973452SS
Number of disks in system 2 2 2
Size (GB) 73 73 73
Buffer size (MB) 16 16 16
RPM 15,000 15,000 15,000
Type SAS 6 Gbps SAS SAS 6 Gbps
RAID Type RAID 1 RAID 1 + 0 RAID 1
Controller PERC H200 Modular SmartArray P410i LSI SAS StorPort 1064E
Operating System
Name
Microsoft® Windows Server® 2008 R2 Enterprise
Microsoft® Windows Server® 2008 R2 Enterprise
Microsoft® Windows Server® 2008 R2 Enterprise
Build number 7600 7600 7600
File system NTFS NTFS NTFS
Language English English English
Network Adapter
Vendor and model number
Broadcom® BCM5709S NetXtreme® II Broadcom® 57711 10GbE
Broadcom® BCM5709S NetXtreme® II
Type Integrated Integrated Integrated

Power Efficiency Comparison of Enterprise-Class Blade Servers and Enclosures
26
Appendix D—Blade System Firmware and Drivers
Table 7. Detailed Configuration Information for Blade Server Solutions
Servers Dell PowerEdge M610 HP ProLiant BL460c G6 IBM HS22 7870 4HU
Driver/Firmware Updates
Network Firmware 5.0.13 2.1.5.9 (B) 2.1.5a
Network Drivers 14.2.0 A00 6.0.60.0 5.2.17.0d
HBA Firmware A01 3.66 15 2.72
HBA Drivers A01 6.20.0.64 1.31.02.00
HDD FW N/A N/A 1.08.00
Video Driver A02 6.14.10.6748 1.01.004
Power Management Controller Firmware N/A 3.4 (D) N/A
Management Controller Driver N/A 1.13.0.0 N/A
Power Management Driver N/A 1.15.0.0 N/A

Power Efficiency Comparison of Enterprise-Class Blade Servers and Enclosures
27
Appendix E—SPECpower_ssj2008 Results This appendix provides actual detailed reports and results from Dell testing using tools from the
Standard Performance Evaluation Corporation. Benchmark results stated above reflect results run as
of July 6, 2010. For the latest SPECpower_ssj2008 benchmark results, visit
http://www.spec.org/power_ssj2008/results/power_ssj2008.html.
Dell M1000e Blade Enclosure/16 x PowerEdge M610

Power Efficiency Comparison of Enterprise-Class Blade Servers and Enclosures
28

Power Efficiency Comparison of Enterprise-Class Blade Servers and Enclosures
29

Power Efficiency Comparison of Enterprise-Class Blade Servers and Enclosures
30

Power Efficiency Comparison of Enterprise-Class Blade Servers and Enclosures
31
Power Efficiency Comparison of Enterprise-Class Blade Servers and Enclosures
32

Power Efficiency Comparison of Enterprise-Class Blade Servers and Enclosures
33

Power Efficiency Comparison of Enterprise-Class Blade Servers and Enclosures
34
HP BladeSystem c7000/16 x ProLiant BL460c G6

Power Efficiency Comparison of Enterprise-Class Blade Servers and Enclosures
35

Power Efficiency Comparison of Enterprise-Class Blade Servers and Enclosures
36

Power Efficiency Comparison of Enterprise-Class Blade Servers and Enclosures
37

Power Efficiency Comparison of Enterprise-Class Blade Servers and Enclosures
38

Power Efficiency Comparison of Enterprise-Class Blade Servers and Enclosures
39

Power Efficiency Comparison of Enterprise-Class Blade Servers and Enclosures
40

Power Efficiency Comparison of Enterprise-Class Blade Servers and Enclosures
41
IBM BladeCenter 8852 H-Series/14 x BladeCenter HS22 7870

Power Efficiency Comparison of Enterprise-Class Blade Servers and Enclosures
42
Power Efficiency Comparison of Enterprise-Class Blade Servers and Enclosures
43

Power Efficiency Comparison of Enterprise-Class Blade Servers and Enclosures
44

Power Efficiency Comparison of Enterprise-Class Blade Servers and Enclosures
45
Power Efficiency Comparison of Enterprise-Class Blade Servers and Enclosures
46

Power Efficiency Comparison of Enterprise-Class Blade Servers and Enclosures
47

Power Efficiency Comparison of Enterprise-Class Blade Servers and Enclosures
48