Embed Size (px)
Citation preview

POVERTY REDUCTION STRATEGIES IN SOUTH
AFRICA
by
BHEKIZIZWE NTUTHUKO MBULI
submitted in fulfillment of the requirements
for the degree of
MASTER OF COMMERCE
in the subject
ECONOMICS
at the
UNIVERSITY OF SOUTH AFRICA
SUPERVISOR: PROF OA AKINBOADE
JOINT-SUPERVISOR: DR P LALTHAPERSAD-PILLAY
MARCH 2008

i
Declaration
Student number: 357-484-86
I declare that POVERTY REDUCTION STRATEGIES IN SOUTH AFRICA is my
own work and that all the sources that have been used or quoted from have been
acknowledged by means of complete references.
Signature (Mr B.N. Mbuli) ……………………..
Date ……………………………………………..

ii
Acknowledgements
It gives me great pleasure to thank a number of people without whom this dissertation
could not have been completed.
Although it seemed as if he had perennial work-related commitments, my supervisor,
Professor Olu Akinboade, was always willing to spare his valuable time, including seeing
me on weekends and whenever I needed guidance in preparing this dissertation. The
imparting of his unique wisdom during our discussions has made a big difference in my
life, both within and outside the academic context. I would also like to thank him for his
support and patience, as I encountered a number of family-related difficulties while
preparing this dissertation.
Similarly, special thanks are due to my joint supervisor, Dr Pinky Lalthapersad-Pillay, for
her patience, moral support and valuable contribution during the preparation of this
dissertation.
Lastly, I would like to thank my special family and friends for constantly supporting me
with love and patience.
iii
Abstract
Between 45-57% of South Africans are estimated to be engulfed by poverty. In an
attempt to identify policy instruments that could help change this status quo, the various
strategies that have been implemented in countries (e.g. China, Vietnam and Uganda) that
are known to have been relatively successful in reducing poverty are reviewed. In the
process, this dissertation discusses the literature regarding poverty, with a particular
emphasis on the definition, measurement and determinants thereof. Furthermore, South
Africa’s anti-poverty strategies are discussed. It turns out that these have met limited
success. This is largely due to insufficient pro-poor economic growth, weak
implementation/administration at the municipal level, slow asset redistribution, high
income/wealth inequality, low job generation rate by SMME’s, high HIV/AIDS infection
rate, public corruption and inadequate monitoring of poverty. Therefore, if meaningful
progress towards poverty reduction is to be achieved, the government needs to deal with
the foregoing constraints accordingly.

iv
Key Terms
Poverty; poverty reduction; anti-poverty strategies; poverty alleviation; safety nets;
absolute poverty; chronic poverty; transient poverty; relative poverty; inflation; social
security system; head count ratio; gini-coefficient; pro-poor economic growth;
globalisation; unemployment; human capital; unskilled labour; productive assets; trickle-
down effect principle; basic needs; HIV/AIDS; land reform programme; infrastructure
investment; household; natural disasters; household head; SMME; population growth;
former homelands; market access; good governance; apartheid; democracy; South Africa;
China; Vietnam; Uganda; African National Congress.

v
Table of Contents
Declaration………………………………………..………………………………..i
Acknowledgements………………………….………………………………….ii
Abstract……………………………………………………………………………..iii
Key Terms………………………………………………………………………….iv
Chapter One: Introduction
1.1 Introduction…………………………………………………………..…………..1
1.2 An overview of the extent and distribution of poverty in South Africa……….…3
1.2.1 Where are the poor in South Africa?……………………………………………4
1.2.2 Who are the poor in South Africa?……………………………………………...5
1.3 Problem statement………………………………………………………………. 7
1.4 Objectives of this study…………………………………………………...……...8
1.5 Outline of this study……………………………………………..……………….9

vi
Chapter Two: Literature Review: Definition and Measurement
of Poverty
2.1 Introduction………………………………………………………………………..…12
2.2 Defining poverty…………………………………………………………………..…14
2.2.1 Concepts closely related to poverty………………………………………………..15
2.2.2 Different types of poverty………………………………………………….…….…19
2.2.3 Moving towards a definition of poverty……………………… ………………………...22
2.3 Measuring poverty………..……………………………………………………….…24
2.3.1 Measuring poverty using monetary indicators….……………………………..…..25
2.3.1.1 Choice of indicators for measuring monetary poverty: consumption and income
indicators…………………………………………………………….…………...….…..26
2.3.1.2 Poverty lines based on the consumption/expenditure approach…………………27
2.3.1.3 Computing poverty indices……………………………………………….…...…30
2.3.2 Human poverty and development approaches…..………………………….…...…35
2.3.2.1 Human Poverty Index (HPI)………………………………………………..……36
2.3.2.2 Human Development Index (HDI)………………………………………….……37
2.4 Conclusion……………………………………………………………………….….39
Chapter Three: Determinants of Poverty
3.1 Introduction…………………...…………………………………………………..….41
3.2 The roots of poverty……..…..……………………………………………………....45

vii
3.2.1 A synopsis of how colonisation and apartheid policies engendered economic
disempowerment among blacks in South Africa…….……………………………..…….46
3.3 Global or exogenous determinants of poverty…………………………………...…..53
3.3.1 The negative effects of globalisation and poverty………………………….………54
3.4 Macro-level determinants of poverty……………………………………………...…59
3.4.1 Environmental/situational characteristics………………………..………….…….59
3.4.1.1 Natural disasters (floods, droughts, etc.) and poverty……...…….…….…….…60
3.4.1.2 Rural location and poverty……………………………………….…………..….63
3.4.1.2.1 Factors contributing to low income and poverty in rural areas…….….…..…64
3.4.1.3 Internal migration and poverty…………………..……………….………..…....65
3.4.1.3.1 Migration as a cause of poverty………………………………….…….……...66
3.4.2 Economic characteristics and poverty……………………………….……………68
3.4.2.1 Stagnant/shrinking economic growth and poverty…………………..………..…69
3.4.2.2 Inflation and poverty………………………………………………….……..…...70
3.4.3 Social characteristics…………………………………………………….…..….…72
3.4.3.1 Rapid population growth and poverty…………………………………..……….72
3.4.3.1.1 Rapid population growth-poverty link…..……………………………...….…..72
3.4.3.2 Inequality and poverty…..……………………………………………..……..….74
3.4.3.2 Public corruption and poverty…..……………………………………………....75
3.5 Household or individual level characteristics and poverty………………………….77
3.5.1 Demographic characteristics………………………...……….…………………...77
3.5.1.1 A large household size with a high proportion of dependants and poverty…..... 77
3.5.1.2 Age of the household head and poverty…………….……………………………79
3.5.1.3 Gender of the household head and poverty…………………………………...…79
3.5.2 Economic characteristics……………………………………………………..…....80

viii
3.5.2.1 Lack of gainful employment opportunities and poverty….………………..…...81
3.5.2.1.1 Employment-poverty link ……..………………………………………..…….81
3.5.2.1.2 Underemployment-poverty link ………………………………………..……..84
3.5.2.2 Inadequate access to productive assets and markets and poverty…...………....84
3.5.3 Social characteristics ……………………………………..………….…………..85
3.5.3.1 Ill-health and poverty………………………………..….………………………85
3.5.3.2 HIV/AIDS and poverty………………………………..….…………………...…87
3.5.3.3 Inadequate access to education and poverty……………………………………88
3.5.3.4 Inadequate access to decent shelter and poverty….…….….…………………..90
3.6 Conclusion ……….…..……………………………………..………………………91
Chapter Four: International Best Practices
4.1 Introduction……..…………………………………………………………………..93
4.2 Theoretical recommendations on how best to reduce poverty………..………….…98
4.2.1 The similarities between the World Bank’s recommendations and those of other
institutions…………………….…………………………………………….…………102
4.3 What are the international best practices with regard to poverty reduction?……...103
4.3.1 An overview of how China managed to reduce poverty during the 1981-2003
period…………………………………………………………………….….…………103
4.3.1.1 Rural reform (1978-1984)…………………………………………….…….…104
4.3.1.2 The National Targeted Poverty Reduction Programmess (1986-1993)….…...106
4.3.1.3 The 8-7 Plan (1994-2000)……………………………………………..……....107
4.3.1.4 China’s current poverty reduction strategy: the New Century Rural Poverty
Alleviation Plan (2001-2010)…………………………………..…………….………..109

ix
4.3.2 An overview of how Vietnam managed to reduce poverty during the 1993-2004
period……………………………………………………………….………….……….110
4.3.2.1 The impact of economic growth on poverty reduction during the 1993-2004
period…………………………………………………………………………………..110
4.3.2.2 The impact of national poverty reduction programmes on poverty reduction
during the 1993-2004
period………………………………………………………………………..……………113
4.3.3 An overview of how Uganda managed to reduce poverty during the 1992-2000
period………………………………………………………………………….……….116
4.3.3.1 The impact of economic growth on poverty reduction during the 1992-2000
period……………………………………………………………….……………….…116
4.3.3.2 The impact of poverty reduction programmes on poverty reduction during the
1992-2000 period……..…………………………..…………………………………….120
4.3.4 Moving towards international best practices…..…………………………………121
4.3.4.1 Creation of economic opportunities for the poor: augmenting the poor people’s
assets and providing them with market access……………………………..…….…….122
4.3.4.2 Good governance: sound macroeconomic management……….…...….………124
4.3.4.3 Targeted programmes: social safety nets……………………………………………125
4.4 Conclusion………………………………………………………………….……....126
Chapter Five: South Africa’s Poverty Reduction Strategies in
the Post-Apartheid Era
5.1 Introduction….……………..………………………………………………………130
5.2 Poverty reduction through economic growth: the trickle-down effect principle…...136
5.3 Using job creation as a poverty reduction measure…...……………………………139
x
5.3.1 Creating jobs through skill-enhancing education and training…………………..141
5.3.2 Creating jobs through providing financial and non-financial support to
SMMEs…………………………..……………………………………………………...145
5.3.3 Special pro-employment programmes: public works programmes…………..……149
5.4 Ameliorating the livelihood of the poor by enhancing their access to basic services or
needs……………………………………………………………………………………153
5.5 Ameliorating the livelihood of the poor by providing them with a social safety net
system…………………………………………………………………………………..163
5.6 Ameliorating the livelihood of the poor by enhancing their asset base…...….…….167
5.7 Has South Africa’s general approach towards poverty reduction been effective thus
far?…………….………………………………………………………………………..169
5.8 Conclusion…………...……………………………………………………………..172
Chapter Six: Summary and Policy Recommendations ….….… 175
Bibliography………………………………………………………………………182
Figures
Figure 2-1 (a) A relatively large poverty gap………………………………………..….34
Figure 2-1 (b) A relatively small poverty gap………………………………………..…34
Figure 3-1: Conceptual framework: stagnant economic growth and poverty………….70

xi
Figure 3-2: Conceptual framework: inflation and poverty……………………………..71
Figure 3-3: Growth and poverty reduction……………………………….…………….75
Figure 3-4: Labour force status and earnings and poverty status…………...………..…82
Figure 3-5: Poverty rates by average educational attainment of adult household
members…………………………………………………………………………………90
Figure 5-1: Conceptual framework: economic growth and poverty…………………...137
Tables
Table 2-1: Measurement standards conventionally applied in South Africa………..…..28
Table 2-2: Comparison of selected poverty lines for South Africa, 1993.……….……..31
Table 2-3: Comparison of selected poverty lines for South Africa, 2000.……………...31
Table 2-4: Comparison of HPI values for selected middle-income countries….……….37
Table 2-5: Comparison of HDI values for selected middle-income countries…………..38
Table 3-1: Multiple classifications of the causes of poverty…………………………….42
Table 3-2: Real growth of Black wages and Black/ White wage gap by industry….…..49
Table 3-3: Share of White and African employment by occupation, 1969 & 1977……..53
Table 3-4: Unemployment by race, gender and location (%)…………………………....83
Table 3-5: Unemployment rates by educational level, 1995 & 2002……………………89
Table 4-1: Regional comparison of income poverty in developing countries…..……….94
Table 4-2: Reasons for choosing to examine poverty reduction in China, Vietnam and
Uganda………………….………………………………………………………………..96
Table 4-3: The best theoretical recommendations pertaining to poverty
reduction….……………………………………………………………………………...99
Table 4-4: Rural poverty in China: 1978-2004…………….…………………………...105 Table 4-5: China’s rural and urban poor by region, 1999 (%)………………………….110

xii
Table 4-6: Incidence of poverty in Vietnam……………………………………………112
Table 4-7: Some of the human development indicators in Vietnam, 1993-
2002……..……………………………………………………………………………... 115
Table 4-8: Incidence of poverty in Uganda, 1992-2000.……………………………….119 Table 5-1: A summary of anti-poverty strategies that have been adopted by China,
Vietnam and Uganda……………………………………………………….………..…133
Table 5-2: A framework for poverty reduction in the post-apartheid era…….………..134
Table 5-3: Key macroeconomic indicators, Gear targets and performance, 1996-2000
………………………………………………………………………………………….138
Table 5-4: Unemployment and informal employment………………………………….144
Table 5-5: Housing subsidy bands, 2006/07……………………………………………155
Table 5-6: Monthly social grants……………………………………………………….165
1
Chapter One
Introduction
1.1. Introduction
“No political democracy can survive and flourish if the majority of its
people remain in poverty, without land, without their basic needs being
met and without tangible prospects for a better life. Attacking poverty and
deprivation will, therefore, be the first priority of the democratic
Government” (African National Congress, 1994: 5).
“Endemic and widespread poverty continues to disfigure the face of our
country. It will always be impossible for us to say that we have fully
restored the dignity of all our people as long as this situation persists.
For this reason, the struggle to eradicate poverty has been, and will
continue to be, a central part of the national effort to build the new South
Africa” (President Thabo Mbeki, 2004).
To most South Africans (and to some parts of the international community for that
matter), April 27th 1994 signified an unprecedented political transformation in South
Africa. This is when this country finally emerged triumphant from more than a century
of de facto and de jure apartheid oppression, which meant that there would be the advent
of a new, democratic political dispensation. What is even more impressive about this
political transformation is that it came about with minimal violence. Hence, South
Africa’s democracy is held in high regard throughout the world, especially on the African
continent.
Notwithstanding this unique political transformation, however, the truth of the matter is
that the first democratically elected government, led by the African National Congress
(ANC), inherited a country that was described by the World Bank as one of the world’s

2
most unequal economies, with a gini co-efficient measuring 0.58 (Hunter et al, 2003).
The ANC-led government also inherited a country that was characterised by vast
inequalities in the quality of education, healthcare and basic infrastructure, such as access
to safe drinking water, sanitation and housing. For instance, while only a quarter of all
Blacks had access to piped water in their houses, Asians and Whites had universal access
in 1995 (Hoogeveen & Özler, 2004). Over and above this, the country was disfigured by
widespread poverty, with almost half of the South African population being categorised
as poor in terms of the national poverty line of R 354 (Klasen, 1997). Even though such
problems may have been common in many societies throughout the world, the
uniqueness of the South African situation was that these problems were primarily
engendered by the four decades of apartheid legislation built on the earlier policies of
colonialism (May, 1998).
In 2004, South Africa celebrated a decade of democracy and the demise of apartheid.
While significant progress has been made in education, healthcare, housing and provision
of basic services1, the general consensus among development practitioners2 and
institutions3 is that poverty is still widespread in South Africa. Depending on the poverty
line, the method employed in measuring poverty, and whether poverty is measured at the
household or individual level, the extent of this phenomenon is estimated to range
between 45 and 57% (Human Development Report, 2003; Taylor Committee, 2002;
HSRC & Whiteford, 2004). Given the foregoing estimates, common wisdom dictates
that this is an obvious area of concern in the post-apartheid era. Fortunately, the
government acknowledges that a lot more effort needs to be made in order to eradicate or
at least reduce this social ill (see for example Mbeki, 2004). What is also encouraging is
that the State President, Thabo Mbeki (in line with a number of ANC policy documents,
most notably the White Paper on Reconstruction and Development) unequivocally
1 Leibbrandt et al’s (2004) analysis of both the 1996 and 2001 censuses gives a detailed progress report on this. 2 See for example May (1998); Aliber (2001); Woolard and Leibbrandt (2001); Whiteford & van Seventer (1999); and Meth and Dias (2004). 3 These include the Department of Social Development, the National Treasury, Statistics South Africa and the World Bank.

3
proclaimed, in his 2004 inaugural speech, that tackling poverty has always been, and still
is, at the forefront of the ANC’s political agenda (see the above quotes).
Therefore, in light of the severity of poverty in this country, this dissertation focuses on
examining the various issues that pertain to this problem. Among other things, this will
include a discussion on various measurements and determinants of the problem. In
addition, an investigation of salient international best practices with regard to poverty
reduction will be conducted in relation to initiatives that have been introduced by the
South African government since the advent of democracy. In so doing, the dissertation
seeks to identify what has worked elsewhere, thus making it possible to outline what
needs to be done in order to improve the effectiveness of (or even add to) South Africa’s
various anti-poverty instruments.
However, before any of the above can be done, it will be useful to first discuss, in brief,
the extent and distribution of poverty during the post-apartheid era (as it has been
revealed by the various studies that have been conducted in this regard). The rationale for
doing this is premised on the belief that having a reasonable understanding with regard to
the milieu wherein South Africa’s various poverty reduction strategies have been (or are
being) applied can be of great help when attempting to ascertain whether or not they are
adequate to deal with South Africa’s poverty dilemma.
1.2. An overview of the extent and distribution of poverty in South Africa
The various studies that have attempted to give a crude estimate of the extent of poverty
in South Africa have yielded results that are at variance with each other. Available
estimates with regard to the prevalence of poverty in South Africa range from 45 to 57%,
depending on the poverty line that has been used (StatsSA, 2000; UNDP, 2003; May,
2000; Woolard & Leibbrandt, 2001; Taylor Committee, 2002; HSRC & Whiteford,
2004). What is also clear from these respective studies is that although they have
engendered estimates that are at variance4, there seems to be a consistent trend with
4This is mainly attributed to the fact that these various studies use different poverty lines.

4
regard to ‘where’ and ‘who’ the poor in South Africa are. In more specific terms, what is
apparent from these various studies is that poverty in South Africa has, inter alia, rural,
regional, race, age, gender, illiteracy and unemployment dimensions. In addition, the
poor tend to live in large households (with many dependents), and usually have
inadequate access to basic services.
1.2.1. Where are the poor in South Africa?
Poverty in South Africa has strong (i) rural and (ii) regional dimensions.
(i) Poverty in South Africa’s rural areas. The common finding in the literature is
that in South Africa, the majority of people living in rural areas are poor and
the majority of the poor live in rural areas. Substantively, about 70% of people
living in rural areas are living in poverty, compared to about 30% of people in
urban areas. Although less than 50% of the total population lives in rural
areas, 70% of all poor people in South Africa live in rural areas5 (May, 2000).
(ii) Poverty in South Africa’s nine provinces. What is also evident in the literature
is that poverty is unevenly distributed among South Africa’s nine provinces.
For example, the 2003 Human Development Report found that, with the
exception of Gauteng and the Western Cape, over half the population in all
provinces live in poverty. The highest poverty rates are in the Eastern Cape
and Limpopo Province6. The incidence of poverty in these two provinces is
estimated to be 68.3% and 60.7% respectively. In Gauteng and the Western
Cape, where the proportion of the population below the poverty line is lower,
poverty rates are estimated to be 20% and 28.8% respectively. Out of the 21.9
million poor in South Africa, 59% live in the three provinces of Eastern Cape,
KwaZulu-Natal and Limpopo (Human Development Report, 2003). 5 May defined the ‘poor’, in line with the RDP White Paper (1994), as the poorest 40% of households, and ‘ultra-poor’ as the poorest 20% of households. According to these definitions, households who earn less than R 352.53 per adult are regarded as poor, and households who earn less than R 193.77 per adult are regarded as ultra-poor. 6 This comes as no surprise if one takes cognisance of the fact that these provinces were part of the former homelands. The other provinces that also formed part of the former homelands include North-West Province and Kwa-Zulu Natal.

5
1.2.2. Who are the poor in South Africa?
Post-apartheid South Africa continues to show a persistent correlation between poverty
and the following factors: (i) race (ii) age (iii) gender (iv) poor education (v)
unemployment (vi) large household size (with a high dependency ratio) and (vii)
inadequate access to basic services.
(i) Poverty and race in South Africa. Poverty in South Africa has a strong racial
dimension. As May (1998) would argue, while it is not confined to one racial
group, it is, however, concentrated mainly among Blacks. As it has been
illustrated in the 2003 Human Development Report, in 2002, the percentage of
Blacks, Coloureds, Asians and Whites who were poor was 56.3%, 36.1%,
14.7% and 6.9% respectively.
(ii) Poverty and age in South Africa. What is also evident from the literature is
that, due to their reliance on adults for provision of basic needs, the impact of
poverty is greatest on the youth and adolescents. For example, Whiteford and
van Seventer (1999) found that, in 1996, approximately 67% of children in the
age groups 0-5 years and 6-15 years were living in households earning less
than the Minimum Living Level (MLL)7. Similarly, Woolard (2002), whose
analysis was based on the 1999 October Household Survey, found that almost
10 million (or 58%) children are poor (using a relative poverty line, which
defines the poorest 40% of households as poor).
(iii) Poverty and gender in South Africa. Poverty in South Africa also has a strong
gender dimension. Evidence shows that the poverty rate among females tends
to be considerably higher than that among males. For instance, the 2003
Human Development Report shows that, in 2002, about 50.9% of the poor
were females, compared to 45.9% who were males. Moreover, what does
emerge clearly from the South African household surveys is that households
headed by women are more likely to be poor. For example, May’s 1998 report
7 For details on how this poverty line is constructed, see Table 2-1.

6
showed that the poverty rate among female-headed households was 60%,
while it was 31% among male-headed households. Similarly, Woolard (2002)
found that a household headed by a resident male has a 28% probability of
being poor, whereas a household with a de jure female head has a 48% chance
of being poor, and a household with a de facto female head (because the
nominal male head is absent) has a 53% chance of being poor.
(iv) Poverty and low levels of education in South Africa. There is a very strong
correlation between the level of education and the standard of living in South
Africa. According to Woolard (2002), in 1998, 58% of adults with no
education were poor; 53% of adults with less than seven years of education
were poor; 34% of adults with incomplete secondary schooling were poor;
15% of adults who had completed secondary school were poor; and only 5%
of adults with tertiary education were poor.
(v) Poverty and unemployment in South Africa. Poverty and unemployment are
also closely related in South Africa. According to Woolard (2002), the
unemployment rate among those from poor households is 52%, in comparison
with an overall national rate of 29%. In addition, labour force participation is
lower in poor than non-poor households. More than half of the working-age
poor (or about 5 million adults) are outside of the labour market. As a result,
the percentage of working age individuals from households below the poverty
line who are actually working is significantly lower than the average. Only
24% of poor adults (about 2 million people) are employed, compared with
49% (or 8 million) from non-poor households.
(vi) Poverty and large households in South Africa. In a study done by the World
Bank in 1995, entitled “Key Indicators of Poverty in South Africa”, it was
revealed that large households with many dependants are much more likely to
be poor in South Africa. Significantly, this study found that the average
household size among the poor is 5.9, compared to only 3.5 among the non-
poor. Moreover, the dependency ratio (the number of children below 16 and
those aged above 64 combined, divided by the number of people aged 16-64)

7
is more than twice as high among the poor than among the non-poor (1.1
among the poor, compared to 0.5 among the non-poor).
(vii) Poverty and lack of access to basic services in South Africa. Poor households
lack access to basic services. Among other things, Woolard (2002) found that,
in 1999, 75% of the non-poor had electricity, compared to 27% of the poor;
73% of the non-poor had access to adequate sanitation (flush, chemical or VIP
toilet), compared to 38% of the poor; 77% of the non-poor had piped water,
compared to 47% of the poor.
1.3. Problem statement
In 2003, South Africa’s gross domestic product (GDP) was equivalent to nearly one-third
of sub-Saharan African GDP on a purchasing power parity (PPP) basis, and to 38% of
sub-Saharan African nominal GDP at market exchange rates (Arora & Vamvakidis,
2005). In light of this, the view that South Africa is one of the economic powerhouses on
the African continent is plausible. What is even more impressive about South Africa is
that, with a gross national income8 (GNI) per capita of US$2,750 in 2003, when using the
World Bank’s Atlas approach to correct for exchange rate fluctuations, it is classified by
the World Bank as an upper middle-income country.
This classification is misleading, however, because it is based on some aggregate value,
such as average per capita income, which conceals the fact that the experience of the
majority of South African households remains either one of outright poverty or continued
vulnerability to becoming poor. For instance, serious inequalities still persist, with a gini-
coefficient ranging from between 0.635 (as estimated by the Human Development
Report, 2003) and 0.77 (as estimated by HSRC and Whiteford for 2001, but published in
2004). In addition, the number of people living in poverty is staggering, with almost half
of the population living below the national poverty line in terms of the national poverty
line of R 354 (as estimated by the 2003 Human Development Report). Furthermore,
South Africa fairs very poorly in terms of social indicators vis-à-vis other middle-income
8 Formerly known as the Gross National Product (GNP).

8
countries9, and this has resulted in South Africa being ranked 119th out of 173 countries
in terms of its Human Development Index (HDI) in 2002, down from its ranking of 93rd
in 1992 (Human Development Report, 2003). Against this background, it would be safe
to assume that, in spite of the best efforts of the government ever since the demise of
apartheid, poverty still remains one of the most obstinate social problems facing the
policy authorities in South Africa. What is of even greater concern to the South African
government is that, as international history has shown (see for example the Human
Development Report, 1997: 94), if the disparity between the haves and have-nots persists
for protracted periods of time, it could create social unrest (May, 1998). This could, in
turn, taint the achievement of the peaceful transition to democracy.
Given the abovementioned situation, this dissertation seeks to review South Africa’s
poverty reduction strategies, with a view to examining consistency in terms of salient
international best practices. Based on the findings of the foregoing exercise, this
dissertation will attempt to outline what more needs to be done in order to reverse or
correct the inherited socio-economic vestiges of the system of racial exclusivity at the
desired rate.
1.4. Objectives of this study
The primary objective of this dissertation is to contribute towards a better understanding
of the various measurements and causes of poverty and, in the process, to identify policy
instruments that could help reduce the incidence, severity and magnitude of poverty in a
country such as South Africa. In other words, the objectives of this dissertation could be
broken down into the following components: -
(i) An examination of the incidence and magnitude of poverty in South Africa.
Here, the discussions will highlight a number of social as well as human
development indicators in order to strengthen the author’s arguments.
(ii) A discussion of the causes of poverty in the country, as stated in the literature.
9 See Table 2-5 in Chapter 2.
9
(iii) A review of salient international best practices with regard to poverty
reduction strategies. In this regard, the dissertation will discuss both the
theoretical recommendations as well as the practically implemented best
practices.
(iv) A discussion of South Africa’s poverty reduction strategies. This will be done
with a view to commenting on the efficiency of these respective instruments,
as well as examining their consistency with international best practices.
(v) An outline of what still needs to be done in order to improve the poverty
reduction rate in South Africa.
1.5. Outline of this study
This dissertation will be structured into six chapters. Chapter one is introductory, and
discusses the situation of poverty in the country. It has hence sought to establish the
rationale for studying the subject matter and reviewing the poverty reduction strategies
that are currently in place in South Africa.
Chapter two is concerned with a review of literature on poverty, i.e. its definition and
measurement. The question of who is considered to be poor and how poverty is defined
in the South African context will be explored here. In reviewing the literature on poverty,
this dissertation does so against the background that many issues of measurement and
incidence are still being hotly debated. This chapter, therefore, plays a crucial role in
terms of the subsequent chapters, because successfully targeting the poor with the aim of
reducing poverty demands that they first be accurately identified and described.
In line with the above, this literature review will briefly discuss the various concepts that
are closely linked to poverty, namely: inequality, vulnerability, economic exclusion
(economic disempowerment) and underdevelopment. Furthermore, this chapter will look
at the definitions of the different types of poverty, such as absolute poverty, relative
poverty, transient poverty and chronic poverty. Once these definitions have been
examined, a working definition of poverty will be proposed. Thereafter, measurement

10
issues will be discussed. This discussion will include an exploration of the traditional
monetary approach, as well as the more broad-based human development and human
poverty approaches.
Chapter three discusses theoretical as well as empirical determinants of poverty. This is
because it is essential to have a good understanding of the causes and roots of poverty, so
as to design effective policies aimed at combating it. Broadly speaking, the literature
suggests that poverty is likely to be the result of several mutually reinforcing factors that
together define its scope and pervasiveness. As such, this chapter will divide the various
causes of poverty into two broad categories, namely: those that are exogenous to both the
individual and government, and those that can be influenced by policies at the macro or
micro level. The discussion on the exogenous determinants of poverty will mainly focus
on the negative effects of globalisation. The examination of the macro level causes of
poverty will include environmental/situational causes (natural disasters, rural location and
internal migration); economic causes (stagnant/shrinking economic growth and inflation);
and social causes (rapid population growth and inequality). Lastly, the discussion
concerning the causes of poverty at the micro level will include demographic causes
(large household size with a high dependency ratio, the age and gender of the household
head); economic causes (unemployment, underemployment and lack of access to
productive assets and markets); and social causes (ill-health and inadequate access to
education and decent shelter).
Before any of the foregoing issues are discussed, however, this chapter will start by
shedding some light on the root causes of poverty in South Africa, thus identifying why
almost half of the population in this country is unable to satisfy their basic needs, while a
minority enjoys extreme prosperity.
The presentation of Chapter four is based on the belief that a key ingredient to sound
poverty reduction policy-making lies in understanding why some economies have
performed so much better than others in terms of escaping absolute poverty. In so doing,
this dissertation seeks to contribute towards improving poverty reduction strategies that
11
are currently in place in South Africa. This will be done by extracting lessons from the
experience of other developing economies, including understanding the context of policy
implementation. This will be done with specific reference to countries such as China,
Vietnam and Uganda, which have achieved a certain degree of success in terms of
poverty reduction.
Chapter five will discuss what the ANC-led government is doing to curtail the incidence
of poverty in South Africa. For the sake of intelligibility, this chapter will examine the
government’s various anti-poverty strategies in terms of the following: (i) measures that
foster pro-poor economic growth (macroeconomic stability measures); (ii) job creation
measures (human resource development measures, pro-SMME10 measures and special
pro-employment programmes); (iii) infrastructure programmes earmarked to address
household consumption basic needs (such as preschool and primary education, primary
health care, water and sanitation, housing, electricity and other alternative sources of
energy); (iv) contributory and non-contributory social security measures (occupational
insurance measures, social assistance measures and other poverty alleviation measures);
and (v) asset building or redistribution measures (land reform and provision of houses
that can be used as commercial assets). In addition, comments on the overall
performance of these various anti-poverty instruments will be made in this chapter, thus
establishing whether or not they have made any significant in-roads thus far with regard
to reducing poverty in South Africa.
Finally, chapter six will summarise the findings of this study and make concluding
remarks. Policy recommendations aimed at reducing poverty in the country will also be
made.
10 These are small, medium and micro enterprises.

12
Chapter Two
Literature Review: Definition and Measurement of Poverty
2.1. Introduction
“Many people, including academics, campaigners and politicians, talk
about the problem of poverty, and underlying their discussion is the
assumption that identifying the problem of poverty provides a basis for
action upon which all will agree” (Alcock, 1993: 3).
As the above quotation suggests, the rationale for conceptualising poverty is mainly
based on the premise that the concepts used to define poverty determine the methods
employed to measure it. This later influences the policy and programme packages that are
implemented to address it. In essence, this view implies that, in order for the South
African government’s poverty reduction strategies to be more effective, they need to be
informed by what is meant by poverty in the South African context. In turn, this
description can then be used to determine the extent of this problem. Thereafter, based on
the findings of what it means to be poor in South Africa and the extent of this
phenomenon, a comprehensive poverty reduction strategy can then be developed.
Notwithstanding the above view, the truth of the matter is that, although nobody can
dispute the fact that poverty exists, there is no consensus thus far regarding the meaning
thereof. This has to do with the fact that poverty is a multifaceted phenomenon (World
Bank, 2001a; May, 1998). In light of this, it is therefore not surprising to find that the
voluminous studies on poverty, especially those that have been done on South Africa, use
different definitions of the problem. Hence, there is a myriad of policy recommendations
by development analysts and institutions regarding how to effectively deal with this
phenomenon.

13
Based on the aforementioned, it would be safe to assume that there is controversy
surrounding the question of who is considered to be poor, and how poverty is defined in
general and within the South African context. In light of this, as well as the fact that
successfully targeting the poor with the aim of reducing poverty requires that they be
accurately identified and described, it would thus be appropriate to examine various
issues regarding the concept of poverty and its measurement in this chapter.
Using secondary sources of data, such as handbooks and relevant journal articles, an
analysis of the different definitions of poverty, concepts that are closely linked to
poverty, as well as the various methods used to measure poverty, will be conducted in
this chapter. Furthermore, a thesis containing in-depth research into measurement issues
regarding poverty (and inequality) in South Africa will be consulted, in order to
supplement this study.
This chapter is, excluding the introduction, divided into three sections. Given the
important role that the definition of poverty plays in formulating appropriate policies, the
focal point of section one is the definition of terms. This section starts with a discussion
of the various concepts that are closely associated with poverty. This exercise includes
an analysis of the following concepts: inequality, vulnerability, economic exclusion and
underdevelopment. Thereafter, the different definitions of poverty are explored. These
definitions include absolute poverty, relative poverty, transient poverty and chronic
poverty. Once all this has been done, a working definition of poverty is proposed.
In light of the significant role that the measurement of poverty plays in identifying the
poor, thus assisting policy authorities in the formulation of well-targeted anti-poverty
policies, section two is mainly concerned with measurement issues. In this regard, the
traditional monetary approach, as well as the more broad-based human development and
human poverty approaches, will be discussed. The focus of this discussion is on the three
ingredients that are required to compute a poverty measure. These include choosing the
relevant dimension and indicator of well-being; selecting a poverty line, that is, a
threshold below which a given household or individual will be classified as poor; and

14
finally, selecting a poverty measure to be used for reporting on the population as a whole
or a population subgroup—and these will include the headcount ratio, the poverty gap
ratio, the Human Development Index, as well as the Human Poverty Index.
The last section gives a summary of the main findings with regard to the definition and
measurement of poverty which have come out of the preceding sections.
2.2. Defining poverty
Parallel to the historical developments that have led to the current consensus that poverty
reduction (and alleviation) should be one of the prominent goals in almost every social
expenditure programme in South Africa, there has also been a development concerning
the definition of poverty. Unfortunately, however, no consensus has been reached with
regard to the latter. This is due to the fact that defining poverty is very difficult, because
even though poverty is a widely used concept, its definition is highly contested.
Moreover, the word ‘poverty’ can be considered to have a cluster of different overlapping
meanings, depending on which subject area or discourse is being examined11. In this
study, however, the definition of poverty will be examined from an economic point of
view.
Poverty is a multidimensional phenomenon that has different meanings for different
people (irrespective of whether or not it is being examined within the same subject area).
Poverty can be viewed as absolute or relative, as a lack of income or failure to attain
capabilities. It can be chronic or temporary, is sometimes closely associated with
inequality, and is often correlated with vulnerabilities, underdevelopment and economic
exclusion. It is therefore not surprising to find that the question ‘What does it mean to be
poor?’ evokes a different response from one person to another. According to O’Boyle
(1999), these different responses are triggered by the fact that each person’s answer is a
reflection of a personal value system. Unfortunately, these value systems are bound to
diverge, and when they do, wider agreement on any normative issue becomes more
11 In other words, the definition of poverty is a function of the area of expertise, e.g. poverty can be defined from a theological, sociological or economic perspective, etc.

15
difficult, including how best to define poverty. This, however, is not to suggest that
defining poverty is a thoroughly arbitrary, personal matter. Rather, according to Alcock
(1997), this is to emphasise the fact that poverty is a contested problem, i.e. most people
claim that their understanding of poverty is the correct one, based on a logical argument
and/or scientific research. Against this background, students of poverty should thus
acknowledge that it would be unlikely for them to find or advance a definition that is
acceptable to everyone, because poverty is not a simple phenomenon that one can
understand by adopting a single approach.
Nevertheless, even though poverty is a contested problem, it is still one that requires
some response. Thus, deciding on a definition in this study is vital, because this definition
will serve as a cornerstone against which poverty reduction policies that are currently in
place in South Africa can be examined. However, before this definition can be framed, it
would be appropriate to first discuss the concepts that are closely related to poverty, as
well as the different types of poverty. The rationale for this exposition is based on the
belief that before one is able to evaluate whether or not a poverty reduction strategy is in
fact effective, it is essential to be clear about what the type of poverty which is being
targeted entails. Of equal importance in this regard is clarity regarding the meanings of
the concepts that are often used in conjunction with poverty.
2.2.1. Concepts closely related to poverty
Concepts such as inequality, vulnerability, economic exclusion and underdevelopment
are so frequently used in conjunction with poverty that the conceptual differences
between them have become blurred. Therefore, before attempting to review studies that
have attempted to measure poverty in South Africa, much less examine policies and
programmes for its reduction, it is imperative to be clear about what definitions are being
applied.

16
(i) Poverty and inequality
Inequality differs from poverty but is also related to it. While inequality is concerned
with distribution of wealth within a population group, poverty focuses only on those
people whose standard of living falls below an appropriate threshold level (such as a
poverty datum line) (Kircher, 2002; World Bank, 2000). This threshold may be set in
absolute terms (based on an externally determined norm, such as calorie requirements) or
relative terms (for example, a fraction of the overall average standard of living).
Intuitively speaking, relative poverty is more closely related to inequality, in that what it
means to be poor reflects the prevailing living conditions of the whole population.
Moreover, most analysts12 argue that the movement in the Gini Co-efficient Index13
seems to closely follow that in poverty. However, this relationship can only be
established in countries where comparative data is available. It is thus not surprising to
find that the analysis of poverty often employs indicators of equality. This could be done
in a number of ways, for example: through disaggregation14; associating distributional
measures with other poverty indicators15; or by specifying some mathematical
formulae16. The notion for doing so, as some analysts17 would argue, is that high levels of
inequality contribute to high levels of poverty in several ways, for instance:
• for any given level of economic development or mean income, higher inequality
implies higher poverty, since a smaller share of resources is obtained by those at
the bottom of the distribution of income or consumption;
• higher initial inequality may result in lower subsequent growth and, therefore, in
less poverty reduction. For example, access to credit and other resources may be
concentrated in the hands of privileged groups, thereby preventing the poor from
investing; and
12 See for example Hope (2004). 13 This is the index that is used to measure inequality. 14 Many indicators can be disaggregated according to gender, race or region. 15 Such as per capita personal income and the Lorenz curve. 16 Such as the Atkinson method. 17 For example, Ravallion (1997) and Aghion et al (1999).

17
• higher levels of inequality may reduce the benefits of growth for the poor,
because a higher initial inequality may lower the share of the poor’s benefits from
growth. In the extreme case, if one person has all the resources, then regardless of
the rate of growth, the poverty of the remaining population will never be reduced
through growth.
Based on the above arguments, it would be appropriate to acknowledge that, in most
cases, it would be easier to reduce poverty under relatively egalitarian conditions18.
(ii) Poverty and vulnerability
According to May (1998: 05), “international experience of poverty alleviation programs
suggests that poverty is not a static condition among individuals, households or
communities. Rather, it is recognized that, although some individuals or households are
permanently poor, others move into and out of poverty. This may be a result of life-cycle
changes, specific events such as the illness of a main income earner, or deterioration in
external economic conditions.”
In light of the above quotation, it is thus not surprising to find that the concept of
vulnerability is increasingly applied in order to understand these processes of change. In
fact, development practitioners19 tend to use vulnerability as a proxy for poverty, because
certain combinations of vulnerability may be strongly correlated with poverty, i.e.
female-headed households, families living in remote and isolated mountainous regions,
members of minority groups, illegal immigrants, illiterate individuals, seasonal
employees and so on. It should, however, be noted that vulnerability is not the same as
poverty. According to the World Bank (2000), vulnerability20 is the present probability
or risk of being in poverty or falling into deeper poverty in the future. This may be
referred to as a downside risk. For instance, vulnerability is a function of two main 18 Provided that these egalitarian conditions are accompanied by sufficient economic growth which is pro-poor. 19 See for example Woolard (2002). 20 These inherent vulnerabilities may entail factors such as different types of discrimination based on class, gender, ethnicity or other factors such as disability, region of residence and family configuration.
18
variables: exposure and response to downward pressures. According to Shaffer (2001),
downward pressures are sometimes referred to as stresses and shocks, the former gradual
and cumulative, and the latter sudden and unpredictable.
(iii) Poverty and economic exclusion
Poverty and economic exclusion are interlinked. For example, in South Africa, people
were excluded from the formal economy through various mechanisms. These included
the institutionalisation of a number of requirements, such as permits, that served as
barriers aimed at limiting the participation of Blacks in the formal economy. Some of
these requirements included trading with neighbouring states via a visa system, which
was not easy to obtain. Most Blacks could not access credit from financial institutions
because they could not meet the forced requirements to obtain a loan, due to a lack of
securities that are only recognised in the formal economy, for example property, bonds,
shares, etc. Most Blacks owned cattle, goats and chickens, which were all perceived to be
risky assets. Due to these oppressive mechanisms, the economic development of a
significant number of Blacks was severely compromised, which meant that they were
vulnerable to being poor. This will be discussed in greater detail in chapter three.
(iv) Poverty and underdevelopment
The distinction between poverty and underdevelopment depends on how each is defined.
When defined in broad human deprivation terms, poverty is often viewed as a form of
underdevelopment, i.e. “an economic situation in which there are persistent low levels of
living in conjunction with absolute poverty, low income per capita, low rates of economic
growth, low consumption levels, poor health services, high death rates, high birthrates,
dependence on foreign economies, and limited freedom to choose among activities that
satisfy human wants” (Todaro, 2000: 768). In other words, if human development is
about expanding people’s choices (as it has been defined in human development reports
since 1990), then poverty means that opportunities and choices most basic to human
development are denied. However, the 1997 Human Development Report distinguishes

19
between the two concepts by associating the former with individuals and the latter with a
macro perspective. The contrast between human development and human poverty reflects
two different ways of evaluating development. One way, the conglomerative perspective,
focuses on the advances made by all groups in each community, from the rich to the poor.
This contrasts with an alternative viewpoint, the deprivational perspective, in which
development is judged by the way that the poor and deprived people fare in each
community. Given the close relationship between these two concepts, it is thus not
surprising that many poverty indicators are the same as those used to measure
underdevelopment.
2.2.2. Different types of poverty
Policy is directly influenced by the way in which poverty is defined. Moreover, the
extent of poverty is determined by the way in which it is defined. The aim of this section
will therefore be to identify the different types of poverty (i.e. absolute poverty, relative
poverty, transient poverty and chronic poverty).
(i) Absolute21 and relative22 poverty
There is a long tradition of debate about relative versus absolute definitions of poverty23.
Relative and absolute definitions of poverty tap into fundamentally divergent notions of
difference and deprivation (Shanahan & Tuma, 1994). Hence, absolute and relative
standards typically produce different policy implications and accounts of the experience
of poverty, and differ somewhat in terms of the extent of poverty determined (Townsend,
1980, cited in Brady, 2003). Nevertheless, poverty scholars increasingly conclude that in
developed countries, a relative definition is more appropriate, whereas in developing
21 This notion of absolute or subsistence poverty is based on the seminal work which was pioneered by Booth (1887) and Rowntree (1901, 1941), who studied poverty in London and York respectively, during the 19th and early 20th centuries. 22 Townsend (1970, 1974) is an articulate exponent of this view. 23 See Sen (1979, 1983); Madden (2000).
20
countries24, an absolute definition of poverty is relevant (Atkinson, 1998; Gordon, 1972;
Hagenaars, 1991; Madden, 2000; Ravallion, 1998; Sen, 1992).
Absolute poverty is viewed as an objective and scientific definition that is based on the
notion of subsistence25. In a narrow sense, it is a state in which a person cannot secure
his long-term physical survival (Kircher, 2002). This measure is universal and not time-
bound, and has the advantage of international comparability. An example of this would
be the minimum amount of calorie intake which is recommended by prominent
institutions such as the FAO and World Health Organization, or the $1 a day and $2 a day
that is used by the Human Development Reports when examining the extent of absolute
poverty throughout the world. However, in a broader sense, the definition of absolute
poverty includes various needs besides pure physical survival, i.e. a state in which a
person does not have enough to live on, based on socially acceptable living conditions,
which include other essential goods besides nutritional requirements, e.g. clothing and
shelter in hostile climates. It should be noted that the broader definition includes a
certain amount of relativity. According to Kircher (2002), an example of this has already
been provided by Adam Smith (1976: 870, cited in Kircher, 2002), who assesses that the
ownership of certain things such as leather shoes might be necessary in one society to
achieve social acceptance, while in another their possession is not relevant. Therefore,
based on this view, the concept is considered to be absolute, in that it is derived from
unfulfilled minimum needs which are relatively stable in a given society26. This explains
why some of the rich countries, such as the United States (that use an absolute poverty
datum line) have higher poverty datum lines than poor countries. Furthermore, this also
explains why the official poverty rate in the early 1990s was close to 15% in the United
States and also close to 15% in (much poorer) Indonesia (World Bank, 1990).27
24Many of these countries are vulnerable to famine, drought and crop failures, wars, natural disasters, widespread official corruption and general underdevelopment. 25 This claim is in line with Rowntree’s (1908: 86) definition, whereby he defined ‘primary poverty’ as “…earnings insufficient to obtain the minimum necessities for the maintenance of merely physical efficiency.” 26 This view is consistent with Sen’s (1993) argument that poverty can be an absolute notion in the area of capabilities, though relative in that of commodities or characteristics. 27 Note that many of those people counted as poor in the United States would be considered to be comfortably well-off by Indonesian standards.

21
Alternatively, relative definitions of poverty are based upon comparison, often with some
notion of prevailing living standards in the community being researched (Ravallion,
1998). In other words, the relatively poor are those people whose income or consumption
level is below a particular fraction of the national average28. Examples of poverty
definitions in this category include people in the lowest 20% of the income distribution or
people earning less than 50% of the mean income.
Based on the above exposition, it would therefore be safe to assume that the applicability
of a relative vs. an absolute poverty definition depends on the need for comparability
between countries and the overall wealth of a country (for instance, if the average person
cannot even sustain physical survival, the relative poverty definition becomes
meaningless). Furthermore, in attempts to illustrate the global progress in poverty
reduction, preference is usually given to absolute poverty criteria in a narrow sense29,
while in the assessment of national or regional poverty, absolute poverty in a broader
sense or relative concepts are preferred (Kircher, 2002).
(ii) Chronic and transient poverty
The transiently poor (short-term) and chronically poor (long-term) are overlapping but
distinct groups. According to Uccelli (1997), the latter is characterised by a deep-rooted,
impoverished condition, which is the consequence of multiple deprivations over time,
such as poor health, substandard nutrition and inadequate access to productive assets, and
is often associated with persistent, intergenerational30 poverty. As a result, chronic
poverty is usually the more difficult one to address. For instance, Hulme and Shepherd
(2003) note that a particular problem in contemporary poverty analysis, seeking to
rapidly reduce poverty headcounts in an era of globalisation, is to see the poor as those
who are not effectively integrated into the global market economy. Thus, as a result, the
28 Therefore, relative poverty is a universal and permanent feature of human society. 29 This is because it is much easier to monitor the global trend in poverty when the yardstick that is in use is consistent. 30 Poverty that has been passed on from one generation to the next.

22
chronically poor are likely to be neglected in such an era, given the multiple factors that
constrain their prospects, and the likelihood that market-based factors may contribute to
their continued deprivation.
On the other hand, transient poverty normally results from a one-time decline in living
standards, from which a household gradually emerges. Alternatively, it may show itself
in fluctuations in well-being that result in frequent declines in living standards. For
example, seasonal variations in food security may result in some households periodically
falling in and out of poverty, sometimes quite regularly, over time (Woolard &
Leibbrandt, 2001).
2.2.3. Moving towards a definition of poverty
The preceding sections, i.e. sections 2.2.1 and 2.2.2, have examined various salient terms
that are usually used in conjunction with poverty, and in the process of doing so, a
foundation upon which a working definition for this dissertation will be framed, has been
established.
There are a number of definitions of poverty that have emerged over the years. However,
according to the 1997 Human Development Report, the general consensus is that poverty
has been mainly defined according to three different perspectives, i.e. the income
perspective, the basic needs perspective and the capability perspective. In essence,
poverty thus refers to different forms of deprivation of income and/or basic needs and/or
human capabilities.
(i) Income/consumption definition of poverty. This approach to the identification
of poverty is the most commonly used, especially in applied welfare
economics31. It identifies poverty as follows: “A person is poor if, and only if,
her or his access to economic resources is insufficient…to acquire enough
commodities to meet basic material needs adequately” (Lipton, 1997: 127).
31 See Lanjouw (1997), Lipton (1997) and Ravallion (1994).

23
For economists, the appeal of this approach lies in it being compatible with
the utility-maximising behaviour assumption that underpins microeconomics,
i.e. that the objective of consumers is to maximise utility, and that
expenditures reflect the marginal value or utility that people place on
commodities. Welfare can then be measured as the total consumption enjoyed,
proxied by either expenditure or income data, and poverty is defined as being
below some minimum level of resources, which is termed the poverty datum
line (Laderchi et al, 2003).
(ii) Poverty according to the basic needs perspective. This approach to the
identification of poverty takes the income approach one step further. It
defines poverty as the deprivation of material requirements for the minimally
acceptable fulfillment of basic human needs. “Basic needs may be interpreted
in terms of minimum specified quantities of such things as food, clothing,
shelter, water and sanitation that are necessary to prevent ill health, under-
nourishment and the like…” (Streeten et al, 1981: 25, cited in Shaffer, 2001).
Against this background, it is clear that this notion of deprivation goes well
beyond the lack of private income, and instead includes basic needs that have
to be provided by states or communities in order to prevent people from
becoming poor. In addition, it also recognises the need for employment
opportunities.
(iii) Poverty according to the human capability perspective. The capability
approach32 rejects monetary income as its measure of well-being, and instead
focuses on indicators of the freedom to live a ‘valued’ life (Human
Development Report, 1997). According to this framework, poverty is defined
as the absence of some basic capabilities needed to function, where ‘basic
capabilities’ are “the ability to satisfy certain crucially important
functioning’s up to certain minimally adequate levels” (Sen, 1993: 41). The
relevant functioning in this context refers to the various valuable things that a
person can do or be, such as living a long life, being healthy, well- nourished,
32 According to Sen (1985, 1997, 1999), who pioneered this approach, development should be seen as the expansion of human capabilities, not the maximisation of utility or its proxy, monetary income.

24
adequately clothed and sheltered, interacting well with others in the
community, and so on.
Based on these different perspectives, it is clear that the concept of poverty has been
extended beyond its economic domain. Moreover, what is also apparent is that, in line
with the view of this dissertation, some of these different perspectives also acknowledge
the fact that poverty is a multidimensional phenomenon.
Nevertheless, even though (based on the different perspectives outlined above) defining
poverty in a broader sense might seem to be an obvious alternative, most academic
studies which have been conducted in South Africa have limited their definitions to
dimensions of poverty that are easily and objectively measurable. This is mainly because
when poverty is defined in a broader sense, measuring it becomes a complicated task, and
as a result, policymakers face difficulties when evaluating poverty reduction strategies.
Therefore, even though this dissertation acknowledges the fact that poverty is a
multidimensional phenomenon, it will define poverty, in line with the Poverty and
Inequality Report (PIR) that was published in 1998 (May, 1998: 3), as “…the inability of
individuals, households, or entire communities, to command sufficient resources to
satisfy a socially acceptable minimum standard of living.”
Against the backdrop of the definition proposed above, an examination of the main
methods utilised to measure or estimate the magnitude of this phenomenon can now be
done, and this will be achieved in the following section.
2.3. Measuring poverty
There are two schools of thought that have emerged over the years with regard to
measurement issues (Klasen, 2000). The one school has defined poverty primarily in
financial terms, i.e. poverty is interpreted in terms of the command over commodities that
resources afford people via income and consumption (Lipton & Ravallion, 1995;
Ravallion & Chen, 1997; World Bank, 1990). The concern here is with resource

25
adequacy, as suggested by Leibbrandt and Woolard (1999)33. The other has sought a
more broad-based definition of poverty, not solely based on financial resources (e.g.
Human Development Report, 1997; Dreze & Sen, 1989). The latter has relied on the
seminal work done by Rawls, Sen and others in order to emphasise the fact that poverty
should be seen in relation to the lack of important ‘basic goods’ (Rawls) or ‘basic
capabilities’ (Sen), some of which cannot be purchased by money, as they are under-
provided in a market system. Furthermore, this school of thought contends that financial
resources are just one of the several means to achieve well-being, and efforts should
therefore be directed at measuring well-being outcomes, rather than focusing on one of its
imperfect proxies (Klasen, 2000). Against this background, it is therefore important to
acknowledge that, just like defining poverty, there is no ideal or correct way to measure
the extent of poverty within a society. This is because a crucial role is played by value or
ethical judgements. Hence, a number of poverty studies that have been conducted on
South Africa produce results which are similar in terms of the characteristics of poverty
groups, but differ in terms of the degree of incidence among them. In this dissertation,
however, the measurements of poverty will be reviewed in line with the definition that
was adopted in section 2.2.3. Therefore, both the traditional monetary indicators, as well
as some of the human development and human poverty indicators, will be examined.
2.3.1. Measuring poverty using monetary indicators
“The poverty measure itself is a statistical function that translates the
comparison of the indicator of household well-being and the chosen
poverty line into one aggregate number for the population as a whole or a
population subgroup” (World Bank, 2000).
According to Kingdon and Knight (2004), empirical research by economists on poverty
in developing countries has generally been concerned with measurement in terms of
income and consumption. Behind this metric lies the concept of the utility or welfare
which people are assumed to derive from income and consumption. This approach
33 They refer to it as ‘poverty proper’.
26
therefore entails dimensions of poverty that are easily and objectively measurable.
Hence, this approach still dominates the field of poverty measurement. In light of this, it
therefore comes as no surprise to find that a number of poverty measurement studies in
South Africa have also followed this approach.
When measuring poverty using this traditional approach, there are three ingredients that
are required in order to compute a poverty measure (Lipton & Ravallion, 1995;
Ravallion, 1996; Leibbrandt & Woolard, 1999; World Bank, 2000). Initially, one has to
choose the relevant dimension and indicator of well-being. Thereafter, one has to select a
poverty datum line, that is, a threshold below which a given household or individual will
be classified as poor. Later, one has to select a poverty measure to be used for reporting
on the population as a whole or a population subgroup. These three ingredients are
significant, as they have a direct influence at the policy-making level.
2.3.1.1. Choice of indicators for measuring monetary poverty: consumption and
income indicators
When estimating poverty using monetary measures, one may have a choice between
using consumption or income as an indicator of well-being (Ravallion, 1996).
(i) Using consumption/expenditure as an indicator
“…on average, consumption should provide a more accurate proxy for
welfare over an extended time horizon… consumption decisions are based
on permanent income and transitory changes in income have no influence
on spending” (Friedman’s permanent income hypothesis, 1957).
Development practitioners such as Fields (1980), Lipton and Ravallion (1995) and
Deaton (1997) believe that it is more appropriate to study consumption data than income,
as they feel that income only measures the potential ability to purchase inputs, whereas
consumption measures the flow of utility-producing inputs. In addition, they also believe

27
that current consumption is a better indicator of permanent income, since income
measured over a short time period may misrepresent the permanent economic position.
(ii) Using income as an indicator
One should not be dogmatic, however, about using consumption data for poverty
measurement, as there are also weaknesses associated with it. For instance, it is highly
unlikely that all governments will readily keep such data, because it is difficult to
monitor. Moreover, the use of income as a poverty measurement may have its own
advantages. For example, measuring poverty by income allows for a distinction to be
made between sources of income. When such distinctions are made, income may be more
easily compared with data from other sources, such as wages, thereby providing a check
on the quality of data in a household survey. Furthermore, in some household surveys,
consumption or expenditure data might not be collected or be detailed enough, thereby
enabling income to be considered a better indicator of poverty measurement than
consumption (World Bank, 2000). In addition, income is a better measure of poverty than
consumption, in the sense that it is the opportunities made available to the individual
through finances (budget constraints), and not what consumption decisions they then
decide to make, which is important to the determination of poverty levels (Atkinson,
1987; Hagenaars, 1991).
Whatever the chosen monetary indicator may be, the next step is to define one or more
poverty datum lines. However, given the fact that the literature is dominated by studies
that have utilised consumption data for computing poverty measures, the focal point of
the next sub-section will only be on poverty datum lines that are relevant to consumption
data.
2.3.1.2. Poverty lines based on the consumption/expenditure approach
The poverty line defines the level of consumption (or income) needed in order for a
household to escape poverty (see Table 2-1 for various poverty lines that are used in

28
South Africa). Based on this definition, it appears that the notion of a poverty line
implies a distinct turning point in the welfare function. In other words, by rising from
just below to just above the poverty datum line, households (and individuals therein)
move from a state of considerable misery to an adequate, minimum level of well-being.
However, how one decides on this level of consumption (or income) is the cause of much
criticism, since it involves a certain degree of arbitrariness, yet has the ability to greatly
impact on all the measurements of poverty.
Table 2-1: Measurement standards conventionally applied in South Africa Category Norm Abbreviation Content
Cost per family of:
Poverty Datum Line1 PDL Food, clothing, fuel & lighting,
washing & cleansing, rent,
transport
Minimum Living Level2 MLL PDL plus: tax, medical
expenses, education, household
equipment replacement.
Supplementary Living Level3 SLL Increased MLL provisions plus:
recreation & entertainment,
personal care, pension, UIF,
medical/burial contributions
Household Subsistence Level4 HSL The same as for PDL
Income
Poverty
Line
Household Effective Level5 HEL HSL plus 50%
Other Household Expenditure Datum
Line6
- Household expenditure as
defined in the October
Household Survey7
Sources: 1-5Wilson and Ramphele (1989:17); 6StatsSA (2000); 7StatsSA (1996).
According to Ravallion (1998), there are two main techniques that are widely used to
derive poverty lines in line with the consumption/expenditure approach to defining
poverty. The first approach focuses on determining the amount of resources required in
order to meet certain minimum nutritional requirements. These methods determine a food
poverty line based on the cost of the food bundle required in order to match the daily
calorie intake requirements (e.g. 2100 calories) determined by the World Health

29
Organization (WHO) (Ravallion & Bidani, 1994). An example of these techniques is the
food energy intake (FEI) method, which requires observations of actual food
consumption patterns (Thorbecke, 1998). Alternatively, another approach to building up
a poverty line, while remaining in the spirit of trying to ensure that the line covers basic
needs, is known as the cost of basic needs (CBN) approach (Lipton & Ravallion, 1995).
The CBN dictates the following: -
• Stipulate a consumption bundle that is deemed to be adequate, with both food and
non-food consumption; and
• Estimate the cost of the bundle for each subgroup (urban/rural, each region, etc.).
It should be noted that this is essentially the approach taken by Rowntree in his seminal
study of poverty in York (see for example Rowntree, 1941). According to Meier and
Rauch (2005), he calculated that for a family of five, i.e. a father, mother, and three
children, the minimum weekly expenditure in order to maintain physical efficiency was
21 shillings 8 pence. The World Bank, which has been estimating global income poverty
since 1990, has also used an approach similar to this one. For example, the World Bank
uses a poverty line of $1.08 a day in 1993 PPP terms (usually referred to as “$1 a day in
most studies). Another upper poverty line that is commonly used in lower-middle-income
countries by the World Bank, in order to estimate global income poverty, is referred to as
“$2 a day”34. However, both of these poverty lines, i.e. $1 and $2, described here are
useful only as indicators of global progress. They do not assess progress at the country
level nor do they guide country policy and programme formulation. Hence, country-
specific poverty lines are usually higher than these international poverty lines that are
used for international comparison. For example, for South Africa, Deaton (1997) used a
poverty line of R 105 per capita in 1993 PPP prices; Hoogeveen and Özler (2004) used a
food poverty line of R 211 per capita per month for South Africa; the 2003 Human
Development Report has used a national poverty line of R 354 per month per adult
equivalent (which was derived as the national poverty line for South Africa in 1995);
Leibbrandt and Woolard (1999) used various expenditure poverty lines, such as the
34 Note that this poverty datum line is double the amount of the lower poverty line.

30
‘minimum and supplementary living levels per capita’ poverty line of R 220.10,
‘minimum living level’ poverty line of R 164.20, the ‘per adult equivalent household
subsistence level’ poverty line of R 251.10, ‘50% of national per capita expenditure’
poverty line of R 201.82, as well as the ‘population cut-off at the 40th percentile of
households ranked by adult equivalent expenditure’ poverty line of R 297.29.
2.3.1.3. Computing poverty indices
Given a set of information on either per capita income or per capita consumption
indicators and a poverty line, the only remaining problem is deciding on an appropriate
summary measure of aggregate poverty. There are many alternative aggregate measures
of monetary poverty that can be computed. However, the monetary measures in this
section will only be limited to the head count ratio (H), as well as the poverty gap ratio
(P), since these measures are the ones which are commonly used.
(i) Head count ratio
The head count ratio is the most widely used index. It gives the proportion of the poor in
the population (World Bank, 2000; Ravallion, 1996). That is, the proportion of
individuals/households living on a per capita household income/expenditure below the
poverty line. The head count ratio is illustrated by the following equation: -
Hqn
=
Where H is the headcount index as defined above, q is the number of people living in
poverty, and n is the number of households in a population.
The great virtue of the head count ratio is that it is simple to construct and easy to
understand. Hence, studies that have adopted this approach are voluminous. In fact, most
of the examples of various poverty lines in section 3.2.1.1 were used in line with this

31
poverty measure. For example, using the headcount ratio, the World Bank (2000)
estimated that out of 6 billion of the world’s estimated population, 2.8 billion (i.e. almost
half) was estimated to be living on less than $2 a day, and 1.2 billion (or a fifth of the
world’s population) was estimated to be living on less than $1 a day. The 2003 Human
Development Report used a national poverty line of R 354, and found that the head count
ratio of the poor was 48.5% in 2002. Various expenditure poverty lines used by
Leibbrandt and Woolard (1999) yielded different headcount ratios (see Table 2-2 for their
results). Hoogeveen and Özler (2004) also used various poverty lines of R 87, R 174, R
322, and R 593 (in 2000 prices) and, as expected, their headcount ratios also yielded
different results (see Table 2-3 for their results).
Table 2-2: Comparison of selected poverty lines for South Africa (1993) Type of poverty line Amount/month
cut-off (rand)
1985 prices
% of population below
the poverty line
1. Population cut-off at the 40th percentile of households ranked by
adult equivalent expenditure.
2. 50% of national per capita expenditure.
3. Minimum and supplemental living levels per capita set by the
Bureau of Market Research (Unisa).
4. Minimum living level.
5. Per adult equivalent household subsistence level, set by the Institute
for Development Planning Research, University of Port Elizabeth.
6. International Poverty Line (US$1 per capita per day) (1985 prices).
297.29
201.82
220.10
164.20
251.10
91.40
53.2
53.2
56.7
44.7
45.7
23.7
Source: Leibbrandt and Woolard (1999)
Table 2-3: Comparison of selected poverty lines for South Africa (2000) Type of poverty line Amount/month
cut-off (rand)
2000 prices
% of population below
the poverty line
1. $1 per day
2. $2 per day
3. Lower-bound poverty line
4. Upper-bound poverty line
R 87
R 174
R 322
R 593
11%
34%
58%
75%
Source: Hoogeveen and Özler (2004)

32
The headcount ratio index has its appeal, namely that it is easy to construct and
understand. It has, however, at least two significant weaknesses:
• Firstly, the head count index does not take the intensity of poverty into account.
To illustrate this weakness further, Kanbur et al (2003) provide the following
example: -
Headcount poverty rates in countries A and B, assuming a poverty line of 125 Expenditure for each
individual in the country
Headcount Poverty Rate
Expenditure in country A 100 100 150 150 50%
Expenditure in country B 124 124 150 150 50%
Clearly, there is greater poverty in country A, but the headcount index does not capture
this. As a welfare function, the headcount index violates the transfer35 principle, an idea
that states that transfers from a richer to a poorer person should improve the measure of
welfare. That is, if a somewhat poor household were to give to a very poor household,
the headcount index would be unchanged, even though it is reasonable to suppose that
overall poverty has decreased.
• Secondly, the head count index does not indicate how poor the poor are, and
hence does not change if people below the poverty line become poorer.
35 According to Sen (1976), the following four axioms form the basis of what has become a widely accepted consensus regarding the basic requirements for a good poverty measure (i) Monotonicity axiom: If the income of a poor individual falls (rises), the index must rise (fall); (ii) Transfer axiom: If a poor individual transfers income to someone less poor than him-or herself (whether poor or non-poor), the index must rise; (iii) Population symmetry axiom: If two or more identical populations are pooled, the index should not change; (iv) Proportion of poor axiom: If the proportion of the population which is poor grows (diminishes), the index must rise (fall).

33
(ii) The poverty gap ratio
It is the headcount ratio’s inability to indicate how poor the poor actually are, and the fact
that it remains constant when a previously poor unit becomes poorer, which created a
need for the poverty gap ratio. The poverty gap ratio is the difference between the
poverty datum line and the income per capita of a specific household. This measure
gives an indication of how far below the poverty line the income per capita of that
specific household is. In essence, as the poverty gap ratio tends towards zero, the degree
of poverty diminishes (Whiteford & McGrath, 1994). Total poverty is obtained by adding
up the poverty gaps for each of the poor households. This figure gives an indication of an
amount by which the annual per capita household income of the poor needs to be raised
in order to get everyone’s per capita income up to the poverty line (Ngwane, 2001). For
a better understanding of this, consider Figure 1.1. This figure illustrates how one could
measure poverty as the shaded area between poverty line, PV, and the annual income
profile of the population. Even though in both country A and country B, 50% of the
population falls below the same poverty line, the poverty gap in country A is greater than
that in country B. Therefore, it will take more effort to eliminate absolute poverty in
country A (Todaro & Smith, 2003). The poverty gap ratio (I) is illustrated by the
following equation:
Izq
Zi
i
q
y= −=∑1
1( )
Where I is the poverty gap ratio; z is the poverty line; q is the number of people living in
poverty (i.e. with household income per capita no higher than z); Yi is the household
income per capita for the i-th household, arranged in order of income.

34
Figure 2-1

35
Using this approach, Ngwane (2001) found that the average per capita household income
of the poor in South Africa in 1995 needed to be raised by 30.55% in order to reach the
poverty line (when using the $1 a day poverty line). The 2003 Human Development
Report found that, for South Africa, the average per capita household income of the poor
in 2002 needed to be raised by 18% in order to reach the poverty line (when using the
national poverty line of R 354). McGrath and Whiteford (1994) found that the poverty
gap ratio for South Africa and the TBVC36 states was equal to 31% in 1991 (when using
the MLL poverty line).
2.3.2. Human poverty and development approaches
In the previous section (i.e. section 2.3.1), the emphasis was placed exclusively on
‘money-metric’ poverty measures, i.e. measures that can only capture the amount of
income available to households in order to acquire basic goods and services. Even though
these money-metric indicators may be a significant dimension of poverty, i.e. with a
higher income or consumption budget, a person may be able to improve the position of
some of his/her monetary and non-monetary attributes, the truth of the matter is that these
‘money-metric’ poverty measures may somewhat conceal the highly differentiated
experiences of the South African populace in terms of human development, especially
when it comes to access to basic services (e.g. housing, literacy, life expectancy and so
on). Therefore, for a better understanding of the nature of poverty in a country such as
South Africa, it is imperative to avoid utilising only money-metric poverty measures as
the criterion for assessing poverty. Instead, this conventional approach to measuring
poverty should be supplemented by other non-monetary measures, in order to be able to
expose other dynamics of poverty that are usually overlooked when only money-metric
poverty measures are applied. This section will therefore seek to elaborate on the
instruments (i.e. Human Poverty Index and the Human Development Index) that are used
to measure human poverty and development.
36 This is an abbreviation referring to the following states: - Transkei, Bophuthatswana, Venda and Ciskei.

36
2.3.2.1. The Human Poverty Index (HPI) for developing countries
In an attempt to look beyond income poverty, the United Nations Development Program,
in its 1997 Human Development Report, introduced the concept of the Human Poverty
Index (HPI). This index for developing countries concentrates on deprivation in three
essential dimensions of human life, which are also reflected in the Human Development
Index (HDI). According to the 2007/2008 Human Development Report, these are: (i) a
long and healthy life, (ii) knowledge, and (iii) a decent standard of living. In the
following notation, P1, P2, and P3 have been used to measure (i), (ii) and (iii)
respectively.
Given that: -
P1 = Probability at birth of not surviving to age 40 (times 100)
P2 = Adult illiteracy rate
P3 = Unweighted average of population not using an improved water source and children
underweight-for-age
Then, HPI = [⅓ (Pα1 + Pα2 + Pα3)]¹/α
See Table 2-4 for examples of HPI values for selected middle-income countries with a
GDP per capita similar to that of South Africa. Based on what is depicted in Table 2-4,
South Africa fares very poorly in terms of its HPI value, when compared with other
3=α

37
middle-income countries, other than Botswana. Therefore, it would be safe to assume that
a lot more work still needs to be done in order to improve the HPI value for South Africa.
Table 2-4: Comparison of HPI values for selected middle-income countries Country HPI value (%) Population who
will not survive
to age 40 (% of
total
population)
2000-05
Adult illiteracy
rate (% ages 15
and above)
1995-2005
Population
without
sustainable
access to an
improved water
source (%) 2004
Children under-
weight for age
(% under age 5)
1996-2005
Thailand 10.0 12.1 7.4 1 18
Brazil 9.7 9.2 11.4 10 6
Botswana 31.4 44.0 18.8 5 13
Russian Federation
- 32.4 - - 18.8
Costa Rica 4.4 3.7 5.1 3 5
Mexico 6.8 5.8 8.4 3 8
Malaysia 8.3 4.4 11.3 1 11
Latvia - 19.8 - - -
Chile 3.7 3.5 4.3 5 1
South Africa 23.5 31.7 17.6 12 12
Poland - 14.5 - 7.0 8.6
Source: Human Development Report (2007/2008)
2.3.2.2. Human Development Index (HDI)
According to May (1998), the shortcomings of income as an indicator of development led
the United Nations Development Program (UNDP) to construct a composite index, which
they named the Human Development Index (HDI). This index is composed of three
equally weighted indices, and they include the following: (i) the life expectancy index,
(ii) the educational attainment index, and (iii) the GDP index. In the following notation,
L, E, and ILI have been used to measure (i), (ii) and (iii) respectively.
L = is the life expectancy index

38
E = is the educational attainment index
ILI is the income level index.
The HDI index is obtained by simply computing the average of the three indices, and this
process results in the following equation:
HDI = ( L + E + ILI )
3 According to the 2007/2008 Human Development Report, this index is measured on a
scale of 0 to 1, with 0 being the lowest level of development and 1 the highest level. For
instance, a HDI value of between 1 and 0.8 is regarded as a high level of human
development; a value of between 0.799 and 0.5 is regarded as a medium level of human
development; and a value of between 0.499 and 0 is regarded as a low level of human
development. See Table 2-5 for examples of HDI values for selected middle-income
countries with a GDP per capita similar to that of South Africa.
Table 2-5: Comparison of HDI values for selected middle-income countries Country Life
expectancy at birth (years) 2005
Adult literacy rate (%) 1995-2005
Real GDP per capita (PPP US$) 2005
Life expect-ancy index
Educa- tion Index
GDP index
HDI value 2005
HDI rank
Thailand 69.6 92.6 8.677 0.743 0.855 0.745 0.781 78 Brazil 71.7 88.6 8.402 0.779 0.883 0.740 0.800 70 Botswana 48.1 81.2 12.387 0.385 0.773 0.803 0.664 124 Russian Federation
65.0 99.4 10.845 0.667 0.956 0.782 0.802 67
Costa Rica
78.5 94.9 10.180 0.891 0.876 0.772 0.846 48
Mexico 75.6 91.6 10.751 0.843 0.863 0.781 0.829 52 Malaysia 73.7 88.7 10.882 0.811 0.839 0.783 0.811 63 Latvia 72.0 99.7 13.646 0.784 0.961 0.821 0.855 45 Chile 78.3 95.7 12.027 0.889 0.914 0.799 0.867 40 South
Africa
50.8 82.4 11.110 0.430 0.806 0.786 0.674 121
Poland 75.2 - 13.847 0.836 0.951 0.82 0.870 37
Source: Human Development Report (2007/2008)

39
As was shown in the discussion of the HPI, Table 2-5 also shows that the HDI value for
South Africa is low in comparison with other middle-income countries.
2.4. Conclusion
This chapter has presented a review of relevant literature on the definition and
measurement of poverty, an analysis that will prove to be a cornerstone in understanding
the remainder of this study. Some of the important aspects that were covered in this
chapter include the following: concepts closely related to poverty, different types of
poverty, and the definition and measurement of poverty.
With regard to definitional issues, this chapter has highlighted the fact that poverty is a
multidimensional phenomenon that has different meanings to different people.
Furthermore, it has also been established that the way in which poverty is defined
determines the methods employed to measure it, and the subsequent policy and
programme packages to address it. Hence, the importance of identifying concepts that
are closely related to poverty, as well as different types of poverty, is clear. Nevertheless,
despite the debate on definitional issues, this chapter has established that the general
consensus is that poverty can be defined according to three different perspectives, i.e. the
income/consumption perspective, the basic needs perspective and the capability
perspective. Thus, although the concept of poverty has been extended beyond its
economic domain, this dissertation defines poverty as “the inability of individuals,
households, or entire communities, to command sufficient resources to satisfy a socially
acceptable minimum standard of living”.
With regard to measurement issues, this chapter has noted that, just like defining poverty,
there is no ideal or correct way to measure the extent of poverty in a society, because a
crucial role is played by value or ethical judgements. In parallel with this controversy,
this chapter has established that there are two schools of thought that have emerged on
measurement issues. The one has defined poverty primarily in financial terms, and the

40
other has sought a more broad-based definition of poverty that is not solely based on
financial resources. Generally speaking, in developing countries, most development
analysts have been concerned with measurement in terms of the former approach. This is
due to the fact that this particular approach entails dimensions of poverty that are easily
and objectively measurable. When using this approach, there are generally three
ingredients that are required in order to compute a poverty measure. These are choosing
the relevant dimension and indicator of well-being; selecting a poverty line; and later,
selecting a poverty measure to be used for reporting on the population as a whole or a
population subgroup (and these only include the headcount ratio and the poverty gap
ratio, because these are the measures which are commonly used to measure poverty when
using the traditional approach). However, because these measures of poverty do not
necessarily capture how other non-monetary dynamics of poverty (such as being
illiterate, having a short life-span, lacking access to adequate healthcare, and having an
indecent standard of living) affect the poor, the World Bank introduced the HDI and HPI
indices.
41
Chapter Three
Determinants of Poverty 3.1. Introduction
“Once we recognize that poverty exists, then we… know that it must have
a cause (or causes); and if we can identify the cause of poverty, then that
should give us a basis to develop a policy response to it” (Alcock, 1997:
36).
During the pre-1994 political struggle against the apartheid regime, one of the arsenals
that were utilised by the ANC to galvanise the struggle for a democratic system was to
frequently articulate, to a majority of the people, the benefits that they would derive if
any political emancipation were to be consummated. As a result of this preponderance
exercise, a myriad of optimistic expectations among the majority of the disadvantaged
communities, particularly those that were hitherto poor, was created.
If one takes cognisance of the fact that the current government inherited an apartheid
state machinery, which had been set up, on the one hand, to provide quality services for a
privileged minority of the population, and on the other, to ensure deliberate, systematic
underdevelopment of the majority of South Africans (Pillay, 2000), general wisdom
would suggest that fulfilling these promises was, and is still, never going to be an easy
task. However, as has been alluded to in the above quote, a deeper understanding of the
underlying roots and causes of poverty, as well as circumstances that aggravate this
phenomenon within and outside the South African economy, can be of great help in this
regard. Such an understanding can go a long way in assisting the policy authorities, by
providing them with a point of departure for the design of effective policy programmes
aimed at enhancing the lives of the poor. In this context, this chapter therefore seeks to
discuss the theoretical and empirical determinants of poverty that are of particular
relevance to South Africa.

42
Table 3-1: Multiple classifications of the causes of poverty Economic Low productivity (macro and micro)
Poor economic skills (macro and micro)
Macro economic shocks (e.g. shrinking/stagnant economic growth; inflation, etc.)
Micro economic shocks (e.g. unemployment/under employment)
Adverse terms of trade (macro)
Technological backwardness/lack of research and development (macro)
Negative consequences of globalisation (macro)
Social Discrimination (gender, age, ethnicity, caste, race, impairment) (macro)
High fertility and dependency ratios (macro and micro)
Poor health and HIV/AIDS (macro and micro)
Inequality (macro)
Lack of trust/social capital (macro)
Absence of successful role models37 (macro and micro)
Political Poor political governance (macro)
Poor macroeconomic governance, including poor resource management
Insecurity (macro)
Violent conflict (macro)
Domination by regional/global superpowers (exogenous)
Globalisation (exogenous)
Environmental Low quality natural resources (macro)
Environmental degradation (macro and micro)
Disasters (flood, drought, earthquake, etc.) (macro and micro)
Remoteness and lack of access (macro)
Propensity for disease (‘the Tropics’) (macro)
Source: Modified from Hulme et al (2001)
What causes poverty? Unlike the definition of poverty, which continues to conjure up
different meanings for different people (hence a consensus on this definition remains
elusive), general concurrence among scholars and development practitioners regarding
the factors that determine and sustain poverty has been more closely approximated
(Burki, 1990: 5). Some of these factors are thought to be general, in that they can serve
to create or intensify privation across all sectors of the economy and across different
population groups. Others are thought to be more specific or localised, and their effects
may be more apparent in particular population groups or in populations associated with 37 In Hulme et al (2001), they call it ‘culture of poverty’, which used to be the interpretation of this phenomenon by some authors.

43
specific sectors of the economy. Furthermore, some of these factors or causes of poverty
can be grouped into categories based on the channels through which they affect poverty
levels. For example, they may originate from political or environmental issues, or they
may be economic or social in nature (see Table 3-1). In most cases, however, poverty is
likely to be the result of several mutually reinforcing factors that together define its scope
and pervasiveness.
Therefore, against the background that the causes and consequences of poverty interact
with and reinforce one another, the deliberation pertaining to the factors that sustain or
cause poverty in this chapter will go, where necessary, beyond the limited scope of the
definition38 of poverty that is espoused by this dissertation. Moreover, for the sake of
intelligibility, this chapter will divide these determinants of poverty into the following
two broad categories: (i) those that are exogenous to both the individual and government,
and (ii) those that can be influenced by policies at both the macro and micro level.
However, before any of these determinants are discussed, this chapter will first start by
shedding some light on the roots of poverty in South Africa. This will be done for the
purposes of determining why almost half of South Africans are unable to satisfy their
basic needs, while a minority enjoys extreme prosperity.
In the process of attempting to find out more about the underlying exogenous and
endogenous causes of poverty in South Africa, this chapter will consult a number of
secondary sources of data, including handbooks, journal articles and World Development
Reports. In addition, internet searches will be undertaken in order to supplement the
foregoing sources of data.
Excluding the introduction, this chapter consists of five sections. Section one is basically
a summary of how colonisation and apartheid policies stripped the majority of their
essential assets. The rationale for embarking on such an exercise is based on the belief
that, as has been noted by the World Bank (2000/2001), being able to successfully avoid
falling into poverty is a function of one’s ability to access productive assets. Against this
38 See Section 2.2.3 in Chapter 2.

44
background, as well as the fact that the essential assets of the majority of Blacks were
mostly eroded during the colonial/apartheid era, attempting to understand the nature of
poverty in South Africa from a historic viewpoint is a worthwhile exercise.
Section two focuses on the negative effects that globalisation has on the poor. To this
end, this section will illustrate that: (i) the poor in countries with an abundance of
unskilled labour do not always gain from trade reform; (ii) financial crises are very costly
to the poor; (iii) globalisation produces both winners and losers among the poor; and (iv)
trade distortion at the international level has a detrimental effect on the poor in
developing countries.
Section three is more concerned with the various factors that might perpetuate poverty at
a macro level. Firstly, this section will review the various environmental/situational
causes of poverty. In this regard, a discussion of the negative effects of (i) natural
disasters (ii) being domiciled in rural areas, and (iii) internal migration will take place.
Secondly, this section will look at two economic causes of poverty, namely: (i)
stagnant/shrinking economic growth and (ii) inflation. Thereafter, two social causes of
poverty will be discussed, namely rapid population growth and inequality.
The emphasis of section four is on the determinants of poverty at a household or
individual level. This section will begin with a discussion on the demographic causes of
poverty. To this end, an examination of the negative effects of having (i) a large
household size with a high proportion of dependants; (ii) a very old or young person as a
household head; and (iii) a (single) female as a household head, will be made. Thereafter,
the economic causes of poverty will be discussed. In this regard, the focal point of the
discussion will be on the negative effects that are usually associated with (i)
unemployment; (ii) underemployment; and (iii) inadequate access to productive assets
and markets. Once all this has been done, social causes of poverty such as (i) ill-health,
(ii) inadequate access to education, and (iii) inadequate access to decent shelter, will be
examined.

45
The last section encapsulates the findings with regard to the underlying determinants of
poverty in South Africa.
(3.2) The roots of poverty
“In South Africa we can regard (Black) poverty as the carcass left over
from (White) acquisition” (Terreblanche, 2002, paraphrasing Kurien,
1978).
Although income (or access to money) is not the only measure of poverty, in a world that
has (by and large) moved away from a subsistence and barter economy to a market one, it
is certainly among the salient determinants of poverty status. This is attributed to the fact
that a household’s access to most measures of well-being (e.g. nutrition, health, education
and so on) is usually a function of income. This correlation, in part, reflects the power of
money to provide goods and services. In this context, it follows then that the World Bank
(2000/2001) espouses that the basic rational understanding of the roots of poverty should
be built on the ability to access productive assets39 and the return on these assets.
According to the World Bank (2000/2001), individuals and communities have access to
assets in different forms and ways. It is the returns to individuals, households and
communities that are generated using these assets that are the ultimate determinants of
individual and collective well-being. Where such assets are absent or deficient or where
low returns are achieved, extreme poverty is the result. Therefore, in light of this view, it
would be useful to understand the nature of poverty in South Africa from an historic
point of view, since, as it will be illustrated in the following sub-section, the asset base of
the majority of Blacks was, by and large, eroded during the colonial/apartheid era. It has
to be noted, however, that this sub-section does not purport to review the full economic
history of South Africa. Instead, it will be confined to illuminating some of the historical
events (and their effects) pertaining to the economic disempowerment of Blacks, which
have reverberated into the post-colonial/apartheid era.
39 These include productive assets such as natural assets (land), physical assets (infrastructure), human assets (labour, skills & good health) and financial assets (savings and access to credit).

46
3.2.1. A synopsis of how colonisation and apartheid policies engendered economic
disempowerment among Blacks in South Africa
Black economic disempowerment in South Africa is rooted in military conquests and
political exclusion, which took a colonial and racial form and was buttressed by
continuing repression of political and social organisations. It all began (i.e. the conquests)
when the Dutch East Indian Company (DEIC) first came, in the 1650s, to settle in the
southern tip of Africa (which later developed into the city of Cape Town) for the
purposes of providing fresh food and meat for its ships’ crew and passengers en route to
and from the Far East. Its motives were ostensibly, therefore, economically inclined,
although it brought few assets to serve as the base for developing an economy. The
company occupied what was felt to be vacant land in the Cape Colony. This occupation
resulted in it taking over valuable grazing land (productive asset) of the African tribe
known as the Koi (Koikhoi, Hottentots) nation, to whom the land belonged. Naturally,
the resistance by the Koikhoi resulted in wars, which the local inhabitants lost because
they possessed inferior ammunition (when compared to that possessed by the invaders).
As a result, the Koi nation was shattered by this confrontation. Some of the survivors fled
into the deserts and some were captured as slaves or servants. “This take-over strategy
set the tone of the relationship between Black and White in South Africa for hundreds of
years, a tone of confrontation” (Setai, 1998: 1).
Initially, the impact was limited to the Cape, and mainly at the expense of Khoikhoi
pastoralists (Ross, 1999). However, over two centuries thereafter, there was a gradual
expansion (into the north and east of the interior) by the Dutch and then the British (who
took over, in the early nineteenth century, the Xhosaland and Natal as an outgrowth of
British imperialism), which exerted enormous pressure on the Bantu-speaking African
groups (i.e. Blacks). According to Aliber (2001), the most direct consequence of this
pressure was the dispossession of land by Whites, through which African farmers were
forced either to retreat to other areas such as Basutoland, become sharecroppers
(especially on land owned by whites of British descent) or farm labourers (especially on
47
land owned by farmers of Dutch descent). The other aspect of this pressure was the
introduction of price controls by the colonial authorities for marketed meat (so that the
White settlers would not have to compete with the African groups, who could undersell
the settlers’ prices), which was also an effort to cripple the economy of the African
people. In spite of this, African agriculture continued to thrive for a time, and indeed
posed a highly resented source of direct competition to White farmers. The colonial
authorities were baffled by this resilience, and this, in turn, led them to acquire further
African land (including some of the livestock therein), as well as to curb sharecropping
(Keegan, 1986; Trapido, 1986). Repeated attempts to resist the occupying powers further
weakened the African societies through the loss of human assets. Over and above this, the
surviving indigenous inhabitants further lost significant human assets through exposure to
unfamiliar diseases, notably smallpox, which resulted from contact with colonial
authorities and settlers. Moreover, when slaves died of smallpox, the settlers intensified
their efforts to enslave more people from these African groups as replacements. Some
other hitherto unfamiliar diseases such as foot and mouth disease and rinderpest also
affected the livestock of local inhabitants, with the latter wiping out 90% of the region’s
livestock (Ross, 1999). This further undermined the asset base of the African population,
for whom livestock formed a critical source of sustenance (Aliber, 2001; Ross, 1999;
Setai, 1998; Keegan, 1986; Wilson & Ramphele, 1989).
The groundbreaking discovery of diamonds in 1867, and some of the world’s largest gold
deposits in the latter half of the 19th century (1887, to be exact) completely changed the
landscape of the South African economy. This discovery transformed the South African
economy from a closed, agrarian economy40 to one able to start out on a path of
industrialisation and establish international economic linkages (van der Berg & Bhorat,
1999). In order for this to happen, however, this novel mining industry required a large,
mass-based workforce, which (in turn) triggered the demand for unskilled labour to
mushroom. This prompted the settlers to seek political control of the region (and this was
done under the pretext that this control would enable them to meet this massive demand).
40 In other words, farming was no longer the mainstay of the economy. Instead, the core of the economy was now mining.

48
In an attempt to attain this political control, as well as to facilitate the supply of unskilled
labour from the indigenous groups who, in spite of the conquests, still had considerable
economic autonomy (through subsistence farming), a plethora of laws and policies were
introduced. This resulted in a variety of oppressive and economically inequitable and
inefficient laws, culminating in the most stringent law of all, The Land Act of 1913. This
Act forbade Africans from owning land in designated ‘White’ areas, and resigned
Africans to ‘reserves’, which accounted for a mere 7% (which was later extended to
about 13% through the 1936 Native Trust and Land Act) of the total land area of South
Africa. This Act also limited the number of African families that could work/live on
White farms. It is worth noting that the land in these African reserves was (in contrast to
that found in White areas) rocky and thus not conducive to farming, which meant that the
self-sufficient economy that the indigenous groups relied on was severely compromised
and their asset-base eroded. This, combined with, among others, the implementation of
The Draft Vagrancy Law41 that was passed in 1834, as well as the Glen Grey Act42 of
1894, meant that the economic options of Africans were severely limited. As a survival
remedy, Africans were compelled to sell their labour to the mines and White farms. This
resulted in an influx of about 180 000 mineworkers into the mining industry, half of
whom were from South Africa, and another half from Lesotho, Swaziland, Mozambique
and elsewhere (Aliber, 2001).
It is also important to note that in these mines, the White mine workers (who often
competed with Africans for jobs) were represented by the Union of South Africa (this
was a political partnership between English-speaking and Afrikaner Whites), which, not
surprisingly, did not look after the interests of the African majority (Terreblanche &
Nattrass, 1990: 6). As a direct result of this, the working conditions of the Whites and
Africans were not the same, and this was articulated through a series of laws that were
passed by the minority government. For example, the Mines and Works Act essentially
41 In terms of this Act, no independent African economic undertaking was to be recognised as a legitimate economic activity. 42 This Act imposed a tax on all Africans who did not enter the mines on a three-month contract (Ncube, 1985: 14). To augment this labour tax, poll and hut taxes were imposed on the African rural population, thus increasing the incentive to earn cash on the mines.

49
reserved skilled jobs on the mines for Whites, and thereby prevented the upward mobility
of Africans on the mines. The Black Labour Regulation Act instituted a standard
uniform wage rate for African mine workers and prevented African workers from
breaking their contracts. This was buttressed by a provision which prevented employers
from attracting workers through higher wages (Greenberg, 1980: 154). Hence, the racial
wage gap in the various industries, particularly in the mining industry, widened
consistently until the early 1970s (see Table 3-2).
Table 3-2: Real growth of Black wages and Black/White wage gap by industry
Mining Manufacturing Construction
Annual growth of real
Black wages:
1961-70
1971-80
1981-85
1985-1994
0.72%
13.18%
-0.14%
---
2.69%
4.61%
0.81%
1.21%
2.96%
2.83%
1.15
-0.29
Black wages as % of
White levels:
1960
1970
1980
1985
1994
6%
5%
17%
19%
---
19%
17%
23%
25%
29%
18%
15%
19%
21%
30%
Source: Fallon (1992); StatsSA (1995)
With this quantum of mineworkers flocking into the urban areas, controlling African
mobility remained a high priority for the government through most of the 20th century.
The colonial government sought to balance the legitimate demand for African workers
for mines and unskilled and semi-skilled work in urban areas, with the desire of keeping
White settlements insulated from surplus Africans (Aliber, 2001). As a result of this strict
control, townships adjacent to White towns were engendered, to which Africans and
Coloureds were relegated.

50
In order to subject the African people to more suffering, in 1950, the Minister of Native
Affairs, H.F. Verwoerd (who later became Prime Minister) introduced the more
draconian Urban Labor Preference Policy (Aliber, 2001; Gelb, 2004). This policy was
intended to facilitate a split among families for long periods, with men working on the
mines or in the cities, and women remaining in the rural areas. This of course had
devastating effects on the well-being of Africans in the rural areas. Not only did
conditions deteriorate as more and more people were forced to settle there, it also became
extremely difficult for most women to maintain their households without the presence of
their husbands. They had to raise children on their own, which included a myriad of
responsibilities, such as subsistence farming for food security, providing shelter to keep
the children insulated from hostile weather conditions, treating children suffering from a
number of diseases, most of which were attributed purely to the poor living conditions
that they were subjected to every day of their lives. What exacerbated the conditions of
some of these people was that they were landless and, as a result, they were fully exposed
to poverty. Hence, the former homelands are the locus of poverty in South Africa’s post-
apartheid era.
According to Aliber (2001), the logical conclusion of this process came in the 1960s and
1970s, when the apartheid government elevated the status of the African reserves to ten
putatively self-governing homelands, of which some were declared ‘independent states’.
These homelands were thus set up with their own assemblies, government departments,
rights to confer citizenship, and so on. The idea of ‘separate development’ was that they
would also have their own economies. What is noteworthy is that the resources allocated
for these states were minimal, as most of the development efforts were channelled
towards high-income White urban enclaves, thereby neglecting the majority of the Black
population. As a result, this 13% of the country’s land area remained isolated and
undeveloped. Moreover, economic opportunities were extremely scarce in these reserves,
and this resulted in the migrant labour system being the most utilised survival strategy,
which of course came at a very high personal cost. Furthermore, basic services were
almost non-existent (or very poor) in these (Black) reserves. For example, the apartheid
51
regime introduced the ‘Bantu’ education policy that was, together with other services43,
extremely poor in quality44. It (i.e. ‘Bantu’ education) focused on limited technical and
vocational skills. Although the number of African children in school grew, they remained
concentrated in the lower grades. Between 1950 and 1960, for example, enrolment
doubled, but the proportion in Grades 1-4 remained at 73% (Christie & Collins, 1984:
178). Even after per capita spending on education increased from the mid-1970s onwards,
educational outcomes for Africans were still poor. In 1989, the African pupil: teacher
ratio was 38:1, compared with 17:1 for Whites, while 52% of teachers in the African
school system were under-qualified. Consequently, Africans’ pass rate for the school-
leaving examination was 41%, compared with 96% for Whites (Hofmeyr & McLennan,
1992: 176). At the post-secondary level, Blacks were excluded from established English-
language universities from the 1950s onwards, and only admitted to segregated ‘bush
colleges’ set up in the 1960s. This poor education, in essence, systematically crippled the
advancement of the African populace. It ensured that advanced skills were concentrated
in White hands (see for example Table 3-3), and as a result of this, the majority of Blacks
were left largely unskilled and hence lacking in human assets. This resulted in the
shortage of skilled labour in certain sectors of the South African economy (which is still
the case, even in the post-apartheid era) and ensured that Blacks were the source of cheap
labour in general. In 1980, for example, while Africans made up 73% of the population,
they only garnered 24.9% of the income. In contrast, Whites had 64.9% of the income,
while making up 15% of the population (Wilson & Ramphele, 1989). The policy of
employment segregation also meant that Blacks could only occupy certain types of jobs,
which were largely menial.
In addition to this, market forces limiting Black access to finance (so they could, for
example, start their own businesses) were reinforced by legislation45. For example,
according to Gelb (2004: 21), the 1950 Group Areas Act explicitly restricted firm
43 In 1980, for example, the infant mortality rate among whites was 12 deaths per 1000 births, while among the Africans, the rate ranged from 94 to 124 deaths. Moreover, while 1% of White households were without electricity, some 80% of African households were without electricity (Wilson & Ramphele, 1989). 44 Church-based schools were available until the 1950’s. 45 In all, there were more than 500 laws and over 800 bylaws and regulations that restricted the activities of black entrepreneurs (Horrell, 1977; Robertson, 1986; Williams, 1989).

52
ownership by Blacks to specified areas in cities and towns, and subsequent regulations
prevented Black entrepreneurs from owning more than one business, establishing
companies or partnerships, or owning business premises, even in Black areas. African
firms were further restricted to certain markets, only 25 activities – mainly retail supply
of food and fuel – being allowed, before the restrictions were partially relaxed in 1976.
The spatial and racial restrictions on property ownership resulted in Blacks lacking
collateral to borrow for asset acquisition, and the risks of ownership were increased by
the insecurity of urban residential and workplace tenure (Riley, 1994: 12-16, cited in
Gelb, 2004). As a direct result of this, there are very few Black South African firms in the
medium-size category. Significantly, according to 2005 research conducted by the Black
Business Executive Circle (cited in the Business Report, 2006), only five companies on
the Johannesburg Stock Exchange (JSE) had 51% Black ownership (i.e. among the top
200 companies). Their market capitalisation was only R 4.6 billion, or about 0.2% of the
JSE’s total market capitalisation. This research also revealed that there were only twenty-
seven companies on the JSE which had more than 25% Black ownership. The market
capitalisation for these was R 23 billion, equivalent to 0.78% of the JSE’s market
capitalisation.
With regard to other minority, non-white population groups, including Coloureds and
Indians, Aliber (2001) contends that they faced similar but different forms of
discrimination and economic oppression. Both groups were also subject to forced
removals, restrictions on movement and settlement, and were denied the right to vote
(except on a limited basis in the Cape Colony and then again, briefly, through the bogus
tricameral parliament established in the 1980s). Although per capita spending on
education, housing and services for these two groups was marginally higher than that of
Africans, it was still significantly inferior to that of Whites. A significant proportion of
Coloureds, concentrated in the Cape, relied on unskilled and semi-skilled farm work for
sustenance, under conditions somewhat better than those of their African counterparts
elsewhere in the country. Indians, most of whose forebears originally came to South
Africa in the late 1800s as indentured labourers to work on the sugar plantations of Natal,

53
diversified into a number of different economic niches, including trading, manufacturing,
and professions.
Table 3-3: Share of White and African employment by occupation (1969 & 1977) White 1969 White 1977 African 1969 African 1977
Managers 8.22% 11.28% 0.39% 0.46%
Professional/semi-
professional
10.11% 11.52% 1.89% 2.53%
Clerical, white
collar
42.74% 43.29% 6.29% 9.17%
Supervisors 4.71% 5.24% 0.48% 1.15%
Skilled manual 22.98% 22.72% 2.86% 4.97%
Semi-skilled
manual
8.68% 4.91% 16.73% 19.67%
Unskilled manual 2.56% 1.06% 71.37% 62.04%
Total economically
active
100% 100% 100% 100%
Source: Simkins and Hindson (1979)
*Note that, due to rounding off, figures may not all add up to exactly 100%
Based on the foregoing discussion (and with the benefit of hindsight), it was inevitable
that high levels of (Black) poverty and inequality would characterise the country for
many generations to come. Therefore, the assertion that the causes of poverty are rooted
in the colonial/apartheid era is plausible. In this context, it would thus be appropriate to
use this historical context in the subsequent sections as a base, when elucidating upon the
causes and aggravators of poverty in South Africa.
3.3. Global or exogenous determinants of poverty
As has already been indicated above, a good understanding of the factors that cause or
perpetuate poverty can be of great help in terms of devising strategies that would
effectively deal with this phenomenon. Unfortunately, at times, even strategies that are
informed by such an understanding may still not be enough to arrest this phenomenon.

54
This is mainly attributed to the fact that, due to globalisation, some of the factors
responsible for poverty emanate from issues or developments that occur in the global
arena. These are usually exogenous in nature, meaning that they are beyond the control of
the various national governments. In essence, therefore, due to the fact that they have a
limited effect in the global context, good national (poverty reduction) policies are bound
to be insufficient, unless they are complemented by a supportive international
environment. Against this background, it would thus be useful to illuminate some of
these (negative) exogenous factors that are engendered by globalisation, with the view to
ascertaining how these may exacerbate the plight of the poor in developing countries
such as South Africa.
3.3.1. The negative effects of globalisation and poverty
“Growth really does help the poor: in fact it raises their incomes by about
as much as it raises the incomes of everybody else. … In short,
globalization raises incomes, and the poor participate fully” (The
Economist, 2000: 94a).
“There is plenty of evidence that current patterns of growth and
globalization are widening income disparities and hence acting as a brake
on poverty reduction” (Justin Forsyth, Oxfam Policy Director, Letter to
The Economist, 2000: 6b).
While globalisation is now widely regarded as economically benign, in the sense that it
plays a catalytic role in accelerating growth and invariably the reduction of poverty
globally46, the question that is often raised by anti-globalisation critics is whether or not
the actual distribution of gains is fair and, in particular, whether or not the poor benefit
proportionately less from globalisation, and could under some circumstances actually be
46 There is compelling evidence that globalisation has played an important catalytic role in accelerating growth and reducing poverty in developing countries (Frankel & Romer, 1999; Dollar & Kraay, 2000; Sachs & Warner, 1995).

55
hurt by it47 (Khor, 2002; Watkins, 2002). As a matter of fact, their perception is that
“trade accentuates not ameliorates, deepens not diminishes, poverty in both the rich and
the poor countries” (Bhagwati & Srinivasan, 2002: 02). Hence, the extent to which the
poor benefit from globalisation is still a raging issue of academic and public debate. The
above two quotes exemplify the extremes of this debate.
There are several recent surveys that have attempted to review the evidence on the
relationship between globalisation and poverty (see for example Winters et al, 2004;
Goldberg & Pavcnik, 2004; and Ravallion, 2004). However, the authors of these surveys
acknowledge that they can only review the indirect evidence regarding the relationship
between globalisation and poverty. This is due to the fact that the studies, which test for
the direct connections between the two, are very sparse. The few studies which do
examine the links between globalisation and poverty typically use computable general
equilibrium models to disentangle the relationship between trade reform and poverty.
While such research provides an important contribution to our understanding of the
channels through which globalisation could affect poverty, Harrison (2005) argues that it
is extremely important to be able to look at actual ex post evidence of the impact of trade
and investment reforms on the poor. Nevertheless, the broad themes (most of which have
to do with the negative impact of globalisation on the poor) that emerge from some of
these surveys48 can be summarised as follows:
(i) The poor in countries with an abundance of unskilled labour do not always
gain from trade reform. Many economists have used the Heckscher-Ohlin
(HO) framework in international trade to argue that trade liberalisation will
raise the incomes of unskilled labour in (labour-abundant) poor countries. The
notion of this framework is that if the abundant factor in developing countries
is unskilled labour, then the poor (unskilled) in developing countries have the
most to gain. However, in their chapter on the theoretical relationship between
47 There is an online debate on ‘Globalization and Poverty’ that was organised by the World Bank Development Forum in mid-2000. Nearly all participants in the debate emphasised the negative impact of globalisation on the distribution of income and wealth between and within countries. 48 This section draws heavily from Harrison’s (2005) paper on “Globalization and Poverty”.

56
trade and poverty, Davis and Mishra (2004) argue that most researchers who
use this framework to argue that globalisation is good for the world’s poor
make a number of heroic assumptions—such as that: (i) all countries produce
all goods; (ii) goods imported from abroad and domestically are close
substitutes; (iii) comparative advantage can be fixed vis-à-vis all trading
partners—which may not necessarily hold in reality. As an illustration, they
contend that a poor country in a world with many factors and many goods
may no longer have a comparative advantage in producing unskilled labour-
intensive goods. This idea is easy to understand in the context of three
countries—for example, the United States, Mexico and China. Although
Mexico might have a comparative advantage in producing low-skill goods in
trade with the United States, its comparative advantage switches vis-à-vis
trade with China. In addition, the country studies show that labour is not
nearly as mobile as the HO trade model assumes - for comparative advantage
to increase the incomes of the unskilled, they need to be able to move out of
contracting sectors and into expanding ones. Another reason why the poor
may not gain from trade reforms is that developing countries have historically
protected sectors that use unskilled labour, such as textiles and apparel. This
pattern of protection, while at odds with simple interpretations of HO models,
makes sense if standard assumptions (such as factor price equalisation) are
relaxed. Trade reforms may result in less protection for unskilled workers,
who are most likely to be poor. Finally, penetrating global markets, even in
sectors that traditionally use unskilled labour, requires more skills than the
poor in developing countries typically possess.
(ii) Financial crises are very costly to the poor. In Indonesia, poverty soared
following their currency crisis in 1997. According to Lanjouw et al (2001),
there was an 11% increase in poverty in Indonesia from October 1997 to
October 1998. This is contrary to expectations that greater integration in
global financial markets would smooth fluctuations in consumption. Cross-
country evidence also suggests that financial globalisation leads to higher
consumption and output volatility in low-income countries. One implication is
57
that low-income countries are more likely to benefit from financial integration
if they also create reliable institutions and pursue macroeconomic stabilisation
policies (including the use of flexible exchange rate regimes). However,
foreign investment flows have very different effects from other types of
capital flows. While unrestricted capital flows are associated with a higher
likelihood of poverty, foreign direct investment inflows are associated with a
reduction in poverty.
(iii) Globalisation produces both winners and losers among the poor. Against the
background that globalisation has many facets/aspects, as well as the fact that
the poor are a heterogeneous group, it is dangerous to generalise the effects
thereof on the well-being of the poor. Hence, empirical results can defy
generalization, even within a country or region. For example, according to
Harrison (2005), in Mexico, while (as a result of globalisation) some small
and medium corn farmers experienced a decline of about fifty percent in their
income in the 1990s, large corn farmers gained. Jenkins (2006) found similar
results in his analysis of the impact of globalisation on employment and
income opportunities for the poor across different countries. He found that the
growth of labour-intensive export of manufactured and agricultural products
does create employment opportunities, particularly for low-income women
and migrants from rural areas, as horticulture exports in Kenya or garment
exports in Bangladesh and Vietnam reveals. On the contrary, he also found
that opening up to global competition has also led to job losses and
deterioration in working and employment conditions, as the case of textile
industries in South Africa illustrates49. In addition to this, within the same
country or even the same region, a trade reform may lead to income losses for
rural agricultural producers and income gains for rural or urban consumers of
those same goods. This is usually the consequence of (as will be illustrated
below) ‘food dumping’ by farmers from developed countries, who are
subsidised to a large extent by their relevant governments.
49 Between 1996 and 2004, South Africa lost 75 000 clothing and textile jobs due to opening up to international competition from countries such as China (Mail&Guardian, 2005, cited in Desai, 2005).

58
(iv) Trade distortion generates poverty. The effects of import liberalisation on the
viability of agriculture, particularly that practised by small farmers of food
crops, have become an important field of study in recent years. This is due to
the increasing concerns of farmers and their organisations, civil society
organisations involved in development, and policymakers in governments of
the developing world. Such concerns have emerged because, while the
ideology of neo-liberalism says that the maximum liberalisation of tariff and
regulatory controls is as good for the party taking these measures as it is for
the potential entrants into a newly liberalised domestic market, in practice,
globalisation is a highly uneven and unequal process of liberalisation. In many
developing countries, the liberalisation of imports has resulted in intense
competition from imports that have threatened to displace some of the
products of small farmers from their own domestic market. This is because the
competition emanating from imports has not been fair in many cases. Imports
coming from developed countries are usually heavily subsidised, and thus
their prices are artificially cheapened. On the other hand, farmers of
developing countries are usually not subsidised. Hence the problem of food
dumping. For example, in the Philippine, the Congress, as elucidated in
Resolution No. 570 of the House of Representatives (2003), recognised that
the removal of quantitative restrictions and the more than halving of average
nominal tariffs in the agricultural sector has caused imported vegetables to
flood the domestic market with an almost three-fold increase from 42,000
metric tons (MT) in l995 to 115,000 MT in 2000. Local farmers could have
easily raised these vegetable imports. The United States, Australia, New
Zealand, the Netherlands, Singapore and China were identified by this
Resolution as the sources of cheap vegetable imports. Moreover, while global
negotiations at the World Trade Organization (WTO) have been moving
rapidly towards free markets in foreign investment and services, developed
countries intervene in textile and agricultural markets in order to create
obstacles for exports by developing countries in areas where they are currently
competitive. For example, according to Oxfam (2002), average tariffs applied

59
by industrialised countries to developing countries are some four to five times
higher than the tariff applied to trade between industrialised countries. The
reason is straightforward: products in which developing countries have a
competitive advantage are subject to the highest import taxes. For the most
part, the products involved are labour-intensive goods, where export
production has the greatest potential to reduce poverty.
3.4. Macro level determinants of poverty
At the macro level, there are numerous characteristics that might be associated with
poverty. The relationship of these characteristics with poverty is country-specific. In
general, however, poverty is high in areas/countries characterised by natural disasters,
geographical isolation, non-gainful internal migration, stagnant or shrinking economic
growth, high levels of inflation, high levels of population growth, and high levels of
inequality.
3.4.1. Environmental/situational characteristics
The different areas where people live pose both opportunities and constraints or hazards.
People who fail to realise opportunities in their respective communities, particularly in
the rural areas, usually fail to mitigate the negative effects (that are created by the
constraints or hazards in these respective areas) that accompany these opportunities, and
this could lead to low income, which could result in poverty if it (i.e. low income) is
sustained for long periods of time. If a community is to be lifted, it is therefore important
that all aspects (both positive and negative) of a location are considered. In light of this,
the ensuing sub-sections seek to discuss how these constraints (including exposure to
natural disasters and residing in rural areas) could lead to poverty if they are not managed
successfully.

60
3.4.1.1. Natural disasters (floods, droughts, etc.) and poverty
Everybody is exposed to natural hazards and hence to disaster risks. However, the level
of exposure and the ability to cope with disaster is varied, with poverty being the result in
some instances. In light of this, this section seeks to understand how natural disasters can
cause or aggravate poverty. This will be achieved by discussing, in brief, why the impacts
of natural disasters affect poor people and rich people differently, and how these disasters
actually affect poor people and poor societies.
(i) Why do the impacts of natural disasters affect poor people and rich people
differently?
Levels of vulnerability are highly dependent on the economic status of individuals and
communities. Since the poor and the near poor have a weak asset base, they are likely to
be the most vulnerable sector of society. They experience proportionally higher losses
when a disaster strikes, because they have less capacity to recover. The foregoing could
be attributed to a number of reasons50, including the following:
• Poor people live in less well-constructed houses than their better-off
compatriots, and these are more susceptible to destruction by wind, flood
or earthquake than stronger, more expensive housing.
• Poor people very often live on lands that are marginal and subject to
flooding or drought.
• They have few or no savings to protect themselves in crises, and they
cannot afford insurance because of their low earnings. Furthermore, the
fact that they have inadequate access to credit makes it difficult for them
to recuperate.
• They have few options for escape when a natural crisis is predicted,
because such options cost money. They have less schooling than richer
50 These reasons are illuminated in Mary B. Andersons’ (1999) background note on the ‘impacts of natural disasters on the poor’ that she submitted for use in the development of the World Bank’s WDR 2000/2001.

61
people and thus enjoy fewer employment options when a natural event
undermines their livelihoods. They may suffer from ill health or
malnutrition.
• Many of the important decisions about what to spend in order to reduce
disaster vulnerability are made not by individuals but collectively, by
towns, regions and nations. Disaster preparedness, prevention and
response policies and programmes can reduce—even eliminate—
vulnerability. However, in many societies, because the poor are
marginalised politically and do not participate fully in decision-making
structures, their interests are overlooked or minimised in relation to the
interests of those who have power and access to decision-making.
• Wealthy contractors can sometimes bribe government inspectors to ignore
building code violations, and the poor have little power to protest and few
choices about where to live, since these buildings are the only ones they
can afford.
• Because disaster preparedness and prevention cost money, wealthy people
may vote not to undertake a flood plain project, for example, if they live
on high ground, although the poor live in vulnerable locations. Collective
decisions about society’s disaster policies are often dominated by those
who have private resources and less to lose in the event of a crisis. Often,
the decisions and actions of one group affect the disaster vulnerability of
other groups.
(ii) How do natural disasters affect poor people and poor societies?
According to Anderson (1990), there are two ways in which the costs51 of natural
disasters are more severe for poor people and poor societies than for those that are better
off.
51 In her paper on ‘Analyzing the costs and benefits of natural disaster responses in the context of development’, Anderson (1990) asserts that these disaster costs are assessed according to three categories: direct costs (such as losses of capital stock and inventories); indirect costs (such as lost income, employment or services that result from damaged productive capacity); and secondary costs (representing

62
Firstly, although the actual value of property that can be lost through disasters in wealthy
societies is higher than in poor societies, losses as a percentage of wealth (individual or
national) are higher for poor people. Monetary valuations of property losses do not tell
the whole story. For example, if the only national university in a poor country is
destroyed by a natural crisis, 100% of the higher education facilities are lost, whereas the
loss of a single university in the United States might cost more dollars to replace, but it
represents a less significant loss in terms of total national wealth. One can make similar
calculations at the individual level.
Likewise, with regard to indirect costs, losses for the poor may have more devastating
impacts, although the monetary value assigned to losses of the rich may be higher. For
example, if one school teacher in the United States dies in a catastrophe, the monetary
loss of his or her expected lifetime earnings would be higher than that for an individual
school teacher who dies in a disaster in Tanzania. However, if the latter were the sole
teacher in a village, the proportionate loss to education for a group of children would be
more significant than in the wealthier country.
In terms of secondary costs, monetary calculations can also be misleading. For example,
if a disaster results in food shortages and thus increases in food prices, better off people
may actually spend more on food than poor people, but the latter may experience a
greater impact on total income, because they spend a higher proportion of their income
on food.
The second way in which the effects of disasters fall more heavily on poor people than on
rich people is through the mutual reinforcement of disasters and poverty. Disasters are
both a cause and effect of poverty, and poverty is both a cause and effect of disasters. For
example, environmental degradation increases the likelihood of some disasters, such as
floods, drought or ocean wave damage. However, poor countries cannot afford to take the decreases in economic growth and development that occur as a result of such things as increased debt, inflation, price changes that have redistribution effects, and the like).
63
initiative to curtail such damage, and its continuation perpetuates vulnerability to future
disasters that, in turn, contributes to further degradation. Repeated loss of commercial
crops, destruction of industrial sites or dislocation of a workforce can undermine
incentives for investment in economic enterprises. However, such investment is essential
if the cycle of unemployment and poverty is to be broken. Destruction of local goods
often necessitates increases in imports. The cost of increased international debt falls more
heavily on poor countries, which then have fewer remaining resources to invest in
domestic production. Repeated and frequent losses from natural disasters undermine
creativity, motivation and other entrepreneurial incentives that form the basis of poverty
reduction.
3.4.1.2. Rural location and poverty
One of the most salient facts about the poor in most developing countries is that they are
disproportionately located in rural areas and, according to Ravallion (2002), this trend is
likely to prevail for protracted periods of time. The World Bank (1990), for example,
reported that, on average, in Africa and Asia, about 80% of all target poverty groups are
located in rural areas, and for Latin America the estimated percentage was about 50%. In
light of these alarming averages, it is thus not surprising to find that data from individual
country studies also reveals a similar trend. For example, according to the World Bank
(1990), during the 1980’s, rural poverty was six times that of urban poverty in Kenya,
while in Mexico, it was 30% higher during the same period. Around 1980, a staggering
98% of China’s poor lived in rural areas (Ravallion & Chen, 2004). In South Africa, the
1995 OHS/IES also revealed that 74% of the poor reside in rural areas, compared to only
16% in urban areas (this is largely due to the forced removals and influx control
measures, which were devised for the purposes of restricting rural-urban migration to
breadwinners only - see section 3.3.1). Against this backdrop, this section will try to
illuminate possible reasons why poverty is concentrated in rural areas.

64
3.4.1.2.1. Factors contributing to low income and poverty in rural areas52
There are several factors that might explain why poverty is higher in rural areas than in
urban areas, and those worth mentioning include the following: lack of resources and
technology; urban bias; vulnerability to natural disasters; and lack of access to basic
services.
(i) Lack of resources and technology. Rural areas are heavily dependent on
agricultural production, which in developing countries is characterised by low
labour productivity, because of minimal capital per worker and inadequate
technology. Small farm owners, in general, receive limited credit (compared
to large farm owners) and tenants, sharecroppers and landless labourers
receive almost none. Moreover, there is little research and development to
improve technology appropriate for small farmers. Therefore, due to the
combination of these factors, low aggregate earnings are usually the result.
(ii) Urban bias. At the heart of the apartheid policies, there was a subtle premise
of multi-faceted discrimination against non-Whites, especially Africans.
According to the ideology of apartheid, each race was to be kept apart, and
each was to develop separately. This segregation tactic was then, in turn,
utilised to target development efforts at high-income White urban enclaves,
thereby neglecting the majority of the Black population, who were mainly
domiciled in the former rural homelands. This constituted a disproportionate
spending on services, including education, medical care, training, housing,
infrastructure (such as tarred roads) and general public services (access to
clean water) for these urban areas. Consequently, things such as years of
schooling (a major indicator of skill and productivity) and life expectancies
(an indicator of the quality of the health care system) are lower in rural than in
urban areas. Hence, average incomes in urban areas are higher than in rural
areas.
52 This section draws heavily from Nafziger (1997).
65
(iii) Vulnerability to natural disasters. Natural disasters such as drought or
flooding tend to affect rural areas more severely than urban areas. Although at
first it might be thought that these phenomena would only affect transient
poverty, they affect the stock of capital of communities, which in turn has a
permanent adverse effect on poverty rates (see the preceding section on how
natural disasters can generate more poverty).
(iv) Lack of access to basic services. The poor are frequently physically or
figuratively on the periphery when it comes to access to the most basic
opportunities and services needed in order to facilitate survival. As a result,
they usually find themselves having to travel large distances to access services
such as schools and clinics, and when seeking a job, they subsist away from
home because job-seeking imposes a price, which the extremely poor
frequently cannot pay. Furthermore, lack of income and markets in remoter
(i.e. areas that are not easy to access) poor communities curtail business
opportunities and give rise to a vicious cycle of poverty, which also
encompasses incapacity to pay for services.
3.4.1.3. Internal migration and poverty
Owing to the combination of factors that have been alluded to in the preceding sub-
section (3.5.1.2.1), as well as the lack of gainful employment (or economic)
opportunities, most of the people that are domiciled in rural areas understandably migrate
to urban or other rural areas that are perceived to have better opportunities. In South
Africa, for example, the rural-urban and rural-rural migration labour system has its roots
in the development of mining and industrial sectors, and also in the early primitive stages
of commercial capitalist agriculture, which took place on farms that were owned by
Whites53. The notion is that, because they are perceived to be capital-rich, these areas
generate a high marginal productivity of labour, and therefore wage rates that are
generally high. In essence, therefore, migration offers the promise of higher earnings and
53 According to Cohen and Kennedy (2000), the South African migrant labour system, at least until 1989, was probably the largest in the world.

66
thus better living conditions for the family back home (assuming that the migrants54 will
send remittances back to the people that they left behind).
Notwithstanding the foregoing view, it is important to note, however, that migration does
not always yield the expected higher returns. This is because realising these higher
returns is, inter alia, a function of the migrants’ means (assets and resources) and
strategies (networks and planning). Moreover, the impact of migration is context-
specific. Therefore, under certain circumstances, migration can actually cause poverty or
aggravate the very same adversities that the migrants were trying to circumvent in the
first place. For this reason, this sub-section seeks to discuss, in brief, the migration-
poverty link, with a particular emphasis on how migration can cause or aggravate
poverty.
3.4.1.3.1. Migration as a cause of poverty
There are a number of ways in which migration can cause poverty or at least deteriorate
the living standards of the already poor and the near poor. Those that will be discussed
here include, among others, forced removals, migration that occurs through irregular
channels, overcrowding in the labour markets (of various destinations), and brain drain.
(i) Forced removals
According to Skeldon (2003), one of the most obvious ways in which migration can
cause poverty is through forced removals that occur without adequate planning and
support. These forced removals have a direct effect on the livelihoods of the poor, in a
sense that they strip the poor of their much-needed essential asset, i.e. their house (see
section 3.5.3.3 regarding how inadequate access to lodgings can limit economic
opportunities for the poor). In many cases, the forced relocation is essentially the product
of development, mainly through the creation of lakes and reservoirs that are the result of 54 Migrants are people who, in an effort to improve their lives, move for a temporary or permanent period of time from their place of birth, and who do not necessarily enjoy the same rights and entitlements available to non-migrant individuals in that place. (This definition was developed by the DFID to encompass the range of movements undertaken by people, particularly the poor).

67
the construction of dams, although displacement for roads and urban expansion is also
important. For example, it is estimated (globally) that between 90 and 100 million people
were involuntarily displaced by infrastructural development projects during the last
decade of the twentieth century (Cernea & McDowell, 2000: 02). In India alone, some 20
million people are estimated to have been displaced over a period of about 40 years, the
majority of whom became impoverished (Cernea, 2000: 12), while in China, over a
similar period of time, well over 30 million people were displaced (Meikle & Zhu, 2000:
128).
(ii) Migrating through irregular channels
Many migrants, particularly those who migrate through irregular channels,
find
themselves in vulnerable positions before, during and after their journey. There are
certain fundamental human rights that all migrants possess. In practice, however, many
migrants are unable to exercise the rights to which they may be entitled under
international and national law. This is worsened by the fact that these migrants usually
lack the necessary mechanisms to buffer their plight, at least in the short-term.
Consequently, the foregoing combination, in turn, makes migrants vulnerable to
exploitation, malnutrition, starvation and other afflictions, all of which constitute the
hallmarks of poverty.
(iii) Oversupply of labour in destination regions
Problems may arise when a destination region’s capacity to absorb large flows of labour,
particularly the unskilled, is limited. ‘Migration myths’ or exaggerated accounts of
achievement at destination stimulate flows and further intensify problems of oversupply
of labour in destination regions, leading new migrants to suffer from inadequate housing
and employment, and to remain or become more vulnerable (Kothari, 2002; Skeldon,
1997). In the South African context, this is exacerbated by the fact that, as it has been
indicated in the analysis conducted by Burger (2004: 56-57), among others, since 1994,
those sectors of the economy that have employed large numbers of unskilled labourers,

68
such as mining and agriculture, have shed large numbers of jobs55 (meaning that jobless
migrants had nothing to remit). Instead, the sectors (such as finance, real estate and
business services) that have been adding large numbers of new jobs are those that employ
workers who are more skilled. Consequently, the demand for unskilled workers has
slumped and, in contrast, the demand for semi-skilled and skilled workers has boomed
(since the majority of labour is unskilled, this has led to high structural unemployment
rates in South Africa). Moreover, loss of social support networks (as well as traditional
family support) in such situations results in migrants depending on exploitative patrons,
such as mastaans in urban Bangladesh, who function as intermediaries between the
vulnerable and more formal institutions, charging rent for access to employment, housing
and services, security and high interest rates on loans, which in the long-term deny
migrants their independence and rights (Wood, 2003).
(iv) Brain drain
A more difficult dimension of migration leading to an extension of poverty relates to the
loss of innovative and educated community members - in essence, a ‘brain drain’,
particularly at the village level. According to Skeldon (2003), it has, however, proven
singularly difficult to empirically demonstrate a fall in either agricultural production or
productivity upon rural-to-urban migration at the village level. Much of the difficulty is
derived from the fact that a lot of migration may be circular in nature. Both educated and
non-educated workers moving from the village to town either return at a later stage or
move to extend the resource base of their families, by incorporating new resources
elsewhere.
3.4.2. Economic characteristics and poverty
The focal point of this section will be on examining the effect that the overall economy
can have on poverty and the poor. The two important phenomena that will form the basis
55 Within those sectors, the skill demands for the remaining jobs have been climbing.

69
for this discussion on the relationship between poverty and the state of the economy are
stagnant economic growth and high inflation rates.
3.4.2.1. Stagnant/shrinking economic growth and poverty
The theoretical relationship between shrinking/stagnant economic growth, measured by
decreased output per capita, and the number of people below the poverty line, is fairly
straightforward. As can be seen in Figure 3-2, it can be generally assumed that a decrease
in economic growth affects poverty through two main channels: output reduction and
domestic price increases or a higher inflation rate (the former will be elaborated on in the
following sub-section). The first one is called the unemployment effect of an economic
crisis: a fall in output reduces employment opportunity or creates a higher unemployment
rate, and thus increases the poverty rate, ceteris paribus. The rise in the poverty rate is
also expected, provided that everything else remains the same, to have a positive
correlation with the increase in domestic prices through the decline in real income - this
is the so-called real income effect. In support of this, most of the existing empirical
studies on the impact of stagnant/shrinking economic growth on poverty in developing
countries examined such impact through output fluctuation, though with different
methods of analysis or different models. For instance, with a vector auto-regression
technique, and by using annual data for the period 1981-1999 in Brazil, Agénor (2001)
examined whether or not output contractions have an asymmetric effect on poverty. The
result indicates that poverty responds asymmetrically to a drop in output, showing less
sensitivity when the economy is initially in a downturn.
Various arguments have been proposed to explain why this is usually the case
(Tambunan, 2005; Agénor, 2001; Neri & Thomas, 2000). The most important arguments
are the following ones. Firstly, the poor often lack the means to protect themselves when
an economy experiences a recession. They lack assets (such as bank deposits and land)
and often have no direct access to credit markets (or face prohibitive borrowing costs
when they do), in order to soften the impact of a recession. Secondly, due to their lack of
education and skills, the poor tend to be less mobile (across sectors and regions) than

70
better-educated workers, and are therefore often unable to switch jobs and capitalise on
available employment opportunities. Thirdly, indirect sources of income and public
transfers may decline during crises, because during such episodes, the ability of relatives
(or communities) to engage in income redistribution may be reduced, and governments
may be forced to drastically adjust their fiscal accounts with across-the-board cuts in
expenditure.
Figure 3-1: Conceptual framework: stagnant economic growth and poverty
Output Employment
Stagnant economic Poverty
growth
Domestic Real Income
Prices
Source: Modified from Tambunan (2005)
3.4.2.2. Inflation and poverty
“Given the extent to which the vast majority of households rely on the
market for their purchase of key commodities including food, inflation is
clearly an issue of relevance to poor and non-poor alike” (McKay &
Sowa, 2004: 16).
In the literature, inflation (i.e. an increase in the general level of prices for basic goods) is
often viewed as a type of tax, and one that has a more severe effect on the poor than the
rich. The essential a priori argument is that the rich are better able to protect themselves
against, or benefit from, the effects of inflation than are the poor. In particular, the rich
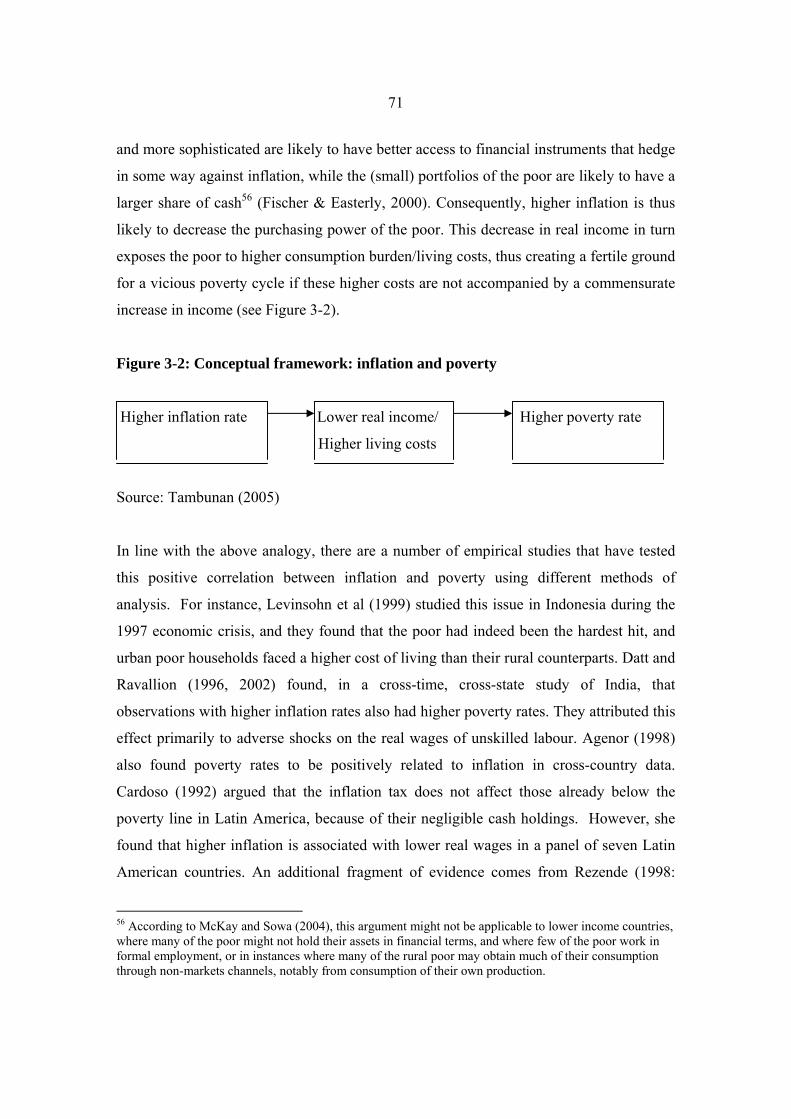
71
and more sophisticated are likely to have better access to financial instruments that hedge
in some way against inflation, while the (small) portfolios of the poor are likely to have a
larger share of cash56 (Fischer & Easterly, 2000). Consequently, higher inflation is thus
likely to decrease the purchasing power of the poor. This decrease in real income in turn
exposes the poor to higher consumption burden/living costs, thus creating a fertile ground
for a vicious poverty cycle if these higher costs are not accompanied by a commensurate
increase in income (see Figure 3-2).
Figure 3-2: Conceptual framework: inflation and poverty
Higher inflation rate Lower real income/ Higher poverty rate
Higher living costs
Source: Tambunan (2005)
In line with the above analogy, there are a number of empirical studies that have tested
this positive correlation between inflation and poverty using different methods of
analysis. For instance, Levinsohn et al (1999) studied this issue in Indonesia during the
1997 economic crisis, and they found that the poor had indeed been the hardest hit, and
urban poor households faced a higher cost of living than their rural counterparts. Datt and
Ravallion (1996, 2002) found, in a cross-time, cross-state study of India, that
observations with higher inflation rates also had higher poverty rates. They attributed this
effect primarily to adverse shocks on the real wages of unskilled labour. Agenor (1998)
also found poverty rates to be positively related to inflation in cross-country data.
Cardoso (1992) argued that the inflation tax does not affect those already below the
poverty line in Latin America, because of their negligible cash holdings. However, she
found that higher inflation is associated with lower real wages in a panel of seven Latin
American countries. An additional fragment of evidence comes from Rezende (1998:
56 According to McKay and Sowa (2004), this argument might not be applicable to lower income countries, where many of the poor might not hold their assets in financial terms, and where few of the poor work in formal employment, or in instances where many of the rural poor may obtain much of their consumption through non-markets channels, notably from consumption of their own production.

72
568), who points out that the gini-coefficient in Brazil increased steadily with rising
inflation in the 1980s, and then declined with the successful inflation stabilisation during
the period 1994-1996. Epaulard (2003) also indicates that a high rate of inflation (above
80%) is associated with higher elasticity of the poverty rate in any economic downturn.
3.4.3. Social characteristics
At a national level, there are copious social ills or characteristics that are associated with
poverty. These include, inter alia, high population growth and high levels of inequality.
This section will attempt to describe how these macro level characteristics can cause or
aggravate poverty.
3.4.3.1. Rapid population growth and poverty
Population growth per se is not a problem if the resources are available (or, even better, if
it is accompanied by a commensurate increase in resources) to cope with the additional
people requiring public services, employment, housing and so on. However, in a country
such as South Africa, where the budget is already stretched and where there are high
levels of poverty, population growth becomes an issue because not only does it
exacerbate poverty, but it makes it harder for the government to address it. Based on this
reality, it would be useful to discuss the link between poverty and population growth.
3.4.3.1.1. Rapid population growth-poverty link
The links between rapid population growth and persistent poverty have been well
established (Eastwood & Lipton, 1999, 2001; Pernia & Quibria, 1999; Orbeta, 2002;
Lipton & Ravallion, 1995; Balisacan, Mapa & Tubianosa, 2004). Rapid population
growth – of 2% or higher per year (Pernia & Associates, 2004) – hinders development for
two interrelated reasons. Firstly, because it reduces growth in per capita incomes and thus
savings, it reduces the funds available for investment in productive capacity. This under-
investment, in turn, reduces overall economic growth and prospects for poverty reduction

73
(Coale & Hoover, 1958; Birdsall, 1988). Secondly, at the aggregate level, rapid growth of
a population increases the availability of labour in an economy, relative to land and
physical capital (Birdsall & Griffin, 1993; Bloom, Canning & Sevilla, 2003). As has
been indicated in a number of studies57, this results in a relative decline in the wages of
labour, particularly those of unskilled labour, if they are members of a large cohort. This
is likely to worsen inequality and hurt the poor, who are more reliant on labour income.
Moreover, rapid population growth, more often than not, outpaces the capacity of
industries (particularly those that employ unskilled labour, i.e. the mining sector, the
manufacturing sector and so on) to absorb new labour, thus compounding unemployment
and underemployment. In 2003, the Philippine economy generated 566,000 new jobs, of
which 60% were in the services sector. Despite this job creation, unemployment levels
rose because the job market was inundated with 624,000 new entrants (ADB, 2004).
Similarly, between the years 1995 and 2002, the number of jobs generated by the South
African economy increased by only 1 600 633 (16.75%), compared to an increase of 5
005 647 (37.24%) in the number of people of working age58 (StatsSA, 1995, 2002).
In support of the above exposition, there are a number of empirical studies that have
found an inverse relationship between rapid population growth and poverty. For example,
de Dios et al (1993) identified high population growth as one of the reasons for poverty in
the Philippines. They argued that high population growth aggravates poverty, as it
disproportionately affects the poor, who tend to have larger families. Eastwood and
Lipton (1999) showed in their study that high fertility not only retards economic growth,
but also skews the distribution of income against the poor. Bloom, Canning and Malaney
(2000) illustrated how demographic transition can have an impact on poverty via
economic growth, concluding that the demographic structure of East Asia – slower
57 For example, Behrman and Birdsall (1988) show this with regard to males in Brazil. 58 According to Abedian (2004), this rapid growth of the labour force in South Africa can be attributed to two main factors: (i) Firstly, the number of women in employment has increased by one third, and those seeking employment has also risen. (ii) Furthermore, education and the extension of urban services have contributed to a demographic shift away from rural areas, again resulting in more job-seekers.

74
population growth and a higher ratio of working age people59 – was responsible for about
a third of the region’s increase in income per head.
3.4.3.2. Inequality and poverty
It is generally believed that when inequality increases (if other things are kept constant),
poverty increases as well, thus dampening the beneficial effect of economic growth on
poverty (Bautista, 1999; Paci, Sasin & Verbeek, 2004). This general consensus is based
on the belief that in an economy where inequality is persistently low, the poor will
naturally tend to obtain a higher share of the gains from growth than in an economy in
which inequality is high (Ravallion & Datt, 1999). Hence, the same rate of economic
growth might be less effective in reducing poverty in one setting than in another. In
essence, therefore, as Whiteford and McGrath (1994) illustrated in their study on
“Distribution of Income in South Africa”, where inequality is high, the rich usually
become richer and the poor become poorer, thus further increasing the gap between the
rich and the poor.
Empirical evidence from a number of studies that have been conducted with regard to this
issue substantiates the above view. For example, in the 1990s, Bangladesh experienced
an average annual growth rate more than twice that of Ghana, yet the poor in Ghana saw
their incomes rise substantially more than the incomes of the poor in Bangladesh (see
Figure 3-3). While Senegal and Burkina Faso experienced the same average rate of
annual growth between 1995 and 2002, the different rates of poverty reduction were such
that it would take Senegal 28 years to halve poverty, while it would take Burkina Faso 40
years to achieve the same goal (Lucas & Timmer, 2005). In another study by Deolalikar
(2000), in which provincial data from Thailand was used, it is suggested that, while
economic growth has a strong positive effect on poverty reduction, income inequality has
a sharply negative effect.
59 If the ratio of the non-economically active population is higher than that of the working age population, pressure is put on government at the macro level to provide for these dependents. This leads to resources being diluted, thus lowering economic growth which is essential for poverty reduction.

75
Figure 3-3: Growth and poverty reduction
Source: World Bank (2000/2001), cited in Lucas and Timmer (2005)
3.4.3.3. Public corruption60 and poverty
There are a number of channels through which corruption causes poverty. These can be
broadly categorized into two groups, namely: - (i) economic factors and (ii) governance
factors.
(i) Economic factors
Corruption affects poverty by first impacting economic growth factors, which, in turn,
impact poverty levels (Chetwynd et al, 2003). Economic theory and empirical evidence
both demonstrate that there is a direct causal link between corruption and economic
growth (see, for example, Tanzi & Davodi, 1997; Mauro, 2002; Barro, 1996). Corruption
60 That is corruption in both the government and the market.

76
impedes economic growth by discouraging foreign and domestic investment, taxing and
dampening entrepreneurship, lowering the quality of public infrastructure, decreasing tax
revenues, diverting public talent into rent-seeking, and distorting the composition of
public expenditure.
In addition to limiting economic growth, there is evidence that corruption also
exacerbates income inequality; regression analysis has shown a positive correlation
between corruption and income inequality (see, for example, Gupta et al, 1998).
According to Chetwynd et al (2003), explanations for this link are that corruption distorts
the economy and the legal and policy frameworks allowing some to benefit more than
others; there is unfair distribution of government resources and services; corruption
reduces the progressivity of the tax system; corruption increases the inequality of factor
ownership; and lower income households (and businesses) pay a higher proportion of
their income in bribes than do middle or upper-income households.
As it has been demonstrated in the preceding sub-sections, economic growth and income
inequality are important because they link corruption to poverty. The absence of
economic growth (or negative growth) increases poverty. Inversely, an increase in GDP
produces an increase in the income of the poor. However, income distribution is an
important mediating factor because economic growth may not always benefit the poor.
(ii) Governance factors
Chetwynd et al (2003) assert that corruption also affects poverty by influencing
governance factors, which, in turn, impact poverty levels. In line with the view held by
the World Bank (2000/2001), they contend that corruption reduces governance capacity,
that is, it weakens political institutions and citizen participation and leads to lower quality
government services and infrastructure. The poor suffer disproportionately from reduced
public services. When health and basic education expenditures are given lower priority,
for example, in favour of capital-intensive programmes that offer more opportunities for
high-level rent taking, lower income groups lose services on which they depend. Also,

77
corruption is consistently correlated with higher school dropout rates and high levels of
infant mortality (see, for example, Gupta et al, 2000; Mauro, 2002).
3.5. Household or individual level characteristics and poverty
At a household or individual level, there are a variety of characteristics that are usually
associated with poverty (i.e. educational level, household size and structure, health, race,
sex, age and labour force status). As will be shown below, “disadvantages in any of these
attributes could lead to poverty, and thus, these individual economic handicaps are
rightfully considered causes of poverty” (Perlman, 1976: 152).
3.5.1. Demographic characteristics
At a household (or individual) level, demographic factors (i.e. household size with a high
dependency ratio; age structure; and the gender of the household head) usually play a
significant role in determining the poverty status, as measured by household consumption
per person, of the members therein. In fact, the inverse relationship between these
demographic factors and poverty is a common finding in the literature. Against this
background, it would be appropriate to provide a brief explanation of how these factors
are correlated with poverty.
3.5.1.1. A large household size with a high proportion of dependants
It is generally believed that larger households, particularly if they possess a high
proportion of dependants (that is, children under 15 years and adults of 65 years and
over), are more likely to be poor relative to smaller ones. This belief is based on the idea
that children and the elderly are a distinct threat to the financial security of a family
(Schiller, 1995). Additional children and the elderly do not only increase the need for
more income, but also limit the ability of parents (or other members who are in the work
force) to earn it. More children imply a greater demand for homemaker services such as
childcare, meal preparation, transportation and other household activities. The same goes

78
for the elderly, who can no longer participate in the labour force because of their age.
They also need to be given special attention, especially with regard to medical care. As
the burden of caring for these dependants grows, it becomes more difficult for the
economically active household members to supply their labour to the outside job market.
If they choose to pay someone else to provide these household services, they may find
that the net income from outside employment is too small, especially if the household has
a low or non-existent asset base. In a case where a household resides in a rural area,
where subsistence farming or a subsistence economy is predominant, the large household
size tends to increase competition for land resource use between food crops and cash
crops, which may be coupled with declining soil productivity. This may result in low
output, low household income and the perpetuation of poverty (Okurut et al, 2002).
In light of the aforementioned, the general belief that larger households (with a high
proportion of dependants) are more prone to poverty is plausible. In fact, there are a
number of empirical studies that show an inverse relationship between household size
and poverty. For example, the Cambodian CSES of 1993/94 shows that the poor tend to
live in larger households, with an average family size of 6.6 persons in the poorest
quintile, compared to 4.9 in the richest quintile (Kanbur et al, 2003). Okurut et al (2002)
also found that poor households in Uganda have bigger household sizes compared with
non-poor households. In Brazil, Fishlow (1972) reported that 29% of all families had 6 or
more members, and over half of such families fell below the poverty line. Similarly, for
Malaysia, Anand (1977) noted that the incidence of poverty rose with family size,
ranging from 24% in a household of one to 46% in households with ten or more people.
The World Development Report (World Bank, 1990) observed that in Pakistan in 1984,
the poorest 10% of households had an average of 7.7 members, while the corresponding
national average was 6.1. In a micro-level study of poverty in India, Dubey,
Gangopadhyay and Wadhwa (1999) found a significantly positive effect of household
size on the incidence of poverty.

79
3.5.1.2. Age of the household head and poverty
The well-being of the elderly, in this day and age, is largely a function of their
productivity and ability to save during their prime years of productivity. In light of this, it
is to be expected that poverty will increase amongst the elderly. This is because the
productivity of these individuals decreases, and they usually have few savings to
compensate for this loss of productivity and income. This is more likely to be the case in
developing countries such as South Africa, where savings are low, mainly because of low
income and a poor savings culture. However, the relationship between age and poverty
might not be linear, as it would be expected that incomes would be low at a relatively
young age61, increase during middle age, and then decrease again. Therefore, according
to life-cycle theories, one expects to find that poverty is relatively high at a young age,
decreases during middle age, and then increases again in old age62.
In light of this, it is understandable why it is a common finding in the literature that the
poor tend to live in households that are headed by either young people or the elderly. For
example, the Cambodian CSES of 1993/94 found that the poor tend to live in younger
households, with the bottom quintile having twice as many children under 15 per family
as the top quintile (Kanbur et al, 2003). In their study of the determinants of poverty in
Egypt, Datt and Jolliffe (1999) also found similar results. They found that household
living standards increase with the age of the head up to 62 years in rural areas and 74
years in urban areas, and decline thereafter63.
3.5.1.3. Gender of the household head and poverty
As is suggested in the literature (Buvinic & Gupta, 1997; Appleton, 1996; Agarwal,
1994; Bruce & Dwyer, 1988; Lipton & Ravallion, 1995), due to the fact that they 61 The young usually lack the required necessities, i.e. tertiary education, advanced skills and experience, to acquire well-paying jobs. 62 Perlman (1976) argues that, although there are obvious differences between the young and the old, these two extremes of the life-span share one common poverty-inducing characteristic: they are both non-working periods in life. 63 Datt and Jolliffe (1999) argue that these results in part reflect lifecycle phenomena such as higher earning capacity, with greater experience and smoothing of consumption over the lifecycle.

80
typically have less access to productive resources and assets such as land, credit,
financial, physical and human capital, women make up a majority of the world’s poor,
and South Africa is no exception in this regard. One of the main reasons why this
phenomenon is prevalent in South Africa lies in past apartheid policies, such as the
draconian ‘Urban Labor Preference Policy’ of the 1950’s, whereby most women in rural
areas often headed their respective households with a very limited asset base to rely on,
thus creating a fertile ground for these households to be trapped in poverty for protracted
periods of time64. Nowadays, issues such as the mortality of male heads, resulting from
Aids and high levels of unemployment65, perpetuate this phenomenon even further.
Against this background, it is only natural that female-headed households are often
suspected to be poorer than male-headed households (Folbre, 1991; Human Development
Report, 1995; United Nations, 1996; World Bank, 2001). As a matter of fact, in line with
this suspicion, evidence from studies that have been done pertaining to the profile of the
poor in South Africa suggests that the incidence of poverty is indeed higher in female-
headed households. For example, May’s 1998 Poverty and Inequality Report showed that
the poverty rate among female-headed households was 60%, while it was 31% among
male-headed households. Similar findings are found elsewhere. For example, in their
review of sixty-five household studies on headship and poverty in Africa, Asia and Latin
America, Buvinic and Gupta (1997) found female-headed households to be
disproportionately represented among the poor in 38 cases, with the greatest
concentration of over-representation occurring in Latin America during the eighties.66
3.5.2. Economic characteristics
Apart from income or consumption – which is typically used to define whether or not a
household is poor – there are a number of other economic characteristics that are
64 See section 3.3.1 with regard to how this policy affected these households economically. 65 See section 3.5.2.1 for an illustration of how unemployment impacts on the well-being of people in South Africa in general. 66 It is worth noting that female household heads are a heterogeneous group, which includes widows, divorced women, single women, abandoned women and women whose husbands have migrated in search of employment. Therefore, some women in this group are more susceptible to falling into poverty than others. Moreover, the percentage of women in each group differs across countries, cultures and regions of the world (Joshi, 2004).

81
associated with poverty, most notably household employment status, as well as other
productive assets owned by the household.
3.5.2.1. Lack of gainful employment opportunities and poverty
“While a situation of unemployment may be considered a problem in its
own right, it has been argued that the problem of unemployment lies most
particularly in its correlation with poverty…” (Dewar & Watson, 1981:
10).
Given that there are deficiencies in the asset base of the majority of individuals and
communities in South Africa67, as well as the fact that our country does not have (and
perhaps cannot afford) a comprehensive social security safety net for all its citizens
(Desai, 2005), one of the primary mechanisms through which the poor can insulate
themselves from being affected by the adversities engendered by having inadequate
earnings is by participating in the labour market. This is because there is literally no way,
other than through crime and charity, to obtain the resources necessary to reproduce life
for most South Africans, other than to sell their labour. However, labour force68
participation is not a guaranteed ticket out of poverty (Schiller, 2001). In fact, the reality
is that millions of South Africans who do participate in the job market usually fail to
elude poverty, and the two principal reasons for this are unemployment and
underemployment. In light of this, it would thus be worthwhile to discuss the
relationship between an individual’s and household’s poverty status and their
unemployment/underemployment status.
3.5.2.1.1. The unemployment-poverty link
Loss of employment or failure to obtain employment usually reduces income and
consumption. In most cases, this reduction means foregoing in some measure the bare
67 See section 3.3.1. 68 The labour force basically consists of persons who are working or looking for work: it incorporates the employed and the unemployed (Gunderson & Riddell, 1988).
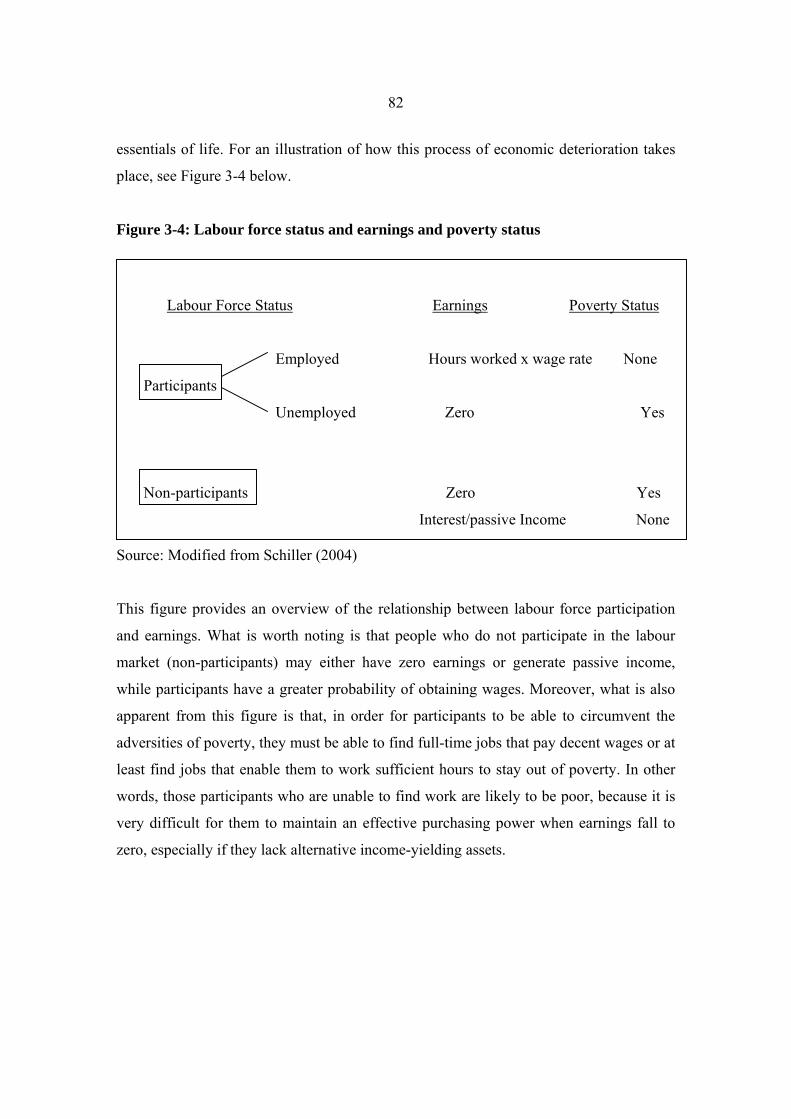
82
essentials of life. For an illustration of how this process of economic deterioration takes
place, see Figure 3-4 below.
Figure 3-4: Labour force status and earnings and poverty status
Labour Force Status Earnings Poverty Status
Employed Hours worked x wage rate None
Participants
Unemployed Zero Yes
Non-participants Zero Yes
Interest/passive Income None Source: Modified from Schiller (2004)
This figure provides an overview of the relationship between labour force participation
and earnings. What is worth noting is that people who do not participate in the labour
market (non-participants) may either have zero earnings or generate passive income,
while participants have a greater probability of obtaining wages. Moreover, what is also
apparent from this figure is that, in order for participants to be able to circumvent the
adversities of poverty, they must be able to find full-time jobs that pay decent wages or at
least find jobs that enable them to work sufficient hours to stay out of poverty. In other
words, those participants who are unable to find work are likely to be poor, because it is
very difficult for them to maintain an effective purchasing power when earnings fall to
zero, especially if they lack alternative income-yielding assets.

83
Table 3-4: Unemployment by race, gender and location (%) Unemployment rates Ultra-poor Poor Non-poor All
(Broad) unemployment rates by:
Race
African
Coloured
Indian
White
59.4
46.1
52.7
36.7
67.5
75.0
24.5
17.0
12.8
4.5
36.9
21.8
13.7
4.7
Gender
Female Male
65.9
51.6
59.1
44.0
25.3
12.9
37.4
22.4
Location
Rural
Urban
56.3
65.7
48.8
57.5
22.4
16.8
36.7
24.0
Total broad unemployment rate 58.7 51.5 18.4 29.3
Total narrow unemployment rate 34.9 30.6 11.0 16.4
Labour force participation rate
Share of working adults aged 16-
64
43.4
17.7
45.8
21.9
61.6
48.3
55.3
37.9
Source: Woolard (2002)
In support of the above analogy, there are a number of empirical studies that show that
the incidence of poverty tends to be more severe amongst households with unemployed
members than those with employed members. A case in point in this regard can be taken
from the working paper that was prepared for DFID (S.A) by Dr Ingrid Woolard in July
2002. In this paper, when using 1999 OHS data, Woolard revealed that, as is depicted in
Table 3-4, the unemployment rate among those from poor households was 52%, in
comparison with an overall national rate of 29%. In addition, labour force participation
was lower in poor than non-poor households. More than half of the working-age poor (or
about 5 million adults) were outside of the labour market. As a result, the percentage of
working age individuals from households below the poverty line who were actually
working was significantly lower than average. Only 24% of poor adults (about 2 million
people) were employed, compared with 49% (or 8 million) from non-poor households.

84
It should be noted, however, that being unemployed does not necessarily mean that a
person is poor. In fact, frictional or temporary unemployment of up to 3% or 4% of the
labour force is considered a normal occurrence9. However, when a person who is the
breadwinner of a family fails to find a job in the short-term, unemployment is likely to be
an important determinant of poverty in his/her household.
3.5.2.1.2. Underemployment-poverty link
In view of the fact that in most economic systems, workers are paid in relation to the
value of their contribution to the output of the employer or purchaser, the underemployed
are likely to receive low earnings. Unfortunately, these low earnings are usually not
enough for the underemployed to elude poverty. This is especially so because the
earnings for the underemployed are usually inadequate to cover not only immediate
needs, but also for lengthening non-work periods in the lifecycle. Moreover, the fact that
the underemployed are usually epitomised by illiteracy, lack of experience, lack of
advanced skills, relegation to geographically handicapped areas and so on, frequently
thwarts their chances of acquiring better-paying jobs.
3.5.2.2. Inadequate access to productive assets and markets and poverty
Against the background that the basic, rational understanding of the roots of poverty is
usually built on the concept of assets and the return on these assets (see section 3.3), it is
only natural to suspect that many of the poor, particularly those that reside in rural areas,
are in that state because they lack access to productive resources, including land, human,
physical and financial capital needed to undertake high-return production strategies.
However, having access to such resources does sometimes not guarantee high or gainful
returns. This is attributed to the fact that the returns on these assets are largely dependent
on, inter alia, access to markets, whereby outputs from production can be traded. 9 Millions of job searchers could be ex-students who are looking for their first job or they could be middle-class women returning to the labor market after their kids have entered school. Moreover, some people quit their jobs and then look for something better. In such circumstances, unemployment may not be accompanied by economic hardship, much less poverty, more especially if other family members are working.

85
Unfortunately, smallholder/emerging farmers, particularly on the African continent,
usually face limited access to markets for their outputs69, and are often relegated to the
margins and outside the formal sector of the economy (hence poverty is prevalent in the
former homelands). The results are high transaction costs, low returns on productive
resources and increased vulnerability, which can easily translate into poverty if
circumstances allow.
3.5.3. Social characteristics
Aside from demographic and economic indicators, several social indicators are associated
with poverty and household living standards. The most widely used ones are measures of
health, HIV/AIDS, education and shelter. In the following sub-sections, an examination
of how these relate to poverty will be conducted.
3.5.3.1. Ill-health and poverty
Ill-health can cause poverty through three major channels: (i) loss of production by sick
individuals, (ii) financial cost of healthcare, and (iii) the opportunity cost of caring for the
sick.
(i) Loss of production by sick individuals. Poor health can impair labour
participation, which can, in turn, disrupt people’s income-generating
capabilities. The idea is that those who are suffering from malnutrition (i.e.
one of the health indicators) often feel weak and lacking in energy, and are
more susceptible to infection and other illnesses than those who receive the
minimum dietary energy requirements (Dasgupta, 1993; Chowdhury and
69 According to Oluoch-Kosura et al (2004), this is usually the result of the existence of rudimentary market systems, which are unable to provide the requisite stimuli for the evolution of commercially oriented smallholder production systems beyond the narrow and subsistence-based strategies currently characterising many rural areas in most developing countries, particularly those found on the African continent. Another reason could be that most smallholder farmers, particularly in Africa, find it very difficult to compete with farmers in developed economies, particularly those in the United States. This is due to the fact that most farmers in these countries receive substantial subsidies from their respective governments, which then enables them to price their goods lower, relative to farmers in other developing countries. This in turn makes it almost impossible for smallholder farmers to compete with them successfully in gaining a market share in large markets such as Europe.

86
Chen, 1977). In line with this view, the daily wage rates in Cote d’Ivoire have
been estimated to be about 19% lower among men whose health status makes
them likely to lose a day of work per month because of illness than daily wage
rates of healthier men (World Bank, 1993). Strauss and Thomas (1998) also
provided a thorough review of the relationship between nutrition, productivity
and wages, and they concluded that there does appear to be a causal
relationship between health and productivity. Furthermore, the literature also
suggests that nutrient deficiencies, particularly in childhood, can retard
physical and cognitive development, and often undermine schooling due to
absenteeism and early dropouts (see section 3.6.3.2 for an illustration of how
poor education can lead to poverty). For instance, in a review of the literature
examining the impact of poor nutrition on the development of the brain, Lewis
et al (1986) and Politt (1997, 2001) concluded that most studies point to
certain key nutrients, such as iron and Vitamin A, as being vital for cognitive
development. Similarly, in a study of Tanzanian schoolchildren, Bhargava and
Yu (1997) found that nutritional status was a significant predictor of
educational test results.
(ii) Financial cost of healthcare. Households (or members thereof) cope with
illness in different ways. How they cope is a function of the opportunities
afforded to them by their capabilities and asset stores, relative to the medical
costs of the illness. Moreover, their ability to cope is also mediated by a
number of household characteristics, including the dependency ratio.
Therefore, against the background that most near-poor households in
developing countries such as South Africa have a depleted asset base and are
largely dependent upon returns from their labour, a decline in real wages of
working household members (induced by lower productivity) may hinder the
ability of these members to better manage the health costs of that illness, thus
exposing the particular household to destitution. In addition, since the affected
households usually dispose of productive assets such as cattle or land as a way
of coping, the tendency is for such households to be unable to recover. As a
result, they usually collapse and thus fall into poverty (Human Development
87
Report, 2003). As a matter of fact, studies in East Asia have shown that 50%
of financial crises in poor families are triggered by catastrophic illnesses
including TB, HIV and severe malaria (World Bank, 1997).
(iii) The opportunity cost of caring for the ill. The third cost element is more
indirect in nature. It has to do with the choice that household members,
particularly women, have to make with regard to their allocation of time
between production (Leslie, 1992; Taylor et al, 1996), meeting the
household’s needs, childcare and care of the ill. This affects the resources of
near-poor households, thus causing a shortage in one area or the other.
3.5.3.2. HIV/AIDS and poverty
The HIV/AIDS pandemic is no longer only a symptom of poverty, but it has also
emerged as one of the most obvious causes of poverty in recent times, particularly in
developing countries such as South Africa. Substantively, many studies in South and
Southern Africa have clearly demonstrated that HIV/AIDS contributes to a rise in poverty
(see, for example, Loewenson & Whiteside, 2001). This is largely attributed to the fact
that this phenomenon is a major cause of ill-health (Tumwesigye, 2003). Moreover, it is
costly because many of the opportunistic infections associated with AIDS (TB,
pneumonia, and others) are expensive to treat. As such, it has not only caused many
people in the developing world to be unable to contribute productively to their
households’ livelihoods, but many of the infected have become a drain on their families’
financial resources. Moreover, thousands have died as a result of this phenomenon70,
thereby imposing crushing shocks and stresses on the livelihoods of those remaining
behind. In fact, many households have ceased to exist because of AIDS deaths (Turner,
2005). Those affected households that struggle on, often headed by old people or
orphans71, typically suffer poverty because they are usually epitomised by insufficient
capacity to generate meaningful income.
70 In 2006, an estimated 350 000 South Africans died of HIV/AIDS (Media club, 2007). 71 In 2006, it was estimated that South Africa has more 1 000 000 orphans (Media Club, 2007).

88
Duraisamy et al’s (2003) study is one of the best cases in point that can be utilised to
buttress the foregoing analogy. They found that medical treatment expenditures
constituted a significant economic burden for a sample of affected households in south
India, with roughly 40-70% of AIDS-related expenditures being financed by borrowing.
Similarly, studies of AIDS-affected households (most of them near-poor or already poor)
in African countries such as South Africa and Zambia show that their monthly income
fell by 66%-80% because of coping with AIDS-related illness (UNAIDS, 2004). In a
recent study of 700 South African households affected by HIV/AIDS, more than half of
the affected families did not have enough food to stave off starvation. Two-thirds of the
households reported a loss of income as a result of the disease and larger proportions of
household income being spent on healthcare and funerals72.
3.5.3.3. Inadequate access to education
According to human capital theorists73, investment in education creates skills and
credentials, which facilitate higher productivity that, in turn, increases the probability of
obtaining higher future earnings amongst those who possess them, in comparison with
those who do not. In fact, there is a strong and empirically verifiable positive relationship
across most societies between the wages and salaries (or expenditures) people receive at
work and the level of education which they have attained. For example, during the year
of 1992 in Uganda, secondary school completers earned an average of 89% more from
wage employment than primary completers did. University graduates earned five times as
much as primary completers (Appleton, 2001a). In Venezuela, during the year of 1989,
the age (i.e. 40 years) earning profiles by educational level was as follows: university
graduates earned four times more than those who were illiterate, high school completers
earned 55% more than their illiterate counterparts, and primary school completers earned
30% more than those who were illiterate (Psacharopoulos, 1995). In South Africa, a
similar pattern was evident in 1995. On average, university graduates earned six times
72 Research conducted by the Kaiser Family Foundation in 2002, cited in the Human Development Report, 2003. 73 The foremost exponents of this theory include Becker (1975), Schultz (1960 and 1963) and Mincer (1958 and 1974).

89
more than those with no education, matric completers earned four times more than
illiterates, high school dropouts earned two times more than illiterates, and primary
school completers earned about 10% more than those with no education (Ngwane, 2001).
Furthermore, numerous development analysts (e.g. Kothari, 1993; Nafziger, 1997) argue
that the acquisition of education greatly increases a person’s skills and capacity to enter
the employment market. Hence, there is a positive relationship between educational
attainment and employment in South Africa (see Table 3-5).
Table 3-5: Unemployment rates by educational level (1995 & 2002)
Educational level/year 1995 2002
No schooling 33.12 32.30
Primary 35.49 41.38
Incomplete secondary 33.85 48.39
Matric 25.28 39.51
Tertiary 6.44 15.37
Total 29.24 39.51
Source: StatsSA (1995, 2002)
In light of this, it would thus be safe to assume that the uneducated (and least educated)
are likely to be susceptible to poverty. Significantly, according to Woolard (2002), in
South Africa in 1998, 58% of adults with no education were poor; 53% of adults with
less than seven years (primary) education are poor; 34% percent of adults with
incomplete secondary schooling are poor; 15% of adults who have completed secondary
school are poor; and only 5% of adults with tertiary education are poor (see Figure 3-5).

90
Figure 3-5: Poverty rates by average educational attainment of adult household
members74
Source: Woolard (2002)
3.5.3.4. Inadequate access to decent shelter
Inadequate access to decent shelter by households may cause them to be unable to exploit
the economic benefits that are associated with this productive asset (see section 5.6), thus
making them vulnerable to a myriad of adversities which could lead to poverty.
Furthermore, homelessness can lead to malnutrition and exposure to infectious diseases
such as flu, which could compromise the earning potential of working household
members as a result of lower productivity (see section 3.5.3.1). However, as is argued by
Mullahy and Wolfe (2000), what may contribute most to the ill health of the homeless is
the fact that being homeless renders treatment for illness difficult. Without a permanent
residence, it is difficult for the homeless to be contacted or followed up on, and living on
the street or in a shelter is not conducive to rest and recuperation. Even adhering to a
medication regimen may be difficult when there is nowhere to store the medication.
74 The author extracted these figures from the 1998 IES and OHS surveys.

91
3.6. Conclusion
A clear understanding of why some people are poor is essential if any in-roads are to be
made towards (effectively) tackling the roots and causes of poverty. This chapter has
discussed the theoretical as well as empirical determinants of poverty that are relevant to
the South African context. However, since a basic, rational understanding of the roots of
poverty is based on the concept of assets and the return on them, historical factors were
also taken into account. This is because the asset base of the majority was largely
retarded through colonisation and apartheid polices, which were orchestrated to
disempower Blacks, particularly in economic terms. In essence, this discussion has
attempted to determine why this country is characterised by high levels of (Black)
poverty.
In summary, this chapter has shown that colonisation, in general, had a negative effect on
indigenous people, especially in economic terms. It entailed, among other things,
stripping people of their assets, especially land, and distorting economic markets (and
social institutions), all which were a cornerstone to the livelihoods of these indigenous
groups. This was further exacerbated by the introduction of apartheid policies. At the
heart of these apartheid policies, there was a subtle premise of multi-faceted
discrimination against non-Whites, especially Africans. According to the ideology of
apartheid, each race was to be kept apart, and each was to develop separately. This
segregation tactic was then, in turn, utilised to target development efforts at high-income
White urban enclaves, thereby neglecting the majority of the Black population.
Moreover, these policies were designed in such a way that they would have the potential
of ensuring that the majority of the people would still be oppressed, especially in
financial terms, even if the old regime were to be done away with. This was expressed
and executed in a number of ways. For instance, these policies entailed the retention of
economic power and privilege in White hands. Furthermore, the apartheid regime
introduced the ‘Bantu’ education policy, which was extremely poor in quality and
ensured the concentration of skills in White hands, and left Blacks largely unskilled. This

92
resulted in the shortage of skilled labour in certain sectors of the South African economy,
and ensured that Blacks were the source of cheap labour in general. The policy of
employment segregation also meant that Blacks could only occupy certain types of jobs.
With the benefit of hindsight, it was thus inevitable that one of the dominant themes of
the apartheid legacy would be that high levels of (Black) poverty and inequality would
characterise the country for many generations to come.
Against this backdrop, a number of key causes or at least correlates of poverty have been
discussed. It turns out that these causes can be divided into two categories. Firstly, they
can be grouped according to the channels through which they affect poverty levels:
economic (economic growth, inflation, globalisation, unemployment and
underemployment, inadequate access to productive assets and markets); social (rapid
population growth, inequality, public corruption, inadequate access to shelter, education,
HIV/AIDS and health); demographic (household size, age and gender of the household
head); and environmental/situational (natural disasters, rural location, migration).
Secondly, they can be classified according to the level (i.e. global, macro and micro) at
which they can be affected by the various policies.

93
Chapter Four
International Best Practices
4.1. Introduction
Few problems have proven to be more intractable, for world leaders, development
scientists (at the global as well as national levels) and policymakers alike, than that of
poverty. Despite the fact that poverty elimination (or at least reduction) has taken the
centre stage in the development rhetoric, the share of the developing country population
living below the international poverty line, colloquially known as $1 per day at 1993
PPP, still remains at unacceptable levels. Reports for the most recent year, 2002, put this
share below this line at about 21.7% (about one fifth of the world’s population, assuming
that nobody lives below the $1 per day in developed countries) (Chen & Ravallion, 2004;
Global Monitoring Report, 2006). This means that the decline (a fall of 6.6% from 28.3%
in 1981) in the incidence thereof has actually been very modest over the past 20 years or
so (between 1981 and 2002, to be exact). Table 4-1 depicts the global progress in this
regard.
What is evident from what is illustrated in Table 4-1 is that progress towards reducing
poverty has not been uniform across the different regions. At one extreme, the East Asian
and Pacific region has been extremely successful in tackling poverty, although this
achievement also looked rather fragile during the economic crisis of the late 1990s. The
total number of people who were pulled out of extreme poverty in this region since 1981
is more than 500 million. Similarly, the South Asian region has also experienced great
success in reducing poverty, although not to the same extent as the East Asian region, due
to rapid population growth. This region managed to reduce its poverty rate from 51.5% in
1981 to 31.2% in 2002, thereby pulling a total of about 43 million of the number of
people there out of poverty. It is noteworthy, however, that in spite of the impressive
performance by these two regions, in 2002, the poverty incidence in both of these regions
still remained (with the exception of that of the Sub-Saharan region) relatively high (see
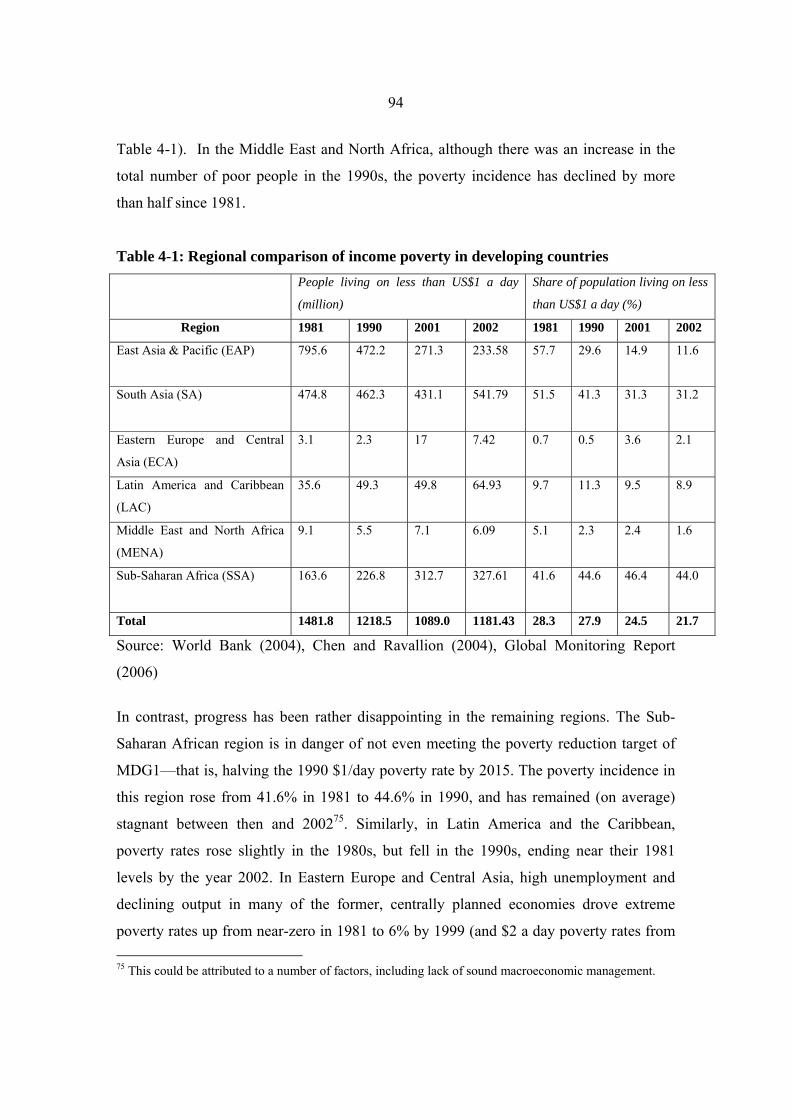
94
Table 4-1). In the Middle East and North Africa, although there was an increase in the
total number of poor people in the 1990s, the poverty incidence has declined by more
than half since 1981.
Table 4-1: Regional comparison of income poverty in developing countries People living on less than US$1 a day
(million)
Share of population living on less
than US$1 a day (%)
Region 1981 1990 2001 2002 1981 1990 2001 2002
East Asia & Pacific (EAP) 795.6 472.2 271.3 233.58 57.7 29.6 14.9 11.6
South Asia (SA) 474.8 462.3 431.1 541.79 51.5 41.3
31.3 31.2
Eastern Europe and Central
Asia (ECA)
3.1 2.3 17 7.42 0.7 0.5 3.6 2.1
Latin America and Caribbean
(LAC)
35.6 49.3 49.8 64.93 9.7 11.3 9.5 8.9
Middle East and North Africa
(MENA)
9.1 5.5 7.1 6.09 5.1 2.3 2.4 1.6
Sub-Saharan Africa (SSA) 163.6 226.8 312.7 327.61 41.6
44.6 46.4 44.0
Total 1481.8 1218.5 1089.0 1181.43 28.3 27.9 24.5 21.7
Source: World Bank (2004), Chen and Ravallion (2004), Global Monitoring Report
(2006)
In contrast, progress has been rather disappointing in the remaining regions. The Sub-
Saharan African region is in danger of not even meeting the poverty reduction target of
MDG1—that is, halving the 1990 $1/day poverty rate by 2015. The poverty incidence in
this region rose from 41.6% in 1981 to 44.6% in 1990, and has remained (on average)
stagnant between then and 200275. Similarly, in Latin America and the Caribbean,
poverty rates rose slightly in the 1980s, but fell in the 1990s, ending near their 1981
levels by the year 2002. In Eastern Europe and Central Asia, high unemployment and
declining output in many of the former, centrally planned economies drove extreme
poverty rates up from near-zero in 1981 to 6% by 1999 (and $2 a day poverty rates from 75 This could be attributed to a number of factors, including lack of sound macroeconomic management.

95
2% to 24%). However, poverty rates in this region have since declined, ending at 2.1%
by the year 2002. Nevertheless, it is worth mentioning that, in spite of the fact that the
poverty incidence has increased in these last two regions, in 2002, it still remained (with
the exception of that of the Middle East and North African region) relatively low.
In view of the fact that progress towards poverty reduction has varied across the different
regions, general wisdom would suggest that the same could be assumed about the
progress made by individual countries within and across these respective regions. Not
surprisingly, economies that have done extremely well with regard to poverty reduction
are mostly found in the East Asian and Pacific region. These include, inter alia, China
and Vietnam, both of which have managed to reduce their poverty incidence by more
than half since the 1980s. Apart from the poverty reduction success that is apparent in
most East Asian economies, there are a number of other success stories that can be found
elsewhere, including in regions that have achieved little or no progress in this regard.
Uganda is one such example76. Although this country is situated in a region, i.e. Sub-
Saharan Africa, with the highest poverty incidence of 44.0% in 2002 (see Table 4-1), it
has managed to reverse its poverty rate from 56% in 1992 to 35.2% in 1999/2000—
although this rapid rate of poverty reduction has slowed down somewhat in recent years
(see Table 4-8).
In light of the fact that the poverty reduction rate varies across different countries, it is
only natural to ask the question: ‘why have some economies performed better than others
in tackling (absolute) poverty’? The rationale for asking this question is based on the
belief that a key ingredient to sound poverty reduction policymaking may lie in
understanding why success in this regard has been uneven across different economies.
Moreover, such an understanding can enable South African policy authorities to learn
valuable lessons, which they can, in turn, incorporate into their existing poverty reduction
strategies.
76 Uganda’s success in poverty reduction is largely attributed to its ability to grow the economy (through a series of economic and institutional reforms) at a rapid rate. Most importantly, this growth filtered down to the poor (see section 4.3.3).

96
Table 4-2: Reasons for choosing to examine poverty reduction in China, Vietnam
and Uganda China Vietnam Uganda
(i) Due to the fact that it is a country,
which is highly populated, progress
(pertaining to poverty reduction)
translates into significant poverty
reduction at a global level.
(ii) It has managed to grow its
economy at a rate of 8-9% since the
late 1970s.
(iii) The economic growth in the
country has trickled down to the
poor, thereby lifting over 500 million
people out of poverty.
(iv) It has managed to significantly
improve its key socio-economic
indicators, especially in the areas of
health and education.
(v) Like South Africa, poverty is
mainly concentrated in rural areas
that have poor infrastructure,
agricultural land, etc. (see chapter 5)
(i) It has managed to overcome the
negative effects of a war that lasted
for 30 years by being able to achieve
price stability and an annual
economic growth rate of 7-8%
between 1993 and 2004.
(ii) Moreover, as a result of this
growth, it has managed to reduce its
poverty levels from 58.1% in 1993 to
19.5% in 2004.
(iii) It has also managed to invest in
other key developments that have
benefited the poor, including
infrastructure development in rural
areas, electrification, access to
education and health, better water
supply, irrigation for poor farmers,
access to telecommunication, and so
on.
(v) Like South Africa, poverty is
mainly concentrated in rural areas
that have poor infrastructure,
agricultural land, etc.
(i) Although it is a landlocked
country, its economy performed
better than that of most other
countries in the SSA, including South
Africa. Long-term growth from 1982
to 1999 was 5.2% per annum, and
this accelerated to 6.9% per annum in
the 1990s.
(ii) In spite of the fact that it is
situated in a region with the highest
poverty incidence, it has managed to
make a serious dent in its poverty
levels, as a result of this growth.
(iii) Moreover, among other things,
this country has managed to reduce
its HIV infection rates by half.
(iv) Poverty in this country is also
concentrated in rural areas that have
poor infrastructure, agricultural land,
etc., like South Africa.
Against this backdrop, this chapter therefore attempts to discuss some of the implemented
best practices with regard to poverty alleviation. In particular, the emphasis will be on
cases in which interventions hold particular relevance to the context of South Africa.
Correspondingly, poverty reduction strategies that have been implemented in China,
Vietnam and Uganda will be examined (the reasons for choosing to examine strategies
that have been adopted by these countries are outlined in Table 4-2 above). Once these
poverty reduction strategies have been examined, some general conclusions will be made
on how best to deal with absolute poverty. These conclusions will show that poverty can
be mainly influenced by policies that foster the following outcomes: (i) macroeconomic
stability, which engenders, inter alia, pro-poor economic growth and price stability; (ii)

97
the creation of economic opportunities for the poor; and (iii) the provision of social safety
nets that are targeted at the poor. However, since most of these policies, particularly those
that have to do with structural adjustments, stem from ideologies that are mainly
espoused by the Bretton Woods institutions, i.e. the World Bank and the International
Monetary Fund (IMF), this chapter will first briefly examine the theoretical
recommendations of the World Bank, as well as make mention of alternative solutions
that are advocated by other prominent institutions such as Oxfam, various church
organisations and the United Nations Economic Commission for Africa (UNECA). This
will be done for the purpose of highlighting common elements within these various
theoretical solutions.
In order to meet the objectives of this chapter, a variety of sources will be consulted. For
gaining insight into the theoretical recommendations that are made by the World Bank,
Oxfam and various churches, an extensive Internet search will be conducted.
Furthermore, a number of academic papers and handbooks will be looked at, with a view
to answering the question of exactly how China, Vietnam and Uganda have managed to
achieve relative success in terms of reducing poverty.
The remainder of this chapter is divided into three sections. Section two briefly discusses
the theoretical recommendations that are espoused by prominent institutions such as
Oxfam, various churches and the World Bank. The reasoning behind this stems from the
fact that the various anti-poverty strategies that are adopted by most developing countries
are, more often than not, based on these theoretical recommendations.
In order to identify anti-poverty strategies that have worked elsewhere, section three
focuses on implemented best practices. This section begins by reviewing various poverty
reduction strategies that have been implemented in China, Vietnam and Uganda.
Thereafter, common elements in these strategies are highlighted. These include the
following: (i) creating economic opportunities for the poor, (ii) good governance, i.e.
sound macroeconomic management that engenders macroeconomic stability, and (iii)
social programmes (i.e. social safety nets) that are targeted at the poor.
98
Section four concludes the chapter. In this section, a summary of both the theoretical
recommendations and implemented international best practices will be presented.
4.2. Theoretical recommendations on how best to reduce poverty77
As can be seen in Table 4-3, there are a myriad of theoretical recommendations that have
been put forth by different development and religious institutions. Oxfam, which usually
adopts a human rights-based approach to their work, proposes the following set of
interventions as measures to improve the livelihood of the poor (Oxfam, 2001):
• Creating (employment and business) opportunities for the poor within markets.
• Beefing up the assets of the poor by protecting the natural environment, since it is
necessary to achieving sustainable livelihoods; providing equitable healthcare and
education, so as to increase their productivity and, invariably, their income or
profits; caring and nurturing all children, in order to avoid, inter alia, malnutrition
among children, which could impact negatively on their long-term productivity if
not taken care of.
• Making globalisation work better for the poor and excluded people, by
establishing and implementing new, fair rules for global trade.
• Good governance: strengthening institutions intervening in markets in the
interests of the poor.
• Tackling (gender) inequalities.
• Creating Poverty Reduction Strategy Papers78 (PRSPs), which prioritise more
investment in health and education.
• Ensuring that the poor have food security.
77 Although these have evolved over the years, the discussion on the recommendations that are espoused by these development and religious institutions will be (with the exception of those of the World Bank) limited to the most recent ones. 78 That is, an initiative led by the World Bank and the IMF for countries seeking debt relief or concessional finance from the International Development Association or the Poverty Reduction Growth Facility (World Bank and IMF, 2002).
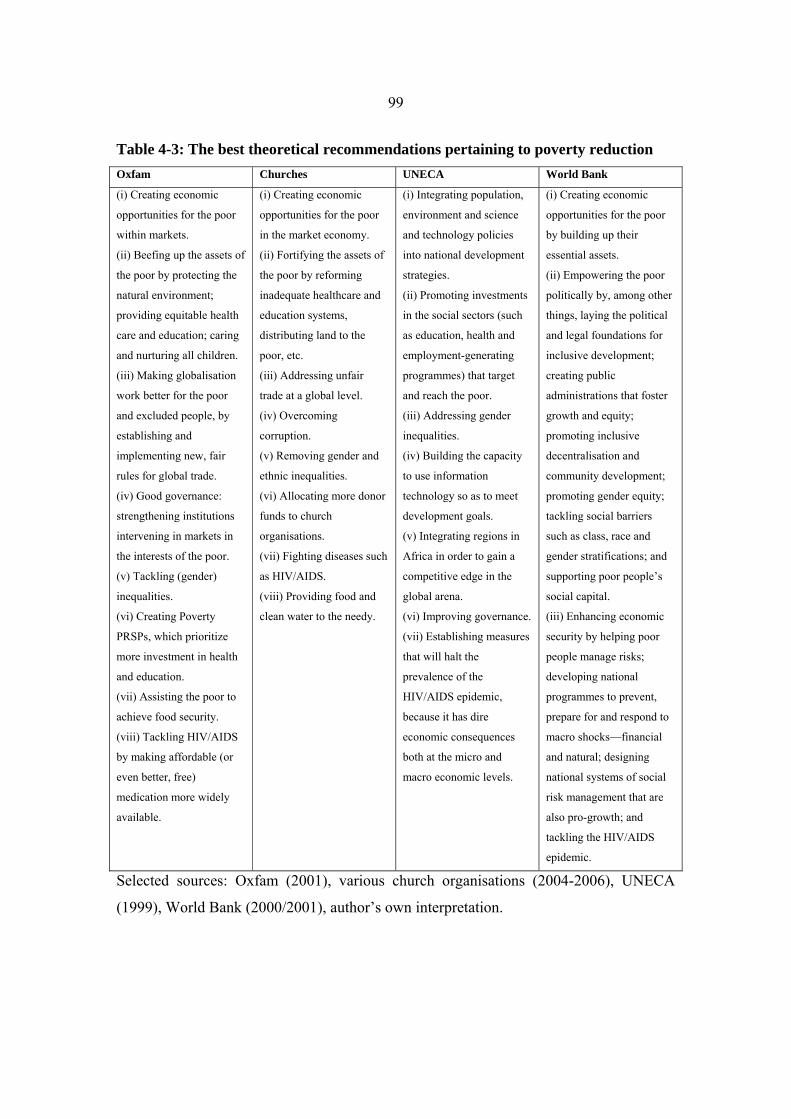
99
Table 4-3: The best theoretical recommendations pertaining to poverty reduction Oxfam Churches UNECA World Bank
(i) Creating economic
opportunities for the poor
within markets.
(ii) Beefing up the assets of
the poor by protecting the
natural environment;
providing equitable health
care and education; caring
and nurturing all children.
(iii) Making globalisation
work better for the poor
and excluded people, by
establishing and
implementing new, fair
rules for global trade.
(iv) Good governance:
strengthening institutions
intervening in markets in
the interests of the poor.
(v) Tackling (gender)
inequalities.
(vi) Creating Poverty
PRSPs, which prioritize
more investment in health
and education.
(vii) Assisting the poor to
achieve food security.
(viii) Tackling HIV/AIDS
by making affordable (or
even better, free)
medication more widely
available.
(i) Creating economic
opportunities for the poor
in the market economy.
(ii) Fortifying the assets of
the poor by reforming
inadequate healthcare and
education systems,
distributing land to the
poor, etc.
(iii) Addressing unfair
trade at a global level.
(iv) Overcoming
corruption.
(v) Removing gender and
ethnic inequalities.
(vi) Allocating more donor
funds to church
organisations.
(vii) Fighting diseases such
as HIV/AIDS.
(viii) Providing food and
clean water to the needy.
(i) Integrating population,
environment and science
and technology policies
into national development
strategies.
(ii) Promoting investments
in the social sectors (such
as education, health and
employment-generating
programmes) that target
and reach the poor.
(iii) Addressing gender
inequalities.
(iv) Building the capacity
to use information
technology so as to meet
development goals.
(v) Integrating regions in
Africa in order to gain a
competitive edge in the
global arena.
(vi) Improving governance.
(vii) Establishing measures
that will halt the
prevalence of the
HIV/AIDS epidemic,
because it has dire
economic consequences
both at the micro and
macro economic levels.
(i) Creating economic
opportunities for the poor
by building up their
essential assets.
(ii) Empowering the poor
politically by, among other
things, laying the political
and legal foundations for
inclusive development;
creating public
administrations that foster
growth and equity;
promoting inclusive
decentralisation and
community development;
promoting gender equity;
tackling social barriers
such as class, race and
gender stratifications; and
supporting poor people’s
social capital.
(iii) Enhancing economic
security by helping poor
people manage risks;
developing national
programmes to prevent,
prepare for and respond to
macro shocks—financial
and natural; designing
national systems of social
risk management that are
also pro-growth; and
tackling the HIV/AIDS
epidemic.
Selected sources: Oxfam (2001), various church organisations (2004-2006), UNECA
(1999), World Bank (2000/2001), author’s own interpretation.

100
• Tackling HIV/AIDS by making affordable (or even better, free) medication more
widely available.
Apart from their religious recommendations79, the various church organisations (2004-
2006) believe that the following measures should be undertaken in order to deal with
poverty: creating economic opportunities for the poor in the market economy; fortifying
the assets of the poor by reforming inadequate healthcare and education systems,
distributing productive land to the poor, etc.; addressing unfair trade at a global level;
overcoming corruption; removing gender (and ethnic) inequalities; increasing the
involvement/utilisation of churches in development projects, by allocating more donor
funds to them; fighting diseases such as HIV/AIDS by providing infected people with the
necessary medication; providing food and clean water to the needy, and so on.
The United Nations Economic Commission for Africa (UNECA) identified, in 1999,
eight factors as being key to reducing poverty in Africa. These include the following:
• Integrating population, environment and science and technology policies into
national development strategies.
• Promoting investments in the social sectors (such as education, health and
employment-generating programmes) that target and reach the poor.
• Addressing gender inequalities.
• Building the capacity to use information technology, so as to meet development
goals.
• Integrating regions in Africa, in order to gain a competitive edge in the global
arena.
• Improving governance.
• Establishing measures that will halt the prevalence of the HIV/AIDS epidemic,
because it has dire economic consequences both at the micro and macro economic
levels.
79 The churches believe that religious life is a fundamental dimension of people’s lives. As such, they believe that the answer to how poverty can be eradicated lies in people changing their ways of sinful living.

101
Unfortunately, most of the above views (and more) are usually overshadowed by those of
the World Bank. This is mainly attributed to the fact that donor countries usually insist
that the World Bank review macroeconomic policies of recipient countries. This, in turn,
enables the World Bank to exert its influence on macroeconomic policies in these
countries. In essence, as long as other prominent institutions do not have the financial
muscle to assist poor countries to, inter alia, rectify short-term balance of payment
problems, they will continue to find it difficult to impose their alternative views on
policies that are adopted by various developing countries.
In light of this, it is appropriate to ask the question: ‘what do the World Bank experts
recommend as being the best way to deal with poverty’? In response to a seemingly
perennial, deepening understanding of the complex nature of poverty, it is interesting to
examine how the recommendations of the World Bank experts regarding poverty
reduction have, accordingly, evolved over the past 50 years or so. In the 1950s and
1960s, many viewed large investments in physical capital and infrastructure as the
primary means of development that would lead to poverty reduction. In the 1970s,
awareness grew of the fact that physical capital was not enough, and that health and
education were as important. The 1980 World Development Report expressed this
understanding, and argued that improvements in health and education were important, not
only in their own right, but also to promote growth in the incomes of poor people. The
1980s saw another shift of emphasis following the debt crisis and global recession, and
the contrasting experiences of East Asia and Latin America, South Asia and Sub-Saharan
Africa. Emphasis was placed on improving economic management and allowing greater
play for market forces. This, in turn, encouraged the 1990 World Development Report to
focus its fight against poverty on three main areas: firstly, promoting rapid, labour-
intensive growth through economic openness, market incentives and investment in
infrastructure; secondly, ensuring minimum levels of social services for poor people,
including basic healthcare, family planning, nutrition and primary education; and thirdly,
a comprehensive approach to poverty reduction also called for well-targeted actions

102
offering safety nets for people exposed individually (illness, old age) or collectively
(natural disasters) to shocks (World Bank, 2000/2001).
In the 1990s, governance and institutions moved to the centre stage, as did issues of
vulnerability at the local and national levels. Consequently, the World Development
Report of 2000/2001, which focuses on poverty reduction, proposed a three-pronged
strategy for attacking poverty, namely: (i) promoting economic opportunity (this includes
the developing of human, land and infrastructure assets that poor people own or to which
they have access, thus enabling them to participate more meaningfully in the general
economy), (ii) facilitating political empowerment (this includes laying the political and
legal foundations for inclusive development; creating public administrations that foster
growth and equity; promoting inclusive decentralisation and community development;
promoting gender equity; tackling social barriers such as class, race and gender
stratifications; and supporting poor people’s social capital), and (iii) enhancing economic
security (this includes formulating a modular approach—i.e. a mix of interventions—to
help poor people manage risk; developing national programmes to prevent, prepare for
and respond to macro shocks—financial and natural; designing national systems of social
risk management that are also pro-growth; and, last but not least, tackling the HIV/AIDS
epidemic) (World Bank, 2000/2001).
4.2.1. Common trends in the World Bank’s recommendations and those of other
institutions
What is apparent from the above discussion is that common elements can be drawn from
these various recommendations. These common elements include the following:
• Creating economic opportunities for the poor;
• Improving the essential assets of the poor, particularly the human asset;
• Good governance;
• Addressing gender inequalities;

103
• Establishing measures to deal with pressing issues such as the HIV/AIDS
epidemic.
4.3. What are the international best practices with regard to poverty reduction?
As is suggested in the literature, it is virtually impossible to find (or even conceive, for
that matter) a single, abstract poverty reduction strategy that can be said to be successful
a priori (see for example the 2000/2001 World Development Report). This has to do with
the fact that the diverse causes or aggravators of poverty, as well as the types thereof, are
usually context specific. In essence, if policy solutions to this end are to be effective, they
need to not only provide an integrated approach to the diverse set of factors that influence
this phenomenon, but to also be designed according to the context that circumscribes the
society wherein they will be applied (White & Killick, 2001).
Notwithstanding the above, the arena of development rhetoric is replete with ‘success
stories’ that make it possible to distill some general conclusions regarding how best to
reduce poverty. Although these general conclusions might not guarantee success, they
can, at the very least, provide a valuable point of departure when designing country-
specific poverty reduction strategies. It is in view of this that this section seeks to
examine how countries such as China, Vietnam and Uganda have managed (or continue
to manage) to significantly reduce their poverty levels.
4.3.1. An overview of how China managed to reduce poverty during the 1981-2003
period
Remarkable annual economic growth levels of 8-9% since the late 1970s, coupled with
well designed and implemented poverty reduction programmes, have provided China
with the wherewithal to be able to uplift a total of about 402 million people out of
poverty—when using the international poverty line of $1 per day—during the 1981-2002
period (World Bank, 2004). Precisely how this happened is the issue that is dealt with
below.

104
According to Wang et al (2004), poverty reduction policies in China can be roughly
divided into four phases, namely: (i) the rural reform of 1978-1985, (ii) the National
Targeted Poverty Reduction Programmes of 1986-1993, (iii) the 8-7 Plan of 1994-2000,
and (iv) the New Century Rural Poverty Alleviation Plan for 2001-2010.
4.3.1.1. Rural reform (1978-1984)80
The most pressing challenge during the early years of the post-1978 reform period was to
create economic opportunities for the poor by boosting rural economic growth through
rural reforms. The national economy was stagnating, and poverty was widespread
throughout the country, exacerbated by the shocks of the ten-year long Cultural
Revolution and the long-standing restrictions on economic activity. In order to boost the
rural economy, the government of China launched institutional reforms for the purposes
of creating a reasonable economic incentive system that would, in turn, engender
economic opportunities for the poor in the rural economy that were aimed at expanding
agricultural production, diversifying the rural economy, improving the rural standard of
living and promoting new technologies. The fundamental institutional change was the
land reform, characterised by the implementation of the household responsibility system
in rural China, which allowed farmers to have use rights over productive land (i.e. the
natural asset). Collectively owned and operated land was distributed to farmers based on
family size and the number of family workers. Farmers had the right to choose their own
crop mix and input levels, as long as they fulfilled government quotas for certain grain
and cash crops. Any surplus output could be sold in the free markets. This system
motivated farmers to reduce production costs and to increase productivity, since their
efforts were closely linked to their income. This was accompanied by increases in
procurement prices81 and government encouragement of the establishment of free
markets. Markets further stimulated agricultural production.
80 This sub-section draws heavily from Wang et al (2004). 81 Following the initial introduction of a contract system (by poor farmers in Anhui) in agricultural production in 1979, which linked income to work performance, the Chinese government significantly increased state procurement prices for 18 major farm products in 1979 - on average, by 25% for quota

105
Table 4-4: Rural poverty in China (1978-2004) Year Number of poor (million) Poverty incidence (%) 1978 250 33.1 1984 128 15.1 1985 125 14.8 1992 80.1 8.8 1993 75 8.2 1994 70 7.6 1995 65 7.1 1996 58 6.3 1997 49.6 5.4 1998 42.1 4.6 1999 34.1 3.7 2000 32.1 3.4 2001 29.3 3.2 2002 28.2 3.0 2003 29.2 3.1 Source: States Statistical Bureau (SSB) (1980-2004)
The early rural reforms delivered remarkable results in terms of poverty reduction, as
well as agricultural production and rural industries. A strong growth in grain yields (5.7%
per year) and rural industries, accompanied by sharp increases in agricultural
procurement prices, raised rural incomes by 15% a year in real terms. The growth in
agricultural production and farmers’ income was spectacular in some extremely poverty-
stricken regions, such as the Huanghuaihai region in Eastern Fujian (Wang, 1994). As
poverty in China was widely dispersed across China’s rural areas in the early years of
post-1979 reforms, rural income growth delivered nearly universal poverty reduction.
Between 1981 and 1984, income poverty at the $1/day level fell from 49 to 24%, and the
number of rural poor declined from 250 million in 1978 to 125 million in 1985, measured
in terms of the official poverty line of $0.66 per day (see Table 4-4).
sales, 50% for above-quota sales of grain and vegetable oil crops, and 30-35% for cotton. Since then, increase in state procurement prices has been the main mechanism for maintaining farmers’ incentives to produce and sell their products to the state. For example, major upward adjustments to procurement prices were made in 1989-90, 1994-95 and 1996. On average, grain procurement prices were further increased by 16% in 1989, 44% in 1994 and 42% in 1996, while the cotton procurement price was increased by 27% in 1990, 65% in 1994 and 30% in 1995 (Wu, 1997).
106
4.3.1.2. The National Targeted Poverty Reduction Programmes (1986-1993)
By the mid-1980s, rural economic growth and living conditions appeared to lag again,
particularly in the revolutionary, minority and border regions. This translated into poverty
reduction being relatively slower. Consequently, these areas received special attention in
the Seventh Five Year Development Plan (1986-1990) (Wang et al, 2004). This marked
the beginning of China’s targeted rural poverty reduction programmes.
The rural poverty reduction programmes launched in the mid-1980s comprised a wide
variety of actors, initiatives and funding channels. The State Council’s Leading Group for
Poverty Reduction (LGPR) was established in 1986 to provide coherence for the large
number of poverty reduction initiatives and, in particular, to expedite economic
development in poor areas. As the basic unit for poverty targeting, the government
designated poor counties. For the officially designated ‘poor’ counties, the central
government created special funds to support a subsidised loan programme, food for work
(FFW) programme, and budgetary poor area development fund grants. Subsidised loans
covered both households and enterprises in industry and agriculture, the food-for-work
programme was utilising surplus farm labour, mainly to develop infrastructure, and
government budgetary grants supported investment in poor areas across all sectors
(World Bank, 2001b). At the local level, most poor provinces, prefectures and counties
had all established Leading Groups, and local governments were required to provide
counterpart funds. Different agencies became responsible for different poverty reduction
projects and activities (rural roads constructed under the FFW programme, for example,
have been implemented by local staff of the Transport Bureau). Certain preferential
taxation treatment was offered to poor regions, and this went a long way in boosting the
financial assets of the poor (Leading Group for Poverty Reduction and Development
(LGPR), 1989).
As can be seen in Table 4-4, rural poverty continued to decline during this period,
although at a slower rate. By the end of the ‘National Targeted Poverty Reduction

107
Programmes’ phase in 1992, rural poverty had declined to 80.1 million, and the incidence
of rural poverty had fallen to 8.8%.
4.3.1.3. The 8-7 Plan (1994-2000)
In 1994, the government introduced the ‘8-7 Plan’ (National Plan for Poverty Reduction),
aspiring to lift the majority of the remaining 80 million poor above the government’s
poverty line during the seven-year period of 1994-2000. This plan was introduced with
the purpose of creating more economic opportunities for the poor, by means of
augmenting their essential assets and thereby intensifying the poverty reduction policies
that had commenced in the second half of the 1980s.
The 8-7 Plan outlined several objectives. According to Wang et al (2004), it aimed at (i)
assisting poor households with land improvement, increased cash crop, tree crop and
livestock production, and improved access to off-farm employment opportunities, (ii)
providing most townships with road access and electricity, and improving access to
drinking water for most poor villages, (iii) accomplishing universal primary education
and basic preventive and curative healthcare, (iv) graduating better-off counties in the
coastal provinces from the newly established list of nationally designated poor counties,
(v) managing available funding successfully, with attention to the appraisal and financial
viability of poverty reduction investment activities, recovery of loan funds and leakage of
poverty reduction funding to alternative activities, and (vi) enlisting involvement and
support from all government ministries and agencies, coastal provinces and major
municipalities, and other domestic and international organisations. In implementing the
8-7 Plan, the government refined its selection of ‘poor’ counties and emphasised the
responsibility of local government leaders for the effectiveness of poverty reduction
activities in their jurisdictions. Since 1997, the annual funding for poverty reduction
jumped by over 50% in real terms, which reversed a decade of decline in real funding for
poverty reduction in China. The 8-7 Plan maintained the three channels of interventions
launched in 1986: the subsidised loans programme, food-for-work programme and

108
government budgetary grants. The subsidised loans programme accounted for the greatest
increase in funding (Wang et al, 2004).
As a consequence of the above interventions, poverty reduction in China accelerated,
particularly during the period 1994-1996. Table 4-4 shows that the number of rural poor
declined from 70 million to 29 million between 1994 and 2001. According to Wang et al
(2004), the rapid rate of poverty reduction during the 8-7 Plan period was a joint effect of
economic growth (which was directly supported by the 8-7 Plan), agricultural price
increases (related to the 1994-1996 government procurement reform82), rural-urban
migration and poverty reduction efforts.
In addition to the reduction of poverty, there was also steady progress in human capital
development in China in the 1990s. By 2001, adult literacy rates had risen to 85% and
enrollment rates to 99% (net) in primary schools and 89% and 44% (gross) in junior and
senior secondary schools respectively. During the period 1980-2001, the average years of
schooling in the 15-64 year age group rose from 5 to 8 years. In terms of educational
attainment, the share of the population with primary schooling remained at about 35%,
but the shares increased from 15% to 34% for those with junior secondary schooling and
from 6% to 11% for those with senior secondary and technical schooling. Major progress
was also achieved in healthcare, with China overhauling lower middle-income standards
by 2001. Average life expectancy at birth reached 70 years, infant mortality declined to
3.1%, and under-5 mortality fell to 3.9%. The share of one-year olds fully immunised
against tuberculosis and measles reached 98%. Nearly 85% of the population has gained
access to essential drugs, and less than 10% are undernourished (Wang et al, 2004).
82 This is the period during which grain procurement prices were further increased by 44% (in 1994) and 42% (in 1996), while the cotton procurement price was increased by 65% (in 1994) and 30% (in 1995) (Wu, 1997).
109
4.3.1.4. China’s current poverty reduction strategy: the New Century Rural Poverty
Alleviation Plan (2001-2010)
Notwithstanding the impressive improvements in terms of poverty incidence in rural
areas, by the year 1999, rural-urban and coast-interior disparities in poverty reduction had
widened (see Table 4-5 below). Moreover, within some of these high-level poverty
regions, particularly the western regions, poor households were, and still are, relatively
scattered in poor villages, that were marked by poor agricultural land and weak
infrastructure, rather than being concentrated in poor counties. The implication of this
was that targeting poor counties was no longer effective.
In view of this, the Chinese government launched a New Century Rural Poverty
Alleviation Plan for 2001-2010. This new plan targets poor villages rather than poor
counties, emphasises the development of poor people’s essential assets (particularly the
human asset) in poor localities, and promotes participatory poverty reduction approaches.
China’s Rural Poverty Reduction and Development Compendium (2001-2010) was
drafted and issued in 2001. Villages have been made the basic unit of targeting, and
poverty reduction investments will cover poor villages in non-poor counties, while the
list of poor counties has been updated in order to focus more on the western regions. The
new plan emphasises, among other things, the development of science and technology,
education and healthcare, recognising that illness has been the principal factor pushing
rural households into poverty. Furthermore, the new plan calls for participatory poverty
reduction approaches and village-based comprehensive development and overall progress
(LGPR, 2001; Gao, 2001). Finally, the new plan has recognised, contrary to what has
been stated in section 3.5.1.3.1, that rural-urban migration is a critical avenue for poverty
reduction, and new policy initiatives are making it easier for rural inhabitants to benefit
from new job opportunities arising in China’s towns and cities.
The recent poverty statistics show that this current poverty reduction strategy has
managed to reduce China’s rural poverty slightly, from 32.1 million people in 2000 to
29.0 million people in 2003 (see Table 4-4).

110
Table 4-5: China’s rural and urban poor by region (1999) (%)
Region Share of China’s rural
poor
Share of China’s urban
poor
Western Provinces 46.6 23.0
Central Provinces 42.1 46.2
Coastal Provinces 11.3 30.8
4.3.2. An overview of how Vietnam managed to reduce poverty during the 1993-2004
period
Like China, there are two main factors that were responsible for Vietnam’s success in
poverty reduction during the 1993-2004 period. These are: (i) good economic
performance, especially in rural areas, which has been attributed to the economic and
institutional reforms of the late 1980s, and (ii) various targeted poverty reduction
programmes that were initiated in 1992. These two factors will be discussed below.
4.3.2.1. The impact of economic growth on poverty reduction during the 1993-2004
period in Vietnam
At the end of the 1980-1988 period83, the status quo of the Vietnamese economy was
dire. Output expansion dropped, and the rates of inflation accelerated to several hundred
percent per year, with a peak of 774.7% in 1986. The real income of the majority of
government employees fell sharply. Poor weather and poor incentives led to a miserable
agricultural harvest in 1987, with grain production down by nearly one million tons from
the 1986 level. Regional food shortages caused real hardship in some areas. In the north,
supply did not meet demand, leading to starvation in 21 provinces and cities in early
1988, affecting 9.3 million people, who represented 39.7% of farm households, of which
3.6 million people were subject to serious starvation (Nguyen & Chu, 1996).
83 This is during the time when the Vietnamese economy was regarded as a modified planned economy (MPE).

111
In order to remedy this situation, in the Sixth Party Congress in December 1986, the
Vietnamese Congress approved the doi-moi (Renovation) programme, which was an
official promulgation of socio-economic policies that began in the early 1980s. Up until
March 1989, the implementation of this ‘Renovation’ programme was very slow.
However, after March 1989, the Vietnamese government made significant changes in the
direction of the doi-moi. Similarly to the various economic and institutional reforms that
were undertaken in China, the doi-moi programme sought to create economic
opportunities for the poor, as well as foster sound macroeconomic management that
would engender a reasonable economic incentive system for private businesses to
mushroom. Furthermore, the doi-moi programme was associated with the distribution of
agricultural land to rural households, marketisation of the rural economy, and the creation
of the right incentives for farm production (such as the relaxation of trade restrictions on
rice exports; relaxation on internal barriers in order to allow rice to flow from the south to
the north; reduction in fertiliser supply constraints, by allowing state-owned enterprises
that earned foreign exchange to import fertiliser directly; and improved development of
market infrastructure). Doi-Moi also eliminated production and consumption subsidies
and streamlined the public sector (Dollar & Litvack, 1998; Weinns, 1998). In addition,
this reform effort included the stabilisation of inflation and the liberalisation of foreign
trade and investment (Dollar, 2002). What also accompanied the foregoing measures was
the creation of a legal framework for the corporate sector through promulgating and
amending business-related laws and regulations.
During the 1990s, as a result of the above reforms, Vietnam turned into one of the fastest
growing economies in the world, with an average GDP growth rate of between 7-8% per
annum during the 1993-2004 period. Inflation was kept under control at a low, single-
digit level. Agriculture grew at slightly over 5.6%, while industrial value-added increased
rapidly at an average rate of 11.2% per year, although from a very low base. The service
sector grew by 7% per year. High agricultural growth during the 1990s has turned
Vietnam from a rice-importing country into the second largest rice exporter in the world.
Vietnamese agricultural competitiveness has improved to the extent that it has become a
major exporter of agricultural products such as cashew nuts, coffee and pepper, in

112
addition to rice. Vietnam has boosted its exports from 854.2 million US$ in 1987 to
11,540.0 million US$ in 1999.
Table 4-6: Poverty incidence in Vietnam
Percent 1993 1998 2002 2004*
Poverty Rate 58.1 37.4 28.9 19.5
Urban 25.1 9.2 6.6 3.6
Rural 66.4 45.5 35.6 25.0
Food Poverty 24.9 15.0 10.9 7.4
Urban 7.9 2.5 1.9 0.8
Rural 29.1 18.6 13.6 9.7
Poverty Gap 18.5 9.5 6.9 4.7
Urban 6.4 1.7 1.3 0.7
Rural 21.5 11.8 8.7 6.1
Source: Fan et al (2004)
* GSO, 2004 VHLSS
As a knock-on effect of this remarkable economic performance, particularly in the
agricultural sector, Vietnam has made substantial and steady progress in poverty
reduction. The poverty rate dropped from 58.1% in 1993 to 37.4% in 1998, 28.9% in
2002 and 19.5% in 2004, while in the same years, food poverty declined from 24.9% to
15%, 10.9% and 7.4% (see Table 4-6). Rural and urban poverty declined sharply during
the 1990s. The depth of poverty also declined in both rural and urban areas. According to
Fan et al (2004), this decline in poverty in Vietnam reflects rising household expenditures
and GDP per capita, due to an increase in real income (i.e. financial assets) during the
1990s. Income and thus expenditure levels improved significantly during the 1990s. The
real annual per capita expenditure was 1,936 thousand Vietnamese dong (VND)
(equivalent to 130 US$) in 1992-93, 2,764 VND in 1997-98, and 3,229 VND in 2002.
The annual average household per capita expenditure rose by 7.4% between 1993 and
1998, and by 4.0% between 1998 and 2002. These figures indicate a considerable
improvement in living standards during the 1990s.

113
4.3.2.2. The impact of national poverty reduction programmes on poverty reduction
during the 1993-2004 period in Vietnam
Besides focusing on attaining macroeconomic stability (which generated, inter alia,
economic growth), as well as creating economic opportunities for the poor by way of, for
example, distributing land, the Vietnamese government also initiated a number of
targeted programmes that were mainly aimed at assisting those who lacked the necessary
assets to participate meaningfully in the general economy.
After recognising that poverty was a serious barrier to development, the VIIth Congress
of the leading Communist Party of Vietnam (CPV) in 1991 called on the government to
pay more attention to boosting the essential assets of the poor, by supplying better social
services and improving infrastructure in poor regions. In 1992, the administration of Ho
Chi Minh City initiated a hunger eradication and poverty reduction action plan. Soon
thereafter, this plan was adopted and extended to some other provinces. As a result,
hunger eradication and poverty reduction quickly became a nation-wide movement (Vu,
2005).
During the period 1992-1995, the government took various steps towards poverty
reduction within a framework of 14 national development programmes, such as:
reforestation, job creation, provision of preferential credit, eradication of illiteracy,
reduction of child malnutrition, etc. The budget allocated to these national programmes
was 2,855 billion VND, of which 1,328 billion VND (or 47%) was provided as credit for
households, 629 billion VND (or 23%) for essential goods supplied to the poor to address
immediate poverty (e.g. food, salt, clothes, blankets, kerosene, etc.), and 835 billion VND
(or 30%) for the construction of communal infrastructure for long-term economic
opportunities (rural roads, electricity grids, irrigation, schools, commune clinics, etc.). In
addition to the state budget, local people voluntarily contributed 425 billion VND for
poverty reduction activities (Ha, 2002). A special financial service institution, the Bank
for the Poor (now renamed the Bank for Social Policies), was established in 1995 to

114
encourage the economic development of the poor. In 1993, the Ministry of Labour,
Invalids and Social Affairs (MOLISA) promulgated the national poverty line to guide the
identification process of poor households, who were targets of poverty reduction policies
and projects (Vu, 2005).
In 1996, the government established the National Targeted Program for Hunger
Eradication and Poverty Reduction, with the aim of co-ordinating poverty reduction
actions and mobilising more resources to fight against poverty. The National Targeted
Program for Hunger Eradication and Poverty Reduction (HEPR) for the period 1998-
2000 was approved in July 1998. For the period 2001-2005, it also included a job
creation component, and was named the National Targeted Program for Hunger
Eradication, Poverty Reduction and Job Creation (HEPR for short, or Programme 143).
Another programme, the Programme for Socio-Economic Development in Communes
faced with Extreme Difficulties (PDCED, also known as Programme 135), which (like
China) focused on poverty reduction in the poorest regions, was also promulgated in
1998. From 2000 onwards, the earlier national targeted projects, which were mainly
aimed at supporting disadvantaged households of ethnic minorities, sedentarisation, and
the construction of inter-commune centres in mountainous regions, were integrated into
Program 135. This programme was, in turn, designed to focus on poverty reduction in the
poorest communes and ethnic minority groups. In addition, there were other national
targeted programmes, poverty alleviation programmes and development projects
supported by international donors implemented in different regions, which also
considered poverty reduction as one of their major goals (Vu, 2005).
Besides the abovementioned specialised programmes for poverty reduction, the
Vietnamese government also issued several policies for social protection, health
insurance, exemption of education fees, support for improvement of private housing,
supply of safe water, additional allocation of cultivated land to the poor, support for
ethnic minority groups, etc., which have been implemented by different authorities (Vu,
2005).

115
Table 4-7: Some human development indicators in Vietnam (1993-2002) Indicator Year • Education
Primary enrolment rate (net) Female Male Lower secondary enrolment rate (net) Female Male Upper secondary enrolment rate (net) Female Male
1993 87.1 86.3 29.0 31.2 6.1 8.4
1998 90.7 92.1 62.1 61.3 27.4 30.0
2002 100 107 67* 72*
• Child Nutrition Incidence of stunting among children 0-59 months Female Male
51 51 50
34 33 35
• Adult Nutrition Incidence of moderate and severe malnutrition in adults (Body Mass Index less than 18.5) Female (non-pregnant) Male
32 32 32
28 30 25
• Access to Infrastructure % of rural population with public health centre within the commune % of rural population with access to clean water % of urban population with access to clean water % of rural population using electricity as a main source of lighting
93 17 60 48
97 29 75 77
Source: World Bank estimates based on VLSS93 and VLSS98, cited in Swinkels and
Turk (2003); Human Development Report (2006)
* These represent the average of secondary enrolment rates. In other words, the
secondary demarcation (i.e. lower secondary and upper secondary) does not apply.
The abovementioned programmes have had a positive effect on poverty reduction in
Vietnam. For example, the objective of the HEPR during the period 1998-2000 was
eradication of chronic hunger and reduction of the poverty rate (according to MOLISA's
1993 poverty definition) from 17.7% in 1997 to 10% in 2000. This objective was reached
after three years of HEPR implementation. The recent housing policy in Vietnam had

116
impacted on about 260 000 households by the end of 2004. These households have
received assistance for housing improvement, of which 180 000 constructed new houses
and 80 000 repaired their existing houses. In addition to these, a lot of other
developments have benefited the poor, including infrastructure development in rural
areas, electrification, access to education and healthcare, better water supply, irrigation
for poor farmers, access to telecommunications, and so on (see Table 4-7).
4.3.3. An overview of how Uganda managed to reduce poverty during the 1992-2000
period
In the same way as in China and Vietnam, the two main forces behind Uganda’s success
in poverty reduction are economic growth, which has been attained through a series of
economic and institutional reforms, and a wide range of poverty reduction programmes.
Precisely how these translated into improved living conditions for the poor will be
discussed in this section.
4.3.3.1. The impact of economic growth on poverty reduction during the 1992-2000
period in Uganda
When the National Resistance Movement (NRM) came into power in January 1986, it
inherited an economy in ruins. The rate of inflation was very high, running at an annual
rate that was over 100%, occasioned by economic mismanagement and the scarcity of
basic goods. The official exchange rate was highly overvalued, with unofficial rates many
times greater, thereby curbing the level of exports. Government finances were so weak
that foreign exchange reserves only provided two weeks’ import cover. The banking
system was unable to provide loans for working capital and productive investment, on
account of insolvency. Growth rates went into reverse, with real GDP declining by 10%
between 1984 and 1985. By this time, the economy had shrunk by more than 20%,
compared to a peak in 1970. Aid flows had fallen to very low levels, following a modest
recovery in the form of quick-disbursing IMF credits to assist with economic stabilisation
in the early 1980s (Kasekende & Atingi-Ego, 1999; Devarajan et al, 2001).

117
Faced with the severity of the economic crisis, in May 1987, the NRM-led government
(with the help of the World Bank, the International Monetary Fund and bilateral donors)
embarked on the Economic Recovery Programme (ERP), which was a standard
IMF/World Bank structural adjustment programme (SAP). According to Opolot and
Kuteesa (2006), the broad policy objectives of this reform programme focused on
stabilisation of the economy through the restoration of fiscal and monetary discipline;
liberalisation of consumer and producer prices; liberalisation of interest rates within a
restructured and more efficient financial system; liberalisation of the foreign exchange
market and the strengthening of the balance of payments position; liberalisation of trade
and compliance with other regional and international trade obligations; and the
privatisation and rationalisation of state enterprises. Below are some of the key policy
measures which were undertaken so as to fulfill the foregoing policy objectives (see for
example Opolot & Kuteesa, 2006):
• The Coffee Marketing Board (CMB), the Lint Marketing Board (LMB)
monopolies and the Produce Marketing Board (PMB) were all abolished in the
early 1990s. This meant that exporters were now free to borrow directly from
commercial banks to pay farmers, instead of going through marketing boards.
These market reforms were also accompanied by the removal of restrictions on
the movement of produce across districts.
• Government interest in agricultural pricing and marketing activities was divested.
Instead, the role of government institutions was narrowed down to supportive
activities such as quality control, provision of market information, and research
and development.
• A pricing policy was introduced. This policy focused on the liberalisation of input
and output prices by reducing or eliminating subsidies on agricultural inputs such
as fertilisers and credit, realigning domestic prices with world market prices,
eliminating pan-territorial and pan-seasonal pricing, and reducing exchange rate
overvaluation. It was expected that this would benefit poor, smallholder rural
118
households whose real incomes were assumed to rise in line with relative price
movements.
• Import and export procedures were liberalized, and licensing requirements
abolished. Import controls were replaced with tariff-based protection, and the
temporary export stabilisation tax on coffee exports was removed.
• The Bank of Uganda (BOU) initiated a facility to provide medium to long-term
financing to potential exporters through a number of credit lines and support
schemes. These credit lines and schemes, supported by external donor agencies,
provided loans to small- and medium-sized enterprises within the private sector
through licensed banks.
• The National Agricultural Research Organization was established in 1992, with
the objective of undertaking, promoting and co-ordinating research in aspects
pertaining to agricultural development.
As a result of the abovementioned efforts (and more), the Ugandan economy has
recovered very well. The economic growth rate accelerated to 6.9% per annum in the
1990s. Consequently, GDP per capita rose from $251 in 1990 (1995 constant prices) to
$347 in 1999. The inflation turnout during the 1990’s has been impressive. From the
volatile trend in consumer prices during the 1980s, which led to a headline annual
inflation rate of 250% in 1987, the annual inflation rate has declined to less than 10% per
annum. As a result of the abolishment of the marketing board’s monopoly on coffee, tea
and cotton at the beginning of the 1990s, there was a rise in producer prices and a surge
in production. Uganda thereby regained its position as Africa’s leading coffee exporter.
Moreover, at the time when the CMB was solely responsible for exporting Uganda’s
coffee, farmers’ share of the export price was less than 30%. After liberalisation of the
coffee sub-sector in 1991, their share rose from 45% in 1991/92 to 82% in 1996/97. This
has positive implications for poverty, because an estimated 2.5 million people (about
13% of the total population) depend on coffee for their livelihood through production and
marketing (Opolot & Kuteesa, 2006).

119
What is also apparent from the literature is that this economic recovery coincided with a
reduction in the poverty incidence (Kappel et al, 2004; Fan et al, 2004; Kabananukye et
al, 2004). Table 4-8, for example, shows that the incidence of poverty declined from
55.5% in 1992 to 35.2% in 1999/2000, but nearly half of this reduction occurred after
1997. In the five years from 1992 to 1997, Uganda reduced its poverty rate by 11.5
percentage points. However, it reduced this by more than 10 percentage points in only
two years, i.e. from 1997-99. Like China and Vietnam, Table 4-8 also shows that poverty
has declined in both the rural and urban areas, although it appears as if urban residents
benefited more from the recent economic boom than did their rural counterparts. Another
interesting similarity between these East Asian economies and Uganda has to do with the
fact that areas with better infrastructure have been more successful in reducing poverty.
For example, the central region has the best infrastructure in the country and the lowest
incidence of both rural and urban poverty. Poverty reduction was also the greatest within
this region. In the north, however, where infrastructure is poor, the incidence of poverty
is almost double the national average, and poverty reduction has been the smallest within
this region (see Table 4-8).
Table 4-8: Incidence of poverty in Uganda (1992-2000) Region 1992/93 1993/94 1994/95 1995/96 1997/98 1999/2000 National Rural Urban
55.5 59.4 28.2
52.2 56.7 20.6
50.1 54.0 22.3
48.5 53.0 19.5
44 48.2 16.3
35.2 39.1 10.3
Central Rural Urban
45.5 52.8 21.5
35.6 43.4 14.2
30.5 35.9 14.6
30.1 37.1 14.5
27.7 34.3 11.5
20.3 25.7 7.4
East Rural Urban
59.2 61.1 40.6
58.0 60.2 30.5
64.9 66.8 41.5
57.5 59.4 31.8
54.3 56.8 24.8
36.5 38.4 15.7
West Rural Urban
52.8 53.8 29.7
56.0 57.4 24.9
50.4 51.6 25.4
46.7 48.3 16.2
42.0 43.2 19.9
28.1 29.5 5.6
North Rural Urban
71.3 72.2 52.6
69.2 70.9 46.2
63.5 65.1 39.8
68.0 70.3 39.6
58.8 60.7 32.6
65.8 67.7 30.6
Source: UBOS (various years), cited in Fan et al (2004)

120
4.3.3.2. The impact of poverty reduction programmes on poverty reduction during the
1992-2000 period in Uganda
In addition to policies that were meant for restoring macro-economic stability and
economic growth, there were a number of other policies that placed more emphasis on
poverty alleviation, although these were initially muted in the early years of the economic
and institutional reforms. These initially focused on efforts to mitigate the perceived
negative effects of structural adjustment on some groups within the population. The
PAPSCA programme that started in 1990 was similar to many such programmes initiated
under the auspices of the World Bank-supported social dimensions of adjustment
programmes. However, by 1994, MFPED officials recognised the need for a more
comprehensive analysis and strategy to tackle poverty, partly motivated by strong
pressure from elements within the ruling National Resistance Movement (NRM), who
were convinced that poverty was getting worse during the adjustment years. The
government had moved away from socialist policies, but not from the objective of a more
prosperous and equal society, and was particularly sensitive to such criticism from within
its own ranks (Foster & Mijumbi, 2002).
Following a 1995 workshop, in which the president participated, the first poverty
eradication action plan (PEAP) (i.e. Uganda’s current official poverty reduction strategy)
was prepared in 1997 as the overarching document, setting out government’s poverty
reduction strategy. It was subsequently updated in 2000, with far broader consultation,
including a participatory poverty assessment to determine the views of the poor
themselves.
The PEAP has four pillars of action. According to the government of Uganda (2000),
these are the following: (i) creating an enabling environment for rapid and sustainable
economic growth and structural transformation (this pillar is associated with
macroeconomic stability, equitable and efficient collection and use of public resources,
and private sector development); (ii) good governance and security (this pillar is
associated with conflict resolution, decentralised governance, with strengthened bottom-

121
up accountability, tackling corruption, legal sector reform and public information); (iii)
actions that directly increase the ability of the poor to increase their income (this pillar is
associated with access to agricultural advisory services, rural finance and markets,
sustainable natural resource utilisation, rural roads, secure access to land, and sustainable
energy resources for the poor); and (iv) actions that directly improve the quality of life of
the poor (this pillar is associated with free primary education, improved healthcare,
reducing the HIV/AIDS infection rate, improved access to clean water and sanitation, and
improved adult literacy).
The PEAP was further buttressed by the creation of the Poverty Action Fund (PAF). The
PAF is where money from debt relief is channelled, with the sole purpose of funding
activities that have a direct bearing on poverty, such as primary education, primary health
care, agricultural extension, feeder roads, water and sanitation, etc. In essence, the PAF
strengthened the government budget allocation emphasis on infrastructure and social
services (Foster & Mijumbi, 2002).
In line with the PEAP, especially the policies that are aligned with the last two pillars, the
living standards of the poor were improved. For example, in addition to the poverty
reduction that was due to the positive effects of the free market reforms, major
investments in roads have contributed to lower transportation costs, which have, in turn,
led to a significant reduction in the spread of market prices. Likewise, the introduction of
free primary education resulted in a 90% increase in enrolments (Larson & Deininger,
2001). Health standards improved as a result of increased access to safe water, proper
sanitation and better health facilities. The most significant achievement has been the
halving of HIV infection rates from 14% in 1995 to 6.1% in 2000, following a relentless
public education campaign (Uganda Demographic & Health Survey, 1995, 2000/01).
4.3.4. Moving towards international best practices
In all of the cases discussed above, consistency with regard to factors that are responsible
for poverty reduction is apparent. Evidence from these cases suggests that a potentially

122
successful poverty reduction strategy should encompass the following three
complementary elements: (i) creation of economic opportunities for the poor, (ii) good
governance, i.e. sound macroeconomic management that engenders macroeconomic
stability, and (iii) social programmes (i.e. social safety nets) that are targeted at the poor.
4.3.4.1. Creation of economic opportunities for the poor: augmenting the poor people’s
assets and providing them with market access
Findings from the above cases suggest that an improvement in the gini-coefficient
measurement serves to reinforce the favourable effect of growth on poverty and vice
versa84. Significantly, economic reforms in China were initiated in a reasonably low
inequality environment, which had a gini-coefficient measurement of 32.0 in 1980. As
such, economic growth (which emanated mainly from these reforms) ‘trickled down’ to
the poor with greater ease. What is even more interesting about China’s case is that
poverty reduction was fastest during the period 1980-84 - this is when income growth
coincided with a reduction in income inequality (from 32.0 in 1980 to 25.7 during the
1980-84 period). However, when income inequality increased (from 35.5 in 1990 to 44.7
in 2001), there was also a decline in the poverty reduction rate (see the State Statistical
Bureau, 1980-2004). Similarly, the benefits of economic growth in Uganda have been
broad-based, with overall income poverty declining from 56% in 1992 to 35% in 2000, as
this growth occurred in a low inequality environment (see for example Appleton, 2001b).
This was even more so when the gini-coefficient declined to 34.7 in 1997/98 from 36.4 in
1992/93 (see Fan et al, 2004). However, the trend in poverty reduction was reversed
from 35.2% in 2000 to 38.8% in 2002/03. According to Kabananukye et al (2004), this
may have been attributed to the fact that income inequality increased during the 1998-
2003 period (gini-coefficient rose from 34.7 to 42.8), when GDP growth had slowed. In
Vietnam, the various reforms were also initiated in a reasonably low inequality
environment. For example, in 1993, the initial stage of economic reforms, the gini-
coefficient in Vietnam measured 34. As this figure grew to 35 in 1998 and 37 in 2002,
84 Note that this view is in line with the analogy that has been described in section 3.5.3.2.

123
the rate of poverty reduction also decreased85 (World Development Report, 2004b; World
Development Report, 2004a). Based on this, it is therefore important that growth-oriented
policies should be accompanied by measures that enable the poor to share in this growth.
This calls for what White and Killick (2001) refer to as double-blessed policies, i.e.
policies that promote both economic growth and a more broad-based distribution of
benefits. These are comprehensive policies which are aimed at (i) augmenting the poor
people’s assets; and (iii) providing access to markets for the poor.
(i) Augmenting the poor people’s assets and poverty reduction. Following from
the view that the poor are in this state because they lack access to essential
assets (see section 3.3), the development of poor people’s possession of (or
access to) assets is of fundamental importance in the fight against poverty.
This view is motivated by the fact that improving the various (human,
physical, natural and financial) assets that poor people possess, or have access
to, can enable them to take advantage of (economic) opportunities whenever
they arise. This can, in turn, enable the poor to escape poverty, especially
since there are powerful complementarities across assets—that is, the benefits
of one asset can depend significantly on access to another (World
Development Report, 2000/2001). Moreover, an increased number of
participants in the general economy enable the government to amass more tax
revenue (from the newly employed individuals and increased company
profits) that can be utilised towards, inter alia, infrastructure and programmes
that are targeting the poor. In essence, focusing solely on attaining rapid
economic growth, without actually paying attention to enhancing the diverse
assets that the poor possess, can prove to be detrimental to the war against
poverty.
(ii) Access to markets and poverty reduction. Just like everyone else, the poor rely
on formal and informal markets to sell their main asset (i.e. labour) and other
85 This decline in the poverty reduction rate could also be attributed to the fact that the economic growth rate had slightly declined, when compared to that in the initial stage of reforms.

124
(agricultural) products (Bathrick, 1998). Consequently, access to such markets
is paramount for the poor, because not only does it enable them to
commercialise their productive activities, but it also provides them with an
opportunity to improve their socio-economic circumstances. In light of this, it
is therefore important that the various barriers that tend to limit economic
opportunities for the poor are minimized, especially since these barriers tend
to be higher for the poor, since, in comparison with everyone else, more of
them live in remote areas and lack connections. Evidence from the cases of
China, Vietnam and Uganda shows that there are a variety of ways in which
these barriers can be removed. This includes improving property rights to land
(for example, security/clarity of property rights and access to land through
land reform) and improving access to credit through an increase in low-cost
microfinance schemes.
4.3.4.2. Good governance: sound macroeconomic management
What is also evident from the cases discussed above is that sound macroeconomic
management plays a crucial role in poverty reduction. Due to institutional and economic
reforms (which included policies that fostered, inter alia, trade liberalisation, low
inflation, more competition and the liberalisation of state monopolies), these countries
have managed to create a reasonable economic incentive system, i.e. an environment that
is conducive to the mushrooming of private businesses. Since private business is the
engine for economic growth, this reasonable economic incentive system has, to date,
managed to engender remarkable economic growth levels of 8-9%, 7-8% and 6-7% in
China, Vietnam and Uganda respectively. Most importantly, economic growth in all these
countries has been rapid and sustainable enough to offset the tendencies of population
growth, which will, at a constant/shrinking GNP, directly reduce the living conditions of
the poor, as well as the scope for redistribution. Moreover, growth (particularly in the
initial stages of the reforms) in these countries has also been pro-poor. This is because, in
each of these countries, the growth pattern has been broad-based and inclusive with
respect to the sectors in which poor women and men earn their livelihoods, as well as the

125
regions in which they live. Hence, growth in these countries has easily translated into
higher earnings for the poor through increased economic opportunities, such as
employment opportunities (that match the skills that are mainly possessed by the poor)
and increased business opportunities for the self-employed.
The lesson, therefore, is clear: countries should pursue policies that foster a
macroeconomic environment which is conducive to attaining rapid, pro-poor and
sustainable economic growth.
4.3.4.3. Targeted programmes: social safety nets
Due to their nature, the above two axes of intervention take long periods of time to take
effect. In some instances, they even have adverse effects that exacerbate the living
conditions of the poor, presumably in the short-term86. As a result, it is therefore
important to devise, as has been done in China, Vietnam and Uganda, social programmes
that are aimed at softening the hardships that vulnerable individuals or households have
to bear. However, these social programmes should be designed in such a way that
incentives to be a productive member of society are not unduly diminished. Moreover,
for the purposes of efficiency, these should be mainly targeted towards areas that are seen
to be having a relatively higher level of poverty incidence, just as was done in the above
cases, and these should have a time-frame, so as to determine their effectiveness. These
social programmes should be specifically directed towards pressing issues (such as high
unemployment rates; malnutrition; and a lack of or inadequate access to lodging,
schooling and healthcare facilities) that require immediate relief. There is a broad range
of mechanisms that can be devised in this regard. These include, among other things,
pension systems (targeted at older people), disability benefits, child support grants, public
works programmes and free primary education.
86 See, for example, section 3.4.1 for the negative effects of trade liberalisation.

126
4.4. Conclusion
This chapter has sought to discuss the recommended theoretical solutions, as well as
implemented best practices, with regard to poverty reduction. In terms of the theoretical
recommendations, it has outlined a number of proposals that are advocated by
development and religious institutions such as Oxfam, UNECA, the Catholic Church
(and various other church organisations), as well as the World Bank.
Oxfam proposes that there should be more emphasis on creating (employment and
business) opportunities for the poor within markets; beefing up the assets of the poor;
providing equitable healthcare and education; caring and nurturing all children;
establishing and implementing new, fair rules for global trade; good governance; tackling
(gender) inequalities; creating PRSPs, which prioritise more investment in healthcare and
education; ensuring that the poor have food security; and tackling HIV/AIDS by making
affordable (or even better, free) medication more accessible.
The various church organisations believe that the focus should be on creating economic
opportunities for the poor in the market economy; fortifying the assets of the poor;
addressing unfair trade at a global level; overcoming corruption; removing gender (and
ethnic) inequalities; increasing the involvement/utilisation of churches in development
projects by allocating more donor funds to them; fighting diseases such HIV/AIDS, by
providing infected people with the necessary medication; providing food and clean water
to the needy, and so on.
UNECA highlights eight factors as being key to reducing poverty in Africa. These
include integrating population, environment and science and technology policies into
national development strategies; promoting investments in the social sectors that target
and reach the poor; addressing gender inequalities; building the capacity to use
information technology, so as to meet development goals; integrating regions in Africa,
in order to gain a competitive edge in the global arena; improving governance; and

127
establishing measures that will halt the prevalence of the HIV/AIDS epidemic, because it
has dire economic consequences, both at micro and macro economic levels.
The World Bank, on the other hand, proposes a three-pronged strategy for attacking
poverty, namely: (i) promoting economic opportunity, (ii) facilitating political
empowerment, and (iii) enhancing economic security.
Interestingly, there were common elements that were found to be espoused by each of
these institutions. These include creating economic opportunities for the poor;
empowering the poor by improving their essential assets, particularly the human asset;
good governance; addressing gender inequalities; and establishing measures to deal with
pressing issues such as the HIV/AIDS epidemic.
With regard to implemented best practices, the poverty reduction strategies that have
been adopted in China, Vietnam and Uganda were discussed. This is because these
countries have done extremely well in terms of poverty reduction. This chapter
established that the Chinese government stimulated (rural) economic growth by
implementing various reforms, which were aimed at, among other things, assisting poor
households with land improvement; increasing cash crop, tree crop and livestock
production; procuring goods produced by poor farmers at reasonable prices; and
improving access to off-farm employment opportunities. It also implemented
programmes that were aimed at improving the income-generating prospects of the poor
(in particular, providing the poor with access to arable land, education and healthcare).
For the officially designated ‘poor’ areas, the following was done: (a) the central
government created special funds to support a subsidised loan programme, food-for-work
(FFW) programme, and budgetary poor area development fund grants; (b) in addition,
preferential taxation treatment was offered to these poor regions; and (c) the government
provided these underdeveloped areas with road access (thus lowering transportation
costs), electricity and safe drinking water.

128
Like China, it was also found that the Vietnamese government implemented measures
which were aimed at growing the (rural) economy. These measures included, among
other things, the marketisation of the rural economy and the creation of the right
incentives for farm production (such as the relaxation of trade restrictions on rice exports;
relaxation on internal barriers to allow rice to flow from the south to the north; reduction
in fertiliser supply constraints by allowing state-owned enterprises that earned foreign
exchange to import fertiliser directly; and improved development of market
infrastructure).
In order to beef up the asset base of the poor (or to raise the return on productive assets
held by them), the Vietnamese government distributed agricultural land to the poor and
issued several policies for social protection, health insurance, support for improvement of
private housing, supply of safe water, job creation and reforestation. With regard to long-
term economic opportunities, this government allocated funds for the construction of
communal infrastructure (i.e. rural roads, electricity grids, irrigation, schools, commune
clinics, etc.) and a special financial service institution – the Bank for the Poor (now
renamed the Bank for Social Policies) – was established in 1995 to encourage the
economic development of the poor.
To address the immediate needs of the poor, this government introduced a number of
targeted anti-poverty programmes that were aimed at, inter alia, supplying essential
goods to the poor (e.g. food, salt, clothes, blankets, kerosene, etc.), alleviating
unemployment among the poor, providing preferential credit, exempting the poor from
paying education fees (thus reducing illiteracy), reducing child malnutrition, and so on.
In order to return the economy to a growth path, the government of Uganda adopted
various economic and institutional reforms. These included policies that were aimed at,
inter alia, stabilising the economy (e.g. restoring fiscal and monetary discipline), as well
as creating a conducive environment for the agricultural sector to grow (e.g. enabling
exporters to borrow directly from commercial banks to pay farmers, instead of going

129
through marketing boards, and removing restrictions on the movement of produce across
districts).
In an attempt to directly increase the ability of the poor to increase their income, the
government initiated policies that sought to, among other things, (a) enable the poor to
access arable land, agricultural advisory services, (rural) finance and markets; (b) foster
sustainable natural resource utilisation; and (c) build the rural infrastructure (most
notably, rural roads and sustainable energy resources for the poor).
In order to improve the quality of life of the poor, the government of Uganda also created
programmes that were associated with free primary education, improved healthcare,
reduction of the HIV/AIDS infection rate, improved access to clean water and sanitation,
and improved adult literacy.
The experience of these respective countries suggests that a potentially successful
poverty reduction strategy should encompass three elements, namely: the creation of
economic opportunities for the poor, augmenting poor people’s assets and providing them
with access to markets; sound macroeconomic management that engenders
macroeconomic stability; and social programmes (i.e. social safety nets) that are targeted
at the poor.

130
Chapter Five
South Africa’s Poverty Reduction Policies in the Post
Apartheid Era
5.1. Introduction
“I try everything I can to feed my children but it is never enough. I have
nothing. Now my pain is double because I have lost my beloved child. And
I cannot even afford to bury her” (Sunday Times, 2002, cited in Desai,
2005: 32).
At the individual level (or household level, for that matter), poverty can translate into
incalculable privation and suffering among those that are engulfed by it. The above quote
bears eloquent testimony to exactly how this can happen. What is even more of a concern
is that if it becomes endemic at the macro level, this phenomenon can give rise to a
number of socio-economic ills. For example, widespread poverty has the potential of
giving rise to social upheaval and instability in society87, as Keynes (1971: 144, cited in
Van der Merwe, 2000) so eloquently warned: “Men will not always die quietly. For
starvation, which brings to some lethargy and a helpless despair, drives other
temperaments to the nervous instability of hysteria and to a mad despair. And these in
their distress may overturn the remnants of organization, and submerge civilization itself
in their attempts to satisfy desperately the overwhelming needs of the individual.” Other
development practitioners argue that a poverty-stricken milieu could provide a fertile
ground for crime-related activities to mushroom, especially in a country where a
comprehensive social security net that covers all (poor) people is non-existent (see for
example Kothari, 1993; Wilson & Ramphele, 1989). The notion is that, more often than
not, the only avenues possible for those who cannot fulfill their basic socio-economic
necessities are through the economic avenues provided by crime. Hence, most South
87 It is noteworthy, however, that whether or not social upheaval occurs is a function of the following (Van der Merwe, 1996: 40): expectations of individuals, degree of urbanisation, level of education, and the possibility of mobilisation.
131
African criminal offenders are either impoverished or associated with the characteristics
of poverty, such as low levels of education and unemployment88 (see for example
Mpuang, 2000: 7). In addition, the persistent poverty of a substantial portion of the
population can dampen the prospects for economic growth (Khan, 2001). The essential a
priori argument is that the poor are themselves a potential market, which entails both
would-be consumers and suppliers of goods and/or services. Therefore, if they are unable
to participate in the various economic activities, due to their deficient command over
necessary resources, they are unlikely to make any meaningful contribution towards the
growth of the macro economy. What extensive poverty also does in relation to dwarfing
economic growth prospects is that, instead of enabling government to divert considerable
resources towards investment projects that are necessary for achieving sustainable
economic growth, it compels government to continue with substantial pro-poor social
expenditures, which are ostensibly economically unproductive.
Given the aforementioned, it would be safe to suggest that the need for poverty
eradication (or at least reduction) can never be overemphasised. In the South African
case, this is especially so, since it has been enshrined in the new constitution that every
citizen has a basic right to life and the means89 that are necessary and appropriate for the
proper development of it. Besides, if South Africa is to achieve and sustain the 6%
growth rate that has been envisioned in the Accelerated and Shared Growth South Africa
(ASGISA) policy document, empowering the poor with the means that will both improve
their livelihood, as well as enable them to participate meaningfully in the economy, is
absolutely necessary.
Fortunately, however, evidence in countries (e.g. China, Vietnam and Uganda) that are
known to have achieved varying degrees of success in poverty reduction seems to suggest
that it is possible to reduce poverty in a meaningful manner. Key to this success,
however, is the adoption of appropriate context-specific poverty reduction strategies or 88 According to Mpuang (2000: 07), most South African offenders are uneducated, unemployed and impoverished, and due to these social and economic circumstances, often find themselves driven into a life of crime. Furthermore, he believes that little relief in the crime rate can be expected, unless efforts are made to enable them to escape these constraints. 89 This includes access to nutritious food, adequate shelter, primary healthcare, basic education and so on.

132
policies (see Table 5-1 for a summary of the various anti-poverty strategies that have
been adopted by these respective countries). Among other things, it is in this context that
the government decided to endeavour to curb the apartheid legacy of endemic poverty.
Hence, there are a plethora of poverty reduction strategies that this government has
embarked upon ever since the start of the democratic era. These various strategies can be,
as can be seen in Table 5-2, divided into the following categories: (i) measures that foster
pro-poor economic growth; (ii) job creation measures; (iii) infrastructure programmes
earmarked to address household consumption basic needs; (iv) contributory and non-
contributory social security measures; and (v) asset building or redistribution measures.
In line with the format that is depicted in Table 5-2, this chapter rightfully seeks to
examine these respective strategies in greater detail. This will be done with a view to
examining their consistency with international best practices. Moreover, given the fact
that the ANC promised to ameliorate the livelihood of the previously disadvantaged
majority when it came into power, as well as the fact that large amounts of money have
been spent to this end, it would be interesting to attempt to examine whether or not any
meaningful impact on poverty has been made thus far.
The methodology adopted by this chapter will mainly consist of a desk review of the
literature. In more specific terms, secondary sources of data, which primarily include
journal articles and policy documents such as GEAR, RDP, ASGISA and JIPSA, will be
analysed. Furthermore, various government websites will be accessed, in order to
augment the study. All this will be done with a view to gaining insight into policy plans
and philosophy. This will, in turn, be evaluated in terms of actual performance.

133
Table 5-1: A summary of anti-poverty strategies that have been adopted by China,
Vietnam and Uganda China (i) The Chinese government stimulated (rural) economic growth by implementing reforms
which were aimed at, among other things, assisting poor households with land improvement; increasing cash crops, tree crops and livestock production; procuring goods produced by poor farmers at reasonable prices; and improving access to off-farm employment opportunities.
(ii) It also implemented programmes that were aimed at improving the income-generating prospects of the poor (in particular, providing the poor with access to arable land, education and healthcare).
(iii) For the officially designated ‘poor’ areas, (a) the central government created special funds to support a subsidised loan programme, food-for-work (FFW) programme, and budgetary poor area development fund grants; (b) in addition, preferential taxation treatment was offered to these poor regions; and (c) the government also provided these underdeveloped areas with road access (thus lowering transportation costs), electricity and safe drinking water.
Vietnam (i) The Vietnamese government implemented measures which were aimed at growing the (rural) economy. These measures included, among other things, the marketisation of the rural economy and the creation of the right incentives for farm production (such as the relaxation of trade restrictions on rice exports; relaxation on internal barriers to allow rice to flow from the south to the north; reduction in fertiliser supply constraints by allowing state-owned enterprises that earned foreign exchange to import fertiliser directly; and improved development of market infrastructure).
(ii) To beef up the asset base of the poor (or to raise the return on productive assets held by them), the Vietnamese government distributed agricultural land to the poor and issued several policies for social protection, health insurance, support for improvement of private housing, supply of safe water, job creation and reforestation. For long-term economic opportunities, this government allocated funds for the construction of communal infrastructure (i.e. rural roads, electricity grids, irrigation, schools, commune clinics, etc.), and a special financial service institution – the Bank for the Poor (now renamed the Bank for Social Policies) – was established in 1995 to encourage the economic development of the poor.
(iii) To address the immediate needs of the poor, this government introduced a number of targeted anti-poverty programmes that were aimed at, inter alia, supplying essential goods to the poor (e.g. food, salt, clothes, blankets, kerosene, etc.), alleviating unemployment among the poor, providing preferential credit, exempting the poor from paying education fees (thus reducing illiteracy), reducing child malnutrition, and so on.
Uganda (i) To return the economy to a growth path, the government of Uganda adopted various economic and institutional reforms. These included policies that were aimed at, inter alia, stabilising the economy (e.g. restoring fiscal and monetary discipline), as well as creating a conducive environment for the agricultural sector to grow (e.g. enabling exporters to borrow directly from commercial banks to pay farmers, instead of going through marketing boards, and removing restrictions on the movement of produce across districts).
(ii) In an attempt to directly increase the ability of the poor to increase their income, the government initiated policies that sought to, among other things, (a) enable the poor to access arable land, agricultural advisory services, (rural) finance and markets; (b) foster sustainable natural resource utilisation; and (c) build the rural infrastructure (most notably, rural roads and sustainable energy resources for the poor).
(iii) In order to improve the quality of life of the poor, the government of Uganda also created programs that were associated with free primary education, improved health care, reduction of the HIV/AIDS infection rate, improved access to clean water and sanitation, and improved adult literacy.

134
Table 5-2: A framework for poverty reduction in the post-apartheid era Trickle-down effect
Job creation Basic needs Social safety nets Asset building/redistribution
Macroeconomic stability:- (i) Budget deficit reduction (ii) Restrictive monetary policy (iii) Managed trade liberalisation (iv) Exchange rate and price stabilisation (v) Regulated flexibility of the labour market (vi) Productivity improvements.
Human resource development: (i) National skills development strategy (learnerships & SETAs) (ii) Further education and training (iii) Adult Basic Education and Training Enabling measures for SMMEs: - (i) The establishment of state institutions – i.e. Khula & Ntsika – providing financial and non-financial assistance to SMMEs. Special pro- employment programmes: (i) Clean Cities Campaign; (ii) Working for Water; (iii) Coastal Care; (iv) Land Care Campaign; (v) Municipal Infrastructure Programme; (vi) Welfare Programmes; (vii) Community-Based Public Works Programmes; (viii) Provincial/locally-Based Public Works Programmes (Gundo Lashu Programme in Limpopo & Zibambele Programme in Kwa-Zulu Natal); (ix) Extended Public Works Programme; (x) Arts and Culture poverty relief projects.
(i) Pre- & primary education (ii) Primary health care (iii) Water & sanitation (iv) Housing (v) Electrification or other alternative sources of energy (vi) ISRDP nodes (vii) URP nodes
Occupational insurance:
(i) Unemployment insurance Fund (UIF) Social assistance:- (i) Social grants, namely:
• Old-age pensions
• Disability grants • War Veterans’ • Foster Care • Care
Dependency • Child Support • Grant-in-Aid
(ii) Other poverty alleviation initiatives: -
• School Nutrition Programme
• Social Relief of Distress Programme
• Disaster Relief Programme
• Food Relief Programme
(i) Land Reform Programme (ii) The delivery of housing
This chapter is, excluding the introduction, organised into seven sections. Section one
focuses on poverty reduction through pro-poor economic growth (i.e. the ‘trickle down’
effect principle). This is because pro-poor growth has proved to be the most effective

135
poverty reduction strategy across different settings. Significantly, if one looks at the long-
term relationship between economic growth and the poverty rate in most developing
countries, it is clear that there has been a close and inverse relationship between the rate
of economic growth and the poverty rate (see for example Dollar & Kraay, 2000).
Section two looks at the various mechanisms that the government uses to create poverty-
reducing (or alleviating) jobs. These include the provision of skill-enhancing education
and training, providing financial and non-financial support to SMMEs, and special pro-
employment programmes such as public works programmes. The general consensus
among most developmental analysts is that labour is the main asset of the poor (see for
example Abedian, 2004; Desai, 2005). As such, it is believed that providing the poor with
fruitful employment opportunities can go a long way towards reducing poverty. As a
matter of fact, prominent leaders who subscribe to this viewpoint have gone so far as to
suggest that job creation should be at the centre of all poverty reduction strategies (see
section 5.3).
Section three is based on the belief that, although it does not necessarily improve their
income, enabling the poor to access basic services can have a positive impact on their
quality of life. Accordingly, the focal point of this section is on infrastructure
programmes that are earmarked to address household consumption basic needs, such as
adequate shelter, electricity or other alternative sources of energy, clean water and
sanitation, (primary) healthcare and basic education. Furthermore, this section looks at
the measures (i.e. the ISRDP and URP programmes) that have been devised for the
purposes of ensuring that the poorest of the poor are not excluded from receiving these
basic services.
Section four discusses the social security net system. As has been argued by Alcock
(1993: 214), the idea behind social security policy is the use of state support, collected in
the form of contributions or taxes from those in employment, to provide an income from
the state for those who cannot secure an adequate income for themselves, and are thus at
risk of poverty. This section focuses mainly on occupational insurance in the form of the

136
Unemployment Insurance Fund (UIF), as well social assistance in the form of social
grants and other poverty relief programmes, namely: the School Nutrition Programme,
the Social Relief of Distress Programme, the Disaster Relief Programme and the Food
Relief Programme.
Section five looks at measures that are aimed at beefing up the asset base of previously
disadvantaged people. This is because, as can be seen in section 4.3.4.1, having
entitlement to productive assets is essential for the poor, in the sense that such assets
enable the poor to take advantage of the economic opportunities that might trickle down
as a result of economic growth at the macro level. The various measures that this section
is going to look at in relation to this include those that enable the poor to access
productive land and houses that can provide the poor with the option of, inter alia, renting
out some parts of it.
In section six, comments on the efficacy of the government’s various strategies with
regard to poverty reduction will be made. This section will also comment on whether or
not these poverty reduction strategies are consistent with international best practices.
Furthermore, possible reasons as to why the government has not managed to significantly
reduce poverty in South Africa will be outlined.
The last section makes conclusive remarks. In this section, a summary of South Africa’s
poverty reduction strategies, as well as possible reasons why this country has not been
able to significantly reduce poverty (as has been the case in China, Vietnam and Uganda),
will be presented.
5.2. Poverty reduction through economic growth: the trickle-down effect principle
A commonly held view is that maximising economic growth, measured by increased
output per capita, is the most effective policy for reducing poverty. This view is based on
the notion that more economic growth potentially leads to more income for all. If any of
this increase in income ‘trickles down’ to the poor, particularly via higher earnings,

137
business opportunities and employment (lower rate of unemployment), then there will
invariably be a rise in their standard of living, and a reduction in the poverty rate in due
course, ceteris paribus (see Figure 5-1). Correspondingly, empirical research, using data
from a large group of developing countries, suggests that this view is tenable (see for
example Dollar & Kraay, 2000).
Figure 5-1: Conceptual framework: economic growth and poverty
Higher employment
Economic growth Higher business opportunities Poverty reduction
Higher wages
Source: Modified from Tambunan (2005)
Against this backdrop, it is quite obvious then that, for the purposes of poverty reduction,
it was imperative for the government to come up with a clear policy initiative that would
pull the economy out of its recessionary slump, since it inherited an economy with an
average annual real per capita growth that had been on the decline for over three
decades90. Hence, the government introduced the Growth, Employment and
Redistribution (GEAR) policy framework in 1996. This macro-economic strategy
recognises the important role that higher economic growth plays in creating economic
opportunities that are of significance to poverty reduction (see Knight, 2006). In
addition, this strategy has sought to create an optimal climate for private investment
(which is the engine for economic growth) through a set of macroeconomic stability
measures (low budget deficits, privatisation of state assets, relaxation of labour laws,
90 Significantly, South Africa’s average annual real per capita growth was 2.9% during the 1960s, 0.7% during the 1970s, -0.6% during the 1980s, and -1.5% between 1990 and 1994.

138
competitive exchange rates, low inflation, etc.). Of significance to poverty reduction, this
set of measures was (according to the modelling in GEAR, i.e. macro-model simulations,
running from 1996 through to 2000) expected to, inter alia, lead to an economic growth
rate of 6% per annum by the year 2000, which, in turn, would generate up to 400 000
jobs per annum (see Table 5-3), thus resulting in a drastic improvement in the livelihoods
of the needy. In essence, GEAR was expected to create 1.35 million jobs during the
1996-2000 period (see Weeks, 1999; DOF, 1996). Critical to the attainment of the
foregoing goals was a significant increase in private investment and non-gold exports,
together with increased state expenditure on social infrastructure (Office of the President,
1996).
Table 5-3: Key macroeconomic indicators, Gear targets & performance (1996-2000) 1996 1997 1998 1999 2000 Average
1996-2000
GDP growth (real)
(actual)
3.5
4.2
2.9
2.5
3.8
0.8
4.9
2.1
6.1
3.4
4.2
2.5
Employment growth (private)
(actual)
1.3
-0.6
3.0
-1.7
2.7
-3.4
3.5
-2
4.3
-2.7
3.0
-2.0
Private sector investment (growth)
(actual)
9.3
7.7
9.1
4.8
9.3
-1.8
13.9
-3.3
17.0
6.4
11.7
2.7
Source: Weeks (1999), DOF (1996)
Unfortunately, it is quite clear, in hindsight, that the job creation objectives were not
achieved. As a matter of fact, during the 1996-2000 period, the employment performance
was dismal, to such an extent that it declined substantially during these years (see Table
5-4). This was mainly attributed to the fact that, although the market liberalisation
policies of GEAR managed to improve the macroeconomic outcomes in terms of
lowering inflation and reducing the budget deficit, they failed to catapult the South
African economy to new levels of growth by the year 2000, as originally promised. As
illustrated in Table 5-3, with the exception of 1996, real GDP growth turned out to be
much lower than the GEAR projections (and by 2006, it had still not reached the 6%
predicted for 2000). Similarly, instead of growing at an annual average rate of just under

139
12%, private sector investment, which is supposed to be the engine of economic growth,
only grew by 2.7% (see Table 5-3)91.
In light of this, the government has sought to buttress GEAR by countering what is
perceived to be the key constraints92 to the growth of the economy (Mlambo-Ngcuka,
2006). It has done this through the “Accelerated and Shared Growth Initiative – South
Africa” (ASGISA) programme. The notion is that dealing with these constraints will, in
turn, enable the South African economy to grow at a rate of around 6%, thus enabling
more South African households to directly benefit (particularly via increased, gainful job
opportunities) from the economic success that is experienced at a macro level. In line
with this, the government is further seeking to boost poverty-reducing employment by
promoting private investment in sectors that are, among other things, labour-intensive.
Areas in which the government hopes for progress include business process outsourcing
(including back-office activities and call centres), which the government says has
attracted 5,000 jobs so far, and has the potential for an additional 100,000 by 2009.
Another sector which the government hopes to increase from 8% to 12% of the GDP,
while simultaneously increasing employment by up to 400,000 jobs, is tourism (Knight,
2006).
5.3. Using job creation as a poverty reduction measure
As will be shown in section 5.5 (ii), South Africa’s social safety net programme is,
probably due to limited resources, restricted to certain categories of people. Furthermore,
labour is the most important asset of the poor. Given this, the importance of job creation
91 In light of this, it therefore comes as no surprise that progress with regard to poverty (and inequality) reduction has been poor during the initial five-year period of GEAR. Significantly, a United Nations Development Program (UNDP) study of poverty in South Africa found that in the late 1990s, about 18 million people (40.6% of the population) still lived below the poverty line, using an absolute measure of poverty pegged at R 353 per month (cited in Streak, 2004). Of these, 10.4 million lived in ultra-poor households, earning less than R 193 per month per adult equivalent. 92 According to Mlambo-Ngcuka (2006), the key constraints that hinder the South African economy from growing at a rate of 6% include (i) the volatility and level of the currency; (ii) the cost, efficiency and capacity of the national logistics system; (iii) shortage of suitably skilled labour, amplified by the cost effects on labour of apartheid spatial patterns; (iv) barriers to entry, limits to competition and limited investment opportunities; (v) a regulatory environment and its burden on small and medium businesses; and (vi) deficiencies in state organisation, capacity and leadership.

140
as a way of reducing South Africa’s high poverty levels can never be overemphasised
(see for example Abedian, 2004; Desai, 2005; Vavi, 2003, cited in Desai 2005). As a
matter of fact, at an international level, the Director-General of the International Labor
Organization (ILO), Juan Somavia, believes that “job creation should be put at the center
of global efforts to halve extreme poverty by 2015” (Financial Times, 2003, cited in
Desai, 2005).
Why is the abovementioned view so prevalent? The answer to this question lies in Figure
3-4. Gainful employment increases the purchasing power of the working people via
increased earnings, ceteris paribus. What this essentially implies is that, given the fact
that most poor people are in this state because they lack adequate access to productive
assets, if more fruitful jobs can be created in order to enable the economically active poor
to commercialise their labour asset, the earnings that are usually obtained from working
can provide these poor people with the means to circumvent the adversities of poverty93.
This can, in turn, enable them to improve their livelihoods in due course, especially if
they consume their earnings in a prudent manner (see section 3.6.2.1). Moreover, fruitful
employment creation can increase the tax base (as more people will be eligible to pay
tax), thus enhancing the government’s ability to fund pro-poor services such as health-
care, clean water and education.
It is in the above context that the government uses employment creation as one of its
main strategies for curtailing the high poverty levels in South Africa. It does this (i.e.
creating jobs) by using the following mechanisms: (i) promoting skill-enhancing
education and training, (ii) providing financial and non-financial support to SMMEs, and
(iii) undertaking special employment-creating projects (see Table 5-2). The question of
precisely how these mechanisms are meant to engender gainful employment, which
eventually leads to poverty reduction, will be dealt with in the remainder of this section.
93 Jobs are particularly important for the poor, because labour is usually their only asset, which they can then successfully commercialise.

141
5.3.1. Creating jobs through skill-enhancing education and training
In modern economies, such as that of South Africa, only a fortunate few possess inherent
talent that needs little training in order to be translated into high-paying effort. Without
much training or education to develop aptitudes into marketable skills, the earning power
of most people would be mainly limited to what their simple physical strength and effort
were worth on the market (Perlman, 1976). This is chiefly attributed to the fact that
acquiring good-paying jobs in the contemporary economic and technological
environment requires one to possess technical knowledge and skills that are usually
acquired through skill-enhancing education and training. Among other things, this
explains why most of the Black population who were subjected to the ‘Bantu’ education
system were a source of cheap labour during the apartheid era (a factor that made them
susceptible to poverty).
Against this background, it then follows that the government has incorporated a number
of human resource development measures into the GEAR policy. These have sought to
improve the overall education system, as well as to develop the skill base of the work-
force (the emphasis being on those who are a product of ‘Bantu’ education). The idea is
that, in due course, these various human resource development measures will create
graduates or workers who are able to take advantage of skilled employment
opportunities, which will arise as a result of economic growth. With regard to the
development of the education system, the following key initiatives have been undertaken
since 1994 (Department of Education, 2001, cited in Barker 2003):
• The Further Education and Training (FET) Act of 1998 (and related policies),
which provides the basis for developing a nationally coordinated further education
and training system, comprising the senior secondary component of schooling and
technical colleges. This Act attempts to ensure that learners from this band94,
94 According to Barker (2003), the FET band comprises Grades 10-12 in school education, out-of-school youth and adult learners. Technical, youth and community colleges, as well as a range of other industry-based and non-formal providers, also fall into the FET band.

142
especially out-of-school youth and adult learners, acquire education that is
relevant to the workplace, thus making them employable.
• The Adult Basic Education and Training Act (2000), which provides for the
establishment of public and private adult learning centres, funding for adult basic
education and training (ABET) provision, governance of public centres, and
quality assurance mechanisms for the sector.
With regard to developing the skill base of the workforce, the key initiative that has been
undertaken in the new political dispensation (i.e. post-1994) is the National Skills Act,
which was enacted in 1998. According to Barker (2003), this Act seeks to, among other
things:
• Develop the skills of the South African workforce and thereby increase the quality
of working life for workers;
• Promote self-employment;
• Improve the delivery of social services; and
• Encourage employers to use the workplace as an active learning environment, and
to provide opportunities for new entrants to the labour market to gain work
experience.
‘Learnerships’ and ‘Sector Education and Training Authorities (SETAs)’ are the main
vehicles through which all the abovementioned objectives of this Act are to be achieved.
Like apprenticeships, learnerships combine practical work experience (in normal work-
place conditions) and structured learning (which might be taught by an educational
institution) (Barker, 2003). This is with the hope that this will, in turn, assist young,
unemployed people to become employed, as well as help existing workers to improve
their skills level. The SETAs, on the other hand, are mainly aimed at charging a skills
levy to firms, to be repaid on the presentation of evidence by the firm that it is
undertaking approved training for its workers; encouraging FET institutions in the
provision of education and skills for work; developing and administering learnerships;
and undertaking quality assurance. All of this (and more) is done with the view that it

143
will go a long way towards addressing the skills shortage problem, which is perceived to
act as a constraint to poverty-reducing employment and economic growth in South Africa
(Kingdon & Knight, 2005).
The sad reality, however, is that, in general, these abovementioned initiatives have not (at
least for now) been very successful in assisting the workforce to accumulate the skills
that are required in today’s labour market. The skilled job categories (e.g. financial
managers, network administrators, engineers and the like) that stand empty bear
testimony to this fact. For example, in March 2004, there were as many as 500 000 job
vacancies in South Africa (Abedian, 2004). What this essentially implies is that South
Africa is still characterised by structural unemployment, in the sense that a large
proportion of the labour force in South Africa is still unskilled or only possesses very
basic skills, which is in contrast to the type of skills that are urgently needed in this
country (Abedian, 2004).
What is also a cause for concern is that the paucity of formal sector jobs in South Africa,
which require low skill levels, continues to manifest itself in open unemployment.
According to Kingdon and Knight (2004), this is generally in contrast to the pattern that
exists in most developing countries, where the paucity of formal sector jobs usually
manifests itself in large informal sectors, rather than in high levels of open
unemployment (see for example Table 5-5). In light of this, it would therefore be safe to
assume that these various human resource development strategies have also not been very
successful in reviving the culture of entrepreneurship among the black people who were
previously oppressed in this regard (see section 3.3.1). Consequently, South Africa
continues to have a small informal sector in comparison to other developing countries
(Kingdon & Knight, 2004).

144
Table 5-4: Unemployment and informal employment95 Country Urban Unemployment rate Employment Rate in the
Informal sector
Ratio of Informal Sector
Employment to
Unemployment
South Africa 29.3 18.9 0.7
Other Sub-Saharan African
countries
16.0 74.8 4.7
Benin 10.1 92.8
Burkina Faso - 77.0
Chad - 74.2
Guinea 12.3 71.9
Kenya 16.2 71.6
Mali 9.9 78.6
Mauritania 31.6 75.3
Mozambique - 73.5
Zambia - 58.3
Latin America 8.1 56.9 7.0
Argentina 18.8 53.3
Bolivia 3.6 63.6
Brazil 4.6 57.6
Colombia 9.0 55.5
Ecuador 6.9 53.5
Mexico 6.3 59.4
Paraguay 5.6 65.5
Venezuela 10.3 46.9
Asia 5.3 63.0 11.9
India - 73.7
Indonesia 7.2 77.9
Pakistan 6.1 64.6
Philippines 7.4 66.9
Thailand 0.4 51.4
Iran - 43.5
Source: Charmes (2000, cited in Kingdon and Knight, 2004)
In response to the above, the government has since introduced other human resource
development measures that seek to fast-track the development of South Africa’s human
capital (particularly that of the poor), so as to simultaneously address the issues of skills
shortage and unemployment. In the education sphere, the key measures that are to be (or
have been) undertaken include, among other things: (i) a huge upgrading of Further
Education and Training colleges, (ii) the National Youth Programme, which is designed 95 These figures are based on the World Development Indicators, 1997.

145
to provide both training and work experience for young people outside of the education
and training systems, and also outside the labour market, and (iii) a revamping of the
Adult Basic and Education Training Programme, based on a model developed in Cuba
and New Zealand.
Other key interventions in the skills sphere include, among other things: (i) the
development of an Employment Services System (to close the gap between potential
employers and employees); (ii) the deployment of experienced professionals and
managers, under the management of the Development Bank of Southern Africa (DBSA),
to local governments, in order to improve project development, implementation and
maintenance capabilities; (iii) a number of skills development programmes, which are
driven by the Umsobomvu Youth Trust—these usually entail youth volunteers; and (iv)
the establishment of the Joint Initiative for Priority Skills Acquisition (JIPSA) to identify
urgent skills needs and quick and effective solutions (e.g. special training programmes,
bringing back retirees or South Africans working outside Africa, and drawing in new
immigrants where necessary).
5.3.2. Creating jobs through providing financial and non-financial support to SMMEs
Besides the other significant economic roles that they usually fulfill (e.g. contributing
towards the country’s national product), available empirical evidence suggests that the
SMME sector is an essential factor in creating employment, especially in developing
economies96 (Alweendo, 2004). What makes SMMEs even more relevant in the context
of poverty reduction is the fact that they have a remarkable capacity to absorb unskilled
labour (Rwigema & Karungu, 1999), which, in turn, can lead to an improvement in the
96A 2002 survey on the position of SMMEs in OECD countries showed that SMMEs account for 60-70 percent of total employment in manufacturing in most OECD economies. The survey also showed that, in the services sector, small firms provide the vast majority of jobs. During the 1990s, small firms were responsible for up to three quarters of employment growth in the United States, and businesses with fewer than 20 employees are now generating up to one-half of the jobs in the country. In Korea, national statistics indicate that SMMEs increased their share of manufacturing employment from 63.5% in 1991 to 74% in 2000. A similar trend is evident in developing economies. Significantly, preliminary estimates for developing economies in South-East Asia show that SMMEs provide employment to over 80% of the labour force (Alweendo, 2004).

146
human capital of the poor, since they are the ones who are usually characterised by low
skill levels. Moreover, SMMEs are instrumental in economically empowering the
marginalized, in the sense that they help inculcate the culture of entrepreneurship and
innovation by way of providing a ‘nursery’ and a proving ground for a business career
(Rwigema & Karungu, 1999). In essence, SMMEs can, besides creating job opportunities
for the poor, also be utilised as a vehicle for enhancing human capital, because they
expose people with low skills to business experience and thereby encourage a ‘learning-
by-doing’ effect (Berry et al, 2002).
Given the important role that SMMEs generally play in creating employment
(particularly for the unskilled), as well as the fact that they have the potential to
contribute towards economically empowering those who are marginalised, by providing
them with a stepping stone to a business career, it therefore comes as no surprise that
South Africa’s SMME economy has been actively promoted since 1995. This is
especially so since the government inherited a country which had, inter alia, a SMME
economy that had been actively discouraged by repressive measures for protracted
periods of time (Berry et al, 2002; see also section 3.3.1), in addition to a largely
unskilled labour force which was (and still is) struggling to find gainful employment.
The specific framework for SMME development was set forth in the Department of
Trade and Industry’s (DTI) 1995 White Paper97. This, together with the National Small
Business Development Act of 1996, paved the way for the introduction of a range of new
support institutions and initiatives (Rogerson, 2004). These sought to create an
environment in which SMMEs could flourish and prosper. The main institutional pillars
that were derived from the challenges set out in the White Paper include, among others,
the following (Berry et al, 2002):
97 This White Paper is entitled: “A National Strategy for the Development and Promotion of Small Business in South Africa”.

147
• The Ntsika Enterprise Promotion Agency (Ntsika or NEPA, for short). Ntsika
provides non-financial support to SMMEs via a range of programmes that are
accessible through a network of retail service providers98.
• Khula Enterprise Finance Ltd. Since its establishment in 1996, Khula has
initiated a number of loan schemes to increase access to finance for SMMEs
through retail financial intermediaries (RFIs)99. Critical to the effectiveness of
these RFIs in terms of poverty reduction was the existence of linkages between
the first and second economies, in order to generate demand for credit for micro-
enterprises that would act as suppliers to the first economy (Kirsten et al, 2006).
However, since this was not the case, there was a dramatic reduction in the
number of credit retailers through which Khula could extend its capital towards
the smaller enterprise clientele. As such, Khula has since opened ‘micro-credit
outlets’ that cater for smaller enterprises that are owned by poor entrepreneurs.
One of these credit schemes includes the recently established South African
Microfinance Apex Fund (SAMAF), which provides loans of up to R 10 000 to
households and micro-entrepreneurs, who depend on micro-enterprises for their
livelihood. Mafisa (i.e. agricultural credit scheme) is another newly established
small business credit scheme that is mainly targeted at providing assistance to
poor entrepreneurs who reside in the former homeland areas (Aliber et al, 2006).
98 These are classified as (i) Local Business Service Centres (LBSCs)—for assistance in business administration and general information, (ii) Tender Advise Centres (TACs)—to provide assistance and training to SMMEs on government tendering processes and information about current tenders, (iii) Manufacturing Advise Centres (MACs)—these are coordinated and monitored by the national NAMAC, in collaboration with the Centre for Scientific and Industrial Research (CSIR), in order to provide industry-specific assessments and link SMMEs to highly-specialised service providers. Moreover, thirteen technical colleges were founded for the purpose of implementing the Technopreneur Programme for potential SMME entrepreneurs to improve their technical skills. Entrepreneurs are meant to apply these skills under supervision before they start their own businesses. In addition, LBSC and other NGO staff can receive Ntsika-funded training offered by eleven so-called Service Provider Development Programme Organisations. 99 These schemes can be grouped as follows: (i) Business Loan Schemes—these are loans of between R1 and R100 million which are forwarded to RFIs in order to capacitate them or increase their willingness to provide loans to SMMEs, (ii) Guarantee Schemes—guarantees are underwritten by Khula to reduce the risk of lending to SMMEs without sufficient collateral, and (iii) Equity Funds—through the internet-based Emerging Enterprise Zone (EEZ), as part of the Johannesburg Stock Exchange (JSE), SMMEs are expected to gain access to equity funding (up to R250 000, constituting less than 45% of total equity and to be re-capitalised within five years) from private investors with whom Khula might form partnerships.

148
In addition to this, the government has also embarked on an initiative to develop youth
entrepreneurship, as this is highly recommended by the ILO for developing countries
with high unemployment rates (du Toit, 2003). This initiative is spearheaded by the
Umsobomvu Youth Fund, which was established in 1998. The Umsobomvu Youth Fund
is an agency created by government to fund skills development and employment creation
for young people. Of significance to developing small- and medium-scale business skills
for young people, the fund has, as part of its work, created a special micro-loan initiative
for young entrepreneurs, a venture capital fund, and a voucher programme for access to
business development services (Department of Education, 2004).
Although it is widely acknowledged that South Africa’s SMME support infrastructure,
which was non-existent in the pre-1994 period, has planted the seeds for sustainable and
employment-creating SMME development (see for example Qualmann, 2000: 43; ICC,
1999: 7), available assessment studies suggest that these new SMME policies have
generally not been truly effective. According to Berry et al (2002), this is mainly
attributed to the fact that these new institutions suffer from sub-optimal implementation,
as a result of the following key factors100:
• Lack of awareness of the existence of SMME support initiatives;
• Uneven distribution of services;
• High search costs of service provision;
• Cumbersome administration and discontinuity of programmes
In line with the above, the contribution of the SMME economy to national employment
growth rates remains low. What is even more of a concern is the fact that, contrary to
what is evident in other developing countries, the employment generated in the SMME
economy does not result from the expansion of more established and larger SMMEs.
Instead, it is mainly generated by the formation of new micro- and survival enterprises,
which show no signs of enterprise growth (Berry et al, 2002; Kesper, 2001: 177, cited in
Rogerson, 2004). This finding was reinforced by the World Bank’s detailed research in 100 For detailed information on these, see Berry et al (2002)

149
Johannesburg, which showed conclusively that net employment growth in the SMME
economy was accounted for by the arrival of new firms (Chandra et al, 2001). However,
given the sheer size of the micro-enterprise and informal economy, and the fact that many
of those involved are mainly female heads of households and rural families who are
struggling to survive, it is worth noting that the sector plays a particularly important role
in terms of income generation and poverty alleviation (Dorfling, 2001; Rogerson, 1999;
Kesper, 2002). As a matter of fact, the recently established South African Microfinance
Apex Fund (SAMAF) aims to buttress this trend by providing loans of up to R10 000 to
households and micro-entrepreneurs, who depend on micro-enterprises for their
livelihood. Mafisa (i.e. agricultural credit scheme) is another newly established institution
that is mainly targeted at providing assistance to poor entrepreneurs who reside in the
former homeland areas (Aliber et al, 2006).
5.3.3. Special pro-employment programmes: public works programmes
Although creating jobs via the abovementioned channels is usually desirable, in the sense
that these various mechanisms engender, at least in theory, sustainable jobs that are not
dependent on government, the reality is that job creation through these mechanisms
usually takes protracted periods of time before any significant results are evident.
Moreover, some of these mechanisms (e.g. the various structural adjustments that are
usually undertaken to achieve macroeconomic stability) can, at least in the short-term,
actually lead to an increase in unemployment, particularly among the unskilled (see
section 3.4.1).
Given this context, as well as the fact that the dominant economic paradigm in South
Africa places ideological constraints on a number of policy options (such as direct
transfers in the form of basic income grants) that can be utilised to offset the
shortcomings of the abovementioned policies, the government was compelled to
supplement its various long-term, pro-employment policies with economically efficient
employment-creating schemes, such as the public works programmes (PWPs). Although
the PWPs are not necessarily sufficient to solve South Africa’s unemployment problem,

150
they are nevertheless of significance to poverty alleviation, in the sense that they provide
momentary relief (in the form of short-term employment/income) to the jobless, would-
be workers who are poor. What makes PWPs even more relevant in the South African
context is the fact that they sidestep the issue of low skill levels (which is often the reason
why most poor people fail to secure long-term employment), in the sense that they are
specifically aimed at providing poverty-alleviating jobs to unskilled, able-bodied adults
(Phillips, 2004).
In essence, PWPs do not only serve as palliatives by way of providing short-term income
to the poor, but also attempt to enhance the human capital of those who participate in
them. Among other things, this explains why PWPs have enjoyed considerable policy
prominence in the post-1994 era. Significantly, in 1997, the government announced a
R 300 million Poverty Relief Fund101, which the Minister of Finance, Trevor Manuel,
described as an attempt to extend the social security net to the unemployed (Business
Day, 1997, cited in Barker, 2003). Since its inception, this fund has focused on financing,
among other things, the following labour-intensive projects (RSA, 1998, cited in Barker,
2003):
• Clean Cities Campaign (the delivery of waste services to poorly serviced areas)
• Working for Water (clearing invasive alien vegetation)
• Coastal Care
• Land Care Campaign (rehabilitation and conservation of natural resources)
• Municipal Infrastructure Programme (for low-income areas)
• Welfare programmes (which offer training, education and other opportunities for
the destitute)
• Community-Based Public Works Programmes (CBPWP) (primarily in rural areas)
• Arts and Culture poverty relief projects.
101 This fund has since been further capitalised by the central government. For example, an additional R 598 million went into this fund in 1998/99 (Aliber, 2001).

151
What is worth noting about these projects is that, with the exception of the Department of
Water Affairs’ Working for Water programme, which has created about 38 000 jobs that
have mainly benefited women (Hunters et al, 2003), these other programmes are
considerably smaller than the CBPWP. At its peak, the CBPWP was allocated
approximately R350 million per annum, and the programme resulted in the creation of
approximately 130 000 job opportunities between 1998 and 2004 (Phillips, 2004).
In addition, a number of provinces and municipalities have also initiated their own PWPs.
Two of the most notable examples in this regard include the Gundo Lashu Programme in
Limpopo, which was initiated in 2001, as well as the Zibambele Programme in KwaZulu
Natal, which was initiated in 2000. The former involved the upgrading of district roads,
which was to be done by 24 small, aspirant contractors (of whom 13 were women), under
the supervision of high-level supervisors. The 2003/4 budget for the programme was R50
million, and it is achieving a 600% increase in employment creation, compared to similar
conventional, machine-intensive road works, without increasing the overall cost per
kilometre of road upgraded. For each project, the contractors employ between 60 and 100
local workers. On average, 51%, 58% and 1% of these workers have been women, youth
and disabled respectively. Moreover, all the workers are provided with both on-the-job
training and formal training, funded by the Department of Labour (Phillips, 2004). The
Zibambele Programme, on the other hand, entails carrying out routine maintenance on the
province’s rural access road network, and providing poor rural households, which have
no other source of income, with a regular income. In 2002/3, there were approximately
10 000 Zibambele contractors carrying out routine maintenance on approximately one-
third of the KwaZulu Natal rural access road network. The Department planned to extend
the number of contractors to 14000 by the end of the 2002/3 financial year, and
ultimately, to a maximum of 40000 poor households. The budget for Zibambele in
2002/3 was R56 million (Phillips, 2004).
Against the background that the PWPs have been reasonably successful in creating
poverty-alleviating job opportunities, the government has sought to fortify this policy
option by launching the Expanded Public Works Programme (EPWP) in all provinces by

152
the beginning of September 2004. In its first five years, this programme is expected to
create at least one million poverty-alleviating job opportunities in the following sectors:
• Infrastructure (increasing the labour intensity of government-funded infrastructure
projects)—R15 billion has been allocated to this sector;
• Environment (creating job opportunities in public environmental improvement
programmes)—R4 billion has been set aside for this sector;
• Social (creating job opportunities in public social programmes, e.g. home-based
care workers and early childhood development workers) —at least R600 million
has been allocated to this sector; and
• Economic (e.g. income-generating projects and programmes to utilise government
expenditure on goods and services, in order to provide the work experience
component of small enterprise learnership / incubation programmes).
Once created, these work opportunities are, in turn, expected to draw significant numbers
of the unemployed into productive work, so that workers gain skills while they work and
increase their capacity to earn an income (Phillips, 2004; Desai, 2005). In essence,
similarly to the PWPs, the objective of the EPWP is to utilise public sector budgets to
alleviate unemployment, by creating temporary productive employment opportunities
coupled with training.
Fortunately, available evidence suggests that this newly initiated EPWP will improve on
the record that has been set by the abovementioned PWPs. Thus far, the EPWP has been
surpassing all employment creation targets, with more than 220 000 employment
opportunities created in the first year, and an additional 60 000 in the first quarter of the
second year (Skweyiya, 2006). There are also indications that this programme will have a
positive impact on developing the skill base of the poor. For instance, the Vuk’uphile
Learnership Programme has already grown from the initial target of 500 learnerships to
1971 (Skweyiya, 2006).

153
5.4. Ameliorating the livelihood of the poor by enhancing their access to basic
services or needs
Providing the poor with proper houses, as well as enabling them to access basic services
such as clean water, sanitation, electricity, primary healthcare and basic education102, can
also go a long way towards improving their livelihood. This is because, although the
foregoing policy option does not necessarily enhance the income of the poor, it can,
nevertheless, have a major impact on their quality of life, thus leading to improvements
ranging from health to productivity (Van der Berg, 1999; Leibbrandt et al, 2004). In light
of this, it is therefore understandable that enabling the needy to meet their basic needs has
been given prominence during the post-apartheid era103. The main policy framework
through which this has been done is the Reconstruction and Development Programme
(RDP) of 1994. Under this policy, the government funded the capital costs of new
services infrastructure, while the users covered operational and maintenance costs—a
financial division that applies in many other countries.
Accordingly, this sub-section seeks to briefly discuss some of the key RDP-related policy
programmes which have been initiated for the purposes of delivering the aforementioned
basic needs to the poor.
(i) Programmes that are aimed at providing adequate shelter for the poor
Responsibility for facilitating shelter provision for the poor in South Africa lies with the
Department of Housing. The key mechanism for achieving this has been the Housing
Subsidy Scheme that was started in 1994, following negotiations initiated by the National
Housing Forum. Through this mechanism, the Department of Housing managed to
deliver about 1 883 548 subsidised houses between 1994 and September 2005, although
the housing backlog continues to grow (Department of Housing, 2006). The Government
102 Basic education is defined as pre-primary and primary education (Hunter et al, 2003). 103 It is worth noting that access to some of these basic services or needs (e.g. access to clean water, health care facilities and housing) is guaranteed in the constitution (see the Bill of Rights in the South African Constitution).
154
Capital Housing Subsidy is available to South African citizens who are over 21 years old,
married or living with a long-term partner, and who have dependants, have not owned
property before, and whose income is below R 3 500 per month. Four main types of
subsidies have been applied (see Table 5-4):
• Individual Subsidies: The individual subsidy programme gives qualifying
beneficiaries access to a subsidy in order to acquire ownership of existing
property or property not located in a project approved by provincial housing
development boards.
• Project-linked Subsidies: These subsidies provide housing opportunities for
individuals on an ownership basis within housing projects approved by provincial
development boards and constructed by developers. Most subsidies have gone to
this programme.
• Consolidation subsidies: People who, before the inception of the Housing
Subsidy Scheme, received housing assistance from the state in the form of
serviced sites, can apply for a further benefit from the state to improve their
housing situation by building a structure on the site or upgrading an existing one.
• Institutional subsidies: These subsidies are available to institutions that create
affordable housing stock, in order to enable persons who qualify for individual
ownership subsidies to live in subsidised residential properties with secure tenure.
However, in order to meet the housing challenge of the poor majority, who in most cases
do not have a regular income, and to make them eligible for the subsidies, the
government has initiated the People’s Housing Process, which focuses mainly on the
efforts of poor communities to improve their living conditions. This initiative is based on
the fact that people have always built their own houses by applying the vast wealth of
traditional know-how. The Capacitation Programme of the government, which is funded
by UNDP, USAID and the government, and executed by UNCHS (Habitat), aims at
building the capacity of, and supporting, poor communities to improve their living
conditions. Through a collaborative effort, the programme has concentrated on
(Kithakye, 2001):
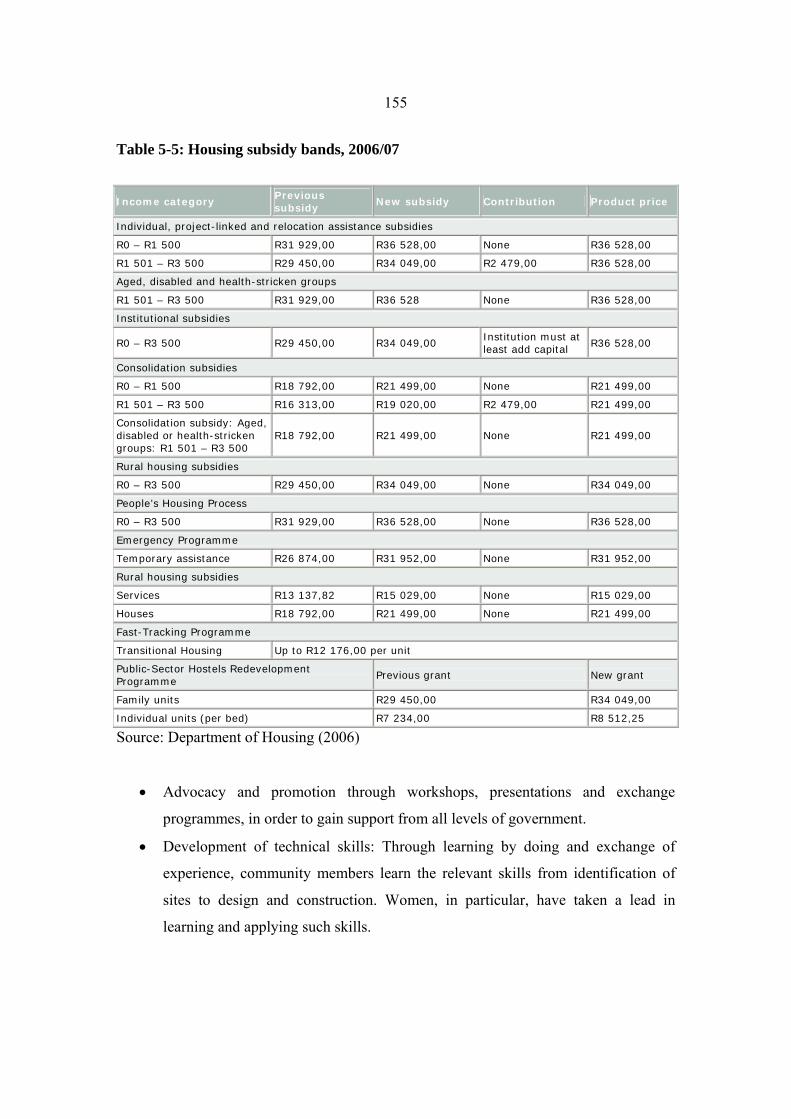
155
Table 5-5: Housing subsidy bands, 2006/07
Income category Previous subsidy
New subsidy Contribution Product price
Individual, project-linked and relocation assistance subsidies
R0 – R1 500 R31 929,00 R36 528,00 None R36 528,00
R1 501 – R3 500 R29 450,00 R34 049,00 R2 479,00 R36 528,00
Aged, disabled and health-stricken groups
R1 501 – R3 500 R31 929,00 R36 528 None R36 528,00
Institutional subsidies
R0 – R3 500 R29 450,00 R34 049,00 Institution must at least add capital R36 528,00
Consolidation subsidies
R0 – R1 500 R18 792,00 R21 499,00 None R21 499,00
R1 501 – R3 500 R16 313,00 R19 020,00 R2 479,00 R21 499,00
Consolidation subsidy: Aged, disabled or health-stricken groups: R1 501 – R3 500
R18 792,00 R21 499,00 None R21 499,00
Rural housing subsidies
R0 – R3 500 R29 450,00 R34 049,00 None R34 049,00
People’s Housing Process
R0 – R3 500 R31 929,00 R36 528,00 None R36 528,00
Emergency Programme
Temporary assistance R26 874,00 R31 952,00 None R31 952,00
Rural housing subsidies
Services R13 137,82 R15 029,00 None R15 029,00
Houses R18 792,00 R21 499,00 None R21 499,00
Fast-Tracking Programme
Transitional Housing Up to R12 176,00 per unit
Public-Sector Hostels Redevelopment Programme
Previous grant New grant
Family units R29 450,00 R34 049,00
Individual units (per bed) R7 234,00 R8 512,25
Source: Department of Housing (2006)
• Advocacy and promotion through workshops, presentations and exchange
programmes, in order to gain support from all levels of government.
• Development of technical skills: Through learning by doing and exchange of
experience, community members learn the relevant skills from identification of
sites to design and construction. Women, in particular, have taken a lead in
learning and applying such skills.

156
• Streamlining operational procedures in the delivery of land, finance and
infrastructure: The poor have demonstrated that they can contribute substantially
to the process of acquiring land, as well as the development and cost of their
housing. Through the uTshani Fund, managed by the People’s Dialogue, members
of the South African Homeless People's Federation have, without government
subsidy, developed better and cheaper housing.
• Facilitation and promotion of housing support centres/initiatives: The support
centres have become the knowledge bases and learning sites of the community.
• Assistance to local organisations (NGOs and CBOs): The process recognises the
role of organised, community-based structures and non-governmental
organisations as key movers in the process.
In addition to these strategies, the government has also formulated an affordable rental-
housing programme for people in the low-income bracket. Furthermore, the Department
of Housing also enables low-cost housing by mobilising housing credit for beneficiaries
and builders through the:
• National Housing Finance Corporation (NHFC), which provides wholesale capital
for intermediaries lending to the target group; and
• The National Urban Reconstruction and Housing Agency (NURCHA), which
provides guarantees for the housing development sector, in order to ensure access
to capital.
It is worth noting, however, that, although much of the focus has been on housing
delivery targets, the housing programme in South Africa has also focused on the needs of
special groups. In recognition of the special needs of disabled persons, government has
approved additional funding, in addition to the normal subsidy amount, in order to
provide for modifications to houses where beneficiaries or members of their household
are disabled (Department of Housing, 2006).

157
(ii) Programmes that are aimed at enabling the poor to access electricity/energy
Ensuring that the poor have access to reliable and affordable energy is a responsibility
that lies with the Department of Minerals and Energy. The flagship programme through
which this department has sought to achieve the foregoing is the Integrated National
Electrification Programme (INEP). By mid-2006, as many as 3 346 425 homes had been
electrified since the inception of the INEP. Most of these homes, particularly those that
are owned by the poor, have been installed with the pre-paid electricity system
(Department of Minerals & Energy, 2006).
Unfortunately, towards the late 1990s, it became clear that the poorer people could not
keep up with the high running costs of the various RDP-related schemes (including the
electricity-related scheme), thus rendering these schemes inadequate to ensure that the
poor were not denied access to the various basic services. In response to this, the
government introduced a policy of free basic services, including electricity. As part of
this policy, the National Electricity Basic Services Support Tariff Policy was formulated
(and then gazetted in July 2003). The aim of this policy is to bring relief, through
government intervention, to low-income households that are connected to the national
electricity grid, and to ensure optimal socio-economic benefits from the INEP. Qualifying
customers are eligible for 50 kilowatt-hours (kWh) of free electricity per month—50kWh
per month is considered adequate electrical energy to meet the needs for lighting, media
access, limited water and basic ironing (or cooking) of the poor. Once this limit of
50kWh has been reached, normal tariff rates apply. Eskom is the service provider of free
basic electricity in its areas of supply (Department of Minerals & Energy, 2006).
In addition to this, the Department of Minerals and Energy has also made life easier for
the poor by removing the value-added tax levy on paraffin (the poor often use paraffin as
an alternative source of energy) (Department of Minerals & Energy, 2006).

158
(iii) Programmes that are aimed at enabling the poor to access clean water and
sanitation
In 1994, the Department of Water Affairs and Forestry was charged with, among other
things, the responsibility of ensuring that all South Africans had equitable access to water
supply and sanitation. To achieve this, in 1994, this department established the
Community Water Supply and Sanitation Programme (CWSS), which is now the
responsibility of the Department of Provincial and Local Government (as of 2002)
(Department of Water & Forestry, 2006). This programme is particularly biased towards
the poorest and most vulnerable people, who have in the past been left to fend for
themselves with minimal or no support from government. These are the people who are
found in the rural and fringe areas, which, as a legacy of apartheid, were not catered for
(Water & Sanitation Programme—Africa Region, 2002).
Following the introduction of the policy of free basic services, the focus of water and
sanitation services was further broadened, so as to ensure that the poor are not denied
access to such services. In terms of water services, a revised water tariff structure, which
included 6 ‘kilolitres’ (cubic metres) of free water per month (about 40 litres/capita/day
for a family of five), was proposed in July 2001. However, putting the policy of free
basic water into practice proved a challenge. As such, the policy is only being
implemented gradually, and within the means of each municipality. Municipalities decide
if free basic water is to only be made available to the poor, and how the poor will be
defined and identified, or if it will be granted to all water users (Department of Water
Affairs & Forestry, 2006).
With regard to further broadening access of the poor to sanitation, the government has
committed itself to, among other things, eradicating all bucket sanitation systems in
established settlements by December 2007. To facilitate this, in its 2001 White Paper on
Sanitation, the government called for infrastructure grants to municipalities, in order to
finance investments in sanitation. Correspondingly, in 2006/07, R 1.2 billion out of the
159
Municipal Infrastructure Grant (MIG)104 Programme for the water services budget was
set aside for the implementation of sanitation. In 2006 alone, R 400 million was allocated
to bucket system eradication. In order to meet the 2010 target of universal access to basic
sanitation, about R 3 billion is required per year to increase the sanitation target from 300
000 units in 2006 to one million toilets a year (Department of Water Affairs & Forestry,
2006).
What is noteworthy about the above initiatives is that the available evidence suggests that
that they are effective. Significantly, in its annual report for the year 2004/5, the
Department of Water Affairs and Forestry reported that 44.4 million out of a total of 48.1
million people (92%) have access to improved water supply infrastructure, although 5.4
million of these were below the RDP standard (mainly in terms of distance to source).
This report also found that 32.1 million out of a total of 48.1 million people (67%) have
access to some form of improved sanitation facility (Department of Water Affairs &
Forestry, 2004-2005).
(iv) Programmes that are aimed at enabling the poor to access healthcare
facilities
The Department of Health is responsible for, among other things, ensuring that the
healthcare needs of the poor are catered for. Furthermore, through a variety of health-
related programmes (most notably the Clinic Upgrading and Building Programme of
1994 and the Ten-Point Plan of 1999), which are based on a primary healthcare approach,
this department has sought to prioritise the healthcare needs of the poor, by bringing
healthcare facilities closer to poverty-stricken rural areas and other historically
underserved areas. In order to ensure that the poor are able to access these facilities, the
government, in 1994, initiated a policy of free healthcare for children under the age of six
years and pregnant women. In 1996, this service was buttressed by the introduction of
free primary healthcare for all South African citizens. These respective initiatives have, in
104 The MIG is a conditional grant from national government to local government, in order to support investment in basic municipal infrastructure to eradicate backlogs, and was implemented in April 2004.
160
turn, led to, among other things: (i) 73% of South African children being fully immunised
(this is a significant increase, considering that this figure has been hovering around 63%
for years) (Department of Health, 2002, cited in the 2003 Human Development Report),
and (ii) a gradual increase in public healthcare usage, from 67.8% in 1995 to 69.4% in
1999 (i.e. based on the OHS of 1995 and 1999).
In addition to the above, health services and certain medications (e.g. light pain killers)
are subsidised. Furthermore, the government has also initiated a number of measures to
counter the inability of most poor people to afford expensive medical treatment for
diseases such as HIV/AIDS, tuberculosis (TB) and pneumonia. The most notable
programme that has been initiated to this end is the HIV/AIDS anti-retroviral programme
(Human Development Report, 2003). What is discouraging, however, is that, in spite of
these respective initiatives, more and more people are dying of unnatural causes such as
HIV/AIDS, TB and pneumonia. Significantly, in 2001, males in the 15–39 age group
experienced the highest mortality from unnatural causes, while a high number of female
South Africans in the same age category died primarily as a result of HIV infections.
Among infants and young children, influenza and pneumonia were the leading causes of
death. The foregoing (particularly HIV/AIDS-related deaths) has, in turn, led to a decline
in the life expectancy in South Africa. For instance, between 1995 and 2002, life
expectancy at birth is estimated to have declined by 16.3%, from 61.4 to 51.4 years
(Human Development Report, 2003). KwaZulu-Natal is among the most affected
provinces in this regard.
In addition, the government has devised a more comprehensive nutrition strategy for
South Africa, in comparison to that of the old regime, which is divided into three broad
areas of activity, namely: (a) a health facility-based nutrition programme105; (b) a
community-based nutrition programme106; and (c) a nutrition promotion programme107.
105 This programme incorporates the Protein Energy Scheme, nutrition education, growth monitoring and promotion, management of infectious diseases, and the in-patient management of severe malnutrition. 106 This programme includes the Primary School Nutrition Programme and aims to strengthen household food security, improve knowledge and behaviour regarding nutrition, support the care of women and children, and promote a healthy environment.

161
This strategy is formally known as the Integrated Nutrition Programme (INP). The INP is
different, in that it emphasises the need to address all the causes of malnutrition, and
stresses that in order to achieve this, all sectors need to work in an integrated manner.
The particular target groups of the INP include children under 6 years, at-risk pregnant
and lactating women, primary school children from poor households, persons suffering
from chronic diseases of lifestyle or communicable diseases, and at-risk elderly persons
(Department of Health, 2006). Unfortunately, this programme has not reached its target
and is characterised by under-spending. Significantly, the ratio of children benefiting
from School Feeding Schemes, as opposed to the target, has ranged between 80% and
89% since inception (Wildeman & Mbebetho, 2005). Furthermore, several households
still go hungry every day, due to lack of money to purchase food. About 11% of all
households with children under 7 years old went hungry in 1999, due to this factor.
Another 2.3 million households with members aged 7 years and older could not afford to
purchase food and consequently went hungry in 1999 (Bonti-Ankomah, 2001).
(v) Programmes that are aimed at enabling the poor to access basic education
In order to ensure that poor adults are able to send their children to school, the
government has, based on its RDP commitment of providing free and compulsory 10-
year education, designed its education policy in such a way that school fees are set at
annual public meetings of School Governing Bodies (SGBs), where parents vote on the
amount to be paid. Parents who cannot afford to pay, or who can only afford a lesser
amount, are granted an exemption or reduction in fees. As a result of this (and more), by
September 2006, 2.6 million pupils were attending 7 000 primary and secondary schools,
where school fees were not paid (Department of Education, 2006).
Furthermore, in an attempt to transform the public school system, thus making it more
conducive to learning, government has also sought to improve the delivery of basic
services such as the delivery of learning material, improved access to water and
107 This programme focuses on improving communication, advocacy and appropriate legislation in support of good nutrition. Some priority areas for this programme include promotion and protection of breastfeeding, marketing of infant foods and food fortification.

162
sanitation, electricity, telephones, improved classrooms and so on. As a result, schools
without telephones decreased from 59% (1996) to 36.4% (2000); the percentage of
schools without running water decreased from 34% to 27%; the percentage of students
without access to proper toilet facilities declined from 55% (6.6 million students in 1996)
to 16% (1.9 million students in 2000); access to electricity improved from 40% to 54.9%
in all schools, and the number of schools with computers increased from 2 241 to 6 581
(Human Development Report, 2003).
(vi) The Integrated Sustainable Rural Development Programme (ISRDP) and The
Urban Renewal Project (URP) Nodes
To further intensify efforts that are aimed at improving the livelihood of the poor, in his
2001 State of the Nation address, President Mbeki identified 21 areas that are in dire need
of development. These areas, referred to as development nodes, contain a population of
over 10 million people and share similar characteristics of high levels of poverty and
unemployment, low levels of investment, inadequate infrastructure and a
disproportionately low level of development of human resources. These areas contain the
largest proportion of the poor population and are structurally disconnected from the rest
of the economy, forming a significant part of the ‘second economy’ (Department of
Trade and Industry (DTI), 2006).
The president also announced two programmes in his 2001 State of the Nation address,
which would subsequently be targeted at stimulating economic development and
reducing poverty in the 21 development nodes across the country. These programmes are
the Urban Renewal Project (URP) and the Integrated Sustainable Rural Development
Programme (ISRDP). The ISRDP, with some 13 rural nodes, and the URP, with eight
urban nodes, were designed as part of ‘a sustained campaign against rural and urban
poverty and underdevelopment, bringing in the resources of all three spheres of
government in a coordinated manner’. These programmes, to run over a period of ten
years, are being implemented through the intergovernmental mechanism involving the

163
three spheres of government: (national, provincial and local), with each sphere playing a
distinct role (DTI, 2006).
Sadly, the results attained through these two programmes have generally been limited,
and, therefore, more concerted and focused action is clearly called for. Likewise, the
poverty interventions through the ISRDP have not been as effective as initially hoped,
and many nodes have yet to attain their potential (DTI, 2006).
5.5. Ameliorating the livelihood of the poor by providing them with a social safety
net system
The government has also sought to improve the livelihood of the previously
disadvantaged majority, by introducing a social security system that caters for all people
regardless of race, gender and physical disability. Similarly to that of the apartheid
regime, occupational insurance and social assistance are the two main pillars of this new
social security system. Occupational insurance involves, among other things, worker-
financed schemes, which are governed by statutes and regulations. Social assistance, on
the other hand, entails endeavours made by government to cater for those who are not
covered by occupational insurance, on a means-tested basis (Aliber, 2001).
This sub-section seeks to discuss exactly how these respective measures are meant to
influence the prevalence of poverty in South Africa. With regard to occupational
insurance, the focus will be on the worker-financed unemployment insurance fund (UIF).
In terms of social assistance, the focus will mainly be on social grants (in the form of old
age pensions, disability grants, child support grants and so on), as well as other poverty
relief programmes (e.g. School Nutrition Programme, Social Relief of Distress
Programme, Disaster Relief Programme and the Food Relief Programme) that provide
cash or in-kind benefits for the destitute.

164
(i) Occupational insurance: UIF
As is the case in most countries, the UIF strives to contribute to the alleviation of poverty
in South Africa, by providing short-term income relief to contributors when they become
unemployed or are unable to work because of illness, maternity or adoption of small
children. In addition, this fund also provides relief to dependants of deceased
contributors. Persons excluded from the fund include some categories of civil servants,
persons working less than 24 hours per month, persons in learnerships, and of course
persons working in the informal sector. Similarly, those who have never contributed to
the fund, such as new entrants to the labour market, and persons whose benefit period has
run out, do not enjoy benefits in terms of the Unemployment Insurance Act (Department
of Labour, 2004; Barker, 2003). The UIF benefits extend for six months following
retrenchment, at a level of 40% of one's salary (Aliber, 2001).
(ii) Social assistance: Social grants
Given the fact that the government inherited a country that is characterised by a high
unemployment rate in the formal sector, conventional wisdom would suggest that the UIF
is bound to have a modicum impact on the livelihood of the poor. As a matter of fact,
available evidence shows that the unemployment insurance fund covers less than 40% of
the labour force at any particular point in time, and offers benefits to less than 6% of the
unemployed (see for example Coleman et al, 2002). Hence, government also provides
income relief, in the form of social grants, to certain categories of people who are not
covered by the various social insurance measures (see Table 5-5). This system of social
grants was inherited from the apartheid government’s set of programmes.
According to the Social Assistant Act, the people who are eligible for these grants
include the following (Department of Social Development, 2006):
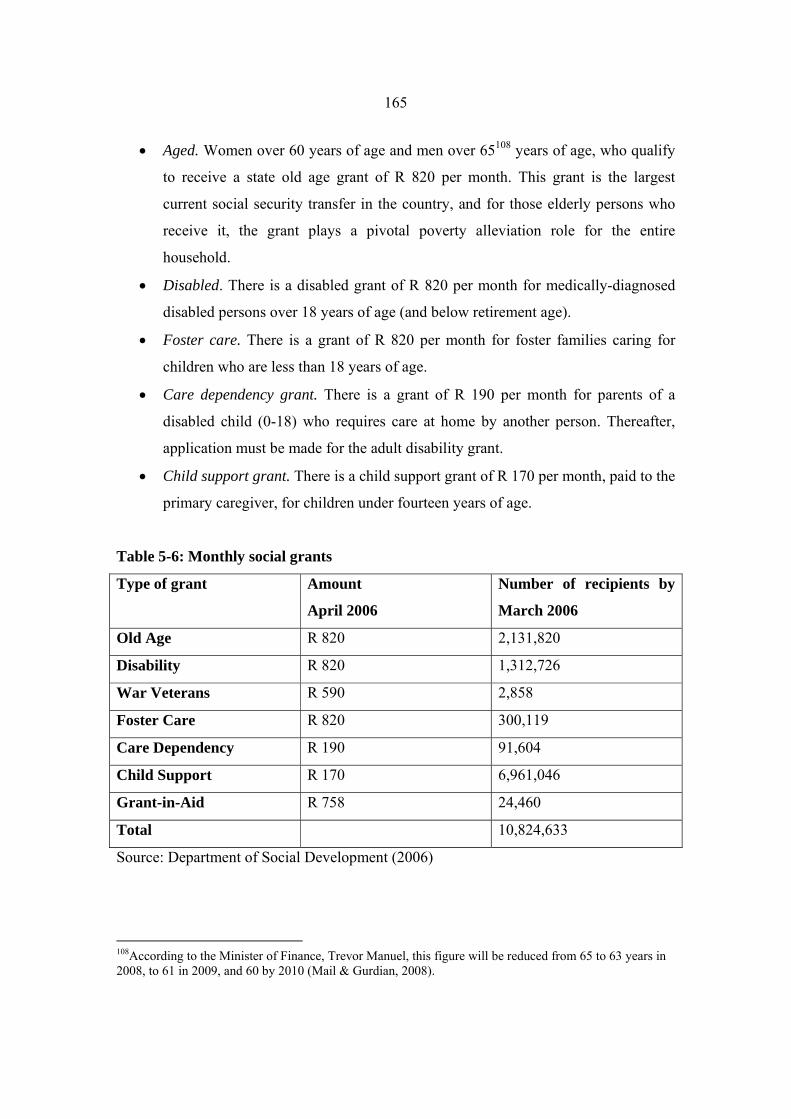
165
• Aged. Women over 60 years of age and men over 65108 years of age, who qualify
to receive a state old age grant of R 820 per month. This grant is the largest
current social security transfer in the country, and for those elderly persons who
receive it, the grant plays a pivotal poverty alleviation role for the entire
household.
• Disabled. There is a disabled grant of R 820 per month for medically-diagnosed
disabled persons over 18 years of age (and below retirement age).
• Foster care. There is a grant of R 820 per month for foster families caring for
children who are less than 18 years of age.
• Care dependency grant. There is a grant of R 190 per month for parents of a
disabled child (0-18) who requires care at home by another person. Thereafter,
application must be made for the adult disability grant.
• Child support grant. There is a child support grant of R 170 per month, paid to the
primary caregiver, for children under fourteen years of age.
Table 5-6: Monthly social grants
Type of grant Amount
April 2006
Number of recipients by
March 2006
Old Age R 820 2,131,820
Disability R 820 1,312,726
War Veterans R 590 2,858
Foster Care R 820 300,119
Care Dependency R 190 91,604
Child Support R 170 6,961,046
Grant-in-Aid R 758 24,460
Total 10,824,633
Source: Department of Social Development (2006)
108According to the Minister of Finance, Trevor Manuel, this figure will be reduced from 65 to 63 years in 2008, to 61 in 2009, and 60 by 2010 (Mail & Gurdian, 2008).

166
Contrary to the 1994 racial-based social grants that were only distributed to about 2.6
million recipients109, in 2006, some 10 million people received social grants (Department
of Social Development, 2006). What is also worth noting is that the increase in real value
of these grants has surpassed the rate of inflation. Furthermore, the government has
recently decided to extend child support grants to the age of 14. In 1993, there were 13
disability grants per 1,000 South Africans, compared with 29 per 1,000 in 2006. This is
largely attributed to the fact that government, working with NGOs, has embarked on a
campaign to ensure that all people eligible for social grants, especially children, are
registered and thus receive the grants to which they are entitled (Knight, 2006).
(iii) Other poverty relief programmes: School Nutrition, Social Relief of Distress,
Disaster Relief and the Food Relief Programme
In addition to social assistance grants, there are also a number of short-term poverty relief
programmes which provide cash or in-kind benefits for the destitute. As has already been
noted, these include the School Nutrition Programme that is administered by the
Department of Education, the Social Relief of Distress and Disaster Relief programmes
that are administered by the Department of Social Development, and a more recent Food
Relief Programme, administered collaboratively by the departments of Social
Development, Agriculture and Health (Hunter et al, 2003).
• School Nutrition Programme. As has already been suggested above, the school
nutrition programme (now known as the Integrated Nutrition Grant) was initiated
for young primary school children who are food-deprived, thus enabling them to
participate fully in their own educational development.
• Social Relief of Distress Programme. This is a temporary provision of assistance
intended for persons in such dire material need that they are unable to meet their
or their families’ most basic needs. It is issued monthly for a maximum period of
109Of these, over 1.6 million were older people and only 60,000 were children, who were predominately from the White, Coloured and Indian communities.

167
three months. In exceptional circumstances, the extension of the period by a
further three months may be granted (Department of Social Development, 2003).
• Disaster Relief Programme. Disaster relief provides direct income or in-kind
support to victims of declared natural disasters.
• The Special Programme for Food Security. This programme was a preparatory or
pilot programme which aimed to inform a larger joint initiative, and had the
objectives of improving household food security for the resource poor in rural and
peri-urban areas through the demonstration of technologies to increase food
production and the income of small-scale farmers (CICSSS, 2001). To mitigate
the food crisis experienced in 2002, and to counter rising food prices in the latter
part of that year through conditional grants, provincial social development
departments, in collaboration with development agencies and relief organisations,
implemented a food relief programme that focused on social facilitation and food
parcels to the most vulnerable. This direct provision of food will be
complemented by the support of food production in poor households through
production starter packs and community production centres. The direct provision
of food provides short-term support to households, and processes are activated to
then link them to other mechanisms for poverty relief such as food production,
social grants and income-generating projects (National Treasury, 2003).
5.6. Ameliorating the livelihood of the poor by enhancing their asset base
As has already been indicated in section 3.3.1, physical assets, most notably arable land,
which the majority of Blacks relied upon for income, were largely eroded during the
colonial/apartheid era. Not surprisingly, among other things, this had disastrous economic
consequences for the majority of blacks, especially for those who failed to secure fruitful
employment in the labour market. Hence, there was an upsurge in the number of Black
people who were vulnerable to poverty, following the arrival of settlers and the genesis of
the apartheid era. What is even more of a concern is that this status quo was passed on
from one generation to the other. Thus, poverty is still concentrated among the Black
majority.

168
In an attempt to address this problem, the democratically elected government has
accordingly devised measures that have sought to assist the poor to accumulate
productive assets. These measures include, among other things, enabling the poor to
access productive land and houses, the latter of which would provide the owners with an
opportunity to generate rental income. These two respective measures will be discussed
here.
(i) Enabling the poor to access productive land
As has been argued by Hunter et al (2003), for most poor people, particularly those who
reside in rural areas, when landlessness is combined with joblessness, limitation in terms
of income-generating alternatives is the result. This is especially so since, although
agricultural production makes a small contribution to household income for those who do
have access to land, over one-third of rural households continue to engage in agricultural
production, thus making it the third most important means of livelihood in rural areas
after remittances and wages from low-skilled jobs (Hunter et al, 2003). This explains
why the government implemented the Land Reform Programme in 1994, which paid
particular attention to the interests of the rural poor, especially women. According to
Aliber (2001), this programme, introduced by the Department of Land Affairs, comprises
three main areas: restitution, whereby people seek restoration of land from which they
were forcibly removed (or an equivalent redress); redistribution, whereby other people
desiring to own or access land are provided with an opportunity to do so, with the
assistance of government financing; and tenure reform, involving the introduction of
more secure forms of land-holding among previously disadvantaged people who already
access land.
As of the end of 2001, less than 2% of land had changed hands from White to Black
through the land reform programme, and long-awaited legislation to improve the tenure
security of people living in the former Bantustans in terms of the state’s Section 25 (6)
obligations had yet to be passed. Of the 68, 878 restitution claims received, only 12,678

169
had been settled, benefiting less than 40 000 predominantly urban households, more than
40% of which received monetary compensation instead of land restoration. The urban
bias of restitution delivery also means that this programme has so far done little to
transform rural property relations, with most rural restitution claims still outstanding
(Thwala, 2003). Moreover, the government has admitted to a significant degree of failure
in achieving the sustainable agricultural development of rural communities benefiting
from land reform policies. In fact, according to the Department of Land Affairs (2008,
cited in Business Day, 2008), the failure rate could be as high as 50%.
(ii) Enabling the poor to access houses, which can in turn be utilised as
productive assets
According to Moser (1996: 09), housing is a key asset for the poor, and can provide more
than a place of shelter and a space for living. As an asset, a home is a potential source of
income (for example, rooms can be rented), can serve as security for loans and as a place
of work, thus providing women in particular with opportunities for economic activity. In
essence, secure housing is essential for poverty reduction, in the sense that it can also
serve to cushion the poor against the crushing impacts of poverty. For the various
government efforts that have been initiated to ensure that the poor can access this
productive asset, see section 5.4 (i) above.
5.7. Has South Africa’s general approach towards poverty reduction been effective
thus far?
In hindsight, it is quite clear that, while meaningful progress has been made in enabling
the previously disadvantaged majority to gain access to reasonably equipped education
and healthcare facilities, adequate housing structures, as well as basic services110, a lot
more still needs to be done to diminish the prevalence of poverty in South Africa. The
latest poverty estimates suggest that the number of poverty-stricken people in South
110 For a detailed progress report on this, see Leibbrandt et al’s (2004) analysis of both the 1996 and 2001 censuses.

170
Africa still remains unacceptably high. Significantly, according to the Presidency, when
using a poverty line of R 250 per month, the number of South Africans who were living
in poverty in 2006 were estimated at approximately 43.2% - that is, a marginal decline
from 44.5% in 2005, 50.8% in 2000 and 53.1% in 1996 (Office of the President, 2007).
Given the aforementioned, it is only natural to ask the question: “are the various anti-
poverty strategies that are espoused by the government out of kilt with international best
practices, and thus inadequate to address the socio-economic imbalances that continue to
characterise South Africa?” When comparing South Africa’s poverty reduction policies
to those of international best practices, it is quite clear that, in general, South Africa’s
strategies are not necessarily out of kilt with salient international practices (see Tables 5-
1 & 5-2). Instead, the government’s inability to significantly reduce poverty is largely
attributed to the following reasons:
• Many of the distortions and dynamics introduced by apartheid are self-
perpetuating, and thus continue to, among other things, reproduce poverty. For
example, most people who are a product of ‘Bantu’ education continue to struggle
to find gainful jobs (in an economy that is mostly creating jobs that require
advanced skills).
• Due to, inter alia, the shortage of skilled labour in the country, the government
has ill-equipped administrators at the municipal level to effectively implement
some of its key poverty reduction strategies. This has resulted in key projects,
such as the land reform programme, not taking off at the desired rate (thus
limiting the economic opportunities of poor people in the rural areas).
• What is also noteworthy is that when China, Vietnam and Uganda initiated their
various economic reform programmes, their gini-coefficients were significantly
lower than that of South Africa. Among other things, this explains why economic
growth in these respective countries has been able to trickle down to the poor
more than in the case of South Africa.
• What also needs to be pointed out is that the government has (contrary to what
has been done in China, Vietnam and Uganda—where the various reforms were
171
mainly targeted at stimulating the rural economy) placed too much emphasis on
developing the ‘first economy’ (i.e. urban economy). This has, in turn, allowed
those who were already wealthy to accumulate even more wealth because they,
unlike their poorer counterparts, have the necessary means to take advantage of
the economic opportunities that come about as a result of growth in the ‘first
economy’. Hence, South Africa’s gini-coefficient has actually worsened ever
since the advent of democracy111.
• Although it is widely acknowledged that South Africa’s SMME support
infrastructure, which was non-existent in the pre-1994 period, has planted the
seeds for sustainable and employment-creating SMME development (see for
example Qualmann, 2000: 43; ICC, 1999: 7), available assessment studies suggest
that the new SMME policies have generally not been truly effective.
Consequently, the contribution of the SMME economy (which is of vital
importance for absorbing unskilled labour) to national employment growth has
been very low.
• The prevalence of HIV/Aids has contributed to a rise in poverty. HIV/Aids
generates new poverty as people lose employment and housing tenure.
Households’ income fall due to the loss of wage earners and rising spending,
particularly on medical care and funerals. In essence, the poverty that results from
HIV/Aids interacts with other dimensions of poverty to generate a vicious
downward cycle. Under these conditions, HIV/Aids not only increases poverty,
but it also widens the gap between the rich and the poor. Also, HIV/Aids depletes
the very scarce skilled labour.
• Public corruption has also undermined government efforts that are aimed towards
poverty reduction. This phenomenon, in particular, has not only undermined
much needed economic growth and development (by, among other things,
hindering or deterring both local and foreign investment), but it has also distorted
resource allocations that are aimed at ameliorating the livelihood of the poor,
particularly in poverty-stricken rural areas. This has, in turn, led to the poor being 111 Inequality levels have risen steadily from an already high level of 0.58 in 1995 to levels ranging from between 0.635 (as estimated by UNDP, 2003) and 0.77 (as estimated by HSRC and Whiteford for 2001, but published in 2004).

172
deprived of the social services as well as economic resources that they are entitled
to.
• Inadequate processes of measuring, monitoring and evaluating poverty have also
led to poor targeting of the poor, and thereby increasing inefficiency.
5.8. Conclusion
This chapter has presented an overview of poverty reduction policies in the post-
apartheid era. For the sake of clarity, these were divided into five broad categories,
namely: measures that foster pro-poor economic growth; job creation measures;
infrastructure programmes earmarked to address household consumption basic needs;
safety net measures; and asset building or redistribution measures.
According to what has been discussed in this chapter, the formulation of macroeconomic
stability measures, which are aimed at spurring economic growth, was based on the belief
that economic growth leads to potentially more gainful economic opportunities for all,
and thus an increase in the general standard of living. What is noteworthy about the
foregoing strategy, however, is that its success in terms of poverty reduction hinges
largely on the poor being able to access the necessary resources that are needed to take
advantage of the economic opportunities that might trickle down to them.
Furthermore, following on from the fact that labour is the main asset of the poor, the
government has put a lot of effort into creating jobs that are aimed at rectifying the long-
term unemployment malaise in South Africa. Human resource development and
establishing supporting measures for the SMME sector are the two main vehicles that
have been utilised for creating poverty-reducing jobs. However, since the foregoing
mechanisms usually take protracted periods of time before they make any meaningful
difference, the government has supplemented these with special/short-term employment
programmes (i.e. public works programmes) that are mainly aimed at alleviating poverty.

173
In addition, in an attempt to enable the poor to access adequate shelter, clean water,
sanitation, primary healthcare and basic education, the government has initiated a number
of useful endeavours. The most notable of these include the policy of free basic services,
as well as the building of a infrastructure that enhances the delivery of these basic needs
to the poor. The introduction of the URP and the ISRDP policy programmes buttressed
the foregoing initiatives even further, by attempting to ensure that the poor who are
residing in marginalised communities are also able to meet their basic needs.
Another significant state-driven poverty reduction programme that has been covered in
this chapter is the system of social security that is in place for certain categories of
vulnerable people. This system is mainly divided into two categories, namely:
occupational insurance and social assistance. With regard to occupational insurance, the
focus was on the worker-financed UIF. The UIF strives to contribute to the alleviation of
poverty in South Africa, by providing short-term income relief to contributors when they
become unemployed or are unable to work because of illness, maternity or adoption of
small children. This fund also provides relief to dependants of deceased contributors.
Concerning social assistance, the focus was on social grants as well as other poverty
relief programmes. The grants are means-tested and are targeted at the following groups:
the old age pension is available for the elderly; disabled adults and children may receive
disability grants; relatively small child support grants are targeted at poor children; foster
care grants may be received by those legally fostering the child of other parents. The
other poverty relief programmes (e.g. School Nutrition Programme, Social Relief of
Distress Programme, Disaster Relief Programme and the Food Relief Programme)
provide cash or in-kind benefits for the destitute.
Lastly, the government has also sought to boost the asset base of the poor by enabling
them to access physical assets such as land and housing.
Given the above, it is quite clear that the government has put concerted effort into
attempting to arrest the prevalence of poverty in South Africa. What is worrisome though
is that, in spite of these abovementioned strategies, there has been a modest change thus
174
far (i.e. a decade or so after the demise of the apartheid regime) in the reduction of this
phenomenon. This chapter has established that, while meaningful progress has been made
in other development spheres, the latest poverty estimates suggest that the number of
poverty-stricken people in South Africa still remains at an unacceptably high level of
43.2%. This discouraging status quo is possibly attributed to the following factors: the
perennial effects of the apartheid system; the ineptitude of most government departments
due to a shortage of skilled labour; the high wealth (and income) inequality rate in South
Africa; the ‘first economy’s’ failure to accommodate the poor; the poor performance of
the SMME sector in relation to absorbing unskilled labour; the high HIV/Aids infection
rate that has disastrous consequences for those affected; public corruption that impedes
economic growth and distorts the allocation of development resources; and inadequate
processes of measuring, monitoring and evaluating poverty.

175
Chapter 6
Summary and Policy Recommendations
Post-1994 attempts to reduce poverty have met limited success. Significantly, evidence
suggests that the prevalence of poverty in South Africa ranges from 45 to 57%. It is for
this reason that this dissertation is concerned with the following question: “are the
various anti-poverty strategies that are espoused by the government adequate to address
the socio-economic imbalances that continue to epitomise South Africa?”
In an attempt to ascertain why South Africa’s anti-poverty strategies have not managed to
reduce poverty in a meaningful manner, this dissertation commenced with an exploration
of where and who the poor people are in South Africa. It turns out that about 70% of the
poor people live in rural areas that are characterized by lack of, inter alia, access (or
roads), resources and technology. What is also interesting is that, with the exception of
Gauteng and the Western Cape, over half of the population in all other provinces live in
poverty. Even more interesting is the fact that about 59% of South Africa’s poor are
concentrated in three provinces, which also happen to be the former homelands that were
deliberately underdeveloped. These provinces are Eastern Cape, KwaZulu-Natal and
Limpopo.
With regard to who the poor people are in South Africa, this dissertation discussed that
poverty is concentrated among the Black population, particularly women and children.
This is largely attributed to the fact that this group of people does not usually have
adequate entitlement over productive assets, such as arable land and advanced labour
skills. It has also been established that there is a strong correlation between
unemployment and poverty, especially among individuals that have low levels of
education. This is because this group of people does not usually have adequate skills to
fill up the jobs that are currently being created by the economy; hence South Africa is
said to be experiencing structural unemployment. In addition, large households with a
high dependency ratio are more likely to be poor. The notion is that dependants are, not

176
only a distinct threat to the financial security of a family, but they also limit the ability of
the working family members to earn income. Furthermore, poor households do not have
sufficient access to basic needs such as electricity, pipe water and sanitation, health
services and adequate shelter. This is because these poor households lack the means (i.e.
productive assets) to acquire these basic needs.
In a quest to identify how best to uplift the poor people out of poverty, this dissertation
looked at international best practices, with regard to poverty reduction. This was a very
important exercise because there are valuable lessons that can be learnt from the
experience of countries that have been relatively successful in reducing poverty. To
ensure that these lessons would be relevant to the above, this dissertation looked at
countries with a context that is similar to that of South Africa. The emphasis was on the
various anti-poverty strategies that have been implemented in China, Vietnam and
Uganda.
What came out very clear is that a potentially successful poverty reduction strategy
should encompass the following three complimentary elements: - (i) A creation of
economic opportunities for the poor, (ii) good governance, i.e. sound macroeconomic
management that engenders macroeconomic stability and (iii) social programmes (i.e.
social safety nets) that are targeted at the poor.
(i) A creation of economic opportunities for the poor. In general, it is advisable
that growth-oriented policies should be accompanied by measures that enable
the poor to share in the macroeconomic growth. This calls for comprehensive
policies that are aimed at augmenting the poor people’s assets, and providing
access to markets for the poor.
(ii) Good governance. The lesson in this regard is that countries should pursue
policies that foster a macroeconomic environment, which is conducive for
attaining rapid, pro-poor and sustainable economic growth.
(iii) Targeted social programmes. To compensate for the short falls of the above
two instruments, the lesson is that it is useful to devise anti-poverty
177
programmes that are carefully targeted at the poor areas. For the purpose of
ascertaining their effectiveness, these should also have a time frame.
In an attempt to identify what the government is doing to deal with the poverty dilemma
in South Africa, the general focus of chapter five was on the various poverty reduction
strategies that have been implemented by the government ever since the demise of
apartheid. What emerged from this chapter is that the government has attempted to
reduce poverty via the following measures: - (i) measures that foster pro-poor economic
growth; (ii) job creation measures; (iii) infrastructure programmes earmarked to address
household consumption basic needs; (iv) contributory and non-contributory social
security measures; and (v) asset building or redistribution measures.
Unfortunately, it turns out that these various anti-poverty strategies have not been very
effective in reducing poverty in South Africa. This ineffectiveness is largely attributed to
the following reasons: - (i) lack of rapid and pro-poor economic growth; (ii) weak
implementation or administration at the municipal level; (iii) slow asset redistribution via
the land reform programme; (iv) unevenly distributed infrastructure investment in South
Africa’s respective provinces; (v) the low-job generation rate by the (formal) SMME
sector; (vi) slow reduction in the HIV/AIDS infection rate; (vii) Corruption; (viii)
negative effects of affirmative action; (ix) insufficient political will; and (x) inadequate
processes of measuring, monitoring and evaluating poverty.
Therefore, if the government is to significantly reduce poverty, it needs to adopt
measures that will foster the following: - (i) a rapid and broad-based economic growth
that is accompanied by a reduction of income disparity; (ii) increased investment in
human capital development; (iii) a creation of special economic opportunities for women;
(iv) increased awareness campaigns about HIV/AIDS; (v) a reduction in corruption; (vi)
intense political will to reduce poverty; and (vii) adequate processes for measuring,
monitoring and evaluating poverty.

178
(i) Rapid and broad-based economic growth that is accompanied by a reduction
of income distribution.
As it can be seen in China, Vietnam and Uganda, for growth to substantially reduce
poverty in South Africa, it should not only be high but it must also be broad based. For
this to happen, however, there are two main conditions that need to be present. First, the
government needs to devise effective measures that will encourage the informal sector in
South Africa (i.e. the ‘second economy’) to either grow out of it’s own dynamics or
through linkages with the formal sector (‘first economy’). Laying the conditions for
growth of rural production in areas wherein the poor are concentrated is one of the ways
through which this can happen.
A second condition that needs to exist in South Africa is an enabling environment that
enhances the economic opportunities of the poor, especially in the form of gainful
employment. In this regard, labour-absorbing SMMEs need to be supported better.
The expansion of economic opportunities for the poor should, however, encompass more
than employment: it should also include increasing access to productive assets for the
poor who are self employed. To this end, the government should, in particular, attempt to
remove bottle necks to the land reform programme that is suppose to be the vehicle
through which the poor access arable land. This is especially since only a mere 150
community claims of agricultural land have been settled between 1996 and mid-2005.
Equally important, the government should intensify post-settlement support for land
reform beneficiaries, as it has already admitted that there is a failure rate of about 50% in
achieving the sustainable agricultural development of the various community
beneficiaries. This can be accomplished by increasing investments in physical
infrastructure (e.g. rural roads and irrigation works), credit scheme for the poor, and
extensive technical assistance to raise productivity levels in agriculture and other rural
economic activities.

179
(ii) Increasing investment in human capital development
An increase in skilled labour (especially in the form of engineers, artisans, accountants
and managers) in South Africa can serve as a stimulus to increased investment, economic
growth, employment creation and expedient service delivery to the poor and, thus,
poverty reduction. For instance, with a large pool of skilled labour, more international
investors might be inclined to bring their businesses to South Africa, as this country
would be deemed competitive in labour-terms. This can, in turn, lead to foreign
investments being diverted towards South Africa instead of other emerging markets, thus
increasing economic growth prospects and possible employment growth as well.
Equally, if the various government departments had adequately skilled labour, they
would probably implement the various anti-poverty policy programmes more effectively,
and they by improving the lives of many poor South Africans. Moreover, if a person is
adequately skilled, they stand a better chance of being employed.
Therefore, in the war against poverty, the need for government to invest more on human
capital development can never be over emphasized. As such, the government should
attempt to ensure that every poor person in South Africa has access to basic education,
primary health care, and other essential services. With such access, the poor and their
children will have the opportunity to improve their economic status or even to participate
fully in society. It is also necessary to ensure that the relevance, quality, and quantity of
education provided is designed to effectively increase participation, both in the workforce
and in society at large.
(iii) Creating special economic opportunities for women
As it has already been indicated, (Black) women suffer disproportionately from the
burden of poverty and are systematically excluded from access to essential assets.
Therefore, if the government were to improve the status of women by creating more
special economic opportunities (by, for example, broadening women-access to vocational
training, readily available credit and special markets) for them, it would be addressing a

180
priority area of poverty. These interventions are also expected to increase the demand for
family planning and contraception (as the opportunity cost mothers’ time spent raising
children increases) which, in turn, ought to reduce family sizes and the premature loss of
breadwinners through HIV/AIDS.
(iv) Increasing awareness campaigns about HIV/AIDS
Similarly to what has been done in Uganda, the South African government needs to
increase awareness campaigns around the issue of HIV/AIDS. This is very important
because this epidemic has a devastating effect on the economic status of the households
within which the infected individuals belong. For example, in trying to cover the medical
costs of the infected individuals, a household can sell its various assets: land, bicycles,
radios, cattle and other goods. If they dispose of productive assets such as cattle or land,
they in turn do not only erode their asset base but they also reduce their chances of
recovering and rebuilding. The tendency is for such households to be unable to cope and
they eventually collapse into poverty. This is especially when the infected individual is a
household head, who also happens to be the breadwinner. Hence, it is of vital importance
for government to also intensify its efforts towards assisting households headed by young
children.
(v) Reducing corruption
More often than not, corruption puts basic public services beyond the reach of those who
cannot afford to pay bribes. By diverting scarce resources intended for development,
corruption also makes it harder to meet fundamental needs, such as those for food, health
and education. Moreover, corruption complicates sustainable development and hits the
poor particularly hard. Therefore, the government should consider responsible
administration, which respects the rules of democracy and creates a favourable
environment for economic and social development, as a basic prerequisite for combating
poverty in South Africa. Moreover, there should be an increase in the political
commitment to fight corruption at the highest level of a state.

181
(vi) Intensifying the political will to reduce poverty
In the fight against poverty, a clear increase in the political will by the relevant
government institutions is needed. This can possible be best demonstrated by a complete
halt in under spending by various municipalities, particularly in poverty-stricken
communities. Also, serious consideration should be paid by government to basic income
grant (also known as BIG) as a grant to tide people over during periods of protracted
unemployment and great need.
(vii) Fine-tuning processes for measuring, monitoring and evaluating poverty
There is also urgent need for policy makers (and other actors) to have a comprehensive
understanding of who is poor and where they are. This contextual knowledge must be
coupled with an understanding of poverty dynamics, if policy is to be effective in
tackling poverty and creating an enabling environment for pro-poor and broad-based
growth. This means that there must be accurate data and analysis at the national and sub-
national level that explains why people are poor (poverty drivers), what keeps them in
poverty (poverty maintainers) and what kind of policies and interventions might support
movement out of poverty (poverty interrupters).
Poverty reduction is a long-term exercise. However, the political demands compel the
government to, at the very least, produce short-term results. These can come about by
addressing the basic needs of the poor through improved access to water, electricity,
housing and sanitation, while the business of (broad based) economic growth is on going.
It is also very important for government to take leadership in embarking on HIV/AIDS
awareness campaigns, as HIV/AIDS is a serious threat to the financial security of a
household. In addition, bottlenecks to the land reform programme need to be removed
promptly. Moreover, administration capacity at the municipal level needs to be
enhanced. This is especially since the various government anti-poverty strategies are
implemented at this level.

182
Bibliography
Abedian, I. 2004. Beyond Budget 2004: Job Creation & Poverty Alleviation in S.A.: What
Should We Be Doing? Public Symposium, Institute for Justice and Reconciliation,
Breakwater Lodge/UCT Graduate School of Business. V&A Waterfront: Cape Town.
African National Congress (ANC). 1994. The Reconstruction and Development
Programme. A Policy Framework. Johannesburg: Umanyano Publications.
Agarwal, B. 1994. A Field of One’s Own: Gender and Land Rights in South Asia.
Cambridge: Cambridge University Press.
Agénor, P-R. 2001. Business Cycles, Economic Crises, and the Poor: Testing for
Asymmetric Effects. Washington, D.C: World Bank.
Agénor, P-R. 1998. Stabilisation Policies, Poverty, and the Labour Market. IMF and
World Bank, mimeo.
Aghion, P. Caroli, E., and Garcia-Penalosa, C. 1999. Inequality and Economic Growth:
The Perspective of the New Growth Theories. Journal of Economic Literature, 37: 1715-
60.
Alcock, P. 1997. Understanding Poverty (2nd Edition). London: Macmillan Press LTD.
Alcock, P. 1993. Understanding Poverty (1st Edition). Basingstoke: Macmillan Press
LTD.
Aliber, M. 2001. Study of the Incidence and Nature of Chronic Poverty and
Development Policy in South Africa: An Overview. Programme for Land and Agrarian
Studies. School of Government: University of the Western Cape.

183
Aliber, M., Masika, P. and Quan, J. 2006. Land Reform at Scale: A Case Study of Land
Redistribution in the Elliot District, Eastern Cape. Unpublished Report to the National
Treasury. Pretoria: Human Sciences Research Council.
Alweendo, T. 2004. The Use of Small and Medium Size Enterprises (SMMEs) to Reduce
Poverty. Keynote address by the Governor of the Bank of Namibia at the Opening
Ceremony of the 6th AFRICAN DEVELOPMENT FINANCE CONFERENCE &
SMME AWARDS. Cape Town, South Africa (20-21 October, 2004).
Anand, S. 1977. Aspects of Poverty in Malaysia. Review of Income and Wealth, 23: 1-16.
Anderson, M.B. 1999. The Impacts of Natural Disasters on the Poor: A Background
Note. Submitted by M.B. Anderson to Cornell University under Consulting Agreement
Number 35113-9382 for use in development of the World Bank's WDR (2000/2001).
Anderson, M.B. 1990. Analyzing the Costs and Benefits of Natural Disaster Responses in
the Context of Development. Environment Working Paper 29: 13-18. The World Bank.
Appleton, S. 2001a. Education, Incomes and Poverty in Uganda in the 1990s. Center for
Research in Economic Development and International Trade. University of Nottingham.
Mimeo.
Appleton, S. 2001b. Changes in Poverty in Uganda, 1992-1997, In Firms, Households
and Government in Uganda s Recovery, edited by P. Collier and R. Reinnikka, World
Bank: Washington, DC.
Appleton, S. 1996. Women-Headed Households and Household Welfare: An Empirical
Deconstruction for Uganda. World Development, 24(12): 1811-27.

184
Arora, V.B. and Vamvakidis, A. 2005. The Implications of South African Economic
Growth for the Rest of Africa. IMF Working Paper (WP/05/58).
Asian Development Bank (ADB). 2004. Asian Development Outlook, 2004. Manila:
ABD.
Atkinson, A.B. 1998. Poverty in Europe. Blackwell.
Atkinson, A.B. 1987. On the Measurement of Poverty. Econometrica, Vol (55).
Balisacan, A., Mapa, D. and Tubianosa, C. 2004. The Population-Poverty Nexus: The
Philippines in Comparative East Asian Context. Asia Pacific Policy Center.
Barker, F. 2003. The South African Labour Market (4th Edition). Pretoria: Van Schaik
Publishers.
Barro, R. 1996. Determinants of Economic Growth: A Cross-Country Empirical Study.
National Bureau of Economic Research Working Paper 5698.
Bathrick, D.D. 1998. Fostering Global Well-Being: A New Paradigm to Revitalize
Agricultural and Rural Development. International Food Policy Research Institute.
Washington, D.C.
Bautista, R.M. 1999. Economic Growth and Poverty Reduction in Indochina: Lessons
from East Asia. TMD Discussion Paper No. 45. Washington, D.C.: International Food
Policy Research Institute.
Becker, G.S. 1975. Human Capital: A Theoretical and Empirical Analysis, with Special
Reference to Education (2nd edition). New York: National Bureau of Economic Research.

185
Behrman, J.R. and Birdsall’s, N. 1988. The Reward for Good Timing: Cohort Effects and
Earning Functions for Brazilian Males. Review of Economics and Statistics, Vol. 70(1).
Berry, A., von Blottnitz, M., Cassim, R., Kesper, A., Rajaratnam, B. and van Seventer,
D.E. 2002. The Economics of SMMEs in South Africa. Trade and Industrial Policy
Secretariat, Johannesburg. (Online). Available from: www.tips.org.za.
Bhagwati, J. and Srinivasan T.N. 2002. Trade and Poverty in the Poor Countries. AEA
Papers and Proceedings, 92(2): 180-183.
Bhargava, A. and Yu, J. 1997. A Longitudinal Analysis of Infant and Child Mortality
Rates in Developing Countries. Indian Economic Review, Vol. 32: 141-51.
Birdsall, N. 1988. Economic Approaches to Population Growth, In Handbook of
Development Economics, edited by H. Chenery and T.N. Srinivasan, North Holland:
Elsevier Science Publishers, Vol 1: 477-542.
Birdsall, N. and Griffin, C. 1993. Population Growth, Externalities, and Poverty. Policy
Research Working Papers Series (WPS) 1158. Washington, D.C.: World Bank.
Bloom, D.E., Canning, D. and Malaney, P.N. 2000. Population Dynamics and Economic
Growth in Asia, In Population and Economic Changes in East Asia, edited by C. Chu and
R. Lee, A Supplement to Population and Development Review, Vol. 26.
Bloom, D.E., Canning, D. and Sevilla, J. 2003. The Demographic Dividend: A New
Perspective on the Economic Consequences of Population Change. Rand, Santa Monica,
Ca.
Bonti-Ankomah, S. 2001. Addressing Food Insecurity in South Africa. Paper Presented at
the SARPN Conference on Land Reform and Poverty Alleviation in Southern Africa.
Pretoria.

186
Booth, C. 1887. The Inhabitants of Tower Hamlets (School Board Division), their
Condition and Occupations. Journal of Royal Statistical Society, 50: 326-340.
Brady, D. 2003. Rethinking the Social Measurement of Poverty. Social Forces, 81(3):
715-752.
Bruce, J. and Dwyer, D. 1988. A Home Divided: Women and Income in the Third World.
Stanford, California: Stanford University Press.
Burger, R. 2004. Changing Dynamics of Employment: What Drives the Post-Apartheid
Labor Market?, In Taking Power in the Economy: Gains and Directions, edited by S.
Brown & A. Foslsher, Cape Town: Institute for Justice and Reconciliation.
Burki, S.J. 1990. Development Strategy for Poverty Alleviation. Asian Development
Review, 8(1): 1-17.
Business Report. 2008. Only 90 Black JSE Company Directors ‘Wield Real Power’.
October, 26.
Business Day. 2008. South Africa: Land Reform Failure Rate May Be 50 Percent.
February 19.
Buvinic, M. and Gupta, G.R. 1997. Female-Headed Households and Female-Maintained
Families: Are they Worth Targeting to Reduce Poverty in Developing Countries?
Economic Development and Cultural Change, 45(2), 259-280.
Cardoso, E. 1992. Inflation and Poverty. National Bureau of Economic Research
Working Paper No. 4006.

187
Cernea, M. M. 2000. Risks, Safeguards, and Reconstruction: A Model for Population
Displacement and Resettlement, In Risks and Reconstruction: Experiences of Resettlers
and Refugees, edited by M. M. Cernea and C. McDowell, Washington, DC: The World
Bank, 11-55.
Cernea, M. M. and McDowell C. 2000. Reconstructing Resettlers’ and Refugees’
livelihood, In Risks and Reconstruction: Experiences of Resettlers and Refugees, edited
by M. M. Cernea and C. McDowell, Washington, DC: The World Bank, 1-8.
Chandra, V., Moorty, L., Nganou, J-P., Rajaratnam, B. and Schaefer, K. 2001.
Constraints to Growth and Employment in South Africa. Report No 2: Evidence from the
Small, Medium and Micro Enterprise Firm Survey. Informal Discussion Paper No 15.
Washington DC: World Bank Southern Africa Department.
Chen, S. and Ravallion, M. 2004. How Have the World's Poorest Fared Since the Early
1980s? World Bank Policy Research Working Paper No. 3341.
Chetwynd, E., Chetwynd, F. and Spector, B. 2003. Corruption and Poverty: A Review of
Recent Literature. Management Systems International: Washington, DC.
Chowdhury, A.K.M.A. and Chen, L.C. 1977. The Interaction of Nutrition, Infection and
Mortality During Recent Food Crises in Bangladesh. Food Research Institute Studies,
16: 47-61.
Christie, P and Collins, J. 1984. Bantu Education: Apartheid Ideology and Labor
Reproduction. In Apartheid and Education, edited by P. Kallaway, Ravan Press:
Johannesburg.
Coale, A.J. and Hoover, E.M. 1958. Population Growth and Economic Development in
Low-Income Countries. Princeton, NJ: Princeton University Press.

188
Cohen, R. and Kennedy, P. 2000. Global Sociology. New York: New York University
Press.
Coleman, N and Tregenna F. 2002. Thinking Big … the Proposed Basic Income Grant
for South Africa. South African Labor Bulletin, Vol 26, No. 2, April 2002.
Committee of Inquiry into a Comprehensive Social Security System (CICSSS). 2001.
Current Government Measures to Address Poverty and Meet Basic Needs. Draft Input
Document to the Committee of Inquiry into a Comprehensive Social Security System
(CICSSS), 2002. Transforming the Present – Protecting the Future (Draft Consolidated
Report).
Dasgupta, P. 1993. An Inquiry into Well-being and Destitution. Oxford: Oxford
University Press.
Datt, G., and Jolliffe, D. 1999. A Profile of Poverty in Egypt: 1997. Washington, D.C.:
International Food Policy Research Institute. FCND Discussion Paper No. 75.
Datt, G. and Ravallion, M. 2002. Is India’s Economic Growth Leaving the Poor Behind?
World Bank, mimeo.
Datt, G. and Ravallion, M. 1996. Why Have Some Indian States Done Better than Others
at Reducing Rural Poverty? World Bank Policy Research Paper 1594.
Davis, D. and Mishra, P. 2004. Stolper-Samuelson is Dead And Other Crimes of Both
Theory and Data, Forthcoming in Globalization and Poverty, edited by A. Harrison,
University of Chicago Press for NBER.
Deaton, A. 1997. The Analysis of Household Surveys: A Microeconometric Approach to
Development Policy. Baltimore: Johns Hopkins University Press.

189
de Dios, E. and Associates 1993. Poverty, Growth and the Fiscal Crisis. Philippine
Institute for Development Studies (PIDS) and International Development Research
Center (IDRC).
Deolalikar, A.B. 2000. Poverty, Growth, and Inequality in Thailand. ERD Working
Paper Series No. 8. Asian Development Bank.
Department of Education, 2006. Education Policy. (Online). Available from:
www.info.gov.za/aboutSA/health.htm
Department of Education. 2004. The Development of Education: Country Report of South
Africa. 47th International Conference on Education, 8-11 September 2004.
Department of Finance (now known as the National Treasury). 1996. Growth,
Employment and Redistribution. (Online). Available from: www.finance.gov.za).
Department of Health. 2006. Integrated Nutrition Program (INP) and Food Security.
(Online). Available from: www.info.gov.za/aboutSA/health.htm
Department of Housing. 2006. Legislation and Policy. (Online). Available from:
www.info.gov.za/aboutSA/housing.htm
Department of Minerals and Energy. 2006. Integrated National Electrification Program.
(Online). Available from: www.info.gov.za/AboutSA/Minerals&Energy.htm
Department of Social Development. 2006. Annual Report for 2005-2006.
Department of Social Development. 2003. You and Your Grants 2003.
Department of Trade and Industry (DTI). 2006. South Africa’s New Regional Industrial
Development Strategy. (Draft)

190
Department of Water Affairs and Forestry. 2006. Water-Supply and Sanitation Programs.
(Online). Available from: www.info.gov.za./AboutSA/DWARF.htm
Department of Water Affairs and Forestry. 2005. Annual Report for 2004-2005.
Desai, A. 2005. Uprooting or Re-rooting Poverty in the Post-Apartheid Era? A
Literature Review. Prepared for SANPAD Poverty Reduction Thematic Workshop: 24
and 25 May 2005.
Devarajan, S., Dollar, D.R. and Holmgren, T. 2001. Aid and Reforms in Africa: Lessons
from Ten Case Studies. Washington D.C.: World Bank.
Dewar, D.I. and Watson, V. 1981. Unemployment and the ‘Informal Sector’: Some
Proposals. University of Cape Town. Urban Problems Research Unit, Cape Town.
Dollar, D. 2002. Reform, Growth, and Poverty Reduction in Vietnam. Policy Research
Working Paper No. 2837, The World Bank, Washington, D.C.
Dollar, D. and Kraay, A. 2000. Growth is Good for the Poor. Journal of Economic
Growth, 7(3), 195–225.
Dollar, D., and Litvack, J. 1998. Macroeconomic Reform and Poverty Reduction in
Vietnam, In Household Welfare and Vietnam’s Transition, edited by D. Dollar, P.
Glewwe, and J. Litvack, Regional and Sectoral Studies, World Bank, Washington, D.C.
Dorfling, T. 2001. Developing Industry for Local Economic Development in South
Africa. Africa Insight, 31(1), March: 35-42.
Dreze, J. and Sen, A. 1989. Hunger and Public Action. Oxford: Oxford University Press.
191
Dubey, A., Gangopadhyay, S. and Wadhwa, W. 1999. Female-Headed Households in
India: Incidence, Poverty and Socio-economic Characteristics. Planning and Policy
Research Unit Papers. New Delhi: Indian Statistical Institute.
Duraisamy P., Daly, C., Homan, R., Ganesh, A., Kumarasamy, N., Karim, A., Sri Priya,
P., Castle, C., Verma, P., Mahendra, V. and Solomon, S. 2003. The Economic Impact of
HIV/AIDS in Patients and Households in South India. Draft. Chennai: University of
Madras, Department of Econometrics.
du Toit, R. 2003. Unemployed Youth in South Africa: The Distressed Generation? Paper
Presented at the Minnesota International Counseling Institute, 27 July – 1 August.
Eastwood, R. and Lipton, M. 2001. Demographic Transition and Poverty: Effects via
Economic Growth, Distribution and Conversion, In Population Matters: Demographic
Change, Economic Growth and Poverty in the Developing World, edited by N. Birdsall
and S. Sinding, New York: Oxford University Press.
Eastwood, R. and Lipton, M. 1999. Impact of Changes in Human Fertility on Poverty.
Journal of Development Studies 36(1): 1-30.
Epaulard, A. 2003. Macroeconomic Performance and Poverty Reduction. IMF Working
Paper, WP/03/72. Washington, DC: International Monetary Fund.
Fallon, P. 1992. An Analysis of Employment and Wage Behavior in South Africa.
Informal Discussion Paper No.3 on Aspects of the Economy of South Africa.
Unpublished paper. Washington, D.C.: World Bank.
Fan, S., Lan, H.P. and Quang, L.T. 2004. Government Spending and Poverty Reduction
in Vietnam.

192
Fan, S., Zhang, X. and Rao, N. 2004. Public Expenditure, Growth, and Poverty
Reduction In Rural Uganda. Development Strategy and Governance Division Discussion
Paper No. 04. International Food Policy Research Institute: Washington, D.C.
Fields, G.S. 1980. Poverty, Inequality and Development. Cambridge: Cambridge
University Press.
Fischer, S. and Easterly, W. 2000. Inflation and the Poor. Policy Research Working
Paper Series 2335. Washington D.C.: World Bank.
Fishlow, A., 1972. Brazilian Size Distribution of Income. American Economic Review,
62: 391-402.
Folbre, N. 1991. Women on Their Own: Global Patterns of Female Headship, In The
Women and International Development Annual, Vol.2, edited by R.S. Gallin and A.
Fergusen, Boulder CO: Westview Press.
Foster, M. and Mijumbi, P. 2002. How, When and Why Does Poverty Get Budget
Priority? Poverty Reduction Strategy and Public Expenditure in Uganda. Overseas
Development Institute: London.
Frankel, J. and Romer, D. 1999. Does Trade Cause Growth? American Economic Review
89, 379-99.
Friedman, M. 1957. A Theory of the Consumption Function. Princeton, New Jersey:
Princeton University Press.
Gao, H. 2001. Study on Poverty Reduction and Development Planning. China Financial
and Economic Press.

193
Gelb, S. 2004. Inequality in South Africa: Nature, Causes and Responses. African
Development and Poverty Reduction: The Macro-Micro Linkage.
General Statistics Office (GSO). 2004. Vietnam Household Living Standards Survey
2004. Hanoi: Statistical Publishing House.
Global Monitoring Report. 2006. Strengthening Mutual Accountability: Aid, Trade and
Governance. Development Committee.
Goldberg, P.K. and Pavcnik, N. 2004. Trade, Inequality and Poverty: What Do We
Know? Evidence from Recent Trade Liberalization Episodes in Developing Countries”,
NBER Working Paper No. 10593. Washington DC: Brookings Trade Forum.
Gordon, D.M. 1972. Theories of Poverty and Underdevelopment: Orthodox, Radical,
and Dual Labour Market Perspectives. Lexington Books.
Government of Uganda, Ministry of Finance. 2000. Uganda’s Poverty Eradication
Action Plan: Summary and Main Objectives. Kampala.
Greenberg, S. 1980. Race and State in Capitalist Development. Johannesburg: Ravan.
Gunderson, M. and Riddell, W.C. 1988. Labour Market Economics. Toronto: McGraw-
Hill Ryerson.
Gupta, S., Davoodi, H. Terme, A. 1998. Does Corruption Affect Income Equality and
Poverty? IMF Working Paper 98/76.
Gupta, S., Davoodi, H. and Tiongson. E. 2000. Corruption and the Provision of Health
Care and Education Services. IMF Working Paper 00/116.
194
Ha, Q.L. 2002. Xoa Doi Giam Ngheo o Vung Dan Toc Thieu so Nuoc ta Hien Nay - Thuc
trang va Giai Phap (Poverty Reduction in Ethnic Minority Regions: Status and
Solutions). Nha xuat ban Chinh tri quoc gia: Hanoi.
Hagenaars, A.J.M. 1991. The Definition and Measurement of Poverty, In Economic
Inequality and Poverty: International Perspectives, edited by M.E. Sharpe, 134-56.
Harrison, A. 2005. Globalization and Poverty. Draft. (Forthcoming) University of
Chicago Press for NBER.
Hofmeyr, J. and McLennan, A. 1992. The Challenge of Equalizing Education, In Wealth
or Poverty? Critical Choices for South Africa, edited by R. Schrire, Oxford UP, Cape
Town.
Hoogeveen, J. and Özler B. 2004. Not Separate, Not Equal; Poverty and Inequality in
Post-Apartheid South Africa. Washington, DC: World Bank.
Hope, K.R. 2004. The Poverty Dilemma in Africa: Toward Policies for Including the
Poor. Progress in Development Studies, 4(2): 127-141.
Horrel, M. 1977. Legislation and Race Relations: A Summary of the Main South African
Laws Which Affect Race Relationships. Johannesburg: South African Institute of Race
Relations.
House of Representatives, 12th Congress. 2003. Resolution No. 507. Resolution Directing
the Committee on Agriculture, Food and Fisheries to Conduct an Inquiry, in Aid of
Legislation, on the Adverse Impact of the Government’s Agricultural Liberalization
Policies on the Domestic Vegetable Industry, on Vegetable Farmers and on Their
Livelihood and to Recommend Appropriate Remedial Measures Thereof.

195
Hulme, D., Moore, K. and Shepherd, A. 2001. Chronic Poverty: Meanings and
Analytical Framework. CPRC Working Paper 2. Institute of Development Policy and
Management, University of Manchester, UK (ISBN-1-904049-01-X).
Hulme, D. and Shepherd, A. 2003. Conceptualizing Chronic Poverty. World
Development, 31(3): 403-423.
Human Sciences Research Council and Whiteford, A. 2004. Fact Sheet (1): Poverty in
South Africa.
Hunter, N., May, J. and Padayachee, V. 2003. Lessons for PRSP from Poverty Reduction
Strategies in South Africa. Third Meeting of the African Learning Group on the Poverty
Reduction Strategy Papers. Addis Ababa: Ethiopia.
ICC, 1999. Supporting South Africa’s Small, Micro and Medium Enterprise Strategy:
Khula Enterprise Finance Ltd and Ntsika Enterprise Promotion Agency. Discussion
Points on the Way Forward. Unpublished Confidential Report for the World Bank.
Jenkins, R. 2006. Globalization, Production and Poverty’. In The Impact of Globalization
on the World’s Poor: Transmission Mechanism, edited by M. Nissanke and E.
Thorbecke, Palgrave Macmillan: Basingstoke.
Joshi, S. 2004. Female Household-Headship in Rural Bangladesh: Incidence,
Determinants and Impact on Children’s Schooling. Economic Growth Center Discussion
Paper No. 894, Yale University.
Kabananukye, K.I.B., Kabananukye, A.E.K., Owomugasho, J.K.D. 2004. Economic
Growth, Employment, Poverty and Pro-Poor Policies in Uganda. ILO: Geneva.
Kanbur, R., Younger, S. and Cichello, P. 2003. Analysis and Measurement of Poverty
and Inequality. Technical Assistance Course Study Guide. University of Cape Town.
196
Kappel, R., Lay, J. and Steiner, S. 2004. The Missing Links: Uganda’s Economic
Reforms and Pro-Poor Growth. Report Commissioned by Deutsche Gesellschaft Fur
Technische Zusammenarbeit (GTZ).
Kasekende, LA. and Atingi-Ego, M. 1999. Uganda’s Experience With Aid. Journal of
African Economies, Vol. (8).
Keegan, T. 1986. Rural Transformations in Industrializing South Africa: the Southern
Highveld to 1914. Johannesburg: Ravan Press.
Kesper, A. 2002. Tracing Trajectories of Successful Manufacturing SMEs in South
Africa. Unpublished PhD dissertation, University of the Witwatersrand, Johannesburg –
forthcoming.
Khan, A.R. 2001. Employment Policies for Poverty Reduction. Issues in Employment and
Poverty Discussion Paper 01. Recovery and Reconstruction Department. ILO: Geneva.
Khor, M. 2002. A Perspective of Globalization and its Implications for Developing
Countries. Paper presented to the CSGR Conference on Globalization, Growth and (In)
Equality, University of Warwick, March 2002.
Kingdon, G.G. and Knight, J. 2005. Unemployment in South Africa, 1995-2003: Causes,
Problems and Policies. GPRG-WPS-010.
Kingdon, G.G. and Knight, J. 2004. Well-Being Poverty Versus Income Poverty and
Capabilities Poverty in South Africa? African Development and Poverty Reduction: The
Macro-Micro linkage Forum Paper.
Kircher, P.A. 2002. Poverty Reduction Strategies. Gottingen Studies in Development
Economics. Germany: Peter Lang.

197
Kirsten, M., Aliber, M., Maharajh, R., Nhlapo-Hlope, J. and Nkoane, O. 2006.
Overcoming Underdevelopment in South Africa’s ‘Second Economy’. Development
Southern Africa, Vol: 23(1).
Kithakye, D. 2001. Housing the Nation: South Africa’s National Housing Strategy.
(Online). Available from: www.unhabitat.org/mdg/documents/africa/Vol7:1
Klasen, S. 2000. Measuring Poverty and Deprivation in South Africa. Review of Income
and Wealth, 46(1): 33-58.
Klasen, S. 1997. Poverty, Inequality and Deprivation in South Africa: An Analysis of the
1993 Saldru Survey. Social Indicators Research, 41:51-94.
Knight, R. 2006. South Africa 2006: Challenges for the Future. South African Delegation
Briefing Paper November 2006.
Kothari, U. 2002. Migration and Chronic Poverty. Chronic Poverty Research Center,
Institute for Development Policy and Management. Working Paper No. 16. University of
Manchester.
Kothari, R. 1993. Poverty: Human consciousness and the Amnesia of Development.
London: Zed Books.
Laderchi, R., Saith, R. and Stewart, R. 2003. Does it Matter that We Do Not Agree on
the Definition of Poverty? A Comparison of Four Approaches. Oxford Development
Studies, 31(3): 243-274.
Lanjouw, J. 1997. Behind the Line: Demystifying Poverty Lines. Poverty Reduction
Module 3: Poverty Measurement: Behind and Beyond the Poverty Line. New York.

198
Lanjouw, P., Pradhan, M., Saadah, F., Sayed, H. and Sparrow, R. 2001. Poverty,
Education and Health in Indonesia: Who Benefits from Public Spending? World Bank
Policy Research Working Paper Series No. 2739. Washington, D.C.: World Bank.
Larson, D. and Deininger, K. 2001. Crop Markets and Household Participation, In
Uganda’s Recovery. The Role of Firms, Farms and Government, edited by R. Reinikka
and P. Collier, Washington D.C.: World Bank.
Leading Group for Poverty Reduction and Development (LGPR). 2001. China’s Rural
Poverty Reduction and Development Compendium (2001-2010).
Leading Group for Poverty Reduction and Development (LGPR). 1989. Outline of
Economic Development in China’s Poor Areas. Agricultural Press.
Leibbrandt, M., Poswell, L., Naidoo, P., Welch, M. and Woolard, I. 2004. Measuring
Recent Changes in South African Inequality and Poverty Using 1996 and 2001 Census
Data. CSSR Working Paper No.84. Cape Town: Center for Social Science Research,
University of Cape Town.
Leibbrandt, M. and Woolard, I. 1999. A Comparison of Poverty in South Africa’s Nine
Provinces. Development Southern Africa, 16(1): 37-54.
Leslie, J. 1992. Women’s Time and Use of Health Services. IDS Bulletin, 23(1).
Levinsohn, J., Berry, S. and Friedman, J. 1999. Impacts of the Indonesian Economic
Crisis: Price Changes and the Poor. National Bureau of Economic Research. Working
Paper Series No. 7194. Cambridge, MA.
Lewis, P.D., Balazs, R., Patel, A.J. and Jordan, T.C. 1986. Undernutrition and Brain
Development, In Human Growth (2nd Edition), edited by F. Falkner and J.M. Tanner,
New York: Plenum Press, 415-473.

199
Lipton, M. 1997. Editorial: Poverty – Are the Holes in the Consensus? World
Development, 25(7): 1003-1006.
Lipton, M. and Ravallion, M. 1995. Poverty and Policy, In Handbook of Development
Economics, Vol III, edited by J. Behrman and T.N. Srinivasan, Amsterdam: Elsevier.
Loewenson, R. and Whiteside, A. 2001. HIV/AIDS Implications for Poverty Reduction.
Background Paper Prepared for the United Nations Development Program for the UN
General Assembly Special Session on HIV/AIDS, 25-27 June.
Lucas, S. and Timmer, P. 2005. Connecting the Poor to Economic Growth: Eight Key
Questions. Center for Global Development (CGD) Brief.
Madden, D. 2000. Relative or Absolute Poverty Lines: A New Approach. Review of
Income and Wealth 46: 181-99.
Mail&Guardian. 2008. Child Support-Grant Age to be Raised. February, 20.
May, J. 2000. Poverty and Inequality in South Africa: Meeting the Challenge. Cape
Town: David Philip.
May, J. 1998. Poverty and Inequality in South Africa. Report Prepared for the Office of
the Executive Deputy President and the Inter-Ministerial Committee for Poverty and
Inequality. Durban: Praxis.
Mbeki, T. 2004. Address by the President of South Africa, Mr Thabo Mbeki, on the
Occasion of his Inauguration and the 10th Anniversary of Freedom. Pretoria, 27 April.
Mbeki, T. 2001. The State of the Nation Address of the President of South Africa, Thabo
Mbeki, at the National Assembly Chamber, Cape Town, 9 February 2001.

200
McGrath, M.D. and Whiteford, A. 1994. The Distribution of Income in South Africa.
Pretoria: Human Sciences Research Council.
McKay, A. & Sowa, N.K. 2004. Does Inflation in Ghana Hit the Poor Harder?
(Preliminary Draft).
MediaClub, 2007. HIV/AIDS in South Africa. November 14.
Meier, M.G. and Rauch, J.E. 2005. Leading Issues in Economic Development (8th
Edition). Oxford: Oxford University Press.
Meikle, S. and Zhu, Y. 2000. Employment for Displacees in the Socialist Market
Economy of China, In Risks and Reconstruction: Experiences of Resettlers and Refugees,
edited by M. M. Cernea and C. McDowell, Washington, DC: The World Bank, 127-143.
Meth, C. and Dias, R. 2004. Increases in Poverty in South Africa, 1999-2002.
Development Southern Africa, 21(1): 59-85.
Mincer, J. 1974. Schooling, Experience and Earnings. New York: National Bureau of
Economic Research.
Mincer, J. 1958. Investment in Human Capital and Personal Income Distribution. The
Journal of Political Economy, 66: 281-302.
Mlambo-Ngcuka, P. 2006. A Catalyst for Accelerated and Shared Growth-South Africa
(ASGISA)—A Summary. Media Briefing by Deputy President P. Mlambo-Ngcuka, 06
February.

201
Moser, C. 1996. Confronting Crisis: A summary of Household Responses to Poverty and
Vulnerability in Four Poor Urban Communities. Environmentally Sustainable
Development Studies and Monographs, Series No. 08. Washington: The World Bank.
Mpuang, K. 2000. The Case for Effective Offender Reintegration. Document Compiled
for the National Symposium on Correctional Services, 1 - 2 August. Florida: Technicon
SA.
Mullahy, J. and Wolfe, B. 2000. Health Policies for the Non-Elderly Poor, In
Understanding Poverty in America: Progress and Problems, edited by S. Danziger, R.
Haveman and B. Wolfe.
Nafziger, W.E. 1997. The Economics of Development Countries (3rd edition). Prentice
Hall.
National Treasury. 2003. Intergovernmental Fiscal Review 2003. Pretoria.
Ncube, D. 1985. Black Trade Unions in South Africa. Johannesburg: Skotaville.
Neri, M. and Thomas, M. 2000. Household Educational Responses to Labor-Market
Shocks in Brazil: 1982-99. Washington, D.C.: World Bank.
Nguyen, V.B. and Chu, Q.T. 1996. Economic Policy and its Role in the Development of
Agriculture and Rural Economy. NXB CTOG. Hanoi: National Political Publishing
House.
Ngwane, A. 2001. A Statistical Approach to Modelling Poverty and Income Inequality in
South Africa. Unpublished Ph.D. Thesis. Pretoria: University of South Africa.
O’Boyle, J.E. 1999. Toward an Improved Definition of Poverty. Review of Social
Economy, LVII (3): 281-301.
202
OECD, 2002. Small and Medium Enterprise Outlook for 2002.
Office of the President. 2007. Development Indicators: Mid-Term Review. Pretoria:
Office of the President.
Office of the President. 1996. Growth, Employment and Redistribution: A
Macroeconomic Strategy. Pretoria: Office of the President.
Office of the President. 1994. White Paper on Reconstruction and Development
Program. Government’s Strategy for Fundamental Transformation. Pretoria: Office of
the President.
Okurut, F. N., Odwee, J.A.O. and Adebua, A. 2002. Determinants of Regional Poverty in
Uganda. AERC Research Paper 122. Nairobi: African Economic Research Consortium.
Oluoch-Kosura, W., Marenya, P.P., Place, F. and Barrett, C.C. 2004. Indices and
Manifestations of Poverty: Information Anti-Poverty Policy Choices. Paper for Bridging
Qualitative and Quantitative Methods of Poverty Analysis, hosted by KIPPRA, Nairobi,
Kenya. USAID SAGA Project-Cornell.
Opolot, J. and Kuteesa, R. 2006. Impact of Policy Reforms on Agriculture and Poverty in
Uganda. Bank of Uganda, Research Department. Discussion Paper No. 158.
Orbeta, A. 2002. Population and Poverty: A Review of Links, Evidence and Implications
for the Philippines. Paper prepared for the 2002 Population National Congress.
INNOTECH Building: Dliliman Q.C.
Oxfam International. 2002. Rigged Rules and Double Standards: Trade, Globalization
and the Fight Against Poverty. Oxford: Oxfam.

203
Oxfam International. 2001. Towards Global Equity: A Strategic Plan 2001-2004.
Paci, P., Sasin, M.J. and Verbeek, J. 2004. Economic Growth, Income Distribution and
Poverty in Poland during Transition. The World Bank, Mimeo.
Perlman, R. 1976. The Economics of Poverty. New York: McGraw-Hill Book Company.
Pernia, E.M. and Associates, 2004. Population and Poverty: The Real Score. University
of the Philippines.
Pernia, E.M. and Quibria. M.G. 1999. Poverty in Developing Countries, In Handbook of
Regional and Urban Economics, Amsterdam and New York: North Holland, Vol. 3:
1865-1934.
Phillips, S. 2004. The Expanded Public Works Program (EPWP). Presentation to the
UNDP, HSRC & DBSA Conference on Overcoming Under-development in South
Africa’s Second Economy, 28 & 29 October 2004. Pretoria, South Africa.
Pillay, P. 2000. Foreword, In Poverty and Inequality in South Africa. Meeting the
Challenge, edited by J. May, Cape Town. David Phillip: vii-ix.
Politt, E. 2001. The Developmental and Probabilistic Nature of the Functional
Consequences of Iron-Deficiency Anaemia in Children. The Journal of Nutrition, 131:
669-75.
Politt, E. 1997. Iron Deficiency and Educational Deficiency. Nutritional Reviews, 55:
133-40.
Psacharopoulos, G. 1995. The Profitability of Investment in Education: Concepts and
Methods. World Bank Human Capital Development and Operations Policy Working
Papers, No. 63.
204
Qualmann, R. 2000. Economic Development and Employment Promotion in South
Africa: Analysis with Special Reference to SMME Promotion and Strategy Options for
the German Development Cooperation. Unpublished Report. Bonn: GTZ.
Ravallion, M. 2004. Competing Concepts of Inequality in the Globalization Debate, In
Brookings Trade Forum 2004, edited by S. Collins and C. Graham, Washington DC:
Brookings Institution Press.
Ravallion, M. 2002. Growth, Inequality and Poverty: Looking Beyond Averages. Paper
presented at World Bank Annual Bank Conference of Development Economics-Europe.
Ravallion, M. 1998. Poverty Lines in Theory and Practice. LSMS Working Paper #133.
Washington DC: World Bank.
Ravallion, M. 1997. Can High-Inequality Developing Countries Escape Absolute
Poverty? Economic Letters, 56: 51-57.
Ravallion, M. 1996. Issues in Measuring and Modelling Poverty. The Economic
Journal, 106(3): 1328-1343.
Ravallion, M. 1994. Measuring Social Welfare With and Without Poverty Lines.
American Economic Review, 84(2): 359-364.
Ravallion, M. and Bidani, B. 1994. How Robust is a Poverty Profile? World Bank
Economic Review, 8(1): 75-102.
Ravallion, M. and Chen, S. 2004. China’s (Uneven) Progress Against Poverty.
Washington, DC: Development Research Group, World Bank.

205
Ravallion, M. and Chen, S. 1997. What Can New Survey Data Tell Us About Recent
Changes in Distribution and Poverty? World Bank Economic Review, 11: 357-82.
Ravallion, M. and Datt, G. 1999. When is Growth Pro-Poor? Evidence from Diverse
Experience of India’s States. Discussion Paper. Washington, DC: World Bank.
Rezende, F. 1998. Prospects for Brazil’s Economy. International Affairs, 74(3): 563-576.
Robertson, M. 1986. Legal Obstacles to Black Advancement, In Black Advancement in
the South African Economy, edited by Roy Smolan, Cape Town: Juta Press.
Rogerson, C. 2004. The Impact of the South African Government’s SMME Programs: A
Ten-Year Review (1994-2003). Department of Geography. University of the
Witwatersrand. Mimeo.
Ross, R. 1999. A Concise History of South Africa. Cambridge: Cambridge University
Press.
Rowntree, B.S. 1941. Poverty and Progress: A Second Social Survey of York. Longman.
Rowntree, B.S. 1908. Poverty: A Study of Town life. London: Macmillan.
Rowntree, B.S. 1901. Poverty: A Study of Town life. London: Macmillan.
Rwigema, H. and Karungu, P. 1999. SMME development in Johannesburg’s Southern
Metropolitan Local Council. Development Southern Africa, 16(1): 107-124.
Sachs, J.D. and Warner, A.M. 1995. Economic Reform and the Process of Global
Integration. Brookings Papers on Economic Activity 1995, 1 (August): 1-118.

206
Schiller, B.R. 2004. The Economics of Poverty and Discrimination (10th Edition).
Prentice Hall: New Jersey.
Schiller, B.R. 2001. The Economics of Poverty and Discrimination (8th Edition).
Prentice Hall: New Jersey.
Schiller, B.R. 1995. The Economics of Poverty and Discrimination (6th Edition).
Prentice Hall: New Jersey.
Schultz, T. W. 1963. The Economic Value of Education. New York: Columbia University
Press.
Schultz, T. W. 1960. Capital Formation by Education. Journal of Political Economy,
68(12): 571–583.
Sen, A.K. 1999. Development as Freedom (DAF). Oxford: Oxford University Press.
Sen, A.K. 1997. On Economic Inequality (2nd Edition). Oxford: Clarendon Press.
Sen, A.K. 1993. Capability and Well-Being, In The Quality of Life, pp. 30-53, edited by
M.C. Nussbaum and A.K. Sen, Oxford: Clarendon Press.
Sen, A.K. 1992. Inequality Reexamined. Cambridge, MA: Harvard University Press.
Sen, A.K. 1985. Commodities and Capabilities. Amsterdam: North-Holland.
Sen, A.K. 1983. Poor, Relatively Speaking. Oxford Economic Paper, 35: 153-69.
Sen, A.K. 1979. Issues in the Measurement of Poverty. Scandinavian Journal of
Economics, 81: 285-307.

207
Sen, A.K. 1976. Poverty: An Ordinal Approach to Measurement. Econometrica, 44(2):
219-231.
Setai, B. 1998. The Making of Poverty in South Africa. Southern Africa Specialized
Studies Series. Mount Pleasant, Harare Zimbabwe: SAPPHO.
Shaffer, P. 2001. New Thinking on Poverty: Implications for Globalization and Poverty
Reduction Strategies.
Shanahan, S.E. and Tuma, N.B. 1994. The Sociology of Distribution and Redistribution,
In The Handbook of Economic Sociology, edited by N.J. Smelser and R. Swedberg,
Princeton University Press, 733-65.
Simkins, C.E.W. and Hindson, D. 1979. The Division of Labor in South Africa, 1969-
1977. Pietermaritzburg: University of Natal.
Skeldon, R. 2003. Migration and Poverty. Paper Presented at the Conference, in
Johannesburg, South Africa, on African Migration and Urbanization in Comparative
Perspective, 4-7 June.
Skeldon, R. 1997. Rural-to-Urban Migration and Its Implications for Poverty Alleviation.
Asia-Pacific Population Journal, 12(1): 3-16.
Skweyiya, Z. 2006. Second Economy Interventions and Poverty Alleviation. Social
Cluster Briefing by Dr Zola Skweyiya, Minister of Social Development. Parliament,
Cape Town, 7 February.
State Statistical Bureau (SSB). 1980-2004. China Rural Statistical Yearbook. Beijing:
China Statistical Publishing House.

208
Statistics South Africa (StatsSA). 2002. Labor Force Survey September. Pretoria:
StatsSA.
Statistics South Africa (StatsSA). 2000. Measuring Poverty. Report No: 0-621-30092-6.
Pretoria: StatsSA.
Statistics South Africa (StatsSA). 1996. October Household Survey (OHS). Pretoria:
StatsSA.
Statistics South Africa (StatsSA). 1995. October Household Survey. Pretoria:
Government Printer.
Strauss, J. and Thomas, D. 1998. Health, Nutrition and Economic Development. Journal
of Economic Literature, 36: 766-817.
Streak, J.C. 2004. The Gear Legacy: Did Gear Fail or Move South Africa Forward in
Development? Development Southern Africa, 21: 273-288.
Swinkels, R. and Turk, C. 2003. Strategic Planning for Poverty Reduction in Vietnam:
Progress and Challenges for Meeting the Localized Millennium Development Goals.
Policy Research Working Paper 2961.
Tambunan, T. 2005. Linkages Between Macroeconomic Reform Policies, Shocks, and
Poverty Reduction: The Indonesian Case.
Tanzi,V. and Davoodi, H. 1997. Corruption, Public Investment and Growth. IMF
Working Paper 97/139.
Taylor Committee. 2002. Transforming the Present – Protecting the Future.
Consolidated Report of the Committee of Inquiry into a Comprehensive System of Social
Security for South Africa.

209
Taylor, L., Seeley, J. and Kajura, E. 1996. Informal care for illness in rural southwest
Uganda: the central role that women play. Health Transit Rev 6(1): 49-56.
Terreblanche, S. 2002. A History of Inequality in South Africa 1652-2002.
Pietermaritzburg: University of Natal Press.
Terreblanche, S.J. and Nattrass, N. 1990. A Periodization of the Political Economy from
1910. In The Political Economy of South Africa, edited by N. Nattrass and E. Ardington,
Cape Town: Oxford University Press.
The Economist. 2000a. Growth is Good. May 27.
The Economist. 2000b. Growth is Good. June 20.
Thorbecke, E. 1998. Note on Measurement of Poverty. Training Workshop on Poverty,
Income Distribution and Labour Markets, Cape Town, May 10-14.
Thwala, W.D. 2003. Backgrounder: Land and Agrarian Reform in South Africa. Land
Research Action Network.
Todaro, M.P. 2000. Economic Development (7th Edition). Addison-Wessley: Longman.
Todaro, M.P. and Smith, S.C. 2003. Economic Development (8th Edition). Addison-
Wessley: Longman.
Townsend, P. 1974. Inequality and the Health Service. Lancet, 15 June.
Townsend, P. 1970. Measures and Explanations of Poverty in High Income and Low
Income Countries: The Problems of Operationalising the Concepts of Development,

210
Class and Poverty, In The Concept of Poverty, edited by P. Townsend, London:
Heinemann.
Trapido, S. 1986. Putting a Plough to the Ground: A History of Tenant Production on the
Vereeniging Estates, 1896-1920, In Putting a Plough to the Ground: Accumulation and
Dispossession in Rural South Africa, 1850-1930, edited by W. Beinart, P. Delius, and S.
Trapido, Johannesburg: Ravan Press.
Tumwesigye, E. 2007. Poverty as a Major Challenge in HIV/AIDS.
Turner, S. 2005. Underlying Causes of Poverty in Lesotho. Maseru: CARE Lesotho.
Uccelli, F.A. 1997. Poverty Alleviation in Peru: The Search for Sustainable Social
Development.
Uganda Demographic and Health Survey. 2000/01. HIV/AIDS Survey Indicators
Database. (Online). Available from: www.measuredhs.com/hivdata/surveys
Uganda Demographic and Health Survey. 1995. HIV/AIDS Survey Indicators Database.
(Online). Available from: www.measuredhs.com/hivdata/surveys
UNAIDS. 2004. 2004 Report on the Global HIV/AIDS Epidemic: 4th Global Report.
UNAIDS/04.16E. Geneva: UNAIDS Africa Fact Sheet.
United Nations. 1996. Food Security for All, Food Security for Rural Women. Geneva:
International Steering Committee on Economic Advancement of Rural Women.
United Nations Development Program (UNDP). 2007/2008. Human Development
Report, 2007/2008. New York: Oxford University Press.

211
United Nations Development Program (UNDP). 2003. Human Development Report,
2003. New York: Oxford University Press.
United Nations Development Program (UNDP). 1997. Human Development Report,
1997. New York: Oxford University Press.
United Nations Development Program (UNDP). 1995. Human Development Report,
1995. New York: Oxford University Press.
United Nations Economic Commission for Africa (UNECA). 1999. Meeting the
Development Challenges in Africa. Opening Address to the Joint Conference of African
Ministers of Finance and Ministers of Economic Development and Planning by K.Y.
Amoako, Executive Secretary of ECA, Addis Ababa, 6 May.
Van der Berg, S. 1999. Social Policy to Address Poverty. DPRU Working Paper 99/30.
Development Policy Research Unit. University of Cape Town.
Van der Berg, S. and Bhorat, H. 1999. The Present as a Legacy of the Past: The Labor
Market, Inequality and Poverty in South Africa. DPRU Working Paper No. 01/29.
Van der Merwe, T. 2000. The Case for Social Security in South Africa: An Economic
Perspective. Development Southern Africa, 17(5).
Van der Merwe, T. 1996. Bestaansbeveiliging: ‘n Ekonomiese Perspektief. Unpublished
Dlitt et Phil Thesis. Pretoria: University of South Africa.
Various Church Organizations (Anglican Church, Cathederal Church, Catholic Church,
and numerous Christian NGO’s such as the Christian Aid as well as the Tearfund), 2004-
2006. General Recommendations by the Churches on What Needs to be Done in Order to
Reduce World Poverty.

212
Vu, T.A. 2005. Implementation of the National Programs for Poverty Reduction in
Vietnam.
Wang, S. 1994. Poverty Problems and Economic Development. Rural Reading Materials
Press.
Wang, S., Zhou, L. and Yanshun, R. 2004. The 8-7 National Poverty Reduction Program
in China - The National Strategy and its Impact. A Case Study from Reducing Poverty,
Sustaining Growth - What Works, What Doesn't and Why. Beijing: Institute of
Agricultural Economics, Chinese Academy of Agricultural Sciences.
Water and Sanitation Program—Africa Region. 2002. The National Water and Sanitation
Program in South Africa: Turning the ‘Right to Water’ into Reality.
Watkins, K. 2002. Making Globalization Work for the Poor. Finance and Development,
39(1): 24-26.
Weeks, J. 1999. Policy Forum: Stuck in Low Gear? Macroeconomic Policy in South
Africa 1996 – 1998. Shortened Version of a Paper in the Cambridge Journal of
Economics, Vol (7).
Weinns, T. B. 1998. Agriculture and Rural Poverty in Vietnam, In Household Welfare
and Vietnam’s Transition, edited by D. Dollar, P. Glewwe and J. Litvack, Regional and
Sectoral Studies, World Bank, Washington, D.C.
White, H. and Killick, T. 2001. African Poverty at the Millennium: Causes, Complexities,
and Challenges. Washington, D.C.: World Bank.
Whiteford, A.C. and McGrath, M. 1994. Distribution of Income in South Africa.
Pretoria: Human Sciences Research Council.

213
Whiteford, A. and van Seventer, D.E. 1999. Winners and Losers: South Africa’s
Changing Income Distribution in the 1990s. WEFA Southern Africa.
Wildeman, R.A. and Mbebetho, N. 2005. Reviewing Ten Years of the School Nutrition
Program. (Online). Available from: www.idasa.org.za
Williams, W.E. 1989. South Africa’s War Against Capitalism. New York: Prager.
Wilson F. and Ramphele M. 1989. Uprooting Poverty: The South African Challenge.
David Philip: Cape Town & Johannesburg.
Winters, A.L., McCulloch, N. and McKay, A. 2004. Trade Liberalization and Poverty:
the Evidence So Far. Journal of Economic Literature, XLII (March): 72-115.
Wood, G. 2003. Staying Secure, Staying Poor: The Faustian Bargain. World
Development, 31(3): 455-471.
Woolard, I. 2002. An Overview of Poverty and Inequality in South Africa. Working Paper
prepared for DFID (SA). Pretoria: UK Department of International Development.
Woolard, I. and Leibbrandt, M. 2001. Measuring Poverty in South Africa, In Fighting
Poverty: Labor Markets and Inequality in South Africa, edited by H. Bhorat, M.
Leibbrandt, M. Maziya, S. Van der Berg and S. Woolard, Cape Town: University of Cape
Town Press, 41-73.
World Bank. 2004a. World Development Indicators (WDI), 2004. (Online). Available
from: www.worldbank.org.data.
World Bank. 2004b. Vietnam Development Report, 2004: Attacking Poverty.
Washington, D.C.

214
World Bank. 2001a. Engendering Development: Through Gender Equality in Rights,
Resources, and Voice. Oxford University Press.
World Bank. 2001b. China: Overcoming Rural Poverty. The World Bank: Washington,
D.C.
World Bank. 2000/2001. World Development Report, 2000/2001. New York: Oxford
University.
World Bank. 2000. Poverty Reduction Strategy Source Book: Core Techniques and
Cross Cutting Issues. (Online). Available from:
www.worldbank.org/poverty/strategies/mailback.htm
World Bank. 1997. Health, Nutrition and Population Sector Strategy.
World Bank. 1995. Key Indicators of Poverty in South Africa. Analysis Prepared for the
Office of the Reconstruction and Development Program. Pretoria: South African
Communication Service.
World Bank. 1993. Implementing the World Bank’s Strategy to Reduce Poverty: Progress
and Challenges. World Bank: Washington, D.C.
World Bank. 1993. Investing in Health. World Development Report, 1993. Oxford:
University Press.
World Bank. 1990. World Development Report, 1990. London: Oxford University
Press.
World Bank and International Monetary Fund (IMF). 2002. Review of the Poverty
Reduction Strategy Paper (PRSP) Approach—Early Experience with Interim PRSPs and

215
Full PRSPs. Prepared by the Staffs of the World Bank and IMF. Processed: Washington,
D.C.
Wu, H.X. 1997. Reform in China’s Agriculture. Briefing Paper Series, No. 09.
Department of Trade: Australia.