Embed Size (px)
Citation preview
Poverty Maps of Eastern Samar2000 and 2002
Republika ng PilipinasPAMBANSANG LUPON SA UGNAYANG PANG-ESTADISTIKA(NATIONAL STATISTICAL COORDINATION BOARD)REGIONAL DIVISION VIII

INTRODUCTION
The National Statistical Coordination Board (NSCB), the agency mandated to come up with poverty statistics, has releasedthe 2000 provincial poverty statistics early last year. This was in response to the need for a more disaggregated data that can beused by local executives, planners and policy makers. To further serve the needs of LGUs especially at the municipal level, theNSCB started to produce poverty maps covering the poorest 44 provinces in the country. The maps are useful tools for identifyingpriority areas that should benefit from poverty alleviation programs. They also show the relative position of the municipalities interms of the overall poverty situation in the province.
In the poverty mapping activity, we adopted the Minimum Basic Needs (MBN) Framework which contains the three majorconcerns: Survival, Security and Enabling. The methodology involves the computation of the municipal indexes of each of the MBNindicators. These indexes are then plotted on the map using a Geographic Information System (GIS) software.
The NSCB Regional Division VIII is preparing poverty maps for the 5 provinces in the region belonging to the poorest 44provinces in the country which include the Province of Eastern Samar (Annex A). The poverty maps for Eastern Samar weregenerated using the MBN data gathered by the Provincial Planning and Development Office (PPDO). The 2000 and 2002 datawere used to compare the poverty situation of the municipalities. The maps were validated by concerned LGUs, agencies andprivate sector during a Users’ Forum on Poverty Mapping in Eastern Samar held on October 24, 2003, at the Provincial Governor’sConference Hall, Provincial Capitol, Borongan, Eastern Samar. The activity was funded by the German Technical CooperationPoverty Alleviation Program Samar Island (gtz PAPSI). The maps are targetted to be updated annually.
i
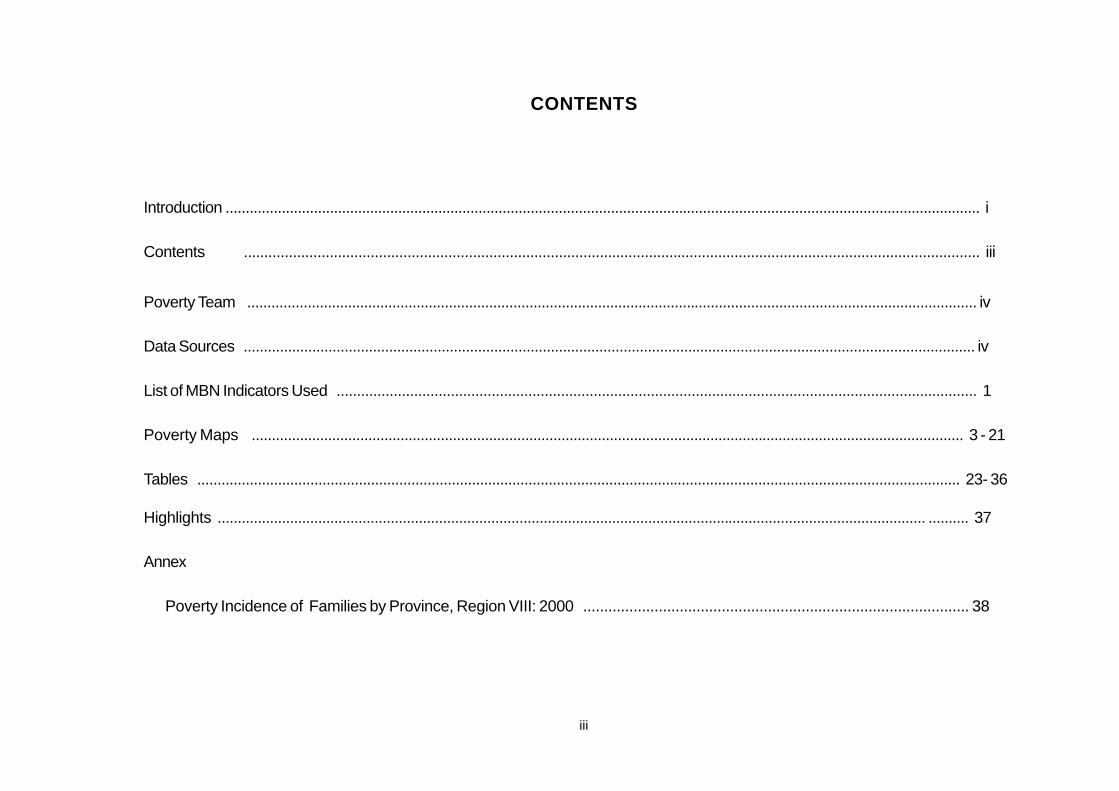
CONTENTS
Introduction ............................................................................................................................................................................................ i
Contents .................................................................................................................................................................................... iii
Poverty Team ..................................................................................................................................................................................... iv
Data Sources ..................................................................................................................................................................................... iv
List of MBN Indicators Used ............................................................................................................................................................. 1
Poverty Maps ................................................................................................................................................................................. 3 - 21
Tables ............................................................................................................................................................................................. 23- 36
Highlights ................................................................................................................................................................................ .......... 37
Annex
Poverty Incidence of Families by Province, Region VIII: 2000 ............................................................................................ 38
iii

iv
POVERTY TEAM
NATIONAL STATISTICAL COORDINATION BOARD PROVINCIAL PLANNING AND DEVELOPMENT OFFICE
Ms. Evangeline M. Paran Mr. Henry M. Afable Regional Head Provincial Planning and Development Coordinator
Ms. Riza N. Moraleta Ms. Editha A. Azura Statistical Coordination Officer II Planning Officer I
Ms. Jane B. Gotico Mr. Oscar T. Solis Information Officer I Computer Operator
DATA SOURCES
Commission on Elections, Eastern Samar Provincial Office
Department of Education, Division of Eastern Samar
National Statistics Office
Philippine National Police, Eastern Samar Provincial Office
Provincial Health Office-Eastern Samar
1
SURVIVALNutrition
Malnutrition rate under 7 years oldPercentage of school children 7-12 years old
who are moderately and severely underweightNewborn with weight at least 2.5 kilograms
HealthInfant mortality rateChild mortality rate
Number and ratio of medical and other health workers to population
Water and SanitationAccess to potable water
LIST OF MINIMUM BASIC NEEDS INDICATORS USED
ENABLINGBasic Education and Literacy
Elementary participation rateCompletion rate
People’s ParticipationFamily members able to vote at election
SECURITYPeace and Order/Public Safety
Number of victims of crime against personNumber of victims of crime against property

POVERTY MAPS
OF EASTERN SAMAR
2000 and 2002

NutritionMalnourished Children
Under 7 Years Old 2002Provincial Index = 100
(10.4%)
2000Provincial Index = 100
(11.3%)
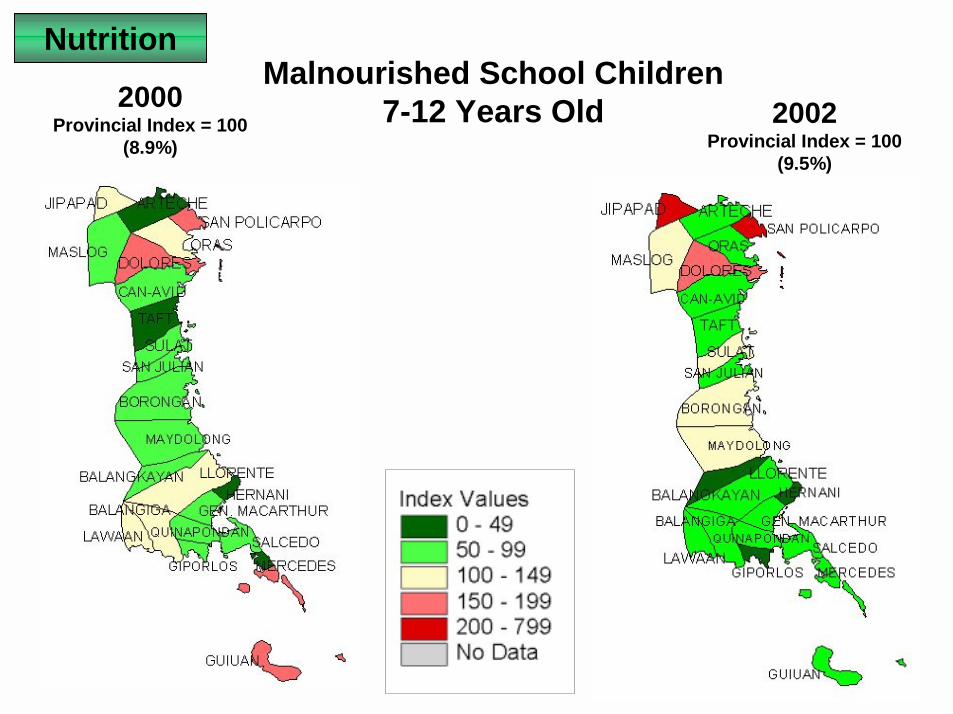
2002Provincial Index = 100
(9.5%)
Nutrition
2000Provincial Index = 100
(8.9%)
Malnourished School Children7-12 Years Old
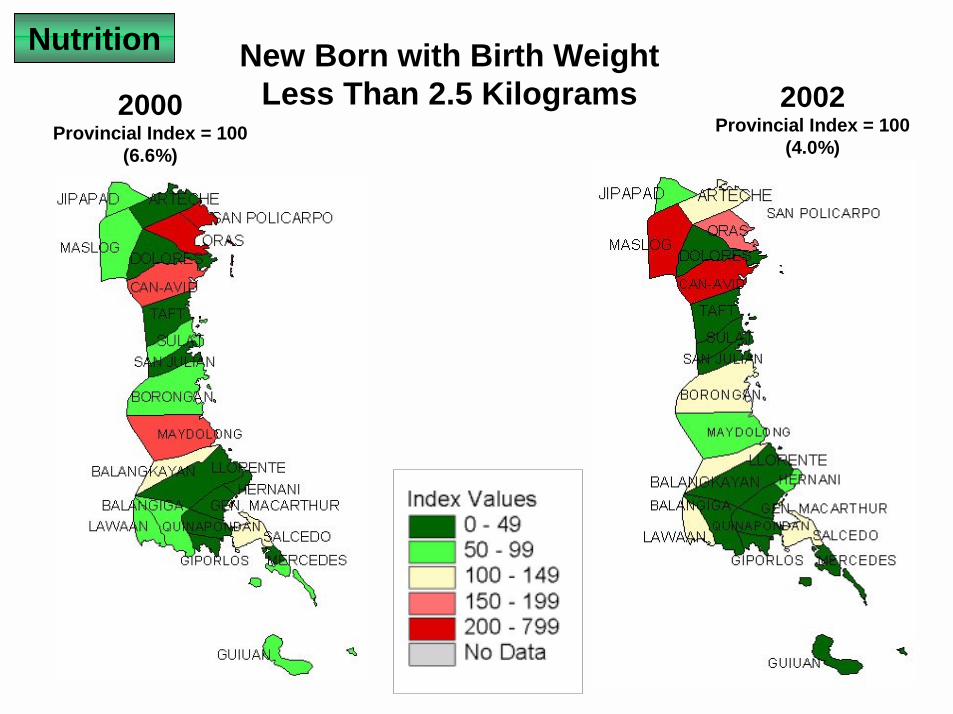
New Born with Birth Weight Less Than 2.5 Kilograms2000
Provincial Index = 100(6.6%)
2002Provincial Index = 100
(4.0%)
Nutrition
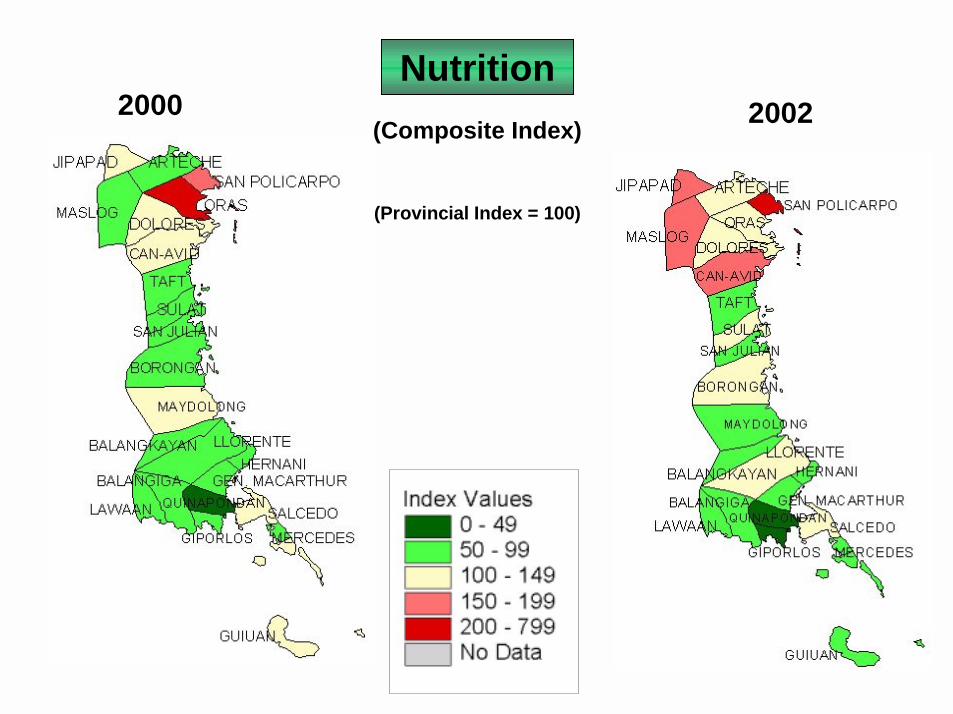
Nutrition20022000
(Composite Index)
(Provincial Index = 100)
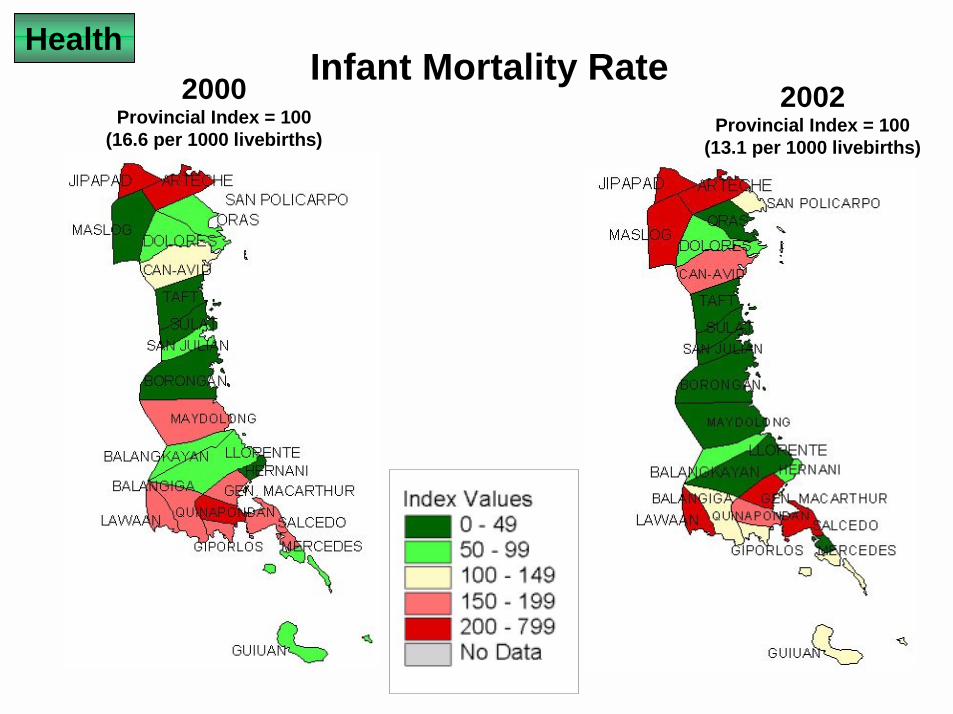
Infant Mortality RateHealth
2002Provincial Index = 100
(13.1 per 1000 livebirths)
2000Provincial Index = 100
(16.6 per 1000 livebirths)

Child Mortality Rate
Provincial Index = 100(3.9 per 1,000 livebirths)
Health
Provincial Index = 100(3.7 per 1,000 livebirths)
20022000
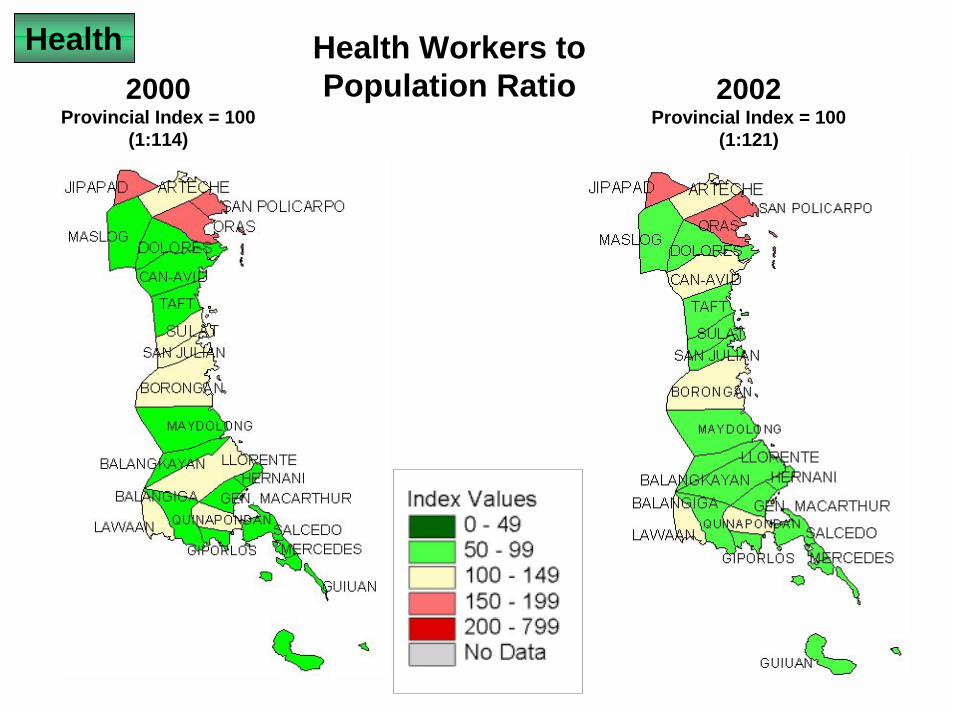
Health Workers to Population Ratio2000
Provincial Index = 100(1:114)
2002Provincial Index = 100
(1:121)
Health

Health2000 2002(Composite Index)
(Provincial Index = 100)

Percentage of Households WithoutAccess to Safewater2000
Provincial Index = 100(24.5%)
2002Provincial Index = 100
(9.4%)
Water and Sanitation
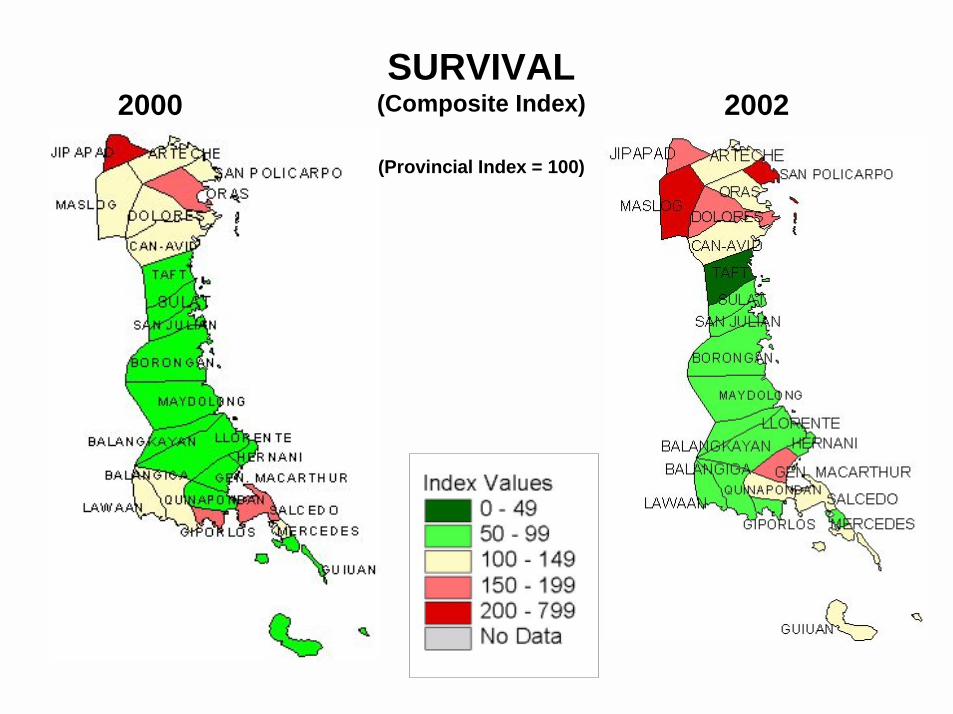
2000 2002SURVIVAL
(Composite Index)
(Provincial Index = 100)
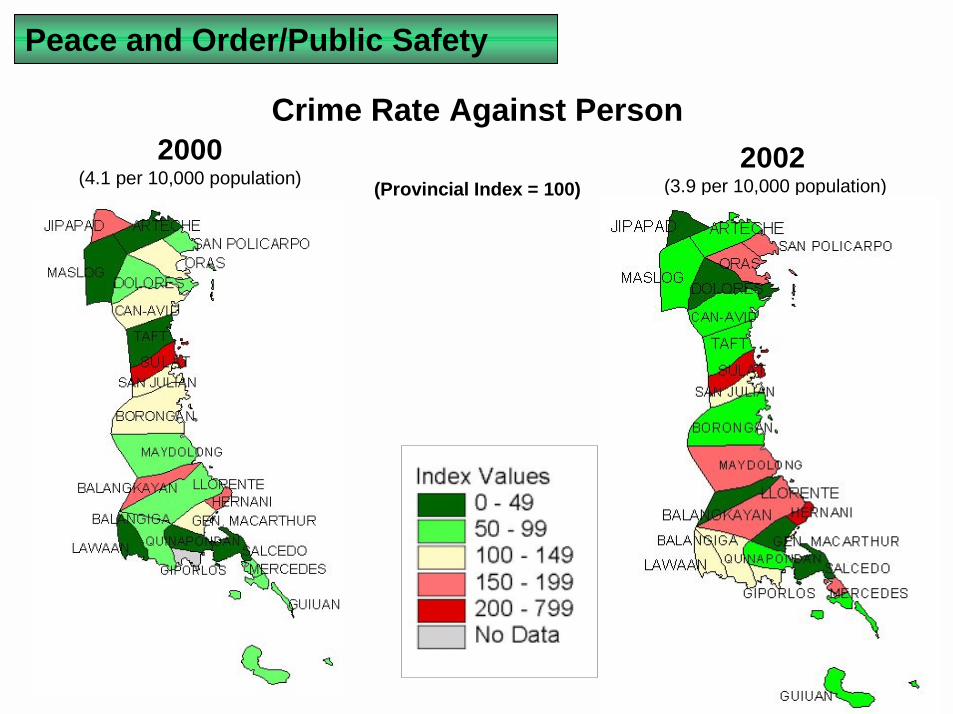
2000(4.1 per 10,000 population)
2002(3.9 per 10,000 population)
Crime Rate Against Person
(Provincial Index = 100)
Peace and Order/Public Safety

2000(0.7 per 10,000 population)
2002(0.7 per 10,000 population)
Crime Rate Against Property
(Provincial Index = 100)
Peace and Order/Public Safety

2000 2002
SECURITY(Peace and Order/Public Safety)
(Provincial Index = 100)
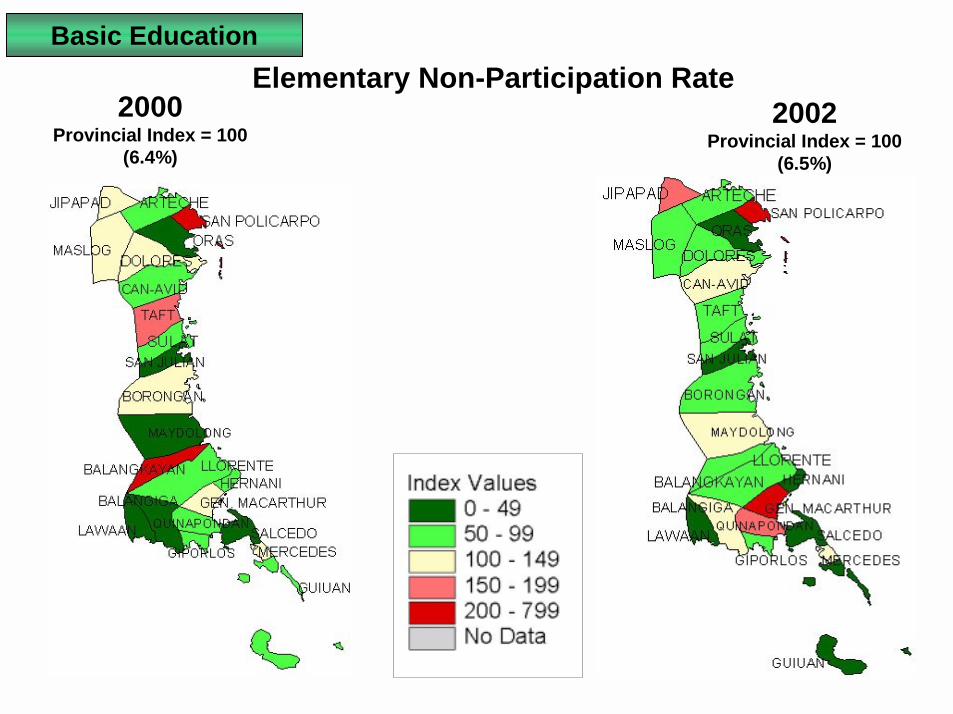
Basic Education
2002Provincial Index = 100
(6.5%)
2000Provincial Index = 100
(6.4%)
Elementary Non-Participation Rate

Elementary Non-Completion RateBasic Education
2000Provincial Index = 100
(29.3%)
2002Provincial Index = 100
(31.8%)

Percentage of Registered Voters Who Actually Did Not Vote
People’s Participation
2000Provincial Index = 100
(11.1%)2002
Provincial Index = 100(21.6%)

20022000ENABLING
(Composite Index)
(Provincial Index = 100)

20022000POVERTY INDEX
(Provincial Index = 100)

Table 1. Number of Malnourished Children Under 7 Years Old by Municipality, Eastern Samar: 2000 and 2002
2000 2002 2000 2002 2000 2002 2000 2002Arteche 298 495 2,825 2,621 10.5 18.9 94 182Balangiga 104 102 1,867 1,903 5.6 5.4 49 52Balangkayan 136 105 1,833 1,907 7.4 5.5 66 53Borongan 869 832 7,192 9,039 12.1 9.2 107 89Can-avid 390 562 3,271 3,443 11.9 16.3 106 157Dolores 922 772 5,382 5,791 17.1 13.3 152 128Gen. MacArthur 200 131 1,721 1,921 11.6 6.8 103 66Giporlos 614 144 6,320 1,935 9.7 7.4 86 72Guiuan 155 556 1,771 6,761 8.8 8.2 78 79Hernani 156 111 1211 1066 12.9 10.4 114 100Jipapad 282 239 1323 1,409 21.3 17.0 189 163Lawaan 108 118 1,614 1,589 6.7 7.4 59 72Llorente 306 426 3,128 3,417 9.8 12.5 87 120Maslog 79 77 982 784 8.0 9.8 71 95Maydolong 271 275 2,130 2,316 12.7 11.9 113 114Mercedes 106 58 941 1033 11.3 5.6 100 54Oras 718 689 5,572 6,320 12.9 10.9 114 105Quinapondan 114 91 1,993 2,042 5.7 4.5 51 43Salcedo 465 418 2,443 2,606 19.0 16.0 169 154San Julian 209 250 1,893 2,419 11.0 10.3 98 100San Policarpo 167 293 1,716 2,568 9.7 11.4 86 110Sulat 133 162 2,944 3,001 4.5 5.4 40 52Taft 383 357 3,729 4,066 10.3 8.8 91 85Eastern Samar 7,185 7,263 63,801 69,957 11.3 10.4 100 1001 Malnourished children - moderately and severely underweight children
Source of basic data: Provincial Health Office, Eastern Samar
IndexMunicipalityNumber of Malnourished
Children1 Under 7 Years OldNumber of Children Under
5 Years Old Weighed% Malnourished Children
Under 7 Years Old

Table 2. Number and Percentage of Elementary School Children 7-12 Years Old Who are Moderately and Severely Underweight by Municipality, Eastern Samar: 2000 and 2002
2000 2002 2000 2002 2000 2002 2000 2002 2000 2002Arteche 76 164 12 6 2252 2717 3.9 6.3 44 66Balangiga 211 154 15 11 2128 2248 10.6 7.3 119 78Balangkayan 71 70 6 3 1657 1647 4.6 4.4 52 47Borongan 747 1025 40 75 10290 10470 7.6 10.5 86 111Can-avid 248 246 15 16 3339 3420 7.9 7.7 88 81Dolores 864 590 100 276 6885 5392 14.0 16.1 157 170Gen. MacArthur 128 89 14 22 2399 2281 5.9 4.9 66 51Giporlos 151 39 0 2 2051 2140 7.4 1.9 83 20Guiuan 981 573 83 33 6875 7566 15.5 8.0 174 85Hernani 70 72 2 0 1665 1639 4.3 4.4 49 46Jipapad 122 259 14 29 1341 1273 10.1 22.6 114 239Lawaan 202 141 15 13 1767 1890 12.3 8.1 138 86Llorente 292 240 23 11 3410 3262 9.2 7.7 104 81Maslog 22 60 9 16 569 619 5.4 12.3 61 130Maydolong 107 237 1 4 2143 2148 5.0 11.2 57 119Mercedes 27 56 0 3 790 831 3.4 7.1 38 75Oras 355 285 140 88 4812 6078 10.3 6.1 115 65Quinapondan 131 115 11 8 2344 2389 6.1 5.1 68 54Salcedo 183 292 0 14 3396 3289 5.4 9.3 60 98San Julian 156 149 6 34 2360 2329 6.9 7.9 77 83San Policarpo 316 695 6 54 2226 2266 14.5 33.1 162 349Sulat 135 316 2 14 2303 2342 5.9 14.1 67 149Taft 126 140 3 3 3026 3004 4.3 4.8 48 50Eastern Samar 5,721 6,007 517 735 70,028 71,240 8.9 9.5 100 100
Source of basic data: Provincial Health Office, Eastern Samar
Years Old% Underweight Children 7-12 IndexMunicipality Years Old
Total Number of Children7-12 Years Old WeighedYears Old
Number of Moderately Number of Severely Underweight Children 7-12 Underweight Children 7-12

Table 3. Number of Newborn with Weight of at Least 2.5 kgs by Municipality, Eastern Samar: 2000 and 2002
2000 2002 2000 2002 2000 2002 2000 2002Arteche 343 247 346 259 0.9 4.6 13 116Balangiga 269 261 280 261 3.9 0.0 60 0Balangkayan 217 158 233 167 6.9 5.4 104 135Borongan 1,056 1,327 1,107 1,383 4.6 4.0 70 101Can-avid 474 472 539 530 12.1 10.9 183 273Dolores 1,073 933 1,091 946 1.6 1.4 25 34Gen. MacArthur 324 176 330 176 1.8 0.0 28 0Giporlos 324 256 329 257 1.5 0.4 23 10Guiuan 970 943 1,020 960 4.9 1.8 74 44Hernani 182 143 187 147 2.7 2.7 41 68Jipapad 210 190 221 194 5.0 2.1 75 51Lawaan 172 214 179 223 3.9 4.0 59 101Llorente 451 420 453 420 0.4 0.0 7 0Maslog 122 110 128 127 4.7 13.4 71 334Maydolong 251 284 289 291 13.1 2.4 199 60Mercedes 140 128 143 128 2.1 0.0 32 0Oras 746 836 994 899 24.9 7.0 378 175Quinapondan 324 318 330 319 1.8 0.3 28 8Salcedo 358 362 394 379 9.1 4.5 138 112San Julian 316 245 316 247 0.0 0.8 0 20San Policarpo 257 164 328 263 21.6 37.6 328 940Sulat 657 661 682 661 3.7 0.0 56 0Taft 476 479 479 479 0.6 0.0 9 0Eastern Samar 9712 9327 10398 9716 6.6 4.0 100 100
Source of basic data: Provincial Health Office, Eastern Samar
MunicipalityPercentage of Newborn w/ Weight
Less than 2.5 kgs. IndexNumber of Newborn w/ Weight at Birth, 2.5 kgs. & greater Number of Livebirths
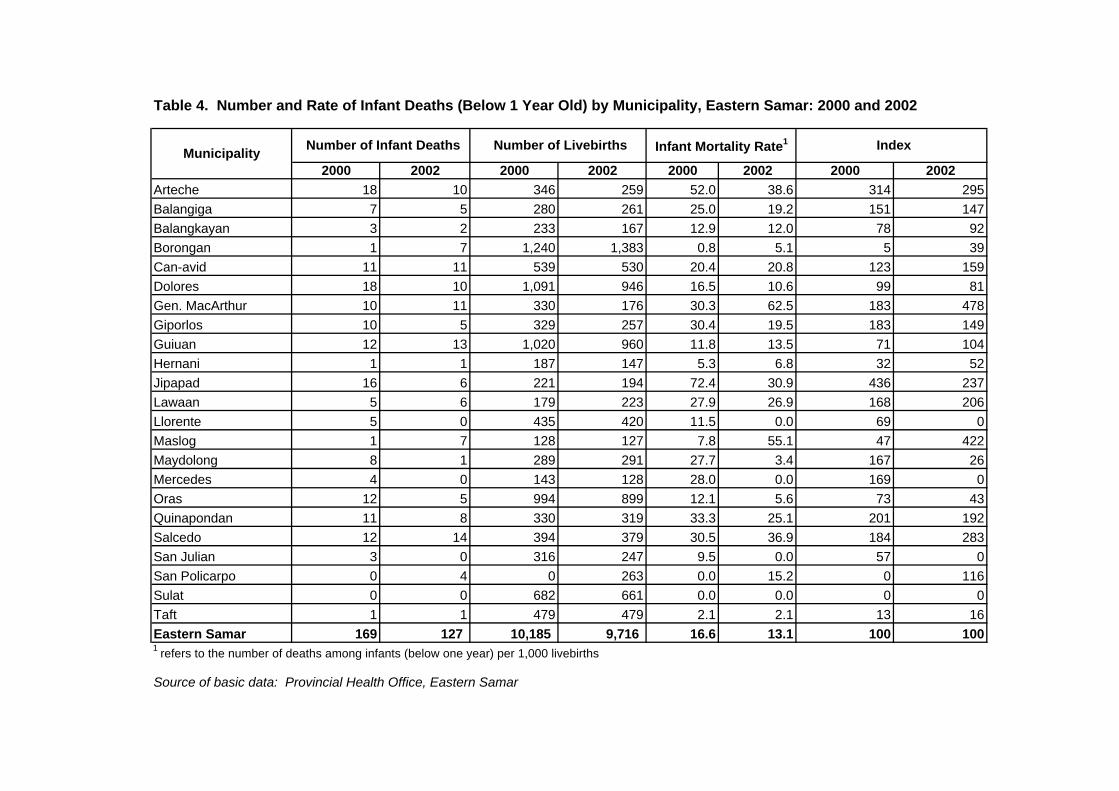
Table 4. Number and Rate of Infant Deaths (Below 1 Year Old) by Municipality, Eastern Samar: 2000 and 2002
2000 2002 2000 2002 2000 2002 2000 2002Arteche 18 10 346 259 52.0 38.6 314 295Balangiga 7 5 280 261 25.0 19.2 151 147Balangkayan 3 2 233 167 12.9 12.0 78 92Borongan 1 7 1,240 1,383 0.8 5.1 5 39Can-avid 11 11 539 530 20.4 20.8 123 159Dolores 18 10 1,091 946 16.5 10.6 99 81Gen. MacArthur 10 11 330 176 30.3 62.5 183 478Giporlos 10 5 329 257 30.4 19.5 183 149Guiuan 12 13 1,020 960 11.8 13.5 71 104Hernani 1 1 187 147 5.3 6.8 32 52Jipapad 16 6 221 194 72.4 30.9 436 237Lawaan 5 6 179 223 27.9 26.9 168 206Llorente 5 0 435 420 11.5 0.0 69 0Maslog 1 7 128 127 7.8 55.1 47 422Maydolong 8 1 289 291 27.7 3.4 167 26Mercedes 4 0 143 128 28.0 0.0 169 0Oras 12 5 994 899 12.1 5.6 73 43Quinapondan 11 8 330 319 33.3 25.1 201 192Salcedo 12 14 394 379 30.5 36.9 184 283San Julian 3 0 316 247 9.5 0.0 57 0San Policarpo 0 4 0 263 0.0 15.2 0 116Sulat 0 0 682 661 0.0 0.0 0 0Taft 1 1 479 479 2.1 2.1 13 16Eastern Samar 169 127 10,185 9,716 16.6 13.1 100 1001 refers to the number of deaths among infants (below one year) per 1,000 livebirths
Source of basic data: Provincial Health Office, Eastern Samar
IndexMunicipality Number of Infant Deaths Number of Livebirths Infant Mortality Rate1
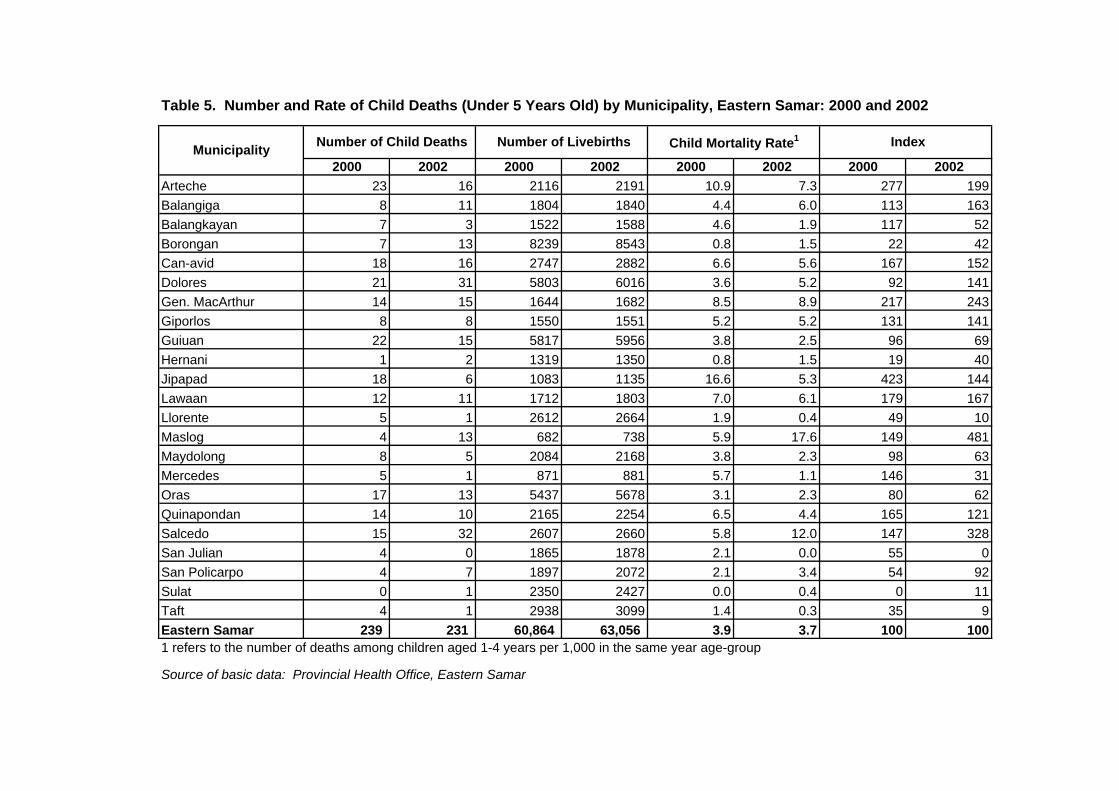
Table 5. Number and Rate of Child Deaths (Under 5 Years Old) by Municipality, Eastern Samar: 2000 and 2002
2000 2002 2000 2002 2000 2002 2000 2002Arteche 23 16 2116 2191 10.9 7.3 277 199Balangiga 8 11 1804 1840 4.4 6.0 113 163Balangkayan 7 3 1522 1588 4.6 1.9 117 52Borongan 7 13 8239 8543 0.8 1.5 22 42Can-avid 18 16 2747 2882 6.6 5.6 167 152Dolores 21 31 5803 6016 3.6 5.2 92 141Gen. MacArthur 14 15 1644 1682 8.5 8.9 217 243Giporlos 8 8 1550 1551 5.2 5.2 131 141Guiuan 22 15 5817 5956 3.8 2.5 96 69Hernani 1 2 1319 1350 0.8 1.5 19 40Jipapad 18 6 1083 1135 16.6 5.3 423 144Lawaan 12 11 1712 1803 7.0 6.1 179 167Llorente 5 1 2612 2664 1.9 0.4 49 10Maslog 4 13 682 738 5.9 17.6 149 481Maydolong 8 5 2084 2168 3.8 2.3 98 63Mercedes 5 1 871 881 5.7 1.1 146 31Oras 17 13 5437 5678 3.1 2.3 80 62Quinapondan 14 10 2165 2254 6.5 4.4 165 121Salcedo 15 32 2607 2660 5.8 12.0 147 328San Julian 4 0 1865 1878 2.1 0.0 55 0San Policarpo 4 7 1897 2072 2.1 3.4 54 92Sulat 0 1 2350 2427 0.0 0.4 0 11Taft 4 1 2938 3099 1.4 0.3 35 9Eastern Samar 239 231 60,864 63,056 3.9 3.7 100 1001 refers to the number of deaths among children aged 1-4 years per 1,000 in the same year age-group
Source of basic data: Provincial Health Office, Eastern Samar
IndexMunicipality Number of Child Deaths Number of Livebirths Child Mortality Rate1
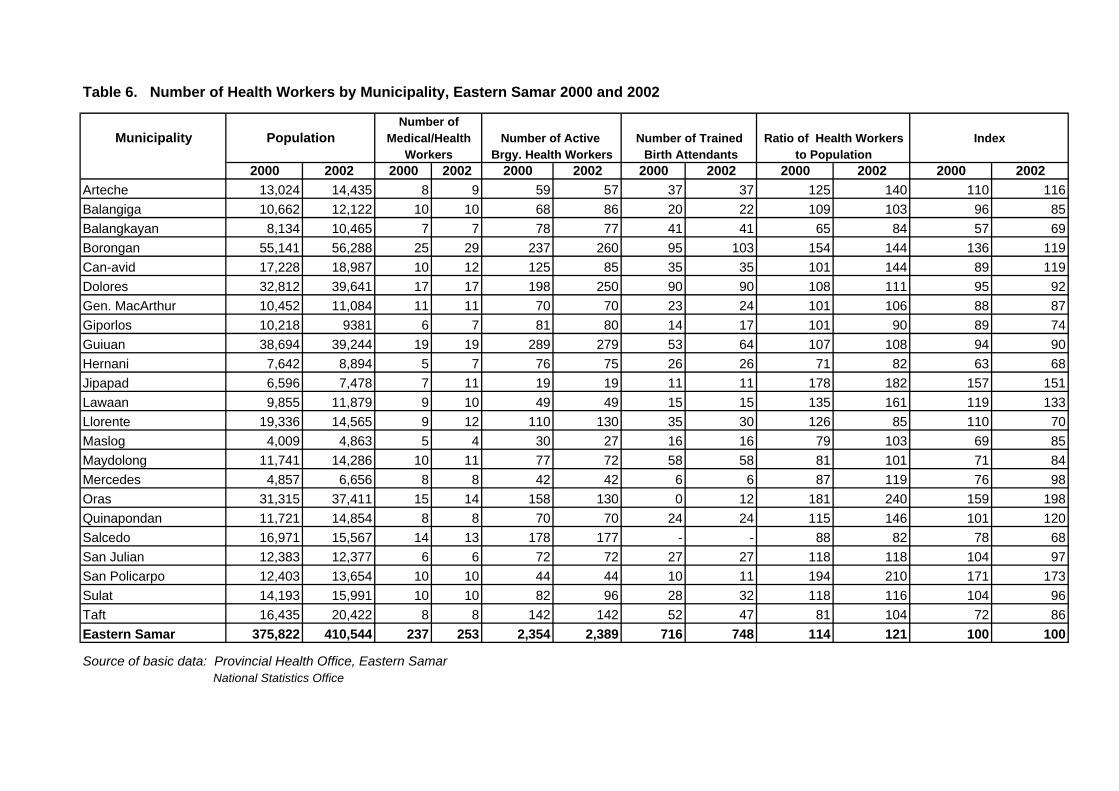
Table 6. Number of Health Workers by Municipality, Eastern Samar 2000 and 2002
Municipality
2000 2002 2000 2002 2000 2002 2000 2002 2000 2002 2000 2002Arteche 13,024 14,435 8 9 59 57 37 37 125 140 110 116Balangiga 10,662 12,122 10 10 68 86 20 22 109 103 96 85Balangkayan 8,134 10,465 7 7 78 77 41 41 65 84 57 69Borongan 55,141 56,288 25 29 237 260 95 103 154 144 136 119Can-avid 17,228 18,987 10 12 125 85 35 35 101 144 89 119Dolores 32,812 39,641 17 17 198 250 90 90 108 111 95 92Gen. MacArthur 10,452 11,084 11 11 70 70 23 24 101 106 88 87Giporlos 10,218 9381 6 7 81 80 14 17 101 90 89 74Guiuan 38,694 39,244 19 19 289 279 53 64 107 108 94 90Hernani 7,642 8,894 5 7 76 75 26 26 71 82 63 68Jipapad 6,596 7,478 7 11 19 19 11 11 178 182 157 151Lawaan 9,855 11,879 9 10 49 49 15 15 135 161 119 133Llorente 19,336 14,565 9 12 110 130 35 30 126 85 110 70Maslog 4,009 4,863 5 4 30 27 16 16 79 103 69 85Maydolong 11,741 14,286 10 11 77 72 58 58 81 101 71 84Mercedes 4,857 6,656 8 8 42 42 6 6 87 119 76 98Oras 31,315 37,411 15 14 158 130 0 12 181 240 159 198Quinapondan 11,721 14,854 8 8 70 70 24 24 115 146 101 120Salcedo 16,971 15,567 14 13 178 177 - - 88 82 78 68San Julian 12,383 12,377 6 6 72 72 27 27 118 118 104 97San Policarpo 12,403 13,654 10 10 44 44 10 11 194 210 171 173Sulat 14,193 15,991 10 10 82 96 28 32 118 116 104 96Taft 16,435 20,422 8 8 142 142 52 47 81 104 72 86Eastern Samar 375,822 410,544 237 253 2,354 2,389 716 748 114 121 100 100
Source of basic data: Provincial Health Office, Eastern Samar National Statistics Office
Brgy. Health WorkersWorkers
Number ofPopulation Medical/Health Number of Active Index
Birth AttendantsRatio of Health WorkersNumber of Trained
to Population
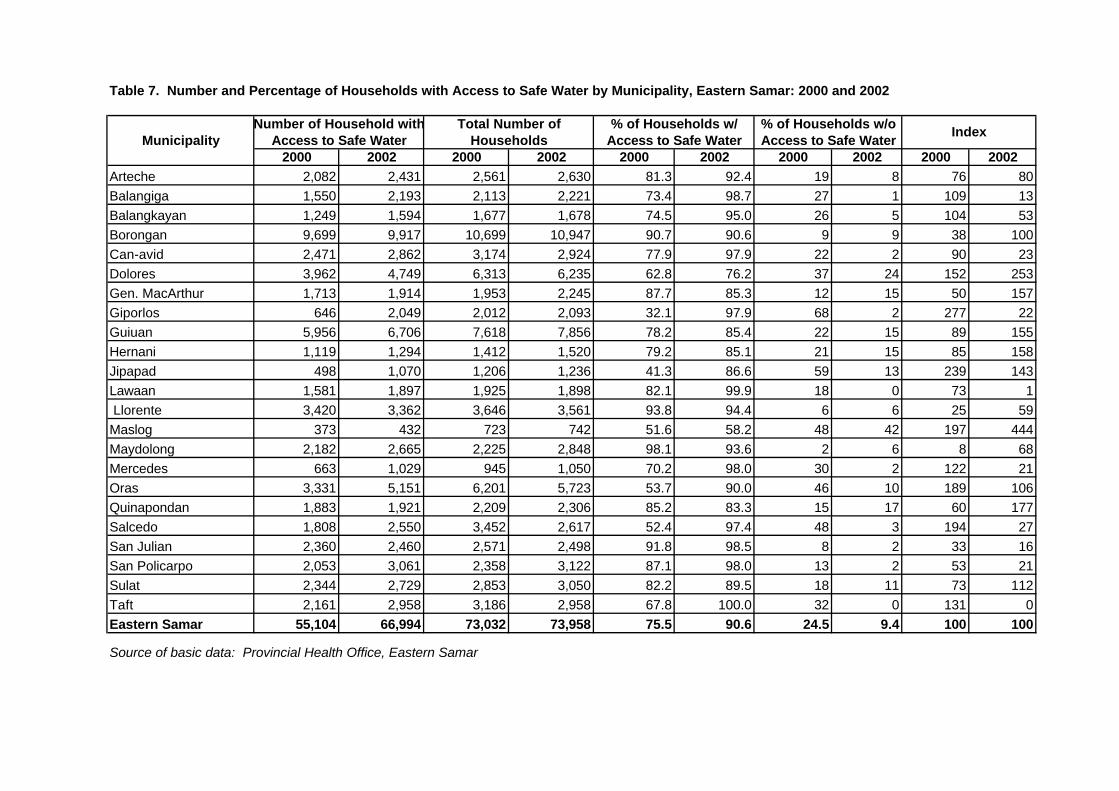
Table 7. Number and Percentage of Households with Access to Safe Water by Municipality, Eastern Samar: 2000 and 2002
Municipality2000 2002 2000 2002 2000 2002 2000 2002 2000 2002
Arteche 2,082 2,431 2,561 2,630 81.3 92.4 19 8 76 80Balangiga 1,550 2,193 2,113 2,221 73.4 98.7 27 1 109 13Balangkayan 1,249 1,594 1,677 1,678 74.5 95.0 26 5 104 53Borongan 9,699 9,917 10,699 10,947 90.7 90.6 9 9 38 100Can-avid 2,471 2,862 3,174 2,924 77.9 97.9 22 2 90 23Dolores 3,962 4,749 6,313 6,235 62.8 76.2 37 24 152 253Gen. MacArthur 1,713 1,914 1,953 2,245 87.7 85.3 12 15 50 157Giporlos 646 2,049 2,012 2,093 32.1 97.9 68 2 277 22Guiuan 5,956 6,706 7,618 7,856 78.2 85.4 22 15 89 155Hernani 1,119 1,294 1,412 1,520 79.2 85.1 21 15 85 158Jipapad 498 1,070 1,206 1,236 41.3 86.6 59 13 239 143Lawaan 1,581 1,897 1,925 1,898 82.1 99.9 18 0 73 1 Llorente 3,420 3,362 3,646 3,561 93.8 94.4 6 6 25 59Maslog 373 432 723 742 51.6 58.2 48 42 197 444Maydolong 2,182 2,665 2,225 2,848 98.1 93.6 2 6 8 68Mercedes 663 1,029 945 1,050 70.2 98.0 30 2 122 21Oras 3,331 5,151 6,201 5,723 53.7 90.0 46 10 189 106Quinapondan 1,883 1,921 2,209 2,306 85.2 83.3 15 17 60 177Salcedo 1,808 2,550 3,452 2,617 52.4 97.4 48 3 194 27San Julian 2,360 2,460 2,571 2,498 91.8 98.5 8 2 33 16San Policarpo 2,053 3,061 2,358 3,122 87.1 98.0 13 2 53 21Sulat 2,344 2,729 2,853 3,050 82.2 89.5 18 11 73 112Taft 2,161 2,958 3,186 2,958 67.8 100.0 32 0 131 0Eastern Samar 55,104 66,994 73,032 73,958 75.5 90.6 24.5 9.4 100 100
Source of basic data: Provincial Health Office, Eastern Samar
Number of Household with Total Number ofAccess to Safe Water Households Index% of Households w/
Access to Safe Water% of Households w/oAccess to Safe Water
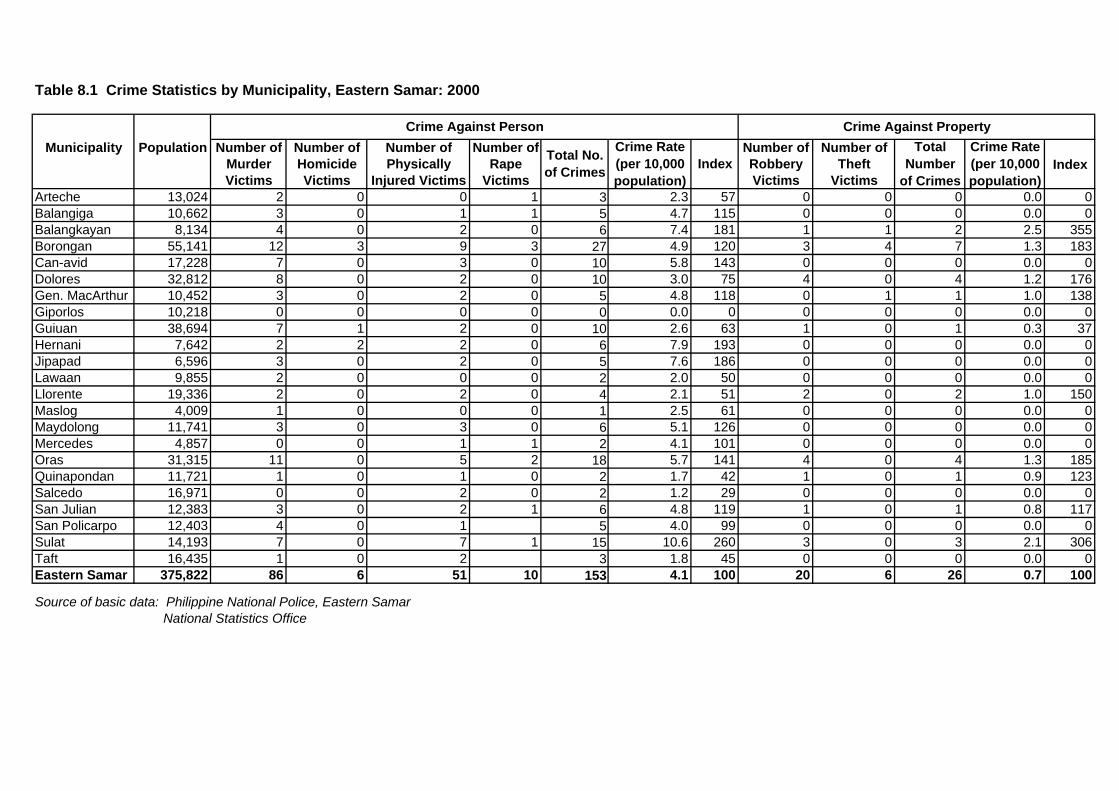
Table 8.1 Crime Statistics by Municipality, Eastern Samar: 2000
Municipality Population Number of Number of Number of Number of Number of Number ofMurder Homicide Physically Rape Robbery Theft IndexVictims Victims Injured Victims Victims Victims Victims
Arteche 13,024 2 0 0 1 3 2.3 57 0 0 0 0.0 0Balangiga 10,662 3 0 1 1 5 4.7 115 0 0 0 0.0 0Balangkayan 8,134 4 0 2 0 6 7.4 181 1 1 2 2.5 355Borongan 55,141 12 3 9 3 27 4.9 120 3 4 7 1.3 183Can-avid 17,228 7 0 3 0 10 5.8 143 0 0 0 0.0 0Dolores 32,812 8 0 2 0 10 3.0 75 4 0 4 1.2 176Gen. MacArthur 10,452 3 0 2 0 5 4.8 118 0 1 1 1.0 138Giporlos 10,218 0 0 0 0 0 0.0 0 0 0 0 0.0 0Guiuan 38,694 7 1 2 0 10 2.6 63 1 0 1 0.3 37Hernani 7,642 2 2 2 0 6 7.9 193 0 0 0 0.0 0Jipapad 6,596 3 0 2 0 5 7.6 186 0 0 0 0.0 0Lawaan 9,855 2 0 0 0 2 2.0 50 0 0 0 0.0 0Llorente 19,336 2 0 2 0 4 2.1 51 2 0 2 1.0 150Maslog 4,009 1 0 0 0 1 2.5 61 0 0 0 0.0 0Maydolong 11,741 3 0 3 0 6 5.1 126 0 0 0 0.0 0Mercedes 4,857 0 0 1 1 2 4.1 101 0 0 0 0.0 0Oras 31,315 11 0 5 2 18 5.7 141 4 0 4 1.3 185Quinapondan 11,721 1 0 1 0 2 1.7 42 1 0 1 0.9 123Salcedo 16,971 0 0 2 0 2 1.2 29 0 0 0 0.0 0San Julian 12,383 3 0 2 1 6 4.8 119 1 0 1 0.8 117San Policarpo 12,403 4 0 1 5 4.0 99 0 0 0 0.0 0Sulat 14,193 7 0 7 1 15 10.6 260 3 0 3 2.1 306Taft 16,435 1 0 2 3 1.8 45 0 0 0 0.0 0Eastern Samar 375,822 86 6 51 10 153 4.1 100 20 6 26 0.7 100
Source of basic data: Philippine National Police, Eastern Samar National Statistics Office
Total Number
of Crimes
Crime Rate (per 10,000 population)
Crime Against Property
Total No. of Crimes
Crime Against PersonCrime Rate (per 10,000 population)
Index

Table 8.2 Crime Statistics by Municipality, Eastern Samar: 2002
Municipality Population Number of Number of Number of Number of Number of Number ofMurder Homicide Physically Rape Robbery TheftVictims Victims Injured Victims Victims Victims Victims
Arteche 14,435 4 0 1 0 5 3.5 88 1 0 1 0.7 102Balangiga 12,122 2 1 2 0 5 4.1 105 2 0 2 1.6 242Balangkayan 10,465 1 1 0 0 2 1.9 48 1 2 3 2.9 420Borongan 56,288 7 0 9 5 21 3.7 95 2 2 4 0.7 104Can-avid 18,987 4 0 1 0 5 2.6 67 1 0 1 0.5 77Dolores 39,641 1 1 0 0 2 0.5 13 1 0 1 0.3 37Gen. MacArthur 11,084 0 1 0 0 1 0.9 23 0 0 0 0.0 0Giporlos 9381 2 1 2 0 5 5.3 135 0 0 0 0.0 0Guiuan 39,244 3 0 3 2 8 2.0 52 0 3 3 0.8 112Hernani 8,894 2 1 7 0 10 11.2 285 0 1 1 1.1 165Jipapad 7,478 1 0 0 0 1 1.3 34 0 0 0.0 0Lawaan 11,879 0 2 3 0 5 4.2 107 0 0 0 0.0 0Llorente 14,565 3 1 4 1 9 6.2 157 4 0 4 2.7 403Maslog 4,863 1 0 0 0 1 2.1 52 0 0 0 0.0 0Maydolong 14,286 3 1 6 0 10 7.0 177 0 0 0 0.0 0Mercedes 6,656 1 0 3 0 4 6.0 152 0 0 0 0.0 0Oras 37,411 18 0 4 1 23 6.1 156 2 0 2 0.5 78Quinapondan 14,854 1 0 2 0 3 2.0 51 2 0 2 1.3 197Salcedo 15,567 1 1 0 0 2 1.3 33 1 0 1 0.6 94San Julian 12,377 5 0 1 0 6 4.8 123 0 0 0 0.0 0San Policarpo 13,654 6 0 4 0 10 7.3 186 2 0 2 1.5 215Sulat 15,991 9 0 7 0 16 10.0 254 0 0 0 0.0 0Taft 20,422 3 5 0 0 8 3.9 99 0 1 1 0.5 72Eastern Samar 410,544 78 16 59 9 162 3.9 100 19 9 28 0.7 100
Source of basic data: Philippine National Police, Eastern Samar National Statistics Office
Total No. of Crimes
Crime Against PersonCrime Rate (per 10,000 population)
IndexIndexTotal
Number of Crimes
Crime Rate (per 10,000 population)
Crime Against Property
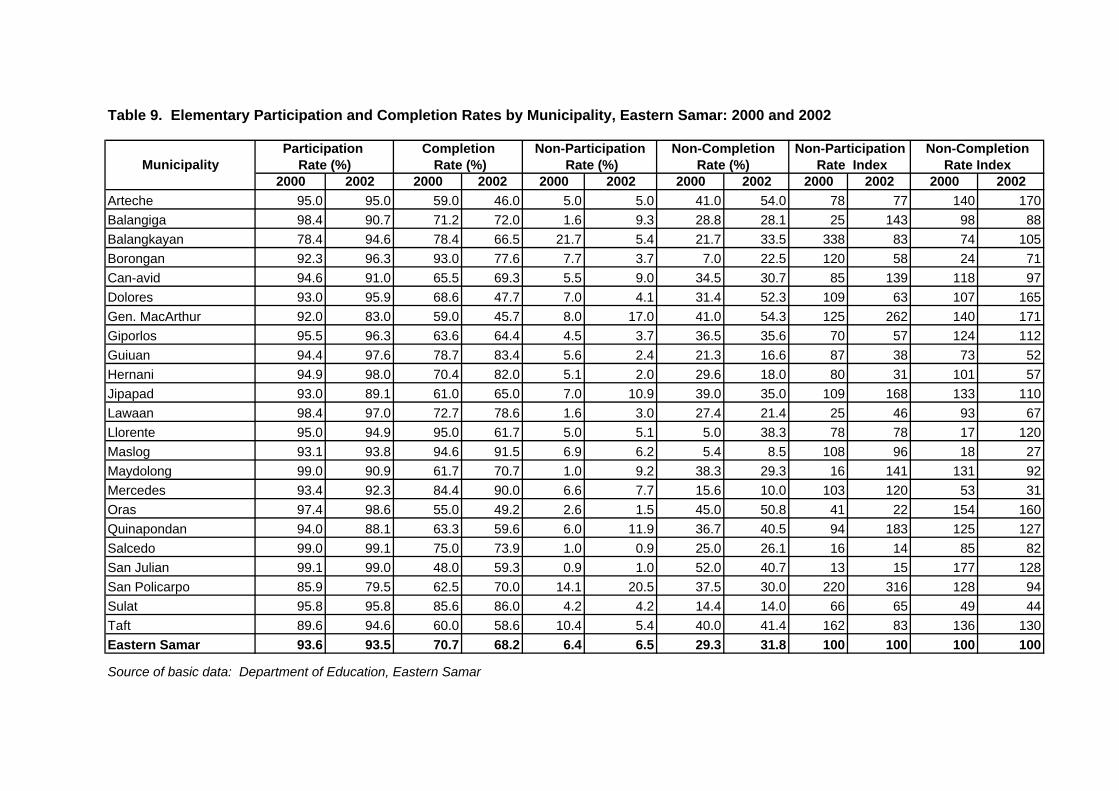
Table 9. Elementary Participation and Completion Rates by Municipality, Eastern Samar: 2000 and 2002
2000 2002 2000 2002 2000 2002 2000 2002 2000 2002 2000 2002Arteche 95.0 95.0 59.0 46.0 5.0 5.0 41.0 54.0 78 77 140 170Balangiga 98.4 90.7 71.2 72.0 1.6 9.3 28.8 28.1 25 143 98 88Balangkayan 78.4 94.6 78.4 66.5 21.7 5.4 21.7 33.5 338 83 74 105Borongan 92.3 96.3 93.0 77.6 7.7 3.7 7.0 22.5 120 58 24 71Can-avid 94.6 91.0 65.5 69.3 5.5 9.0 34.5 30.7 85 139 118 97Dolores 93.0 95.9 68.6 47.7 7.0 4.1 31.4 52.3 109 63 107 165Gen. MacArthur 92.0 83.0 59.0 45.7 8.0 17.0 41.0 54.3 125 262 140 171Giporlos 95.5 96.3 63.6 64.4 4.5 3.7 36.5 35.6 70 57 124 112Guiuan 94.4 97.6 78.7 83.4 5.6 2.4 21.3 16.6 87 38 73 52Hernani 94.9 98.0 70.4 82.0 5.1 2.0 29.6 18.0 80 31 101 57Jipapad 93.0 89.1 61.0 65.0 7.0 10.9 39.0 35.0 109 168 133 110Lawaan 98.4 97.0 72.7 78.6 1.6 3.0 27.4 21.4 25 46 93 67Llorente 95.0 94.9 95.0 61.7 5.0 5.1 5.0 38.3 78 78 17 120Maslog 93.1 93.8 94.6 91.5 6.9 6.2 5.4 8.5 108 96 18 27Maydolong 99.0 90.9 61.7 70.7 1.0 9.2 38.3 29.3 16 141 131 92Mercedes 93.4 92.3 84.4 90.0 6.6 7.7 15.6 10.0 103 120 53 31Oras 97.4 98.6 55.0 49.2 2.6 1.5 45.0 50.8 41 22 154 160Quinapondan 94.0 88.1 63.3 59.6 6.0 11.9 36.7 40.5 94 183 125 127Salcedo 99.0 99.1 75.0 73.9 1.0 0.9 25.0 26.1 16 14 85 82San Julian 99.1 99.0 48.0 59.3 0.9 1.0 52.0 40.7 13 15 177 128San Policarpo 85.9 79.5 62.5 70.0 14.1 20.5 37.5 30.0 220 316 128 94Sulat 95.8 95.8 85.6 86.0 4.2 4.2 14.4 14.0 66 65 49 44Taft 89.6 94.6 60.0 58.6 10.4 5.4 40.0 41.4 162 83 136 130Eastern Samar 93.6 93.5 70.7 68.2 6.4 6.5 29.3 31.8 100 100 100 100
Source of basic data: Department of Education, Eastern Samar
Non-CompletionRate Index
Non-ParticipationRate (%) Rate Index
Non-CompletionRate (%)Municipality Rate (%) Rate (%)
Participation Completion Non-Participation
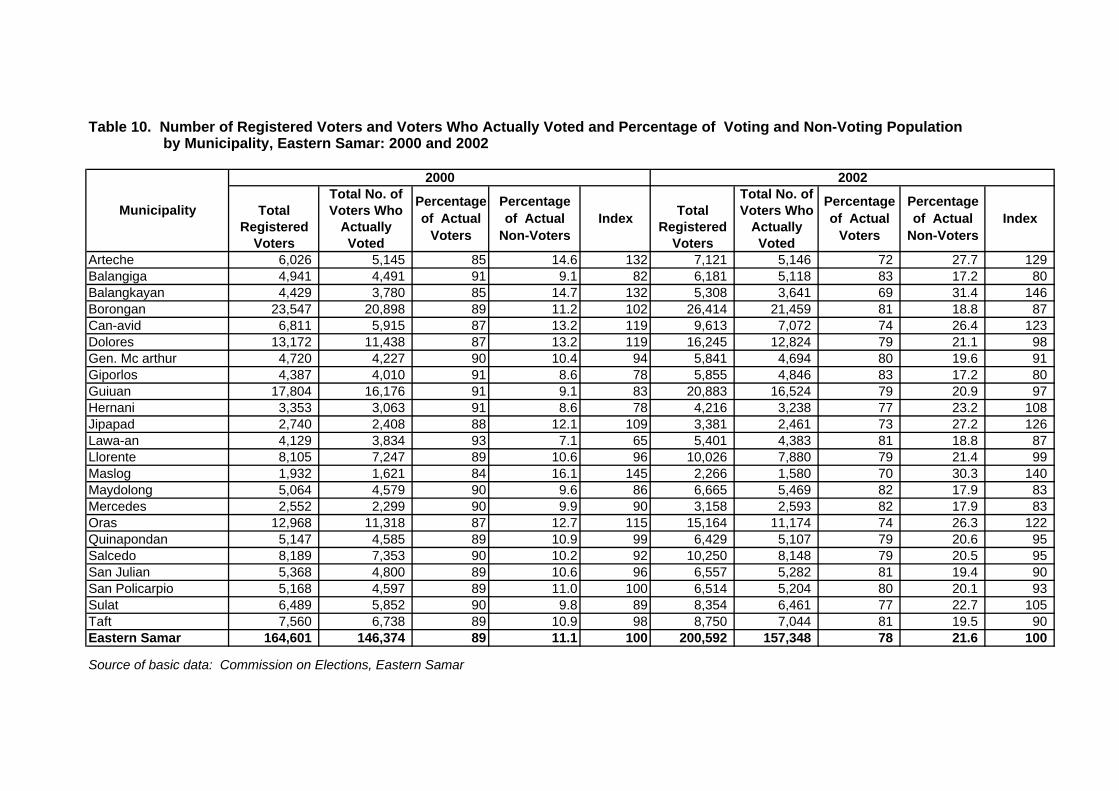
Table 10. Number of Registered Voters and Voters Who Actually Voted and Percentage of Voting and Non-Voting Population
Total No. of Total No. ofTotal Voters Who Total Voters Who
Registered Actually Registered ActuallyVoters Voted Voters Voted
Arteche 6,026 5,145 85 14.6 132 7,121 5,146 72 27.7 129 Balangiga 4,941 4,491 91 9.1 82 6,181 5,118 83 17.2 80 Balangkayan 4,429 3,780 85 14.7 132 5,308 3,641 69 31.4 146 Borongan 23,547 20,898 89 11.2 102 26,414 21,459 81 18.8 87 Can-avid 6,811 5,915 87 13.2 119 9,613 7,072 74 26.4 123 Dolores 13,172 11,438 87 13.2 119 16,245 12,824 79 21.1 98 Gen. Mc arthur 4,720 4,227 90 10.4 94 5,841 4,694 80 19.6 91 Giporlos 4,387 4,010 91 8.6 78 5,855 4,846 83 17.2 80 Guiuan 17,804 16,176 91 9.1 83 20,883 16,524 79 20.9 97 Hernani 3,353 3,063 91 8.6 78 4,216 3,238 77 23.2 108 Jipapad 2,740 2,408 88 12.1 109 3,381 2,461 73 27.2 126 Lawa-an 4,129 3,834 93 7.1 65 5,401 4,383 81 18.8 87 Llorente 8,105 7,247 89 10.6 96 10,026 7,880 79 21.4 99 Maslog 1,932 1,621 84 16.1 145 2,266 1,580 70 30.3 140 Maydolong 5,064 4,579 90 9.6 86 6,665 5,469 82 17.9 83 Mercedes 2,552 2,299 90 9.9 90 3,158 2,593 82 17.9 83 Oras 12,968 11,318 87 12.7 115 15,164 11,174 74 26.3 122 Quinapondan 5,147 4,585 89 10.9 99 6,429 5,107 79 20.6 95 Salcedo 8,189 7,353 90 10.2 92 10,250 8,148 79 20.5 95 San Julian 5,368 4,800 89 10.6 96 6,557 5,282 81 19.4 90 San Policarpio 5,168 4,597 89 11.0 100 6,514 5,204 80 20.1 93 Sulat 6,489 5,852 90 9.8 89 8,354 6,461 77 22.7 105 Taft 7,560 6,738 89 10.9 98 8,750 7,044 81 19.5 90 Eastern Samar 164,601 146,374 89 11.1 100 200,592 157,348 78 21.6 100
Source of basic data: Commission on Elections, Eastern Samar
2002
Percentage of Actual
Voters
Percentage of Actual
Non-VotersIndex
Percentage of Actual
Voters
Percentage of Actual
Non-VotersIndexMunicipality
2000
by Municipality, Eastern Samar: 2000 and 2002

Table 11. Summary of Indices, Eastern Samar: 2000
Municipality
% of Under- weight
Children Under 7 yrs old
% of Under- weight
Children 7-12 yrs old
Newborn with
birthweight <2.5 KG WT
NUTRITIONInfant
Mortality Rate
Child Mortality
Rate
Health Workers to Population
Ratio
HEALTH
% of HH without
Access to Safe
Water
WATER
Crime Rate
Against Person
Crime Rate
Against Property
PEACE AND
ORDER
Non-Participation
to Elem. School
Non-Completion
to Elem. School
BASIC EDUCATION
% of Registered voters who actually did
not vote
PEOPLE'S PARTICIPATION SURVIVAL SECURITY ENABLING POVERTY
INDEX RANK*
ARTECHE 44 94 13 50 314 277 110 234 76 76 57 0 28 78 140 109 132 132 120 28 121 90 12
BALANGIGA 119 49 60 84 151 113 96 120 109 109 115 0 58 26 98 62 82 82 104 58 72 78 18.5
BALANGKAYAN 52 66 104 74 78 117 57 84 104 104 181 355 268 339 74 206 132 132 87 268 169 175 1
BORONGAN 86 107 70 88 5 22 136 54 38 38 120 183 152 120 24 72 102 102 60 152 87 100 8
CAN-AVID 88 106 183 126 123 167 89 126 90 90 143 0 71 85 118 102 119 119 114 71 110 99 9
DOLORES 157 152 25 111 99 92 95 95 152 152 75 176 126 110 107 108 119 119 120 126 114 120 5
GEN. MACARTHUR 66 78 28 72 183 217 88 163 50 50 118 138 128 126 140 133 94 94 95 128 114 112 6
GIPORLOS 83 103 23 70 183 131 89 135 277 277 0 0 0 70 124 97 78 78 160 0 87 83 14
GUIUAN 174 86 74 111 71 96 94 87 89 89 63 37 50 87 73 80 83 83 96 50 81 76 20
HERNANI 49 114 41 68 32 19 63 38 85 85 193 0 96 80 101 90 78 78 63 96 84 81 15
JIPAPAD 114 189 75 126 436 423 157 339 239 239 186 0 93 109 133 121 109 109 235 93 115 148 2
LAWAAN 138 59 59 86 168 179 119 155 73 73 50 0 25 26 93 59 65 65 105 25 62 64 23
LLORENTE 104 87 7 95 69 49 110 80 25 25 51 150 100 79 17 48 96 96 67 100 72 80 16
MASLOG 61 71 71 68 47 149 69 89 197 197 61 0 31 108 18 63 145 145 118 31 104 84 13
MAYDOLONG 57 113 199 123 167 98 71 112 8 8 126 0 63 16 131 73 86 86 81 63 80 75 21.5
MERCEDES 38 100 32 69 169 146 76 111 122 122 101 0 51 104 53 78 90 90 101 51 84 78 18.5
ORAS 115 114 378 203 73 80 159 104 189 189 141 185 163 41 154 97 115 115 165 163 106 145 3
QUINAPONDAN 68 51 28 49 201 165 101 156 60 60 42 123 83 94 125 110 99 99 88 83 104 92 11
SALCEDO 60 169 138 123 184 147 78 136 194 194 29 0 14 16 85 50 92 92 151 14 71 79 17
SAN JULIAN 77 98 0 88 57 55 104 97 33 33 119 117 118 13 177 95 96 96 73 118 96 95 10
SAN POLICARPO 162 86 328 192 - 54 171 112 53 53 99 0 50 221 128 174 100 100 119 50 137 102 7
SULAT 67 40 56 53 0 0 104 107 73 73 260 306 283 66 49 57 89 89 78 283 73 144 4
TAFT 48 91 9 70 13 35 72 40 131 131 45 0 22 163 136 149 98 98 80 22 124 75 21.5* Rank 1 has worst poverty index.

Table 12. Summary of Indices, Eastern Samar: 2002
Municipality
% of Under- weight
Children Under 7 yrs
old
% of Under- weight
Children 7-12 yrs old
Newborn with
birthweight <2.5 KG
WT
NUTRITIONInfant
Mortality Rate
Child Mortality
Rate
Health Workers to Population
Ratio
HEALTH
% of HH without
Access to Safe
Water
WATER
Crime Rate
Against
Person
Crime Rate
Against
Property
PEACE AND
ORDER
Non-Participation to Elem.
School
Non-Completion
to Elem. School
BASIC EDUCATION
% of Registered voters who actually did
not vote
PEOPLE'S PARTICIPA
TIONSURVIVAL SECURITY ENABLING POVERTY
INDEX RANK*
ARTECHE 182 66 116 121 295 199 116 203 80 80 88 102 95 77 170 124 129 129 135 95 126 119 6.5
BALANGIGA 52 78 0 52 147 163 85 132 13 13 105 242 125 143 88 116 80 80 66 125 98 96 14
BALANGKAYAN 53 47 135 78 92 52 69 71 53 53 48 420 103 83 105 94 146 146 67 103 120 97 13
BORONGAN 89 111 101 100 39 42 119 66 100 100 95 104 96 58 71 64 87 87 89 96 76 87 16
CAN-AVID 157 81 273 171 159 152 119 143 23 23 67 77 68 139 97 118 123 123 112 68 120 100 12
DOLORES 128 170 34 111 81 141 92 104 253 253 13 37 16 63 165 114 98 98 156 16 106 93 15
GEN. MACARTHUR 66 51 0 66 478 243 87 270 157 157 23 0 19 262 171 216 91 91 164 19 154 112 8
GIPORLOS 72 20 10 34 149 141 74 121 22 22 135 0 115 57 112 85 80 80 59 115 82 86 17
GUIUAN 79 85 44 69 104 69 90 87 155 155 52 112 61 38 52 45 97 97 104 61 71 78 22.5
HERNANI 100 46 68 72 52 40 68 53 158 158 285 165 267 31 57 44 108 108 94 267 76 146 3
JIPAPAD 163 239 51 151 237 144 151 177 143 143 34 0 29 168 110 139 126 126 157 29 133 106 10.5
LAWAAN 72 86 101 86 206 167 133 168 1 1 107 0 91 46 67 57 87 87 85 91 72 83 19
LLORENTE 120 81 0 120 0 10 70 40 59 59 157 403 193 78 120 99 99 99 73 193 99 122 5
MASLOG 95 130 334 186 422 481 85 329 444 444 52 0 44 96 27 61 140 140 320 44 101 155 2
MAYDOLONG 114 119 60 98 26 63 84 58 68 68 177 0 151 141 92 117 83 83 75 151 100 109 9
MERCEDES 54 75 0 54 0 31 98 65 21 21 152 0 130 120 31 76 83 83 47 130 79 85 18
ORAS 105 65 175 115 43 62 198 101 106 106 156 78 144 22 160 91 122 122 107 144 107 119 6.5
QUINAPONDAN 43 54 8 35 192 121 120 144 177 177 51 197 73 183 127 155 95 95 119 73 125 106 10.5
SALCEDO 154 98 112 122 283 328 68 226 27 27 33 94 42 14 82 48 95 95 125 42 72 79 21
SAN JULIAN 100 83 20 68 0 0 97 97 16 16 123 0 105 15 128 72 90 90 60 105 81 82 20
SAN POLICARPO 110 349 940 466 116 92 173 127 21 21 186 215 190 316 94 205 93 93 205 190 149 181 1
SULAT 52 149 0 52 0 11 96 53 112 112 254 0 216 65 44 54 105 105 72 216 80 123 4
TAFT 85 50 0 85 16 9 86 37 0 0 99 72 95 83 130 107 90 90 40 95 98 78 22.5* Rank 1 has worst poverty index.
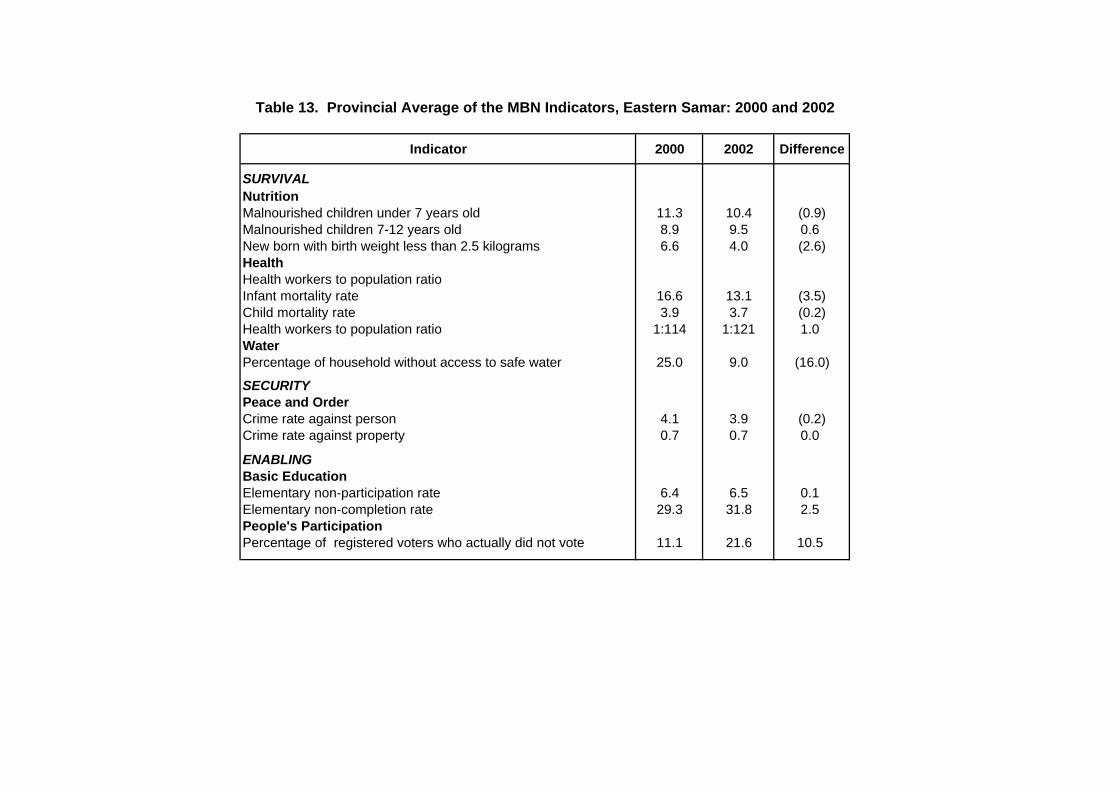
Indicator 2000 2002 Difference
SURVIVALNutritionMalnourished children under 7 years old 11.3 10.4 (0.9)Malnourished children 7-12 years old 8.9 9.5 0.6New born with birth weight less than 2.5 kilograms 6.6 4.0 (2.6)HealthHealth workers to population ratioInfant mortality rate 16.6 13.1 (3.5)Child mortality rate 3.9 3.7 (0.2)Health workers to population ratio 1:114 1:121 1.0WaterPercentage of household without access to safe water 25.0 9.0 (16.0)
SECURITYPeace and OrderCrime rate against person 4.1 3.9 (0.2)Crime rate against property 0.7 0.7 0.0
ENABLINGBasic EducationElementary non-participation rate 6.4 6.5 0.1Elementary non-completion rate 29.3 31.8 2.5People's ParticipationPercentage of registered voters who actually did not vote 11.1 21.6 10.5
Table 13. Provincial Average of the MBN Indicators, Eastern Samar: 2000 and 2002
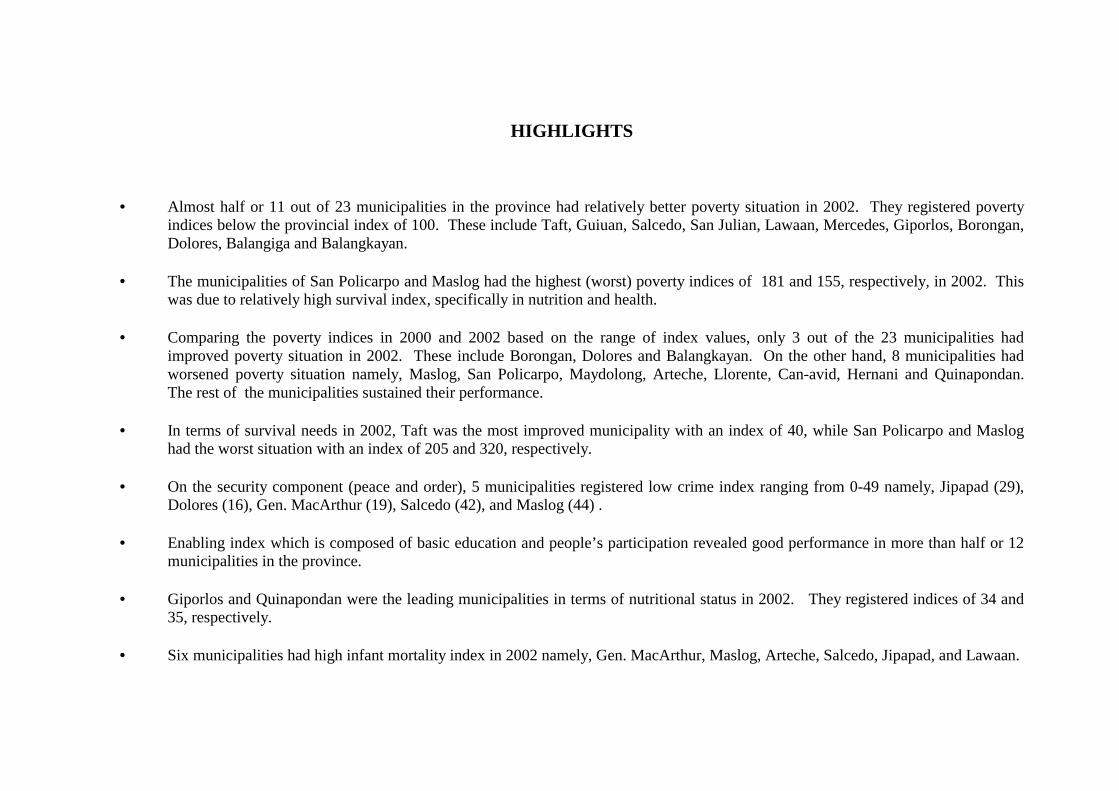
HIGHLIGHTS
• Almost half or 11 out of 23 municipalities in the province had relatively better poverty situation in 2002. They registered poverty indices below the provincial index of 100. These include Taft, Guiuan, Salcedo, San Julian, Lawaan, Mercedes, Giporlos, Borongan, Dolores, Balangiga and Balangkayan.
• The municipalities of San Policarpo and Maslog had the highest (worst) poverty indices of 181 and 155, respectively, in 2002. This
was due to relatively high survival index, specifically in nutrition and health. • Comparing the poverty indices in 2000 and 2002 based on the range of index values, only 3 out of the 23 municipalities had
improved poverty situation in 2002. These include Borongan, Dolores and Balangkayan. On the other hand, 8 municipalities had worsened poverty situation namely, Maslog, San Policarpo, Maydolong, Arteche, Llorente, Can-avid, Hernani and Quinapondan. The rest of the municipalities sustained their performance.
• In terms of survival needs in 2002, Taft was the most improved municipality with an index of 40, while San Policarpo and Maslog
had the worst situation with an index of 205 and 320, respectively. • On the security component (peace and order), 5 municipalities registered low crime index ranging from 0-49 namely, Jipapad (29),
Dolores (16), Gen. MacArthur (19), Salcedo (42), and Maslog (44) . • Enabling index which is composed of basic education and people’s participation revealed good performance in more than half or 12
municipalities in the province. • Giporlos and Quinapondan were the leading municipalities in terms of nutritional status in 2002. They registered indices of 34 and
35, respectively. • Six municipalities had high infant mortality index in 2002 namely, Gen. MacArthur, Maslog, Arteche, Salcedo, Jipapad, and Lawaan.

Annex A
Province Incidence of Poor Families (%) Rank1
Region VIII 37.8 6
Leyte 36.1 40Biliran 34.8 42Southern Leyte 28.5 55Samar 40.7 31Eastern Samar 47.3 17Northern Samar 40.7 30
1/ Rank of Region VIII among the 16 regions in the country, and rank of provinces in the region among the 77 provinces in the country and 4 districts of NCR, from the poorest.Source: National Statistical Coordination Board
Poverty Incidence of Families by Province, Region VIII: 2000