Embed Size (px)
Citation preview

1

2
POVERTY IN KAZAKHSTAN: CAUSES AND CURES
Report materials could be reproduced in other publications, without prior permission of UNDP,provided proper reference is made to this publication.
The views expressed in this report are those of the authors and do not necessarily represent theviews of UNDP.

3
Poverty in CIS countries is caused in part bythe economic transition they are currentlyundergoing. Major problems are adverseconditions in the labor market and inequalities inthe distribution of national wealth, both of whichwere triggered by geopolitical and economicturmoil during the initial period of independenceand restructuring.
The Government of Kazakhstan has committeditself to address poverty. Kazakhstan has alreadyachieved two of the Millennium DevelopmentGoals (MDGs): to provide universal primaryeducation and to provide equal access toeducation for boys and girls. Two other goals –halving the proportion of people (a) living belowthe subsistence minimum and (b) without accessto safe potable water – will probably be met by2015. Other MDGs remain major developmentchallenges for the nation including reducingmaternal mortality by three-quarters, reducingunder-five mortality by two-thirds, reversing thespread of HIV/AIDS, and ensuring environmentalsustainability.
Recognizing the poverty problem, theGovernment of Kazakhstan is formulating mid-term programmes in the field of health care,education and social security, which aim atimproving the funding schemes in these areas.
CHAPTER 1. POVERTYAND ITS MEASUREMENT
Poverty is a multidimensional phenomenonthat has deep socio-economic, cultural andpsychological roots. It is conditioned by time andlocation. Historical developments within individualcountries must be taken into account whenmeasuring poverty.
There are several ways to measure povertyincluding absolute, relative and subjectivemeasures. In its 1997 Human DevelopmentReport, the United Nations DevelopmentProgramme suggested considering poverty fromthe perspective of human development. In thisperspective, indicators reflecting humandevelopment (life expectancy, unemployment,infant mortality, maternal mortality and others)are used to measure human poverty along withtraditional measures of income poverty such asincome levels, subsistence levels, and purchasing
EXECUTIVE SUMMARY
power. In fact human development indicatorsinclude the whole range of MillenniumDevelopment Goals and targets. Accordingly, thereport suggests using a comprehensive set ofhuman poverty indicators for Kazakhstan.
The notion of a subsistence minimum is animportant instrument of state social policy in thefight against poverty. It is actually used worldwideas the criterion of absolute poverty and is thusreferred to as the “poverty line” because itcorresponds to the minimum level of income thatis required to satisfy the most basic human needs.In Kazakhstan the subsistence minimum is alsoused to measure the incidence of absolutepoverty. However, poverty is closely related toeconomic inequality and should be addressed inconjunction with welfare levels in all segments ofsociety. The report therefore suggests thatKazakhstan not only has to focus its anti-povertymeasures on those in absolute poverty, but mustalso take action to prevent people at poverty riskfrom falling into absolute poverty. A level of twicethe subsistence minimum is thus recommendedfor defining those at poverty risk. Although thislevel of income is higher than the survival level, itstill does not suffice for sustaining people’sphysical and intellectual capacities needed for adecent standard of living.
CHAPTER 2. POVERTY IN KAZAKHSTAN
Recent years have seen significant economicgrowth in Kazakhstan, which has been conduciveto overall poverty reduction. Nevertheless, 24%of the Kazakhstani population in 2002 lived inabsolute poverty with incomes below thesubsistence minimum of 4,761 tenge, or 31 USdollars per month. In addition, more than half ofthe population was at poverty risk as they hadlow incomes (higher than the survival level butlower than twice the subsistence minimum), whichwere not sufficient for the decent standard ofliving. The percentage of the population withincomes below the food basket level was decliningslowly, signaling the continuing threat ofmalnutrition. There were significant variations ofpoverty incidence from region to region. Ruralpoverty was twice as high as in the urban areas.Women tend to be poorer than men.
The main causes of poverty are unemployment
EXECUTIVE SUMMARY

4
POVERTY IN KAZAKHSTAN: CAUSES AND CURES
and low incomes. Despite increasing employmentand average incomes, the situation in the labormarket is not conducive to poverty reduction. Thereport shows that in 2002 over 44% of employeesreceived low wages, which did not provide for anadequate standard of living, neither for theemployees nor for their families. Furthermore,despite positive macroeconomic changes, theproportion of low-paid employees has remainedmore or less constant. The purchasing power ofsalaries in many sectors of the economy rangesfrom low to medium. Only in the finance sectorand mining industries is the purchasing power ofsalaries high. The proportion of employed personswho are self-employed has now increased to40%. This significant increase in the number ofself-employed people brings additionaldevelopment challenges such as the low wagesthey typically earn and insufficient coverage bysocial security schemes.
Unemployment remains a serious socio-economic problem. Despite falling unemploymentrates, the problems of unemployment amongyouth and women, unemployment in rural areas,and chronic long-term unemployment for manypeople persist.
Furthermore, the report indicatesdisproportionately high growth in gross capitalformation, exceeding the growth in expenditureson household consumption both in absolute termsand as a growth rate. This discrepancy needs tobe further investigated to ensure a good balancebetween investments in physical infrastructureand already low individual incomes, primarilysalaries and wages.
In the field of education there are two majorchallenges for the poor: low quality and accessto education, particularly in remote rural areas.This is relevant for all levels of education.Kazakhstan has achieved the MillenniumDevelopment Goals of providing universal primaryeducation and eliminating gender disparities inprimary and secondary education. However,enrolment rates are slipping, and the lack ofschools and teachers has become a problem,particularly in remote rural areas. Furthermore,the education system still fails to provide for thedevelopment of a wide range of life skills, focusinginstead on providing children with theoreticalknowledge rather than preparing them for livingin the real world, interacting freely with otherpeople and being good citizens.
In recent years, the profiles of graduates fromhigher and vocational education institutions haveprogressively failed to meet the demands of thelabour market. Large discrepancies persistbetween the graduates’ qualifications and thedemands of a developing economy. Basicvocational training fails to supply the economywith qualified workers. In most sectors earnings
of employees do not reflect their qualifications andprofessionalism, thus undermining incentives forbetter performance. The majority of qualifiedgraduates do not enjoy adequate pay-offs incomparison with personal and governmentinvestment in their education. In many cases,financial responsibilities for extended familiesfurther aggravate the situation.
Currently, state social benefits and targetedsocial assistance have failed to provide for decentliving standards for their beneficiaries. In order toreduce the poverty risk faced by people the socialsecurity system, including the pension system,needs to be improved in terms of targeting andefficiency.
The poor also face serious challenges relatedto health. The recent deterioration of many healthindicators in Kazakhstan was caused by thefollowing factors: reduced public spending onhealth care, decreasing numbers of qualifiedphysicians, deteriorating health care facilities,insufficient preventive measures, low quality ofmedical services, environmental degradation, andlow cultural commitment to healthy lifestyles. Therange of free health care services guaranteed bythe state tend to be low quality. Hence the poorwho cannot afford to pay for medical services donot receive adequate treatment/prophylactics.Most medical insurance schemes are notaffordable for the majority of population.
Poverty is also related to migration anddemographic factors. High emigration can leadto a so-called “brain drain.” Immigration coupledwith internal migration affects the living conditionsof migrants, in particular oralmans (repatriates) andrefugees. Migration from rural to urban areas (highurbanization rates) aggravates urban poverty.Large families with many children further increasethe risk of poverty, especially in rural areas. Othervulnerable groups are single-parent families, theelderly and the disabled.
Both women and men were affected by theeconomic transition. However, women make upa larger proportion of the poor because, first, theyconstitute a larger proportion of the overallpopulation and, second, they are subject topersistent social and economic inequalities.Gender inequality is reinforced by traditionalstereotypes restricting women’s roles toreproductive functions coupled with hiddendiscrimination in employment. Therefore,addressing female poverty should be a top prioritywhen developing any state programme for povertyreduction.
Environmental quality has plummeted inKazakhstan, affecting people’s health and well-being as well as increasing poverty. During the1990s, two interconnected environmentalproblems became apparent: environmentaldegradation undermined people’s health and well-
5
being and, in turn, poverty aggravatedenvironmental problems. High morbidity rates arecaused in part by the lack of potable water as wellas poor conditions in many water supply systems.Potable water supply is high on the nationaldevelopment agenda.
Finally, there are significant differences inpoverty between regions. Gross regional product(GRP) per capita varies from region to region.However, a high level of economic developmentin a region does not necessarily result in improvedliving conditions for its residents. In Kazakhstan,both advanced regions (Mangistau and Atyrau) andless developed ones (Almaty, South Kazakhstan,Zhambyl and Kyzylorda oblasts) have among thehighest levels of poverty in the country. In the former,the redistribution of revenues from oil and gasextraction to benefit the entire local population,including the poor, should become a key strategyfor poverty reduction. In less developed regions withhigh poverty levels, state interventions should aimat accelerating economic growth. In both cases,productive employment opportunities, enhancedsocial security systems, improved socialinfrastructure and solutions to environmentalproblems are key elements in reducing poverty.
In summary, the impact of the recent economicgrowth, largely driven by the oil and gas sector,on the living standards of Kazakhstani populationcould have been stronger. To ensure sustainableimpact of economic growth on people’s well-being, national revenues should be used moreprudently. Given the favourable macroeconomicsituation in Kazakhstan, increased publicspending on education, health care and socialsecurity should become another importantcomponent of national social policy.
CHAPTER 3. CHALLENGES OF RURALAND URBAN POVERTY
As mentioned earlier, there are significantdifferences in poverty incidence in rural and urbanareas in Kazakhstan. In 2002 the rural povertylevel was twice as high as urban poverty.However, the profile of urban and rural poverty issimilar. Regardless of the place of residence, thepoor are children, unemployed and employedpeople with low salaries and wages as well as theelderly.
Income poverty in urban areas is lower than inrural areas because of the relatively high incomesand educational levels of urban residents.However, income disparities among urbanhouseholds are more evident than in rural areas.Urban poverty is most deep and persistent in so-called company towns, where it causes destitutionand personal degradation.
The transition caused major changes in the lifeof rural residents and brought about a range of new
socio-economic problems. Rural poverty, as is thecase generally in the country, is caused primarily byunemployment and low incomes. The number ofextended families with many dependents is anotherfactor of rural poverty. The remoteness of most ruralsettlements from oblast and rayon centers and thepoor integration of local economies into nationaleconomic and social processes have furtheraggravated the challenges of rural development.
Employment opportunities are scant in ruralareas, in particular for young people. The statestill provides most rural jobs, which are in thesocial sector. Given the scarcity of jobs availablefor rural residents, job-hunting fails in most cases.In this context, household land plots have becomean important means of survival for rural families.In most cases the rural household itself consumesmost of the produce from the household land plotand only a small portion is sold. However, self-produced food is still not sufficient for adequatenutrition.
Other factors negatively affecting the livingstandards of rural residents are degraded physicaland social infrastructure, the lack of safe drinkingand irrigation water, and environmentaldeterioration. The dilapidated state of rural roadsinhibits the economic development of many ruralsettlements. Shrinking social infrastructure(schools, hospitals, cultural and sports facilities)imposes restraints on the access of rural poor tothose services, particularly in remote areas. Ruralpeople perceive higher education as an importantsocial goal; still, most of them cannot affordadequate schooling for their children.
The rural population is largely unaware ofmajor national policies, laws and regulatoryinstruments affecting their lives. Local authoritiesappear unable to represent their constituenciesin addressing rural development issues.Moreover, rural residents do not take activepolitical or social stands and opt instead for a“wait-and-see” position.
CONCLUSION AND RECOMMENDATIONS
The report draws the conclusion that povertyremains a serious problem for Kazakhstan, andpoverty reduction should be a priority on the nationalagenda. The recent economic growth so far hasfailed to change the lives of the majority of theKazakhstani people for the better. However, it hascreated the necessary macroeconomic conditionsfor further resolution of social problems inKazakhstan. Indeed, a number of national and sub-national programmes aimed at poverty reductionare being implemented. The 2002 MillenniumDevelopment Goals Report concludes thatKazakhstan is well positioned to address its socio-economic problems, though much has to be doneto arrive at a sustainable solution.
EXECUTIVE SUMMARY
6
POVERTY IN KAZAKHSTAN: CAUSES AND CURES
To ensure sustainable poverty reduction in future,Kazakhstan has to continue its impressivemacroeconomic management and focus onbroad-based economic growth. The majorchallenge for the future is to achieve economicgrowth not only in extractive industries such asoil, gas and minerals, but also in processingindustries and other economic sectors producinggoods and services for the population. This in turnwould lead to expanding productive employmentopportunities and higher incomes for the majorityof the population.
State policies should focus on the problem ofemployment with special attention onunemployment among women and youth as wellas long-term unemployment. Another issue toaddress is to increase real wages and salaries ofat least half of all employees, particularly in thesocial sector, civil service and agriculture.Measures aimed at small and medium enterprisedevelopment are also crucial within theemployment policy.
State social policy is another important elementin fighting poverty. The social security systemshould protect people in case of social risks. Thecurrent social security system in Kazakhstan needsto be looked into to make it more effective andtargeted. Special attention should be paid to themost vulnerable social groups such as large andsingle-parent families, especially in rural areas,lonely older people, people with disabilities andimmigrants, especially oralmans. The means-testedsocial assistance from the state should be increasedto cover at least basic nutrition requirements of thepoor. The report suggests, first, to further refine themethodology for calculating the subsistenceminimum to reflect the actual ratio betweenhousehold expenditures for food and non-food goodsand services. The recommended ratio is 60:40.Secondly, it suggests that targeted social assistanceshould be provided by the state to people withincomes less than the food basket level.
Compulsory social insurance should become themajor form of social protection of the population.Social policy should target gender equality vis-a-vissocio-labour relations. The system of socialinstitutions and social workers applied in manycountries can be introduced in Kazakhstan. Toensure a more effective social security system infuture, there is a need for diversification of sourcesof funding.
The educational system in Kazakhstan shouldmatch the country’s changing needs and beintegrated into a global educational framework.Access to quality education at all levels is bothintrinsic and instrumental for improving thepopulation’s well-being and ultimately humandevelopment. The quality of education requiresurgent attention focusing on curricula, textbooks,
teacher qualifications and learning achievements.Linked to the quality of education, there is a need toimprove the system that monitors schoolperformance. Problems in education sector willnot be overcome unless public spending oneducation, including teachers’ salaries, isincreased significantly. One of the keys to achievesustained employment is to provide a developingeconomy with suitably qualified labour. This couldbe done through analysis of the labour market tobalance demand with supply as well as fosteringcloser links between educational establishmentsand the private sector. Educational standards,choice of specializations and the curricula ofhigher and vocational education have to be revisedto overcome the current lag behind the needs ofthe economy. At present a significant proportionof higher education graduates do not gainadequate economic returns for their own and thestate’s investments in education.
Improved public health, longer lifeexpectancies, and decreased mortality ratesshould become priorities in state policy. The stateshould ensure good quality health care services forthe entire population, including the poor, especiallyin remote rural areas. More attention should bepaid to preventive measures and the promotion ofa healthy lifestyle culture. It is critical thatawareness of the general populations of goodreproductive health practices is increased. Theabove issues cannot be solved without substantialrevision of the funding system in the health sector.Increased public spending on healthcare from 2%to 5-6% of GDP would match the spending indeveloped countries. Private medical insurancescan provide an additional source of funding for thehealth sector.
A concerted effort by the government and aclear-cut distribution of roles are prerequisites foreffective poverty reduction. The Government hasto formulate pro-poor policies addressing povertyfrom the human development standpoint. Statetaxation policy has to become an effectiveinstrument for national wealth redistribution. Civilsociety organizations should take an active stancealong with the Government in addressing povertyreduction issues. These include researchinstitutes and non-governmental organizations aswell as religious organizations. An important roleshould be given to developing civil dialogue andpromoting trade unions. Donor assistance interms of loans and technical assistance willenlarge the funding base and build on civil societycapacities by referring to international experiencein poverty reduction. People’s social involvement,local community mobilization and the promotionof initiative and self-help groups are prerequisitesfor inclusive decision-making, which wouldultimately enhance people’s living standards.

7
FOREWORD BY GULZHANA KARAGUSSOVAMINISTER OF LABOUR AND SOCIAL PROTECTION OF KAZAKHSTAN
Poverty reduction stands high on the development agenda of Kazakhstan. Despite economicrecession, severe budget deficit and hyperinflation at the initial period of transition, the Governmenthas been making every effort to improve population’s living standards, increase effectiveness of thesocial security system and help people of Kazakhstan adapt to emerging realities of life.
Impressive economic growth since late 1990s has created favourable conditions for reducing povertyand for the Government action towards that end. The long-term development strategy “Kazakhstan-2030” adopted in 1997 highlighted poverty reduction as one of the main priorities for the Government workin the social development field. Important social legislation and social programmes in the areas of education,health care, social security and environment protection were formulated and approved. The Programmeon Combating Poverty and Unemployment for 2000-2002 has made poverty reduction initiatives of theGovernment more systemic and targeted. Implementation of this Programme allowed to unite povertyreduction efforts of the state institutions and civil society organizations and helped substantially reduce thelevel of poverty.
The second Programme on Poverty Reduction for 2003-2005, which was formulated with supportfrom UNDP and ADB, considers poverty as a complex issue and deals with this problem through creatingconditions for sustainable economic growth, productive employment and higher incomes, increased accessto healthcare and educational services, improved social security system and enhancing effectiveness ofpublic administration. The Programme also envisages active participation of non-state institutions in povertyreduction, including the private sector, non-governmental organizations, international agencies and themass media.
Independent assessments of the status of national poverty reduction initiatives and internationalcommitments of Kazakhstan play an important role. Particularly important are studies, which analysepoverty causes and consequences as well as cures to localize and reduce poverty in Kazakhstan.
This Report, which was prepared under the auspices and with support from UNDP considers preciselythese issues, and hence is a timely and valuable reading. Some issues raised in the Report could beargued, however this stimulates further discussions and facilitates development of new solutions topoverty reduction. Simple and reader-friendly style of the Report makes it useful and interesting notonly for experts and professionals, but also for wider audience involved in eradication of poverty inKazakhstan.
Gulzhana Karagussova
8
POVERTY IN KAZAKHSTAN: CAUSES AND CURES
FOREWORD BY FIKRET AKCURAUN RESIDENT COORDINATOR/UNDP RESIDENT REPRESENTATIVE IN KAZAKHSTAN
After decades of neglect characterized by growing public disaffection and disinterest in the plight ofthe world’s poor and a widespread sense of disillusionment in many quarters with the whole idea ofdevelopment, the issue of how to help poor countries become richer, more stable and more democraticis firmly back on the global agenda.
In this light, the Millennium Development Goals, built around time-bound targets that have universalpolitical support, can serve as both a mobilizing tool and an accountability tool for both developingand donor countries. They are a set of goals that the world has committed to, and we must now use ournational political processes to agitate and lobby for the momentum we hope to give them.
Here in Kazakhstan, that commitment has already found tangible form in the national vision embodiedin Kazakhstan 2030 and President Nazarbayev’s speeches emphasizing poverty reduction, ruraldevelopment, and elimination of disparities among oblasts. Moreover, the Parliament and theGovernment have been trying to channel the national agenda and resources towards the improvementof the country’s socio-economic situation.
This report has been prepared in support of the first Kazakhstan MDG Report 2002 with a particularfocus on Goal 1, eradicating poverty. The report shows that about one citizen in four is poor. Also, thedistribution of national wealth is quite distorted: in 2001, the wealthiest 10 percent of the populationreceived 26 percent of the national income, while the poorest 10 percent of population only 2.3 percent.Unemployment stood at 10.4%. There are great variations among the oblasts in poverty, unemployment,heath care, access to education, availability of good quality water and in pollution levels. Particularlyproblematic is the fact that the poorest oblasts are the ones around the Caspian where most of thenational wealth originates.
Another point worth noting is the growing disparity between the urban and rural communities. Thiscreates high urbanization rates as people flock to cities, trying to escape the poverty of the ruralareas. A likely outcome is pockets of poverty and crime surrounding urban centres.
These differences between oblasts, rural-urban communities, and between rich-poor citizenssomewhat undermine ‘consolidation of society’, the second priority of Kazakhstan 2030. It is mostencouraging that Rural Development Programme and Strategy for Poverty Reduction were launchedto handle these issues.
This report has been prepared by a group of national and international experts, researchers andrepresentatives of government agencies. I would like to take this opportunity to thank the authors’group who made this report possible. Special thanks go to the Russian Living Standards Centre,Kazakhstan Institute of Strategic Research, Kazakhstan Statistics Agency and all the consultants fortheir assistance in preparing this report.
It is our hope that this report will promote a better understanding of the poverty situation and itscauses in Kazakhstan. Given its impressive oil, gas, mineral resources and the highly literate citizens,Kazakhstan has every chance to assume its rightful place among the community of developed nations.With the right policies and judicious use of resources, I am confident that much of the achievementswill emerge by 2015, the target date for the Millennium Development Goals.
Fikret Akcura
9
ACKNOWLEDGEMENTS
The preparation of the Report would not have been possible without the support and valuablecontributions of a large number of organizations and individuals. The authors and UNDP CoordinationGroup thank for their inputs the following organizations: Ministry of economy and budget planning,Ministry of labour and social protection, Statistics agency of Kazakhstan, Centre for system researchunder the Presidential administration, Information and analysis center of the Ministry of labour andsocial protection, Ministry of education and science, Ministry of health, National center for preventionand control of AIDS, Economic research institute under the Ministry of economy and budget planning.Also, the authors appreciate support from the regional offices of UNICEF and UNAIDS in Central Asia,ILO Regional Bureau in Moscow, IOM Office in Kazakhstan, public foundation “Amanat”, CASDIN(Central Asian sustainable development information network), association “Baspana”.
The constructive suggestions and comments of the following group of people help to advance thequality of the report: Mr. Yury Shokamanov, First Deputy Head, Statistics agency of Kazakhstan; Ms.Zhanna Bakauova, UN Coordination Officer/Analyst; Ms. Zhanara Sagimbaeva, Economic TransitionAdvisor, UNDP; Ms. Aliya Ilyassova, Poverty Expert, UNDP Poverty Project; Ms. Lurdes Adriano,Poverty Reduction Coordinator, Asian Development Bank; Ms. Dorothy Rosenberg, Poverty ReductionAdvisor, Bureau for Development Policy, UNDP; Ms. Svetlana Misikhina, Poverty Expert, Russia; Ms.Anastasia Kurassova, Director of Employment Promotion Foundation under Almaty city Akimat.
Special thanks go to the Kazakhstan Institute for Strategic Research under the President ofKazakhstan and personally to Mr. Maulen Ashimbaev, Director, Ms. Leyla Muzaparova, SeniorResearch Specialist, and Ms. Aigerim Kazhmuratova, Leading Research Specialist, as well as to Ms.Bakhyt Abdildina, Poverty Expert, AsDB project on “Institutional Building for National and LocalGovernments for Implementation of Poverty Reduction Programme” for their initial research on povertyin Kazakhstan.
Mr. Baurzhan Amirov, Mr. Julian Hansen and Mr. Seamus Bennet were part of the translation (intoEnglish) and proofreading team.
Finally, the authors would like to express their sincere gratitude to all members of the UNDPKazakhstan Consultative Board and personally to Mr. Fikret Akcura, UN Resident Coordinator/UNDPResident Representative in Kazakhstan and Mr. Gordon Johnson, UNDP Deputy ResidentRepresentative in Kazakhstan for providing invaluable advice, support and contributions in finalizingthis Report. Special thanks go to Ms. Svetlana Islamova, Development Coordinator/Poverty Unit Chief,UNDP Kazakhstan; Ms. Selima Salamova, Poverty Programme Associate, UNDP Kazakhstan; Ms.Malin Berggren, Junior Professional Officer, UNDP Kazakhstan; and Ms. Alma Buirakulova, PovertyResearch Assistant, UNDP Kazakhstan for their continuous substantive and operational support topreparation of the Report.
ACKNOWLEDGEMENTS
10
POVERTY IN KAZAKHSTAN: CAUSES AND CURES
ACRONYMS
ADB – Asian Development Bank
CIS – Commonwealth of Independent States
GDP – Gross Domestic Product
GRP – Gross Regional Product
GPW – Great Patriotic War
HIV/AIDS – Human Immunodeficiency Virus/Acquired Immunodeficiency Syndrome
HDI – Human Development Index
HIB – High Income Budget
HPI – Human Poverty Index
ILO – International Labour Organization
IOM – International Organization for Migration
MDG – Millennium Development Goals
MCB – Minimum Consumer Budget
MUR – Monthly Unit Rate
NGO – Non-governmental Organization
PPP – Purchasing Power Parities
SM – Subsistence Minimum
SME – Small and Medium Enterprises
TSA – Targeted Social Assistance
UN – United Nations
UNDP – United Nations Development Programme
UNAIDS – United Nations Joint Programme on AIDS
UNICEF – United Nations Children Fund
USD – United States dollar
USSR – Union of Soviet Socialist Republics
WB – World Bank
WHO – World Health Organization
11
TABLE OF CONTENTS
Executive summary ......................................................................................................... 3
Foreword by Gulzhana Karagussova, Minister of Labour and Social Protection of Kazakhstan ....... 7
Foreword by Fikret Akcura, UN Resident Coordinator/UNDP Resident Representativein Kazakhstan ............................................................................................................... 8
Acknowledgments ........................................................................................................... 9
Acronyms...................................................................................................................... 10
CHAPTER 1. POVERTY AND ITS MEASUREMENT ................................................................. 14
1.1. Defining poverty .................................................................................................. 14
1.2. Measuring income poverty and inequality .................................................................. 15
1.3. Measuring human poverty ..................................................................................... 16
1.4. Poverty in transition: the case of Commonwealth of Independent States (CIS) ................. 17
1.5. Status of the Millennium Development Goals in Kazakhstan ......................................... 19
CHAPTER 2. POVERTY IN KAZAKHSTAN ........................................................................... 22
2.1. Poverty and inequality ......................................................................................... 27
2.1.1. Income poverty ........................................................................................... 22
2.1.2. Economic inequality ..................................................................................... 25
2.1.3. Causes of poverty as perceived by people ......................................................... 26
2.2. Influence of economic growth on poverty reduction.................................................... 27
2.3. Labour market trends and the impact on poverty ..................................................... 29
2.4. Education as a factor of poverty reduction ............................................................... 33
2.5. Social security system ......................................................................................... 38
2.6. Demographic factors, migration and poverty ............................................................ 41
2.7. Health status and its relation to poverty .................................................................. 47
2.8. Gender dimensions of poverty ............................................................................... 50
2.9. Environmental aspects of poverty ......................................................................... 55
2.10. Regional poverty ............................................................................................... 56
CHAPTER 3. SPECIFICS OF URBAN AND RURAL POVERTY IN KAZAKHSTAN........................... 62
3.1. Comparing urban and rural poverty ........................................................................ 62
3.2. Crisis of company towns ...................................................................................... 66
3.3. Portrait of rural poor ........................................................................................... 68
CONCLUSION AND RECOMMENDATIONS ......................................................................... 76
Bibliography ................................................................................................................. 82
Annexes
Annex 1. Glossary on poverty ...................................................................................... 86Annex 2. Millennium Development Goals and Targets ...................................................... 97Annex 3. Poverty Monitoring Indicators in Kazakhstan .................................................... 98Annex 4. List of UNDP Kazakhstan Theme Reports for 2002-2004 ..................................... 111
TABLE OF CONTENTS

12
POVERTY IN KAZAKHSTAN: CAUSES AND CURES
Boxes1.1.1. Poverty: the global picture .............................................................................. 141.3.1. Human poverty index in Kazakhstan ................................................................ 171.4.1. Poverty and inequality indicators by CIS Statistics Committee ............................... 192.1.1. ‘Poverty Line’ as a criterion for state targeted social assistance ........................... 252.3.1. Extract from the Law on ‘Labour in Kazakhstan’ ............................................... 312.4.1. Extract from the Law on ‘Education in Kazakhstan’ .......................................... 342.5.1. The Concept of social protection of the population of Kazakhstan ........................ 382.5.2. Social transfers in Kazakhstan ...................................................................... 402.6.1. Extract from the Concept of state demographic policy of Kazakhstan ................... 422.6.2. Orphaned children are at poverty risk ............................................................. 452.6.3. Extract from the Law on ‘Population Migration in Kazakhstan’............................ 463.3.1. Rural people about causes of poverty............................................................... 69
Figures2.1.1. Composition of the subsistence minimum, December 2002 .................................. 232.2.1. Real GDP growth and poverty, 1996–2002 ....................................................... 272.3.1. Unemployment, 1997–2002 .......................................................................... 322.3.2. Unemployment by gender, 1997–2002 ............................................................ 332.3.3. Unemployment by regions, 2002.................................................................... 332.5.1. Recipients of state targeted social assistance, 2002 ........................................... 412.7.1. Causes of maternal mortality, 2002 ................................................................ 472.7.2. Causes of infant mortality, 2002 .................................................................... 482.7.3. Under-five mortality rate, 1991–2001............................................................... 482.8.1. Households by educational level of their heads, 2002 ........................................... 512.8.2. Employed population, 1998–2002 ................................................................... 512.8.3. Unemployment rate by age, 2002 .................................................................. 532.8.4. Unemployment rate and education, 2002 ........................................................ 532.8.5. The poor by gender and age, 2002 ................................................................. 553.1.1. Urban and rural poverty by regions, 2002 ......................................................... 623.1.2. Urban household consumption expenditure pattern, 2002 ................................... 643.1.3. Rural household consumption expenditure pattern, 2002 .................................... 643.1.4. Urban and rural unemployment ...................................................................... 653.3.1. Main social and economic problems in rural areas as identified by people................ 693.3.2. Main sources of income of a typical rural household ........................................... 703.3.3. Importance of household land plots for rural people ........................................... 703.3.4. Nutrition deficiencies of rural people ................................................................. 713.3.5. Education in rural areas ............................................................................... 723.3.6. Challenges of rural healthcare ....................................................................... 73
Tables1.1.1. Absolute poverty in some countries, 2001........................................................... 141.2.1. Defining social strata ..................................................................................... 161.2.2. Assets coefficient in some countries, 2001 ......................................................... 161.2.3. Gini coefficient in some countries, 2001 ............................................................. 161.4.1. Unemployment rate in some countries, 2002 ...................................................... 181.4.2. Public expenditures on health and education in some countries, 2000 ..................... 181.5.1. Infant mortality rate and under-five mortality rates in some countries, 2001 ............. 201.5.2. Maternal mortality rate in some countries, 2001 ................................................ 201.5.3. Progress towards the Millennium Development Goals in Kazakhstan...................... 212.1.1. Income poverty, 1998-2002 ........................................................................... 222.1.2. Who are the poor in Kazakhstan, 2002 .......................................................... 232.1.3. Dietary intake of the poor and general population, 2002 .................................... 242.1.4. Income and its purchasing power, 2000–2002 ................................................. 252.1.5. Social strata in Kazakhstan, 2002 ................................................................ 262.1.6. Economic inequality in Kazakhstan ............................................................... 262.1.7. Causes of poverty: people’s perception .......................................................... 26
13
2.1.8. Ways to improve living standard as perceived by people..................................... 272.2.1. Main economic indicators, 1998–2002 ........................................................... 282.2.2. Expenditure on GDP and household expenditure on consumption ........................ 282.2.3. State budget: revenue and expenditure .......................................................... 282.2.4. Public expenditure on the social sector, 1998–2002 .......................................... 282.3.1. Labour force in Kazakhstan, 1998–2002 ........................................................ 292.3.2. Distribution of employees by wage level, 1999–2002 ......................................... 302.3.3. Purchasing power of wages by sectors, 1999–2002 .......................................... 302.3.4. Unemployment by age groups, 2002.............................................................. 322.4.1. Graduates and employed population by qualification level, 2001 .......................... 352.4.2. Assessment of living standards by level of qualification and sectors, 2001–2002 .... 372.5.1. Social transfers, 2000–2002 ........................................................................ 392.5.2. Why the poor do not apply for state targeted social assistance ............................ 412.5.3. Changes in well-being during the last three years (as perceived by poor households),
2002 ........................................................................................................ 412.6.1. Age composition of Kazakhstan’s population, 1990 and 2002 ............................ 422.6.2. Age composition of Kazakhstan’s urban and rural population, 2002.................... 422.6.3. Types and sizes of households, 1989 and 1999 ................................................ 432.6.4. Poor families with children, 2002................................................................... 432.6.5. Marriages and divorces in Kazakhstan, 1991 and 2002 ..................................... 442.6.6. Inter-oblast and intra-oblast migration, 1991–2001 .......................................... 462.7.1. Life expectancy at birth in Kazakhstan, 1997–2002 .......................................... 472.7.2. Maternal mortality rate, 1991–2001 ............................................................... 472.7.3. Comparing official statistics with findings of demographic and health survey ......... 482.7.4. Cardio-vascular diseases and tuberculosis in Kazakhstan, 1991–2002 ................. 482.7.5. HIV incidence in Kazakhstan, 1996–2002 ....................................................... 492.7.6. Indicators of access to healthcare, 1998–2002 ................................................ 492.8.1. Human poverty index by gender, 1998–1999 .................................................... 502.8.2. Anaemia in women by regions, 1995/1999 ...................................................... 502.8.3. Causes of unemployment, 2002 .................................................................... 522.8.4. Men and women by education and employment, 2002 ...................................... 522.8.5. Unemployment by duration and gender, 2001–2002 ......................................... 532.8.6. Men’s and women’s wages, 1999–2002 ......................................................... 532.8.7. Ratio of wages of men and women by sectors, 1999–2002 ................................. 542.10.1. Poverty indicators by regions, 2002.............................................................. 572.10.2. Regional indicators, 2002 .......................................................................... 582.10.3. Recipients of state targeted social assistance by regions, 2002 ......................... 593.1.1. Who are the urban and rural poor, 2002 .......................................................... 633.1.2. Income sources of urban and rural poor, 2002 .................................................. 633.1.3. Comparing incomes of urban and rural poor, 2002 ........................................... 633.1.4. Level of well-being of the poor, 2002 .............................................................. 643.1.5. Rural demographics by regions, 2001 ............................................................. 653.1.6. Access to free-of-charge medical treatment in 2001 .......................................... 663.1.7. Access to healthcare services, 2001 ............................................................... 663.1.8. Housing conditions of the poor households, 2002 ............................................. 663.1.9. Factors to improve people’s well-being (as perceived by the poor), 2002 ............... 663.3.1. Rural incomes as identified by people, 2002 ..................................................... 703.3.2. Importance of household land plots for rural residents by oblasts ......................... 713.3.3. Usage of the agricultural produce from household land plots ................................ 713.3.4. Why unemployed people do not seek a job ...................................................... 723.3.5. Main employers in rural areas ....................................................................... 723.3.6. School–based boarding facilities in 2002/2003 academic year ........................... 733.3.7. Specialized schools and out-of-school establishments ...................................... 74
TABLE OF CONTENTS

14
POVERTY IN KAZAKHSTAN: CAUSES AND CURES
1.1 DEFINING POVERTY
The social progress of any nation, irrespectiveof the pursued model of economic development,is measured by the standard of living enjoyed byits citizens. In any society though there are alwayspeople, which due to certain economic,demographic, physical, psychological factorshave found themselves on the ‘fringe’ of society.They cannot satisfy even their basic needs innutrition, clothing, housing and education, and areregarded as ‘poor’.
There are traditional approaches to povertyand its measurement, absolute and relative, whichare associated exclusively with income orconsumption. Absolute poverty refers to someabsolute standard of minimum requirement, whilerelative poverty refers to falling behind mostothers in the society (table 1.1.1). Also, povertycan be determined based on people’s opinion onthe required level of income/consumption thatgives them a sense of not being the poor. It iscalled subjective poverty.
The UNDP Human Development Report of 1997suggested considering poverty in the humandevelopment perspective. It means that a poor
CHAPTER 1. POVERTY AND ITS MEASUREMENT
Box 1.1.1. Poverty: the global picture1
�������������� ����������������������������������������������������������� �����������������������������
������
��������� ������ !"� ������������������������ � ������������
����"� ���������������������������##�������������#���$��������#�����������������������%� �������������� ���
���������������������##����������#������������������������������������&�����'��#� �������������(!""
�������������)����������������##����������*��������������������"+�
��,%� �������#�����������-�����������������������##��������#���������������� ������+"� �������#�������
�#����������������������#���������.��������/,"� ��������� ���������������#����������#�������������,"�
0��������������������������������������������������'��������������� ���
��1��!!�������, � �������������� ���������� ���������������������213�����#�����1��#��������� ���
����#�������2134�15-� ������� ��������� ������ ��� �������� +����#��������""����� ���������'����
�����������������""����#����
��6����� �����������������#���������������������15-�������������� ����� ����������!!�����,"� ���������
�""��6��������#��������� ��������#�������2134�15-� �����������#�������������������������#���#����
%�����������""'�"+�
1 Halving Extreme Poverty. An Action Strategy for the United Nations, 2000 (www.undg.org).
Country Proportionof population living
in absolute poverty, %
Germany 11.5
France 12.0
United Kingdom 13.1
USA 14.1
Russia 27.3*
Kazakhstan 28.4**
Kyrgyzstan 84.0
Source: Human Development Report 2003 MillenniumDevelopment Goals: A Compact Among Nations to End HumanPoverty. UNDP, 2003.* Socio-economic situation in Russia. State StatisticsCommittee of Russian Federation, 2002.** Poverty Monitoring Indicators in Kazakhstan. January 2002.Statistics Agency of Kazakhstan, 2003.
Table 1.1.1.Absolute poverty in some countries, 2001
person lacks opportunities and choices mostbasic to human development: to lead a long,healthy, creative life and to enjoy a decentstandard of living, freedom, dignity, self-respect
15
and respect of others. Thus, human poverty is amulti-faceted phenomenon beyond income.
1.2 MEASURING INCOME POVERTYAND INEQUALITY
Measuring poverty and inequality has majorimplications for the development of a country’seconomic and social policies.
Most commonly used income povertyindicators are poverty headcount ratio andpoverty depth and severity indices. Theincidence of poverty, expressed as a headcountratio, is simply an estimate of the percentage ofpeople with income below a certain threshold(poverty line), which is normally equal tosubsistence minimum (see below). Usingsubsistence minimum to measure poverty has twoadvantages. Firstly, it is based on consumptionof goods and services, which reflect national foodand cloth habits appropriate for traditions andclimatic conditions of a country. Secondly, thesubsistence minimum allows comparing thenumber of people living below this absolute levelby time and geographic regions.2 In Kazakhstanthe poverty headcount ratio corresponds to ‘thepercentage of people with incomes below thesubsistence minimum’. In addition, the incidenceof ‘food poverty’ can be measured, which inKazakhstan refers to the proportion of populationwith incomes below the food basket cost (seeSection 2.1.1). The incidence of poverty thoughdoes not capture any worsening of the conditionsof those already in poverty. For in-depth analysispoverty depth and severity indices are used.
Poverty depth shows how ‘poor’ the poor are.It measures average consumption/income shortfallof the poor expressed as a proportion of povertyline (subsistence minimum in Kazakhstan). Theratio of income shortfall of the poor to the povertyline is called the poverty depth index. Povertyseverity shows ‘how poor are the poorest of thepoor’, i.e. describes income inequality among thepoor. The poverty severity index is calculated onthe basis of the poverty depth index. An increasein the values of the poverty depth and severityindices points to a worsening of the povertysituation. The indicators help determine the amountof funds required to overcome the income shortfallof the poor and can be used to estimate financialresources needed for state’s means-testedassistance to the needy.
Poverty has to be considered in relation to thewell-being of a country’s population, or to incomeinequality. In an unequal society relative povertyexists, however there may be no people inabsolute poverty. Income inequality is conditionedby the following:
• income disparities, including property
ownership and uneven accumulation ofwealth;
• education levels, including quality of educationand differences in personal achievements;
• age and physiological differences, as well asaccess to resources.
The above factors determine the formation ofsocial strata that differ by the levels of well-beingand consumer behaviors. A system ofpopulation’s consumer budgets was developedto assess the well-being of the population basedon their income/consumption level.3 The purposeof the system is to support formulation of nationalsocial and economic policies as well as theirmonitoring and evaluation. It introduces threecriteria to define the standard of living: subsistenceminimum (SM), minimum consumer budget (MCB),and high-income budget (HIB).
The subsistence minimum (SM) determinesa certain level of income needed to maintain aperson’s health and vital activity. In Kazakhstanthe subsistence minimum, as defined in the Lawon “Subsistence Minimum”4, translates into thecost of a minimum consumer basket. The latterconsists of the food basket (70 percent) and non-food items and services (30 percent). The foodbasket is a selection of food items calculated ona monthly basis by multiplying the dietary intakenorms by the average mid-month prices. Thedietary intake norms5 are based on the basicphysical needs of an individual in terms of energyvalues and essential nutrients (equal to 2172 kcalas recommended by World Health Organization).Thus, the value of subsistence minimum dependsmainly on the prices as the food intake norms andthe ratio of food and non-food costs are fixed fora relatively long period of time.
The minimum consumer budget (MCB)refers to a higher level of income compared to thesubsistence minimum and provides for betterliving conditions. Estimated as twice thesubsistence minimum (2SM), it allows people tosustain their physical and intellectual capacities,social and physical development of children aswell as adequate living standards of the elderly.In other words, the minimum consumer budgetprovides for a comfortable level of consumption.
The high-income budget (HIB) defines thecost of a rational set of goods and services fully
2 Final Report of Joint UNDP/ILO project on Decent Work:Integrated Approach to Social Sphere in Kazakhstan.Astana, 2003.
3 Bobkov V.N. The system of consumer budgets and thepossibility of using it in social policy. Living Standards ofPopulation in the Regions/Russian Living Standards Centre.Moscow, 2000. Issue 7-8.
4 Law on ‘Subsistence minimum’ was adopted on 16November 1999 and became effective since 1 January 2000.
5 The dietary intake norms are fixed by the Kazakh Academyof Nutrition.
CHAPTER 1. POVERTY AND ITS MEASUREMENT

16
POVERTY IN KAZAKHSTAN: CAUSES AND CURES
addressing a person’s physiological and socialneeds, including savings and tax payments. Itcorresponds to the advanced level of consumptionthat enables human development6, defined as theprocess of enlarging people’s choices, includingleading a long and healthy life, be educated andenjoy decent standard of living.7
The system of population’s consumer budgetsallows grouping the total population of a countryinto four social strata based on their welfare level(table 1.2.1).
Social strata Criteria
Poor Income lower than thesubsistence minimum (SM)
Low income Income higher than the(at poverty risk) subsistence minimum but lower
than the minimum consumerbudget (2SM)
Middle income Income higher than the(provides for minimum consumer budget butcomfortable level lower than the high-incomeof consumption) budget (7SM)
High income Income higher than the high-(provides for income budget (7SM)advanced level ofconsumption)
Table 1.2.1Defining Social Strata
Income inequality is measured by incomedifferentiation and concentration indices. Theassets coefficient (income differentiation index)measures the income gap between the richest andthe poorest population groups. It is calculated ascorrelation between total incomes of the poorestand richest 10 percent (or 20 percent) ofpopulation (table 1.2.2). The Gini coefficient
Table 1.2.2Assets coefficient in some
countries, 2001
Country Assets coefficient
Kyrgyzstan 6.0
Croatia 7.3
Bulgaria 9.9
Kazakhstan 11.3*
Russia 14.0**
Source: Human Development Report 2003 MillenniumDevelopment Goals: A Compact Among Nations to End HumanPoverty. UNDP, 2003.* Poverty Monitoring Indicators in Kazakhstan. StatisticsAgency of Kazakhstan, 2003.** Socio-economic situation in Russia. December 2002. StateStatistics Committee of Russian Federation, 2002.
(income concentration index) measures theinequalities in the distribution of national income(or consumption) among individuals orhouseholds. More equal distribution of thenational wealth corresponds to a lower value ofthe Gini coefficient (closer to 0). Conversely,higher value of the Gini coefficient (closer to 1)testifies to the higher degree of income inequalitywith the poor holding less proportion of thenational wealth (table 1.2.3).
Table 1.2.3Gini coefficient in some countries, 2001
Country Gini coefficient
Czech Republic 0.273
Kazakhstan 0.348*
Romania 0.388
Moldova 0.391
Russia 0.398**
Ukraine 0.452
Kyrgyzstan 0.512
Source: Social Monitor 2003, The Monee Project, UNICEF2003.* Poverty Monitoring Indicators in Kazakhstan. StatisticsAgency of Kazakhstan, 2003.** Socio-economic situation in Russia. December 2002. StateStatistics Committee of Russian Federation, 2002.
The system of population’s consumer budgetsintroduces the income purchasing powerindex. It is calculated as the ratio between aperson’s income and the subsistence minimum,indicating how many sets of goods and servicesof the subsistence minimum could be purchased.This coefficient, hence, can also be used tomeasure income inequality.
1.3 MEASURING HUMAN POVERTY
To measure poverty in the human developmentperspective, UNDP in its Human DevelopmentReport of 1997 proposed the human povertyindex for developing countries (HPI-1). Thisindex refers to three dimensions of human life, alsoincluded in the human development index:8
6 Social Policy, Living Standards and Quality of Life. V.N.Bobkov and A.P. Pochinok, eds. Moscow, 2001.
7 Human Development Report 1997. UNDP 1997.8 Human Development Index was developed by UNDP in the
early 1990s. It is a composite index measuring averageachievement in three basic dimensions of humandevelopment – a long and healthy life (life expectancy atbirth rate), knowledge (adult literacy rate and the combinedprimary, secondary and tertiary gross enrolment rate) anddecent standards of living (GDP per capita measured in US$by purchasing power parities).
17
longevity, literacy and adequate living standards.Longevity is measured by the proportion ofpopulation not surviving the age of 40. Literacy isdetermined by the proportion of illiterate adults inthe total population. Living standards are definedby three indicators, including the proportion ofpeople without access to safe drinking water andhealthcare services and the proportion ofunderweight children among under-fives.
Taking into consideration the different socialand economic environment of developedcountries, the UNDP Human Development Reportof 1999 proposed the human poverty index fordeveloped countries (HPI-2) using a differentformula. The longevity is measured by the shareof people not surviving the age of 60. Literacy levelis measured by the proportion of ‘functionally’illiterate adults in the total population (people’sability to understand instructions and completeforms). The level of welfare is measured by shareof population with incomes below 50 percent ofaverage per capita income and proportion of thelong-term (more than 12 months) unemployedpeople.
HPI-1 and HPI-2 measuring poverty indeveloping and developed countries are not directlyapplicable to Kazakhstan. Therefore, the HumanDevelopment Report 2000 for Kazakhstanintroduced a human poverty index (HPI-3). Incalculating HPI-3, the percentage of population notsurviving the age of 60 is used to measure longevity.To measure the education level the percentage of16-year-olds dropping out of school is used. This
indicator was selected because in Kazakhstanchildren begin schooling at the age of six or sevenand are expected to be in school at the age of 16(with compulsory 11-year secondary education).However, 16-year-olds often leave secondaryschool after finishing just the ninth grade. Then, thepercentage of population with consumption levelsbelow the subsistence minimum is used as atpresent it is hard obtain reliable data on people’sincomes levels. The unemployment rate is the lastbut not least indicator used to calculate the HPI-3(box 1.3.1).
To assess and monitor poverty in the humandevelopment perspective, a comprehensive setof indicators (see Annex 1. Key Poverty MonitoringIndicators) can be used to analyse the manydimensions of poverty and inequality in society.In fact, those indicators include the whole rangeof the Millennium Development Goals and Targets(see section 1.5).
1.4 POVERTY IN TRANSITION: THE CASEOF COMMONWEALTHOF INDEPENDENT STATES (CIS)
The independent states that emerged after thecollapse of the Soviet Union in 1991 face majorchallenges for human development. In the recentyears per capita GDP in those countries has beeneither low medium or low10.
At the initial stage of independent statehoodpreviously established macroeconomic and other
9 Calculated by Statistics Agency of Kazakhstan at request from UNDP Kazakhstan.10 The World Bank ranks GDP per capita, in USD by exchange rate, as follows: over 9,000 as high, between 3,000 and 9,000
as high medium, between 800 and 3,000 as low medium, less than 800 as low GDP. See The World and Russia. V.S.Avtonomov and T.P. Subbotina, eds. Saint Petersburg, Economic School Publishing Agency, 1999, p. 13.
Box 1.3.1 Human poverty index in Kazakhstan
���������� ����������7�8�.������(291'/)�����#��#����������������������� �����!!���6��������#����
�����������������������:;59�������������� ����������� ����#���291'�����291'��������������������
����������#��������������#���������.����������##������������#���#����������������7�8�.�������6������������
#� ������������������#�����<
• �������������������������������#���� �������������������������#�� ��� � $
• ���������������������������������������������������%"$• ���������������%'����'����������������������#�����$• ������������������ ������������������
6����������#�������������������� �#��������291'/�������������!!�'�""�����������������������#���������
/�"� ������,����#�������#�� ���������� ������ � ����� ���� ��� �������������������������������������#����������
�����������������������#� ���������������291'/�����""��������������,������#�����������7�8�.����������������
������#� ��4#���� �������������������������#�� ��� � $��������������#���#�����/�����#�������7�8�.�����
��������������������%"������$�/�����#�������%'����'���������������#�������#�������#����������!�/����#����������
����������#���������� �������!�1��!!������!!!�����291'/�����#��#������������������������ ������� �������
������������������������������������������������ ������� ������7�8�.�������1���""����������������� ������291'
/�����#��#����������������������������������������������������������������������#������������������������������
������������������
CHAPTER 1. POVERTY AND ITS MEASUREMENT

18
POVERTY IN KAZAKHSTAN: CAUSES AND CURES
economic links were broken. Development of newmarket relations was accompanied by destructionof the centrally planned system and ineffectivemanagement decisions, which led to profoundeconomic and transformational crisis. The socialcosts of the transition included rapid growth inabsolute poverty incidence and rising incomeinequalities, as well as lack of resources to haltor reduce those.
The market changes brought about severaleconomic recessions, which led to deteriorationof the situation on the labour market (risingunemployment and low salaries) andconsequently to the growth of poverty (table1.4.1). Inter-country labour migration and over-concentration of workforces in a limited numberof industries further aggravated the situation.Another factor contributing to poverty is highlyunequal (re-) distribution of national wealth.
problematic for the state to maintain the Sovietsystem of social security. High business tax ratesand dependency attitudes of recipients of socialbenefits hindered productive employment.Therefore, in the 1990s the CIS countries movedtowards new systems of social security compliantwith the emerging market economy. Most CISstates developed new social and medicalinsurance schemes, as well as reformed theirpension systems. Means-tested social assistancewas introduced. New social protection institutionsemerged to deliver social services to the mostvulnerable groups of population.
Now the ‘old’ and ‘new’ systems of socialsecurity co-exist in almost all CIS countries. Thistransitional state, in which old systems have notbeen fully dismantled while new ones have notbeen put in place, reduces the efficiency of socialsecurity. Many ‘old’ guarantees and benefitsremain but are not backed up by adequatefinancial resources from the state. The newlyintroduced targeted benefits are not sufficient toalleviate poverty either. The size of manyinsurance transfers fails to compensate for lostemployment incomes. The pension schemes donot cater for the financial needs of the pensioners.
Other challenges are falling quality of healthcare and education services, demographic andmigration processes as well as gender, regionaland environmental concerns.
Table 1.4.1Unemployment rate in some
countries, 2002
Country Unemploymentrate, %
Norway 3.9
Poland 5.1
Japan 5.4
United States 5.8
Canada 7.1
Russia 8.0
Kazakhstan 9.3
Ukraine 10.2
Germany 10.9
Source: Living Standards of Population in Kazakhstan.Statistics Agency of Kazakhstan, 2003.
Poverty in the CIS region is also affected by thespecifics of the Soviet social security system. Theyoung nations inherited a system of social securitythat covered almost the entire population andensured a high level of social guarantees. As a result,at the beginning of the transition period, the CIScountries did not experience poverty problemstypical to developing countries, such as lack ofaccess to basic health care and mass epidemics,lack of food supply and lack of population with basicprofessional skills.
Due to emerging poverty the CIS countries didnot reform their social security systemsimmediately after independence. This to someextent explains why poverty did not grow todisastrous levels. However, as the private andstate-private forms of ownership developed andeconomic roles of the state changed, it became
Table 1.4.2Public expenditures on health and
education in some countries, 2000
Country Public Publicexpenditures expenditures
on health, on education,as % of GDP as % of GDP
Germany 8.0 4.6
Canada 6.5 5.5
Sweden 6.2 7.8
Japan 5.9 3.5
United States 5.8 4.8
Hungary 5.1 5.0
Russia 3.7 4.4
Kyrgyzstan 3.5 5.4
Kazakhstan 2.1* 3.3*
United ArabEmirates 1.9 2.5
Ecuador 1,6 1,2
Source: Human Development Report 2003 MillenniumDevelopment Goals: A Compact Among Nations to End HumanPoverty. UNDP, 2003.* Source: Poverty Monitoring Indicators in Kazakhstan.Statistics Agency of Kazakhstan, 2003.

19
Reflecting the specifics of the transition period,the relative poverty has not been measured in theCIS countries as it puts more responsibility on thegovernments. The CIS countries tend to combatabsolute poverty primarily by increasing minimumlevels of income (consumption) to a fixed level.Absolute poverty incidence is measured based onsubsistence minimum equal to the value of theminimum consumer basket. Its value more or lesscorresponds to the poverty line of 4 US dollars(1990 PPP$) per day as recommended by theWorld Bank for Central and Eastern Europe andCIS. At the same time, the governments introduceso called ‘administrative poverty lines’, which areused as criteria for state targeted socialassistance to the poor. This is necessitated bythe lack of financial resources to help the poorreach the subsistence minimum level.
Most CIS countries use a set of poverty andinequality indicators (box 1.4.1), as recommendedby the CIS Statistics Committee. Armenia andGeorgia apply the relative and subjective povertyconcepts. Belarus determines poverty durationand considers socio-demographic factors ofpoverty. Russia uses disposable householdincome, the number of the extremely poor withincomes lower than half of the subsistenceminimum and the population’s purchasing powerindex. Kyrgyzstan uses the extreme poverty line.In Ukraine there are combined indicators takinginto account income/consumption levels.11
To conclude, the CIS countries have to achieve
sustainable pro-poor economic growth leading tosubstantially increased salaries and wages, aswell as expanded productive employmentopportunities. The social security systems needto be improved to effectively mitigate poverty.Other challenges to address are falling quality ofhealth care and education services, demographicand migration processes as well as gender,regional and environmental concerns.
1.5 STATUS OF THE MILLENNIUMDEVELOPMENT GOALS IN KAZAKHSTAN
Summarizing all Kazakhstan’s strategies andprogrammes pertaining to poverty alleviation andimprovement of living standards of people, thefollowing priority national human developmentgoals can be marked out:
• Active employment policies conducive toproductive labour and strengtheningcountry’s human resources; preserving andcreating new jobs; enhancing professionaltraining and re-training of the unemployed tomeet the requirements of the labour market;expanding public works; legalizing labourrelations; developing social partnerships toensure social stability and public accord;resolving labour conflict; ensuring labourrights of people and their social security.
• Forming a ‘middle class’ fundamental to thestability of society, through creating a social
11 Recommendations on improving living standards indicators. The Statistics of the CIS countries, CIS Statistics Committee,2003. Issue 6.
12 International Seminar on Poverty Assessment The Statistics of the CIS countries, CIS Statistics Committee, 1999. Issue 20.
Box 1.4.1 Poverty and inequality indicators by the CIS Statistics Committee12
=��9�����������#�����
��6�������������#�����<
• ����������#�� ��� �
• �������������• ������ ��������������
���6����#��������������
• ���� ������������>������������������������������������������#� ���������������������������#�
��� � �(������������)$
• ���#���������������>�����������������������������������#���� �����������������������������#�
��� � �(������������)$
• � ����������#� ��(#���� �����)����������������������$
• ��������������������������������#���?��1��*�����������#�����
���������#�����#�����(��#� ������������������#�����#����)�
���5�����������������#� ��(#���� �����)�� ��������*�����������������������������
@��1����������#���� ������(��������������#����)
��A����������������#� �������������������� �����������������.���
CHAPTER 1. POVERTY AND ITS MEASUREMENT

20
POVERTY IN KAZAKHSTAN: CAUSES AND CURES
and economic environment conducive to thedevelopment of small and medium sizedenterprises (SME) by increasing the qualityand standards of people’s lives. This shouldinclude the enhancement of social andfinancial infrastructures and statutory socialservices.
• New educational model, integrated with theworld educational community and providinghighly professional and competitiveworkforce for the labour market.
• Mitigation of negative trends in demographicand migration processes, creating anenvironment conducive to populationgrowth, first of all, through establishingeffective mechanisms to support families andmaternity along with achieving genderequality.
• Tangible decrease in morbidity rates byincreasing access to and quality of healthcare; improving the health status of thepopulation by promoting healthy lifestyles.
• Enhancing social security by providingtargeted assistance to the disabled and thepoor, create wider employment opportunitiesfor the long-term unemployed and encourageproductive work of people.
• Rural development, aimed at ensuring betterliving standards in rural settlements (auls13)based on sound geographic rural settling,development of rural infrastructure.
Kazakhstan’s five year experience in achievingthe national development goals suffice forassessment of the Government’s activities onpoverty alleviation in the context of progresstowards the UN Millennium Development Goals(MDGs). As the 2002 Millennium DevelopmentGoals Report for Kazakhstan states, the nationhas already achieved two out of seven MDGs,namely universal primary education and genderequality in primary and secondary education.14
Kazakhstan has a strong potential for meeting thegoal of eradicating extreme poverty and hunger;and can ensure sustainable access to safe potablewater of the majority of population. However,there remain challenges of reducing child mortalityand improving maternal health (table 1.5.1 and1.5.2), halting the spread of HIV/AIDS, as well asensuring environmental sustainability, whichKazakhstan is unlikely to meet by 2015. The table1.5.3 summarizes Kazakhstan’s position withregard to the MDGs. This report attempts toprovide in-depth analysis of some MDG targets.
Table 1.5.1Infant mortality and under five mortality
rates in some countries, 2001
Country Infant mortality Under fiverate, deaths per mortality rate,1,000 live births deaths per 1,000
live births
Japan 3.0 5.0
Norway 4.0 4.0
Germany 4.0 5.0
Canada 5.0 7.0
United States 7.0 8.0
Poland 8.0 9.0
Russia 18.0 21.0
Kazakhstan 19.3* 22.8**
Kyrgyzstan 52.0 61.0
Source: Human Development Report 2003 MillenniumDevelopment Goals: A Compact Among Nations to End HumanPoverty. UNDP, 2003.* Poverty Monitoring Indicators in Kazakhstan. StatisticsAgency of Kazakhstan, 2003.** UN Millennium Development Goals in Kazakhstan, 2002.
Table 1.5.2Maternal mortality rate
in some countries, 2001
Country Maternal mortality rate,deaths per 100,000 live
births
Czech Republic 3.3
Hungary 5.2
Ukraine 18.1
Romania 34.0
Russia 36.5
Kazakhstan 39.7*
Kyrgyzstan 43.8
Source: Social Monitor 2003. UNICEF Monee Project.* Poverty Monitoring Indicators in Kazakhstan. StatisticsAgency of Kazakhstan, 2003.
13 In Kazakhstan aul refers to the rural settlement.14 UN Millennium Development Goals in Kazakhstan, 2002.
81st spring.By Pavel Tischenko.

21
Poverty is a multidimensional phenomenon thathas deep socio-economic, cultural andpsychological roots. It is conditioned by time andlocation. Historical developments within individualcountries must be taken into account whenmeasuring poverty.
There are several ways to measure povertyincluding absolute, relative and subjectivemeasures. In its 1997 Human DevelopmentReport, the United Nations DevelopmentProgramme suggested considering poverty fromthe perspective of human development. In thisperspective, indicators reflecting humandevelopment (life expectancy, unemployment,infant mortality, maternal mortality and others)are used to measure human poverty along withtraditional measures of income poverty such asincome levels, subsistence levels, andpurchasing power. In fact human developmentindicators include the whole range of MillenniumDevelopment Goals and targets. Accordingly, thereport suggests using a comprehensive set ofhuman poverty indicators for Kazakhstan.
The notion of a subsistence minimum is animportant instrument of state social policy in thefight against poverty. It is actually used worldwideas the criterion of absolute poverty and is thusreferred to as the “poverty line” because itcorresponds to the minimum level of income thatis required to satisfy the most basic human needs.In Kazakhstan the subsistence minimum is alsoused to measure the incidence of absolutepoverty. However, poverty is closely related toeconomic inequality and should be addressed inconjunction with welfare levels in all segments ofsociety. The report therefore suggests thatKazakhstan not only has to focus its anti-povertymeasures on those in absolute poverty, but mustalso take action to prevent people at poverty riskfrom falling into absolute poverty. A level of twicethe subsistence minimum is thus recommendedfor defining those at poverty risk. Although thislevel of income is higher than the survival level, itstill does not suffice for sustaining people’sphysical and intellectual capacities needed for adecent standard of living.
�����
ACHIEVED
Table 1.5.3Progress towards the Millennium Development Goals in Kazakhstan
Will the target be met?Goals/Targets
Probably Potentially Unlikely Nodata
Source: UN Millennium Development Goals in Kazakhstan, 2002
�
�
�
�
�
�
�
EXTREME POVERTYHalve the proportion of people living belowthe subsistence minimum by 2015
HIV/AIDSHalt and reverse the spread of HIV/AIDS by 2015
HUNGERHalve the proportion of underweight amongunder-five year olds by 2015
BASIC AMENITIESHalve the proportion of people without accessto safe drinking water
UNIVERSAL PRIMARY EDUCATIONAchieve universal primary education by 2015
GENDER EQUALITYAchieve equal access for boys and girls to primaryand secondary schooling by 2005
MATERNAL HEALTHReduce maternal mortality ratio by three-quarters by 2015
CHILD MORTALITYReduce under-five mortality by two-thirds by 2015
ENVIRONMENTAL SUSTAINABILITYReverse loss of environmental resources by 2015
ACHIEVED
CHAPTER 1. POVERTY AND ITS MEASUREMENT

22
POVERTY IN KAZAKHSTAN: CAUSES AND CURES
One of the consequences of transition in post-Soviet economies, including Kazakhstan, isgrowing poverty incidence (see Section 1.4). Thepoverty situation is conditioned by many factors:economic recession, rapid decline in real wages,increased unemployment rates and devaluedsocial benefits1, low incomes and increasinginequalities, demographic and migrationprocesses as well as gender, regional andenvironmental factors. The analysis of problemsin each of the listed areas provides acomprehensive account of current povertysituation in the country.
2.1 POVERTY AND INEQUALITY
2.1.1 INCOME POVERTY
In Kazakhstan poverty incidence, or povertyheadcount ratio, is defined as proportion of peoplewith incomes below subsistence minimum (seeSection 1.2). The subsistence minimum is anobjectively defined level of income (expenditure)proportionate to the value of goods and servicesincluded in the consumer’s basket. Theconsumer’s basket consists of the food basket(70 percent) and non-food items and services (30
CHAPTER 2. POVERTY IN KAZAKHSTAN
percent). The food basket size and structure iscalculated to meet a certain nutritional intakeexpressed mainly by calorie intake, alsoconsidering food habits and availability of thegoods in the local market. At the moment, the foodbasket contains items at the per-capita level of2,172 kcals per day, which satisfies the WHOstandards. As mentioned above, this constitutes70 percent of the subsistence minimum. The shareof non-food items and services are fixed at 30percent of the value of the subsistence minimum.
The highest level of income poverty inKazakhstan was registered in 1998 when 39percent of the country’s population lived belowthe subsistence minimum (3,336 tenge or 42.6USD, by the official exchange rate2). Over theperiod between 1998 and 2002 the poverty leveldeclined considerably, which is clearly seen fromTable 2.1.1. By 2002 the percentage of thepopulation with incomes below the subsistenceminimum fell 1.6 times and stood at 24 percent,or 3.6 million people. The subsistence minimumwas 4,761 tenge or 31.1 USD, by the officialexchange rate.3 The poverty depth and severityindices, which characterise the income shortfallof the poor and the degree of inequality amongthem, also show downward trends. During 1998-
Table 2.1.1Income poverty, 1998–2002
Income poverty indicators 1996 1997 1998 1999 2000 2001 2002
1 Subsistence minimum (SM), tenge 2,821 3,120 3,336 3,394 4,007 4,596 4,761
2 Proportion of population with incomesbelow SM, % 34.6 38.3 39.0 34.5 31.8 28.4 24.2
3 Poverty depth, % 11.4 12.1 12.8 13.7 10.3 7.8 6.1
4 Poverty severity, % 5.2 3.1 3.8 5.5 4.0 3.1 2.2
5 Food basket (FB), tenge 1,975 2,184 2,601 2,376 2,805 3,217 3,333
6 Proportion of population with incomesbelow FB, % ... 12.7 16.2 14.5 11.7 11.7 8.9
Source: Poverty Monitoring Indicators in Kazakhstan. Statistics Agency of Kazakhstan, 2003.
1 Human Development: New Measure of Socio-Economic Progress. Textbook. Moscow 2000.2 In 1998, official exchange rate of 1 USD was 78.29 tenge. Statistics Yearbook. 2003. Statistics Agency of Kazakhstan, 2003.3 In 2002, official exchange rate of 1 USD was 153.28 tenge. Statistics Yearbook. 2003. Statistics Agency of Kazakhstan,
2003.
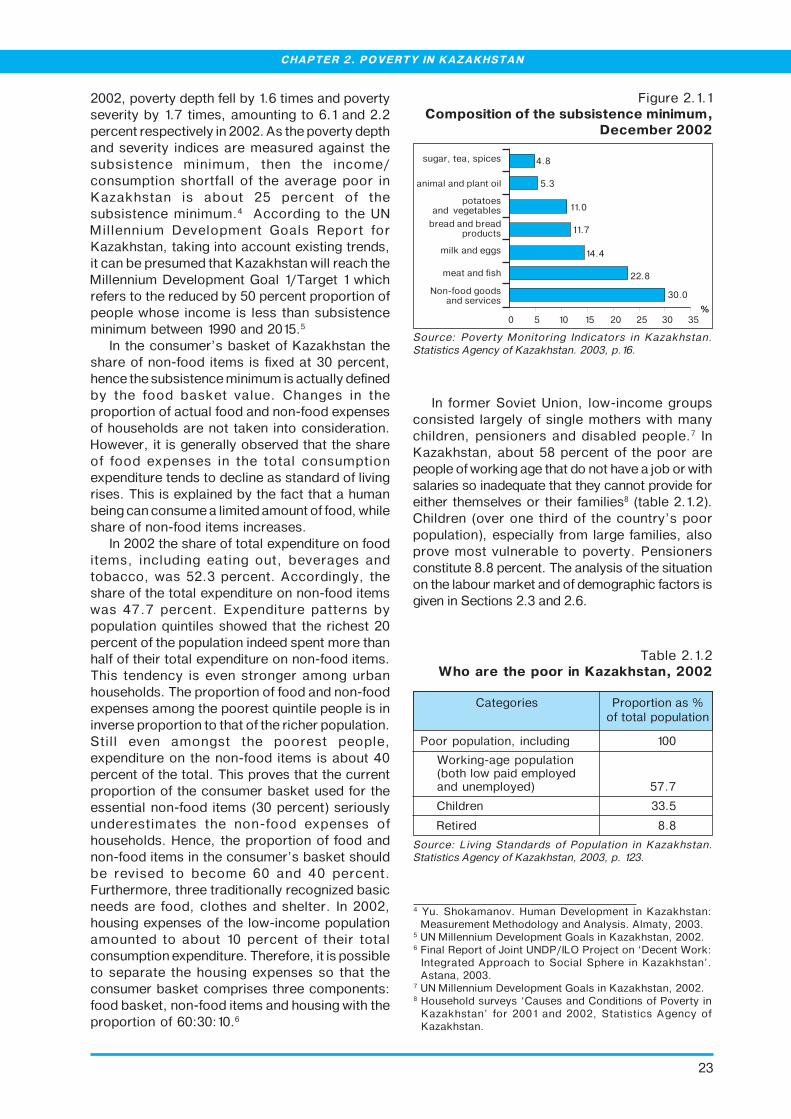
23
2002, poverty depth fell by 1.6 times and povertyseverity by 1.7 times, amounting to 6.1 and 2.2percent respectively in 2002. As the poverty depthand severity indices are measured against thesubsistence minimum, then the income/consumption shortfall of the average poor inKazakhstan is about 25 percent of thesubsistence minimum.4 According to the UNMillennium Development Goals Report forKazakhstan, taking into account existing trends,it can be presumed that Kazakhstan will reach theMillennium Development Goal 1/Target 1 whichrefers to the reduced by 50 percent proportion ofpeople whose income is less than subsistenceminimum between 1990 and 2015.5
In the consumer’s basket of Kazakhstan theshare of non-food items is fixed at 30 percent,hence the subsistence minimum is actually definedby the food basket value. Changes in theproportion of actual food and non-food expensesof households are not taken into consideration.However, it is generally observed that the shareof food expenses in the total consumptionexpenditure tends to decline as standard of livingrises. This is explained by the fact that a humanbeing can consume a limited amount of food, whileshare of non-food items increases.
In 2002 the share of total expenditure on fooditems, including eating out, beverages andtobacco, was 52.3 percent. Accordingly, theshare of the total expenditure on non-food itemswas 47.7 percent. Expenditure patterns bypopulation quintiles showed that the richest 20percent of the population indeed spent more thanhalf of their total expenditure on non-food items.This tendency is even stronger among urbanhouseholds. The proportion of food and non-foodexpenses among the poorest quintile people is ininverse proportion to that of the richer population.Still even amongst the poorest people,expenditure on the non-food items is about 40percent of the total. This proves that the currentproportion of the consumer basket used for theessential non-food items (30 percent) seriouslyunderestimates the non-food expenses ofhouseholds. Hence, the proportion of food andnon-food items in the consumer’s basket shouldbe revised to become 60 and 40 percent.Furthermore, three traditionally recognized basicneeds are food, clothes and shelter. In 2002,housing expenses of the low-income populationamounted to about 10 percent of their totalconsumption expenditure. Therefore, it is possibleto separate the housing expenses so that theconsumer basket comprises three components:food basket, non-food items and housing with theproportion of 60:30:10.6
In former Soviet Union, low-income groupsconsisted largely of single mothers with manychildren, pensioners and disabled people.7 InKazakhstan, about 58 percent of the poor arepeople of working age that do not have a job or withsalaries so inadequate that they cannot provide foreither themselves or their families8 (table 2.1.2).Children (over one third of the country’s poorpopulation), especially from large families, alsoprove most vulnerable to poverty. Pensionersconstitute 8.8 percent. The analysis of the situationon the labour market and of demographic factors isgiven in Sections 2.3 and 2.6.
Figure 2.1.1Composition of the subsistence minimum,
December 2002
Source: Poverty Monitoring Indicators in Kazakhstan.Statistics Agency of Kazakhstan. 2003, p.16.
Table 2.1.2Who are the poor in Kazakhstan, 2002
Categories Proportion as %of total population
Poor population, including 100
Working-age population(both low paid employedand unemployed) 57.7
Children 33.5
Retired 8.8
Source: Living Standards of Population in Kazakhstan.Statistics Agency of Kazakhstan, 2003, p. 123.
4 Yu. Shokamanov. Human Development in Kazakhstan:Measurement Methodology and Analysis. Almaty, 2003.
5 UN Millennium Development Goals in Kazakhstan, 2002.6 Final Report of Joint UNDP/ILO Project on ‘Decent Work:
Integrated Approach to Social Sphere in Kazakhstan’.Astana, 2003.
7 UN Millennium Development Goals in Kazakhstan, 2002.8 Household surveys ‘Causes and Conditions of Poverty in
Kazakhstan’ for 2001 and 2002, Statistics Agency ofKazakhstan.
CHAPTER 2. POVERTY IN KAZAKHSTAN

24
POVERTY IN KAZAKHSTAN: CAUSES AND CURES
The percentage of the population withincomes below the food basket cost wasdeclining slowly. By 2002 it dropped to 8.9percent or 1.3 million people, with the foodbasket cost at 3,333 tenge or 21.7 USD, by theofficial exchange rate.9 Compared to 1998 thepercentage of the population living below thefood basket level had dropped by 1.8 times(table 2.1.1). As mentioned in UN MillenniumDevelopment Goals Report for Kazakhstan itcan be assumed that people whose income isbelow the food basket cost are most likely tosuffer from inadequate nutrition. Malnutritionreduces energy and mental concentration andcan present serious risks to people’s healthand, in the most severe cases, survival.Furthermore, it is one of the causes of the highincidence of anaemia, which is recognized asan acute health problem in Kazakhstan (seeSection 2.7).10
Analysis of dietary intake of the poor, basedon 2002 data, showed that the so-called‘carbohydrate nutrition model’ was prevalentamong the poor in comparison to the overallpopulation (table 2.1.3).
9 In 2002, official exchange rate of 1 USD was 153.28 tenge.Statistical Yearbook for 2003. Statistics Agency ofKazakhstan, 2003.
10 UN Millennium Development Goals in Kazakhstan, 2002.11 National Nutrition Survey of Kazakhstani Population.
Institute of Nutrition of Kazakhstan/UNDP, 2001. Thefindings of the survey can be referred to within 10 years afterthe time of the survey.
12 ‘Determining the Poverty Line’. Government’s Decree#537 as of 8 April 2000.
Table 2.1.3Dietary intake of the poor and general
population, 2002
# Food Average per Average perproducts capita dietary capita dietary
intake of the intake of thepoor, kg per general popu-
month lation, kg permonth
1 Bread productsand cereals 10.3 10.0
2 Meat and meatproducts 1.7 3.7
3 Fish andseafood 0.4 0.7
4 Milk and dairyproducts 11.1 19.3
5 Eggs 4.8 9.4
6 Oils and fats 0.9 1.2
7 Berries, fruit,melons andgourds 1.2 2.7
8 Vegetables 4.2 6.7
9 Potatoes 3.3 5.4
10 Sugar, jam,honey & otherconfectionery 2.0 2.7
Source: Living Standards of Population in Kazakhstan.Statistics Agency of Kazakhstan, 2003 pp.81-82.
The poor consume more bread products andcereals but less ‘high-quality’ products such asmeat, milk, eggs, fruit and vegetables. Forexample, in 2002 consumption of meatproducts among the poorest people was morethan 2 times less than the national average: 1.7kg and 3.7 kg respectively. The gap inconsumption of milk, eggs, fruit and vegetableswas also more than 2 times.
In 1996 Kazakh Nutrition Academy, incollaboration with UNDP and WHO, conducteda national nutrition survey of the Kazakhstanpopulation.11 The survey showed that the mostaffordable food items for poor population werebread, whole milk, lamb, black tea, sugar, flourand macaroni, which made up the bulk of theirdiet. People with higher incomes consume moremeat products, eggs, dairy products, tinnedvegetables, potatoes, curds and cheese. As ahousehold’s income rises, its diet widens toinclude chicken, fish, various fatty products,vegetables, cereals, confectionery andalcoholic and non-alcoholic drinks.
In addition to the poverty headcount ratio(percentage of people with incomes less thanthe subsistence minimum) Kazakhstan uses theadministrative ‘poverty line’, which is describedin the Law on ‘the Subsistence Minimum’ (box1.2.1). According to the law, the ‘poverty line’is an eligibility criterion for state targeted socialassistance provision to the poor; it is equal tothe minimum income required to satisfy basichuman needs. The amount of the assistance isdetermined on the basis of the country’seconomic capacity. The poverty line wasdetermined at 38 percent of the subsistenceminimum for 2000-2001 (1,523 and 1,747 tengeper month respectively). In 2002 this figureamounted to 40 percent of the subsistenceminimum (1,904 tenge or 12.4 US dollars byofficial exchange rate).12
By the end of 2002 more than a million people(1,137 million) received state targeted socialassistance in Kazakhstan. In 2002 the averagemonthly amount of state social targetedassistance was 998 tenge (or 6.5 US dollars by
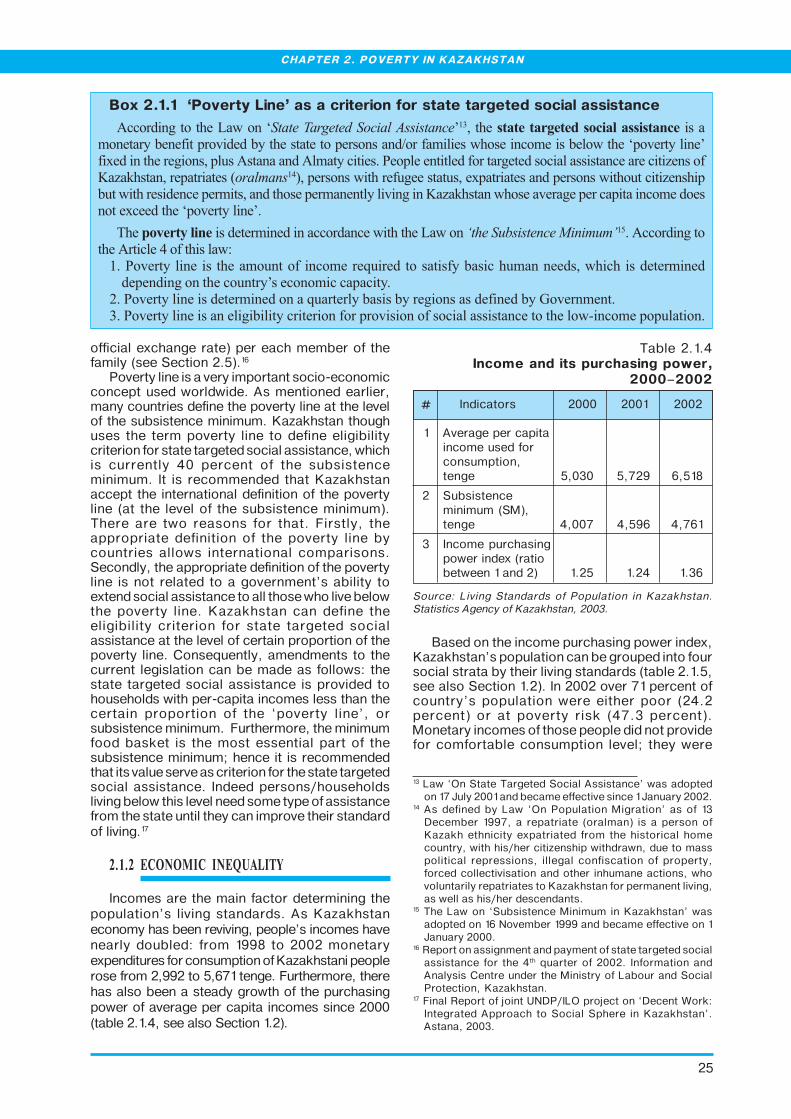
25
official exchange rate) per each member of thefamily (see Section 2.5).16
Poverty line is a very important socio-economicconcept used worldwide. As mentioned earlier,many countries define the poverty line at the levelof the subsistence minimum. Kazakhstan thoughuses the term poverty line to define eligibilitycriterion for state targeted social assistance, whichis currently 40 percent of the subsistenceminimum. It is recommended that Kazakhstanaccept the international definition of the povertyline (at the level of the subsistence minimum).There are two reasons for that. Firstly, theappropriate definition of the poverty line bycountries allows international comparisons.Secondly, the appropriate definition of the povertyline is not related to a government’s ability toextend social assistance to all those who live belowthe poverty line. Kazakhstan can define theeligibility criterion for state targeted socialassistance at the level of certain proportion of thepoverty line. Consequently, amendments to thecurrent legislation can be made as follows: thestate targeted social assistance is provided tohouseholds with per-capita incomes less than thecertain proportion of the ‘poverty line’, orsubsistence minimum. Furthermore, the minimumfood basket is the most essential part of thesubsistence minimum; hence it is recommendedthat its value serve as criterion for the state targetedsocial assistance. Indeed persons/householdsliving below this level need some type of assistancefrom the state until they can improve their standardof living.17
2.1.2 ECONOMIC INEQUALITY
Incomes are the main factor determining thepopulation’s living standards. As Kazakhstaneconomy has been reviving, people’s incomes havenearly doubled: from 1998 to 2002 monetaryexpenditures for consumption of Kazakhstani peoplerose from 2,992 to 5,671 tenge. Furthermore, therehas also been a steady growth of the purchasingpower of average per capita incomes since 2000(table 2.1.4, see also Section 1.2).
Box 2.1.1 ‘Poverty Line’ as a criterion for state targeted social assistance
�##��������������B������C���������������� ������ ������&/� ��������������������������������� ���� ����������������������������������������������������4����� ��������������#� ���������������C������������&��������������������������������������� ����#�������9������������������������������#������������#������#���8������7�8�.������������������(��������,)�������������������������������������������������������������#���8����������������������#����� ����������������� ������������������7�8�.������������������������#��������#� ������������#��������C������������&�
6������� ������������� ���������##�����#�����������B��������������� �������� � ����+���##�����������������#���,������������<��9������� ����� ��� ����� �������� ��#� ����*���������������������#��� ������������#���������� ���������������������#������&���#��� �#�#���#����
���9�������������������� ����������*���������������������������������������������� ����/��9������������������������������#����������������������������#������������#������������'��#� �������������
13 Law ‘On State Targeted Social Assistance’ was adoptedon 17 July 2001 and became effective since 1 January 2002.
14 As defined by Law ‘On Population Migration’ as of 13December 1997, a repatriate (oralman) is a person ofKazakh ethnicity expatriated from the historical homecountry, with his/her citizenship withdrawn, due to masspolitical repressions, illegal confiscation of property,forced collectivisation and other inhumane actions, whovoluntarily repatriates to Kazakhstan for permanent living,as well as his/her descendants.
15 The Law on ‘Subsistence Minimum in Kazakhstan’ wasadopted on 16 November 1999 and became effective on 1January 2000.
16 Report on assignment and payment of state targeted socialassistance for the 4th quarter of 2002. Information andAnalysis Centre under the Ministry of Labour and SocialProtection, Kazakhstan.
17 Final Report of joint UNDP/ILO project on ‘Decent Work:Integrated Approach to Social Sphere in Kazakhstan’.Astana, 2003.
Table 2.1.4Income and its purchasing power,
2000–2002
# Indicators 2000 2001 2002
1 Average per capitaincome used forconsumption,tenge 5,030 5,729 6,518
2 Subsistenceminimum (SM),tenge 4,007 4,596 4,761
3 Income purchasingpower index (ratiobetween 1 and 2) 1.25 1.24 1.36
Source: Living Standards of Population in Kazakhstan.Statistics Agency of Kazakhstan, 2003.
Based on the income purchasing power index,Kazakhstan’s population can be grouped into foursocial strata by their living standards (table 2.1.5,see also Section 1.2). In 2002 over 71 percent ofcountry’s population were either poor (24.2percent) or at poverty risk (47.3 percent).Monetary incomes of those people did not providefor comfortable consumption level; they were
CHAPTER 2. POVERTY IN KAZAKHSTAN
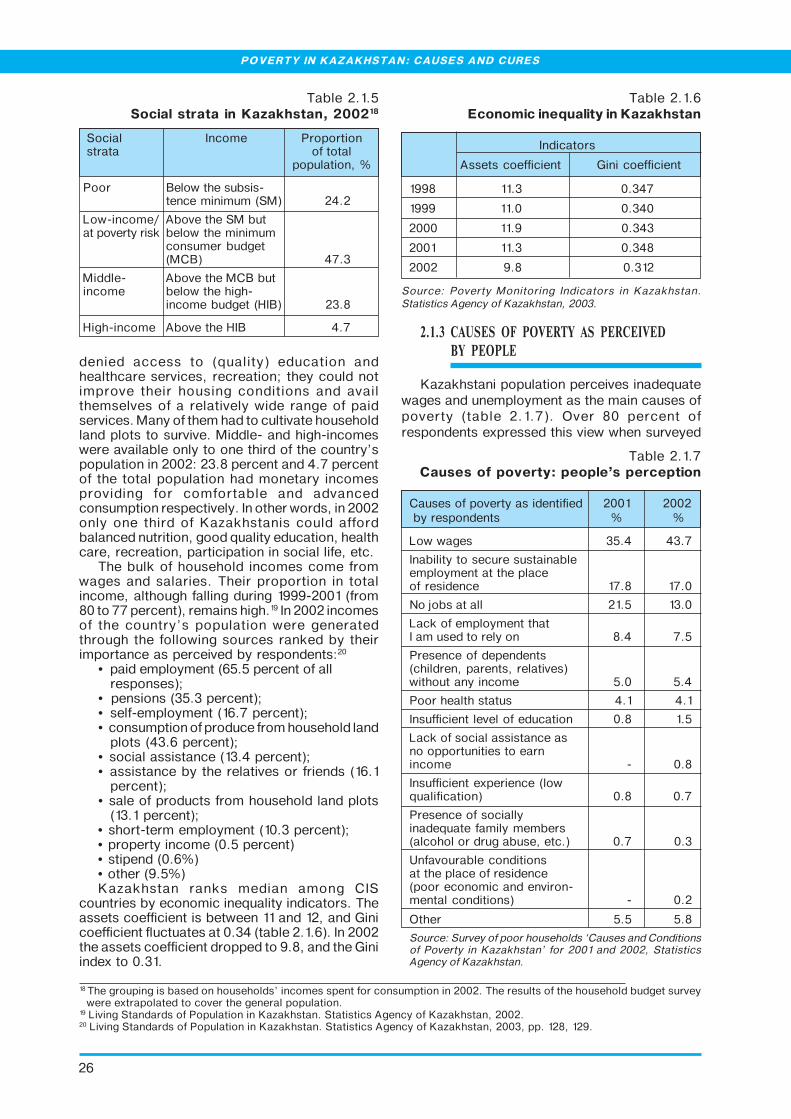
26
POVERTY IN KAZAKHSTAN: CAUSES AND CURES
Table 2.1.5Social strata in Kazakhstan, 200218
Social Income Proportionstrata of total
population, %
Poor Below the subsis-tence minimum (SM) 24.2
Low-income/ Above the SM butat poverty risk below the minimum
consumer budget(MCB) 47.3
Middle- Above the MCB butincome below the high-
income budget (HIB) 23.8
High-income Above the HIB 4.7
denied access to (quality) education andhealthcare services, recreation; they could notimprove their housing conditions and availthemselves of a relatively wide range of paidservices. Many of them had to cultivate householdland plots to survive. Middle- and high-incomeswere available only to one third of the country’spopulation in 2002: 23.8 percent and 4.7 percentof the total population had monetary incomesproviding for comfortable and advancedconsumption respectively. In other words, in 2002only one third of Kazakhstanis could affordbalanced nutrition, good quality education, healthcare, recreation, participation in social life, etc.
The bulk of household incomes come fromwages and salaries. Their proportion in totalincome, although falling during 1999-2001 (from80 to 77 percent), remains high.19 In 2002 incomesof the country’s population were generatedthrough the following sources ranked by theirimportance as perceived by respondents:20
• paid employment (65.5 percent of allresponses);
• pensions (35.3 percent);• self-employment (16.7 percent);• consumption of produce from household land
plots (43.6 percent);• social assistance (13.4 percent);• assistance by the relatives or friends (16.1
percent);• sale of products from household land plots
(13.1 percent);• short-term employment (10.3 percent);• property income (0.5 percent)• stipend (0.6%)• other (9.5%)Kazakhstan ranks median among CIS
countries by economic inequality indicators. Theassets coefficient is between 11 and 12, and Ginicoefficient fluctuates at 0.34 (table 2.1.6). In 2002the assets coefficient dropped to 9.8, and the Giniindex to 0.31.
2.1.3 CAUSES OF POVERTY AS PERCEIVEDBY PEOPLE
Kazakhstani population perceives inadequatewages and unemployment as the main causes ofpoverty (table 2.1.7). Over 80 percent ofrespondents expressed this view when surveyed
Table 2.1.6Economic inequality in Kazakhstan
Indicators
Assets coefficient Gini coefficient
1998 11.3 0.347
1999 11.0 0.340
2000 11.9 0.343
2001 11.3 0.348
2002 9.8 0.312
Source: Poverty Monitoring Indicators in Kazakhstan.Statistics Agency of Kazakhstan, 2003.
18 The grouping is based on households’ incomes spent for consumption in 2002. The results of the household budget surveywere extrapolated to cover the general population.
19 Living Standards of Population in Kazakhstan. Statistics Agency of Kazakhstan, 2002.20 Living Standards of Population in Kazakhstan. Statistics Agency of Kazakhstan, 2003, pp. 128, 129.
Table 2.1.7Causes of poverty: people’s perception
Causes of poverty as identified 2001 2002 by respondents % %
Low wages 35.4 43.7
Inability to secure sustainableemployment at the placeof residence 17.8 17.0
No jobs at all 21.5 13.0
Lack of employment thatI am used to rely on 8.4 7.5
Presence of dependents(children, parents, relatives)without any income 5.0 5.4
Poor health status 4.1 4.1
Insufficient level of education 0.8 1.5
Lack of social assistance asno opportunities to earnincome - 0.8
Insufficient experience (lowqualification) 0.8 0.7
Presence of sociallyinadequate family members(alcohol or drug abuse, etc.) 0.7 0.3
Unfavourable conditionsat the place of residence(poor economic and environ-mental conditions) - 0.2
Other 5.5 5.8
Source: Survey of poor households ‘Causes and Conditionsof Poverty in Kazakhstan’ for 2001 and 2002, StatisticsAgency of Kazakhstan.

27
Table 2.1.8 Ways to improve living standards as
perceived by people
Factors identified by Totalrespondents
Urban Ruralareas areas
Increased salary 46.1 49.9 42.5
Secured employment 35.0 29.3 40.4
Increased pensions 11.6 13.2 10.2
Professional growth 1.8 2.2 1.4
Start-up capital(loans) to set up ownbusiness 1.6 1.4 1.8
Improved healthstatus 1.5 1.6 1.3
Gaining a loan forsmall-scale business 0.7 0.4 1.1
Increased socialbenefits 0.7 1.0 0.3
Increased targetingof social assistance 0.3 0.3 0.2
Migration to anothercountry 0.3 0.4 0.1
Receive land andwork on it 0.2 0.1 0.4
In-country migration(from urban to ruralarea and vice versa) 0.1 0.0 0.2
Other 0.1 0.2 0.1
Source: Household survey ‘Causes and Conditions of Povertyin Kazakhstan’ for 2002, Statistics Agency of Kazakhstan
Includingresidents of
in 2001 and 2002.21 Correspondingly, the mainfactors that would, according to respondents,improve their financial position are increasedwages and secure employment (table 2.1.8). Theproblem of employment is more acute in rural thanin urban areas: 40.4 percent and 29.3 percent ofresponses (see Section 3.1).
begins with an analysis of the relationshipbetween economic growth and poverty.
Profound economic crisis in Kazakhstan lastedfive years, starting at the beginning of thetransition period: an increase in GDP (0.5 percent)was first registered only in 1996. However, since1999 Kazakhstan has been enjoying considerableeconomic growth coupled with a falling inflationrate (table 2.2.1). Thus created favourablemacroeconomic conditions for increasedemployment (especially in growth sectors) andincomes of the population, as well as for increasedpurchasing power of monetary incomes andreduced poverty levels. Indeed, the povertyheadcount ratio has dropped from 39 percent in1998 to 24 percent in 2002. In order to consolidatethis trend, further real GDP growth and changesin its final use are needed to ensure improvedstandards of living for the entire population.
The economic growth since 1999 has beenaccompanied by increasing gross capitalformation22 as well as household expenditure onconsumption. However, the growth rate of GDPexpenditure on gross capital formation wassignificantly higher than that of the householdexpenditure on consumption (table 2.2.2). Growthof GDP expenditure on gross capital formationitself and, more importantly, of fixed assets, canbe regarded as positive phenomenon, resultingin an enhanced production base for potentialeconomic growth. In transition economies thepriority of gross capital formation is, as a rule,
Figure 2.2.1Real GDP growth and poverty, 1996–2002
Source: Poverty Monitoring Indicators in Kazakhstan.Statistics Agency of Kazakhstan, 2003.
2.2 INFLUENCE OF ECONOMIC GROWTHON POVERTY REDUCTION
Sustainable economic development is themost important condition for improving thewelfare of the population and reducing poverty inthe country. Positive poverty reduction trends inrecent years have been linked to the impressiveeconomic growth since 1999, which has beenconducive to growing employment and incomelevels. It laid a favourable foundation for improvedstandards and quality of life in Kazakhstan (figure2.2.1). In this light, analysis of causes of poverty
21 Household survey «Causes and Conditions of Poverty».Statistics Agency of Kazakhstan, 2002.
22 Gross capital formation includes outlays on landimprovements, construction of plants, acquisition ofmachinery and equipment, infrastructure (including social)improvements and construction of private residentialdwellings.
CHAPTER 2. POVERTY IN KAZAKHSTAN

28
POVERTY IN KAZAKHSTAN: CAUSES AND CURES
fairly justified. However, immediately apparent is thedisproportionately high growth of gross capitalformation, which exceeds growth of the householdexpenditure on consumption in both absolute valuesas well as by rate. The low level of the householdexpenditure on consumption (in comparable prices,in 2001 it was 56 percent of its 1990 level23) suggeststhat the investments into fixed assets are made atthe expense of investments into human capital,including individual salaries and wages. Therefore,in the context of poverty reduction, it is importantto look into the expenditure on GDP.
Due to considerable economic growth,government revenue and expenditure havesignificantly increased in Kazakhstan (table2.2.3). The Government managed to reduce thebudget deficit from 69.8 billion tenge in 1999 to 13billion tenge in 2002. This allowed for increasedsocial spending from the national budget, andcontributed to improved welfare of the populationand reduced poverty. However, still the fundingof education, healthcare and social securityremains low thus restricting human development(table 2.2.4, also see Section 1.4).
Table 2.2.1Main economic indicators, 1998–2002
Indicators 1998 1999 2000 2001 2002
Real GDPgrowth (%) 98.1 102.7 109.8 113.5 109.8
GDP:
In billiontenge 1,733.3 2,016.5 2,599.9 3,250.6 3,776.3
In USD billionby officialexchangerate 22.1 16.8 18.3 22.2 24.6
Per capitaGDP:
In thousandtenge 115.0 135.1 174.8 219.2 254.2
In USD byofficialexchangerate, 1,469 1,129 1,229 1,491 1,646
Consumerprice index(%) 101.9 117.8 109.8 106.4 105.9
Source: Statistical Yearbook for 2003. Kazakhstan StatisticsAgency, 2003.
Table 2.2.2Expenditure on GDP and household
expenditure on consumption
1998 1999 2000 2001
Expenditure onGDP, %, including 100 100 100 100
Final consumption,including 84.1 84.0 74.4 73.1
Private 79.1 79.0 68.1 65.1
Government 5.0 5.0 6.3 8.0
Gross capitalformation, total 15.8 17.8 18.1 26.8
Net export -4.6 2.3 7.8 -3.0
Statisticaldiscrepancy 4.7 -4.1 -0.3 3.1
Household expendi-ture on consumptionin comparableprices, % relativeto previous year 99.5 100.1 102.5 108.9
Source: Statistical Yearbook for 2003. Statistics Agency ofKazakhstan, 2003.
Table 2.2.4Public expenditure
on the social sector, 1998–2002
Expenditureitems 1998 1999 2000 2001 2002
Total statebudgetexpenditure,% of GDP 21.8 23.2 23.2 22.1 22.3
of which, on:Education,billiontenge 69.5 78.5 84.7 106.4 121.1
% of GDP 4.0 3.9 3.3 3.3 3.2
Healthcare,billiontenge 26.0 44.8 54.3 62.3 71.1
% of GDP 1.5 2.2 2.1 1.9 1.9
Socialsecurity,billiontenge 53.6 159.1 171.1 186.7 201.4
% of GDP 3.1 7.9 6.6 5.7 5.4
Source: Living Standards of Population in Kazakhstan.Kazakhstan Statistics Agency, 2003.
23 Russia in Figures in 2003. Statistics Book. Russian NationalStatistics Committee. Moscow 2003, p.388.
Table 2.2.3State budget: revenue and expenditure
1998 1999 2000 2001 2002
Revenues,% of GDP 17.9 19.8 22.6 23.0 21.9
Revenues,billiontenge 309.5 398.6 598.7 746.6 821.2
Expenditure,% of GDP 21.8 23.2 23.2 23.4 22.3
Expenditure,billion tenge 377.4 468.4 602.0 759.6 834.2
Balance -67.8 -69.8 -3.3 -13.0 -13.0
Source: Living Standards of Population in Kazakhstan.Statistics Agency of Kazakhstan, 2003.
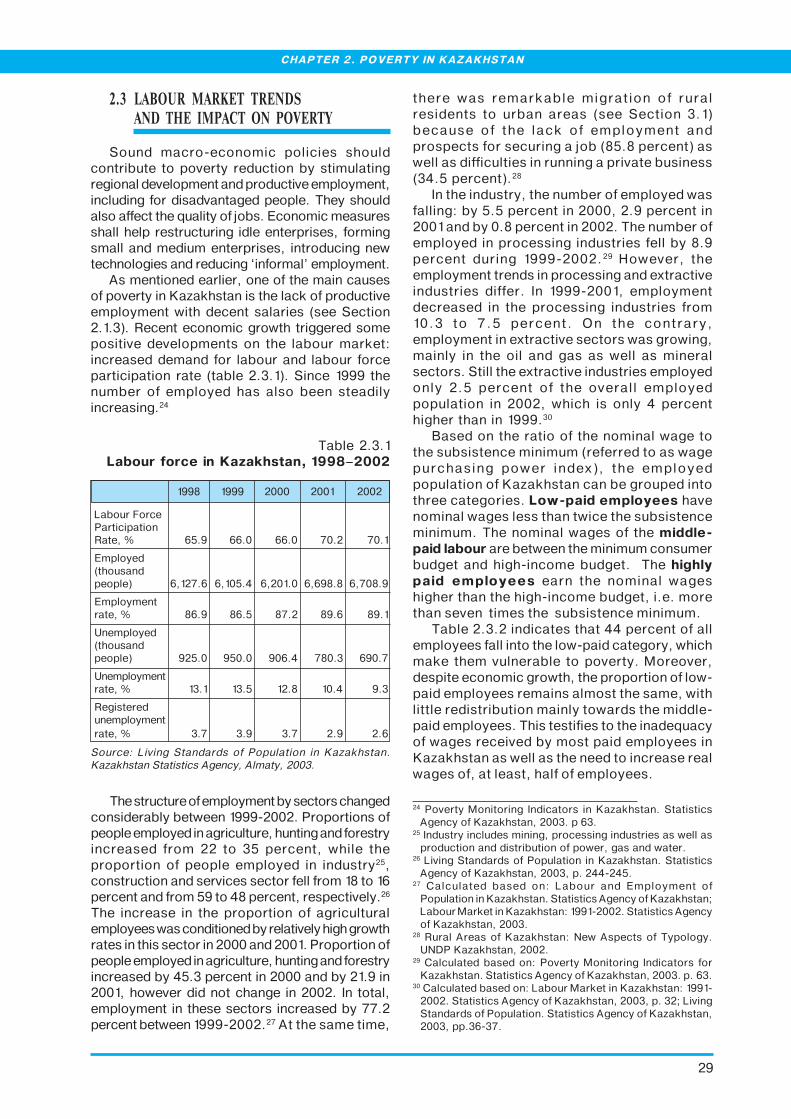
29
2.3 LABOUR MARKET TRENDSAND THE IMPACT ON POVERTY
Sound macro-economic policies shouldcontribute to poverty reduction by stimulatingregional development and productive employment,including for disadvantaged people. They shouldalso affect the quality of jobs. Economic measuresshall help restructuring idle enterprises, formingsmall and medium enterprises, introducing newtechnologies and reducing ‘informal’ employment.
As mentioned earlier, one of the main causesof poverty in Kazakhstan is the lack of productiveemployment with decent salaries (see Section2.1.3). Recent economic growth triggered somepositive developments on the labour market:increased demand for labour and labour forceparticipation rate (table 2.3.1). Since 1999 thenumber of employed has also been steadilyincreasing.24
there was remarkable migration of ruralresidents to urban areas (see Section 3.1)because of the lack of employment andprospects for securing a job (85.8 percent) aswell as difficulties in running a private business(34.5 percent).28
In the industry, the number of employed wasfalling: by 5.5 percent in 2000, 2.9 percent in2001 and by 0.8 percent in 2002. The number ofemployed in processing industries fell by 8.9percent during 1999-2002.29 However, theemployment trends in processing and extractiveindustries differ. In 1999-2001, employmentdecreased in the processing industries from10.3 to 7.5 percent. On the contrary,employment in extractive sectors was growing,mainly in the oil and gas as well as mineralsectors. Still the extractive industries employedonly 2.5 percent of the overall employedpopulation in 2002, which is only 4 percenthigher than in 1999.30
Based on the ratio of the nominal wage tothe subsistence minimum (referred to as wagepurchasing power index), the employedpopulation of Kazakhstan can be grouped intothree categories. Low-paid employees havenominal wages less than twice the subsistenceminimum. The nominal wages of the middle-paid labour are between the minimum consumerbudget and high-income budget. The highlypaid employees earn the nominal wageshigher than the high-income budget, i.e. morethan seven times the subsistence minimum.
Table 2.3.2 indicates that 44 percent of allemployees fall into the low-paid category, whichmake them vulnerable to poverty. Moreover,despite economic growth, the proportion of low-paid employees remains almost the same, withlittle redistribution mainly towards the middle-paid employees. This testifies to the inadequacyof wages received by most paid employees inKazakhstan as well as the need to increase realwages of, at least, half of employees.
The structure of employment by sectors changedconsiderably between 1999-2002. Proportions ofpeople employed in agriculture, hunting and forestryincreased from 22 to 35 percent, while theproportion of people employed in industry25,construction and services sector fell from 18 to 16percent and from 59 to 48 percent, respectively.26
The increase in the proportion of agriculturalemployees was conditioned by relatively high growthrates in this sector in 2000 and 2001. Proportion ofpeople employed in agriculture, hunting and forestryincreased by 45.3 percent in 2000 and by 21.9 in2001, however did not change in 2002. In total,employment in these sectors increased by 77.2percent between 1999-2002.27 At the same time,
Table 2.3.1 Labour force in Kazakhstan, 1998–2002
1998 1999 2000 2001 2002
Labour ForceParticipationRate, % 65.9 66.0 66.0 70.2 70.1
Employed(thousandpeople) 6,127.6 6,105.4 6,201.0 6,698.8 6,708.9
Employmentrate, % 86.9 86.5 87.2 89.6 89.1
Unemployed(thousandpeople) 925.0 950.0 906.4 780.3 690.7
Unemploymentrate, % 13.1 13.5 12.8 10.4 9.3
Registeredunemploymentrate, % 3.7 3.9 3.7 2.9 2.6
Source: Living Standards of Population in Kazakhstan.Kazakhstan Statistics Agency, Almaty, 2003.
24 Poverty Monitoring Indicators in Kazakhstan. StatisticsAgency of Kazakhstan, 2003. p 63.
25 Industry includes mining, processing industries as well asproduction and distribution of power, gas and water.
26 Living Standards of Population in Kazakhstan. StatisticsAgency of Kazakhstan, 2003, p. 244-245.
27 Calculated based on: Labour and Employment ofPopulation in Kazakhstan. Statistics Agency of Kazakhstan;Labour Market in Kazakhstan: 1991-2002. Statistics Agencyof Kazakhstan, 2003.
28 Rural Areas of Kazakhstan: New Aspects of Typology.UNDP Kazakhstan, 2002.
29 Calculated based on: Poverty Monitoring Indicators forKazakhstan. Statistics Agency of Kazakhstan, 2003. p. 63.
30 Calculated based on: Labour Market in Kazakhstan: 1991-2002. Statistics Agency of Kazakhstan, 2003, p. 32; LivingStandards of Population. Statistics Agency of Kazakhstan,2003, pp.36-37.
CHAPTER 2. POVERTY IN KAZAKHSTAN

30
POVERTY IN KAZAKHSTAN: CAUSES AND CURES
Analysis of the wages by sectors points to theexistence of disparities in purchasing power of wagesamong employees (table 2.3.3). Relatively high wageshas been recorded in exterritorial organisations (e.g.diplomatic offices or international organisations),which provide for decent remuneration for qualifiedwork, as in developed countries. The financial sectorcontinues to develop intensively in the context oftransition to a market economy and exhibits highdemand for qualified specialists with decentremunerations. Due to high growth rates, extractiveindustries have also managed to ensure decent salariesfor their employees.
Middle level wages are traditionally paid in suchsectors as construction, transport, communicationsand processing industries. In addition to these, thisgroup contains such market-economy essentials astrade, real estate and various household services.Although salaries in civil service, provision of utilitiesand other services belong to the middle category, theyare at the lower end of this group.
Table 2.3.2Distribution of employees
by wage level, 1999–2002
Categories 1999 2000 2001 2002of employees
Low-paid(wage < minimumconsumer budget), % 45 45 45 44.1
Middle-paid (minimumconsumerbudget < wage < high-income budget), % 44.6 42.9 42.0 42.8
Highly-paid(wage > high-incomebudget), % 10.4 12.1 13 13.1
Calculated based on: Labour and Employment in Kazakhstan.Kazakhstan Statistics Agency, 2003, pp.108-109; LivingStandards of Population in Kazakhstan. Kazakhstan StatisticsAgency, 2003.
Table 2.3.3 Purchasing power of wages by sectors, 1999–2002
Purchasing power of wages (ratio between nominalwages and subsistence minimum)
Sectors
2002200120001999
National average 3.5 3.6 3.8 4.3
A. High
Finance 9.8 9.0 9.1 10.6
Mineral resource industry 7.3 8.0 8.0 8.4
Diplomatic missions, international organisations, etc. 19.9 11.9 16.9 28.6
B. Middle
Construction 4.7 5.2 5.8 6.8
Transport and communication 4.3 4.7 5.3 6.1
Industry as a whole 4.8 5.2 5.2 5.5
includingproduction and distribution of power,gas and water 4.6 4.3 4.4 4.5
processing industry 4.1 4.4 4.3 4.6
Operations with real estate, rent and service deliveryto consumers 3.3 4.2 4.8 6.2
Hotels and restaurants 4.0 4.0 4.7 6.9
Delivery of utilities, social and personal services 3.0 3.2 3.7 4.4
Trade; maintenance of cars, domestic appliances anddurable items 3.2 3.2 3.3 4.0
Civil Service 3.3 2.9 3.3 3.6
C. Low
Education 2.4 2.1 2.2 2.7
Healthcare and social service delivery 2.0 1.8 1.8 2.3
Fishing and fish-breeding 1.7 1.7 1.6 1.8
Agriculture, hunting and forestry 1.4 1.4 1.5 1.7
Calculated based on: Living Standards of Population in Kazakhstan. Kazakhstan Statistics Agency, 2003; Statistical Yearbookfor 2003. Kazakhstan Statistics Agency, 2003.
31
qualified personnel and indicates disproportions inthe final use of GDP and the state budgetresources.
The low wages paid in education, healthcareand social security, as well as agriculture, testifiesto the unattractiveness of these vital sectors to
The employment structure is conditioned byavailability of jobs in the economy as well asremuneration levels. The structure of youthemployment is particularly important as it reflectsfuture labour market trends and may lead topersistent poverty in the future.
In 2002 the proportion of young workers (agedunder 25) was 18.8 percent in agriculture and 8.1percent in industry, with the first percentagehigher and the second lower than the share ofemployees in those sectors of the total employedpopulation. The high proportion of youth enteringthe agricultural labour market for the first time hasto a large extent been caused by the difficultiesrural youth experience when trying to obtain a jobelsewhere. Low wages in industry make themunattractive for urban population (especiallyyouth) first entering the labour market. Youngpeople rather look for highly-paid occupations.This resulted in a higher proportion of youth under
Box 2.3.1 Extract from the Law on ‘Labour in Kazakhstan’
���������������������
��9�������������������#���������������%�#������������
���6�������#���������#�����������#���������������������#��������#�����#������������������������������#�����#�
���������#����������������+������#��������������������������������
/��D����#�����������������4����������������������� �������#�����#��#����������������������������������
���#���������������,����������.������� ��������������������������������������#�����������#��������� �������
��� ����������
+��A ���� �������������������������������������������� ���������.��������.������� �������4������������
�������#����������������� ��������
����������������������
���6������.����������������������#����,"��������������.�
������������������������
��E���#������.����������������������#�������#�������������� �������<
�)�F���� ���������������������������,�����%�'���� ����������,��������������.$����������������
���%�������>���� ���������/%��������������.$
�)�F������.����� ���������������� �������������������.���������� �����������#����������>���� ���
�����/%��������������.�
���������������� ������ ���������
A ���������������������+'�������.�������.��������������'�����G�1���������������������������������������
#����������������.���+'�������.�������.���������������������%'�������.�������.��������������'�����������
��������!����������������
/��������������������������������������#���������������������������� ��������������������������������������
��������� ��������������#� �����
��������������
6���� ��������������������� ������������� �������������������������#����������������������� ��� �
�����������������������������������7�8�.������
25 employed in trade (15.7 percent), real estate (11.6percent) and provision of household services (13.8percent).31
Low incomes in the ‘formal’ economy havestimulated the population to expand and diversifytheir sources of livelihood.32 As a result, in 2001,over 20 percent of full-time employees workedmore than the legally permitted 40 hours per weekmaximum. Over 726,000 people (10.8 percent ofthose employed) had another part-time job. Theaverage duration of the working week of additionalpart-time work was 12.2 hours. In addition, basedon expert assessments, informal part-timeemployment exists on a very large scale.
31 Labour Market in Kazakhstan: 1991-2002. StatisticsAgency of Kazakhstan, 2003.
32 Main Indicators of the Labour Market of Kazakhstan in2002. Statistics Agency of Kazakhstan, 2002, p.74-95.
CHAPTER 2. POVERTY IN KAZAKHSTAN
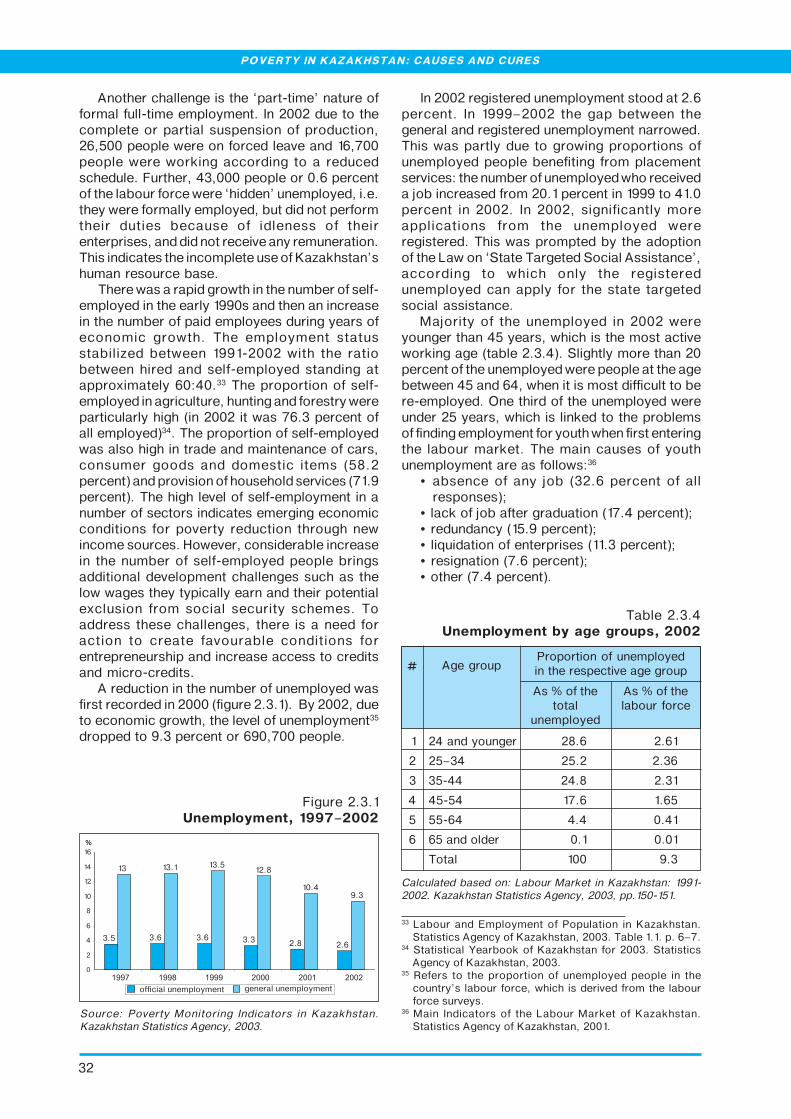
32
POVERTY IN KAZAKHSTAN: CAUSES AND CURES
Another challenge is the ‘part-time’ nature offormal full-time employment. In 2002 due to thecomplete or partial suspension of production,26,500 people were on forced leave and 16,700people were working according to a reducedschedule. Further, 43,000 people or 0.6 percentof the labour force were ‘hidden’ unemployed, i.e.they were formally employed, but did not performtheir duties because of idleness of theirenterprises, and did not receive any remuneration.This indicates the incomplete use of Kazakhstan’shuman resource base.
There was a rapid growth in the number of self-employed in the early 1990s and then an increasein the number of paid employees during years ofeconomic growth. The employment statusstabilized between 1991-2002 with the ratiobetween hired and self-employed standing atapproximately 60:40.33 The proportion of self-employed in agriculture, hunting and forestry wereparticularly high (in 2002 it was 76.3 percent ofall employed)34. The proportion of self-employedwas also high in trade and maintenance of cars,consumer goods and domestic items (58.2percent) and provision of household services (71.9percent). The high level of self-employment in anumber of sectors indicates emerging economicconditions for poverty reduction through newincome sources. However, considerable increasein the number of self-employed people bringsadditional development challenges such as thelow wages they typically earn and their potentialexclusion from social security schemes. Toaddress these challenges, there is a need foraction to create favourable conditions forentrepreneurship and increase access to creditsand micro-credits.
A reduction in the number of unemployed wasfirst recorded in 2000 (figure 2.3.1). By 2002, dueto economic growth, the level of unemployment35
dropped to 9.3 percent or 690,700 people.
In 2002 registered unemployment stood at 2.6percent. In 1999–2002 the gap between thegeneral and registered unemployment narrowed.This was partly due to growing proportions ofunemployed people benefiting from placementservices: the number of unemployed who receiveda job increased from 20.1 percent in 1999 to 41.0percent in 2002. In 2002, significantly moreapplications from the unemployed wereregistered. This was prompted by the adoptionof the Law on ‘State Targeted Social Assistance’,according to which only the registeredunemployed can apply for the state targetedsocial assistance.
Majority of the unemployed in 2002 wereyounger than 45 years, which is the most activeworking age (table 2.3.4). Slightly more than 20percent of the unemployed were people at the agebetween 45 and 64, when it is most difficult to bere-employed. One third of the unemployed wereunder 25 years, which is linked to the problemsof finding employment for youth when first enteringthe labour market. The main causes of youthunemployment are as follows:36
• absence of any job (32.6 percent of allresponses);
• lack of job after graduation (17.4 percent);• redundancy (15.9 percent);• liquidation of enterprises (11.3 percent);• resignation (7.6 percent);• other (7.4 percent).
Figure 2.3.1Unemployment, 1997–2002
Source: Poverty Monitoring Indicators in Kazakhstan.Kazakhstan Statistics Agency, 2003.
1 24 and younger 28.6 2.61
2 25–34 25.2 2.36
3 35-44 24.8 2.31
4 45-54 17.6 1.65
5 55-64 4.4 0.41
6 65 and older 0.1 0.01
Total 100 9.3
Calculated based on: Labour Market in Kazakhstan: 1991-2002. Kazakhstan Statistics Agency, 2003, pp.150-151.
Table 2.3.4Unemployment by age groups, 2002
# Age groupProportion of unemployedin the respective age group
As % of thetotal
unemployed
As % of thelabour force
33 Labour and Employment of Population in Kazakhstan.Statistics Agency of Kazakhstan, 2003. Table 1.1. p. 6–7.
34 Statistical Yearbook of Kazakhstan for 2003. StatisticsAgency of Kazakhstan, 2003.
35 Refers to the proportion of unemployed people in thecountry’s labour force, which is derived from the labourforce surveys.
36 Main Indicators of the Labour Market of Kazakhstan.Statistics Agency of Kazakhstan, 2001.

33
Gender analysis of unemployment shows thatfemale unemployment is higher than maleunemployment (figure 2.3.2). However, between1997-2002, growing male unemployment andfalling female unemployment were observed,which resulted in the reduced gap between them.In 2002 however women unemployment grew andunemployment among men decreased unlike thetrends in previous years (figure 2.3.2, see alsoSection 2.8). The gap between rural and urbanunemployment significantly widened in 2001 and2002 (figure 3.1.4). At the same time, in 2001 and2002 rural unemployment decreased and becamelower than in urban areas. Unemployment ratevaries among regions, in 2002 from 7.3 to 12.5percent (figure 2.3.4).
The problem of long-term unemployment hasbecome serious: its level reached 6 percent in2002.37 Over three quarters of all unemployedpeople are affected by long-term unemployment:68.5 percent of the overall unemployed were job-hunting for over a year.38 Of these, 19.3 percentwere looking for a job for 5 or more years and20.8 percent had never had employment.Unemployment trends in other transitioneconomies confirm that unemployment growsrapidly during economic recession, however itdeclines only slowly as economic situationimproves. To resolve this problem, specialattention should be paid to professional retrainingas well as counselling and other support providedby the state to the long term unemployed.
In sum, the situation on the labour market ofKazakhstan remains tense and in fact createsconditions conducive for poverty. Recenteconomic growth was primarily led bydevelopment of the extractive sectors (oil, gas andminerals), which did not generate muchemployment opportunities. Majority of employeescontinue earning low salaries and wages, whichdo not provide for decent standard of living. It islinked to lack of productive employment, gaps inlabour legislation as well as insufficient role oftrade-unions. Low remuneration levels in thesocial sectors are of particular concern, as itreflects low public investments in human capitaland make these vital sectors of economyunattractive for qualified specialists. Long-termunemployment may also lead to persistentpoverty in future. Hence, poverty reductionrequires diversification of the national economyand accelerated economic growth in processingindustries and other sectors producing goods andservices for people to provide decent income andemployment for the majority of population.
Figure 2.3.2Unemployment by gender, 1997–2002
Source: Women and Men of Kazakhstan. Statistics Agencyof Kazakhstan, 2003.
Source: Poverty Monitoring Indicators in Kazakhstan.Kazakhstan Statistics Agency, 2003.
Figure 2.3.3Unemployment by regions, 2002
2.4 EDUCATION AS A FACTOR OF POVERTYREDUCTION
Education has a clear and comprehensiveeffect on quality of life. A higher education level ina country - with other factors being equal - shouldlead to higher labour productivity, increased GDPand reduced poverty. Good quality educationprovides opportunities for people to realise their
37 Living Standards of Population in Kazakhstan. StatisticsAgency of Kazakhstan, 2003. p.36.
38 Calculated based on: Labour Market in Kazakhstan: 1991-2002. Statistics Agency of Kazakhstan, 2003, p.156.
CHAPTER 2. POVERTY IN KAZAKHSTAN

34
POVERTY IN KAZAKHSTAN: CAUSES AND CURES
capabilities more fully, promoting betterprospects for employment, better financialposition and reducing the risk of poverty. TheUnited Nations highlights the importance ofuniversal primary education. In countries with lowdevelopment levels primary education alone issufficient for considerable improvement in thelives of the poor. Educated people have higherlabour productivity, are more capable of learningnew skills and, as a result, are at a less risk offalling into poverty.
Kazakhstan has nearly achieved the goal ofuniversal primary education (see Section 1.4). Bythe end of the 1990s, the net primary enrolmentindex was 99.5 percent, including 98.8 percent ofboys and 99.1 percent of girls. Almost all thepopulation (99.9 percent) aged 15-24 wereliterate. However, quality of education remains aproblem, and incomplete enrolments in school areemerging.39
Pre-school enrolment fell by 3 times in the 1990s.In 2000 approximately 8 percent of Kazakhstan’s15-year-olds, 5 percent of 16-year-olds and 7percent of 17-year-olds did not have generalsecondary education and were not enrolled in anyschooling. About a half of rural schools providedonly primary and incomplete secondary education,hence higher numbers of rural children were notreceiving general secondary education. The rangeof programmes in vocational schools is mainlyoriented to the needs of the labour market in theindustrial and urban context, and this reducesaccess to this type of education for rural people. Thelack of evening courses at vocational and highereducation levels limits access of poor people toeducation. Further, insufficient public spending oneducation limits its affordability and availability forthe poor.40
Experts have also identified other problems
in the field of education. Children from big citiesrather than those from rural areas and smallcities, children from rich rather than poorfamilies have more opportunities to receivequality education, with orphaned and lesshealthy children being in the least fortunatesituation. Children’s education depends moreand more on their parents’ financialcapabilities. The number of understaffed ruralschools has been increasing from year to year:teachers are forced to teach subjects notconnected to their educational background. Theproportion of such schools, in the overallnumber, rose by 6.7 percent in 1998-2002.41
Due to unstable financial position,unemployment and forced migration manyfamilies had to cut back on their children’seducation. Inadequate education, as perceivedby people, is one of the poverty causes (table2.1.7). Some 60 percent of respondentsmentioned the inability of their children tofurther their education after finishing secondaryschool. Of these, 76 percent mentioned lack ofmoney to pay for education as the main reasonfor this.42
During 1999–2002 the proportion of peoplewith vocational and higher education among theemployed rose by 8 percent and amounted to 60.7percent in 2002.43 The most significant increasewas observed in 2002 (by 6.7 percent). Amongthe unemployed the proportion of people withhigher and incomplete higher education was 12.2percent, with 38.1 percent having vocationaleducation and 49.7 percent without vocational orhigher education.44 The well-being of householdshas direct links to the educational levels of theirmembers. The average per capita incomesincrease as the educational level of peopleincreases. For example, in 2001 and 2002
Box 2.4.1 Extract from the Law on ‘Education in Kazakhstan’
����������"�����������������#�������$��%������������������
���6��������������������#���8�������7�8�.��������������������������������������#���������������#���#�������
���#�������6��������������������������������������������#����������������������#�������������#�����������#�������
�������������������������#� ������������������������������������������������#������������#�����������#���8����������
�������� ��
�������&���'������ ���������
��-�#����������#���������������������������#���8�������7�8�.�������������������������'��'#��������������'���
���#����������������������-�#����������#���������#� ��������
39 Conference on Poverty Reduction. Ministry of Economy and Trade/UNDP Kazakhstan, 2002. p. 49, 63–65, 83 and others.40 Yu.K. Shokamanov. Human Development Trends in Kazakhstan, Almaty 2001. p. 172–214.41 Conference on Poverty Reduction Conference. Ministry of Economy and Trade of Kazakhstan/UNDP. 2002.42 Survey of poor households ‘Causes and Conditions of Poverty’. Statistics Agency of Kazakhstan, 2002.43 Education in Kazakhstan. Kazakhstan Statistics Agency, 2002. p. 23, 26; Labour Market in Kazakhstan: 1991-2002. Statistics
Agency of Kazakhstan, 2003, pp. 39-40.44 Education in Kazakhstan. Statistics Agency of Kazakhstan, 2002. p. 23, 26; Labour Market in Kazakhstan: 1991-2002.
Statistics Agency of Kazakhstan, p. 153.
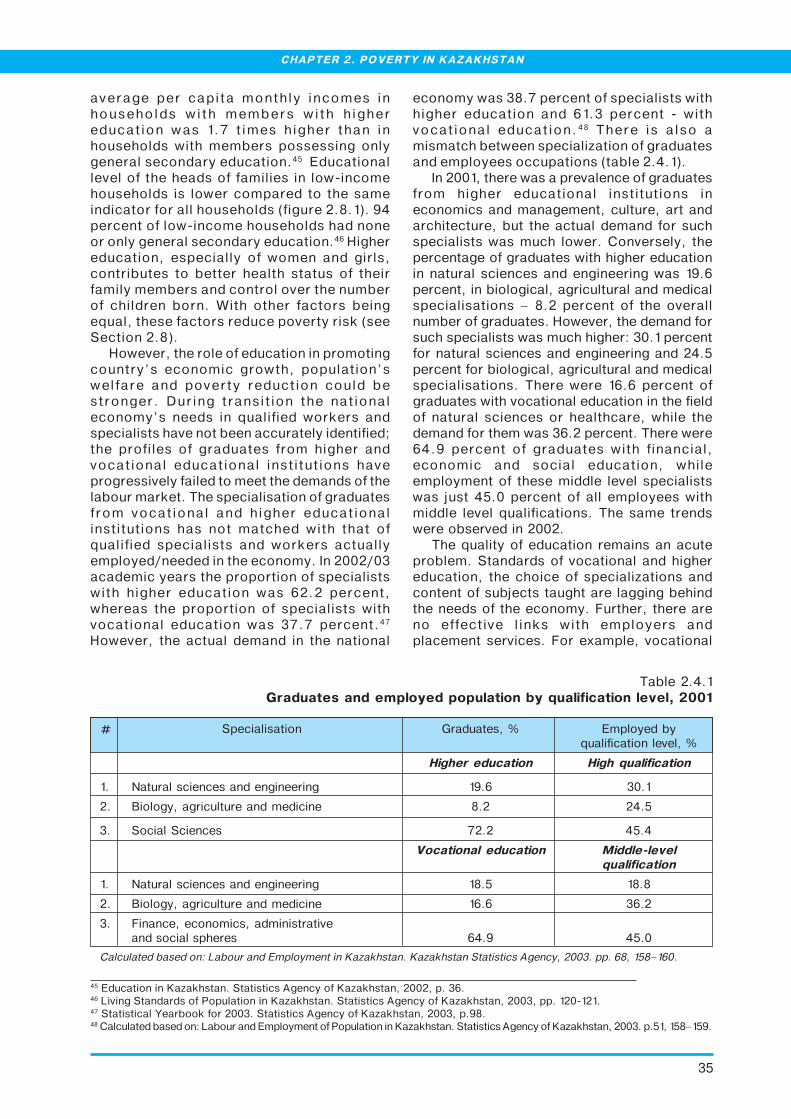
35
average per capita monthly incomes inhouseholds with members with highereducation was 1.7 t imes higher than inhouseholds with members possessing onlygeneral secondary education.45 Educationallevel of the heads of families in low-incomehouseholds is lower compared to the sameindicator for all households (figure 2.8.1). 94percent of low-income households had noneor only general secondary education.46 Highereducation, especially of women and girls,contributes to better health status of theirfamily members and control over the numberof children born. With other factors beingequal, these factors reduce poverty risk (seeSection 2.8).
However, the role of education in promotingcountry’s economic growth, population’swelfare and poverty reduction could bestronger. During transition the nationaleconomy’s needs in qualified workers andspecialists have not been accurately identified;the profiles of graduates from higher andvocational educational institutions haveprogressively failed to meet the demands of thelabour market. The specialisation of graduatesfrom vocational and higher educationalinstitutions has not matched with that ofqualified specialists and workers actuallyemployed/needed in the economy. In 2002/03academic years the proportion of specialistswith higher education was 62.2 percent,whereas the proportion of specialists withvocational education was 37.7 percent.47
However, the actual demand in the national
economy was 38.7 percent of specialists withhigher education and 61.3 percent - withvocational education.48 There is also amismatch between specialization of graduatesand employees occupations (table 2.4.1).
In 2001, there was a prevalence of graduatesfrom higher educational institutions ineconomics and management, culture, art andarchitecture, but the actual demand for suchspecialists was much lower. Conversely, thepercentage of graduates with higher educationin natural sciences and engineering was 19.6percent, in biological, agricultural and medicalspecialisations – 8.2 percent of the overallnumber of graduates. However, the demand forsuch specialists was much higher: 30.1 percentfor natural sciences and engineering and 24.5percent for biological, agricultural and medicalspecialisations. There were 16.6 percent ofgraduates with vocational education in the fieldof natural sciences or healthcare, while thedemand for them was 36.2 percent. There were64.9 percent of graduates with financial,economic and social education, whileemployment of these middle level specialistswas just 45.0 percent of all employees withmiddle level qualifications. The same trendswere observed in 2002.
The quality of education remains an acuteproblem. Standards of vocational and highereducation, the choice of specializations andcontent of subjects taught are lagging behindthe needs of the economy. Further, there areno effective links with employers andplacement services. For example, vocational
Table 2.4.1Graduates and employed population by qualification level, 2001
# Specialisation Graduates, % Employed byqualification level, %
Higher education High qualification
1. Natural sciences and engineering 19.6 30.1
2. Biology, agriculture and medicine 8.2 24.5
3. Social Sciences 72.2 45.4
Vocational education Middle-levelqualification
1. Natural sciences and engineering 18.5 18.8
2. Biology, agriculture and medicine 16.6 36.2
3. Finance, economics, administrativeand social spheres 64.9 45.0
Calculated based on: Labour and Employment in Kazakhstan. Kazakhstan Statistics Agency, 2003. pp. 68, 158–160.
45 Education in Kazakhstan. Statistics Agency of Kazakhstan, 2002, p. 36.46 Living Standards of Population in Kazakhstan. Statistics Agency of Kazakhstan, 2003, pp. 120-121.47 Statistical Yearbook for 2003. Statistics Agency of Kazakhstan, 2003, p.98.48 Calculated based on: Labour and Employment of Population in Kazakhstan. Statistics Agency of Kazakhstan, 2003. p.51, 158–159.
CHAPTER 2. POVERTY IN KAZAKHSTAN

36
POVERTY IN KAZAKHSTAN: CAUSES AND CURES
programmes fail to meet the demand for qualifiedworkers. As a result the labour market is notsupplied with qualified staff, whereas there aremany unemployed young people. Employersthemselves don’t invest sufficiently in theiremployees’ on-the-job or other kinds of training.Private educational institutions, which providedtraining for over 32.6 percent of vocationalstudents and 43 percent of higher educationstudents in the 2002/2003 academic year,49
respond to labour market requirements andchanging economic conditions in a more flexibleway. However, these institutions experience problemof under-staffing: they often have an unjustifiednumber of teachers holding a job elsewhere andthose paid hourly.
During 1991-2002 public expenditure oneducation fell from 6.5 to 3.2 percent of GDP.50 Tocompare, in the mid-90s the expenditure oneducation was 3.4 percent of GDP in low-incomecountries, 4.4 percent in middle-income countriesand 5.6 percent in high-income countries.51 Thislow level of investment in the education sectornegatively affected both the ability of Kazakhstan’spopulation to adjust to the emerging marketeconomy, and their standards of living. At the sametime, personal investments in education hasincreased, prompted by growing understanding ofthe role of education in provision of personal well-being. From 1999/2000 to 2002/2003 academicyears, the percentage of students receiving paid-for higher education increased from 23.1 to 32.6percent.52 The percentage of students receivingpaid-for vocational education (in colleges) was 76percent of the total number of students, while inhigher education as many as 77 percent of thestudents were paying tuition fees.53
Examples from more developed countries showthat education positively affects the economicdevelopment of a country and people’s well-being.Better-educated and qualified people have higherliving standards. With other factors being equal,
specialists with higher qualifications should earnincomes above the high-income budget and belongto the richer social strata.54 Incomes of qualifiedworkers should provide for middle-level standardof living. Being employed and simultaneouslybelonging to low-income and poor social groups,with other factors being equal, can be explainedby lack of education and/or low qualifications.55
The living standards of Kazakhstani employeeswith different education levels and qualificationswere assessed, also by sectors and occupations,and summarised in the Table 2.4.2.56
The table indicates that not in all sectors ofKazakhstan’s economy do wage incomes providefor high consumer standards of living forspecialists with high qualification levels. In miningand processing industries, construction, trade,transport and communications, banking and realestate highly qualified specialists with highereducation earn high incomes that allow them tohave the advanced level of consumption.However, highly qualified specialists with highereducation employed in agriculture, publicadministration, education and healthcare belongto the middle-income social group; hence they donot receive decent remuneration for their highlyqualified services.
Qualified workers employed in different sectorsof the economy belong to different social stratadefined based on their standard of living. In miningand real estate remuneration of qualified workers isthe highest, which allows for the advanced level ofconsumption. In processing industries,construction, trade, transport and communications,banking and civil service, qualified workers havemiddle-level incomes. In agriculture, education andhealthcare sectors incomes of qualified workers do
49 Calculated based on: Statistical Yearbook of Kazakhstanfor 2003. Statistics Agency of Kazakhstan, 2003, p.98.
50 Poverty Monitoring Indicators in Kazakhstan. StatisticsAgency of Kazakhstan, 2003. p. 60.
51 Russia and the World. V.S. Avtonomov and T.P. Subbotina,eds. St Petersburg, Economic School Publishing Agency,1999. p.33.
52 Calculated based on: Statistical Yearbook for Kazakhstan.Statistics Agency of Kazakhstan, 2003, p.98.
53 Calculated based on: Education in Kazakhstan. StatisticsAgency of Kazakhstan, 2002. p. 87–113.
54 According to estimates of the Russian Centre for LivingStandards.
55 Certainly, the level of incomes is affected by both educationand qualification as well as a number of other factors suchas differences in labour demand and supply, economiccapacities of employers, individual capabilities ofemployees and other. Experts underline that highereducation and qualification could provide for a life of higherconsumer standard. This does not mean that consumerstandards are not affected by other factors, which need tobe taken into account when assessing actual consumerstandards of the employed population.
56 Workers, grouped by their qualifications, do not alwayscorrespond to differences in their formal education level.However, normally this correlation is prevalent andreinforced when workers with higher qualification obtaininformal education.
Library in Milisay village, Zhangeldy rayon,Kostanay oblast
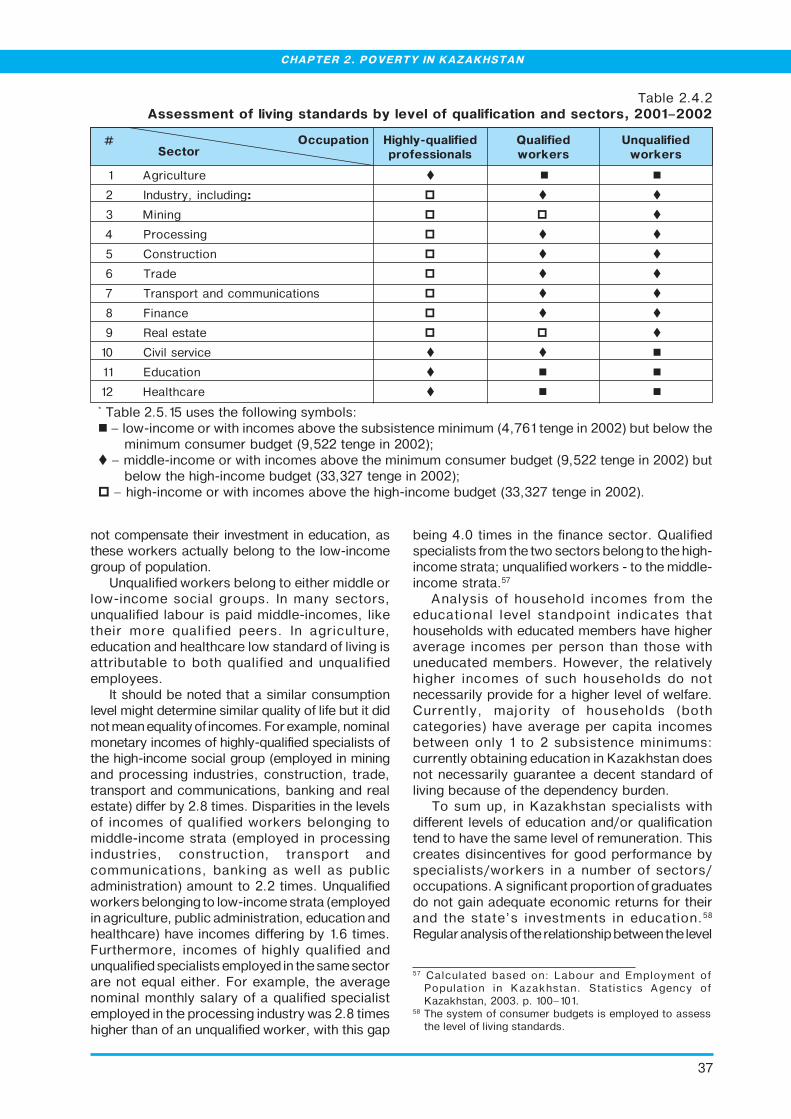
37
not compensate their investment in education, asthese workers actually belong to the low-incomegroup of population.
Unqualified workers belong to either middle orlow-income social groups. In many sectors,unqualified labour is paid middle-incomes, liketheir more qualified peers. In agriculture,education and healthcare low standard of living isattributable to both qualified and unqualifiedemployees.
It should be noted that a similar consumptionlevel might determine similar quality of life but it didnot mean equality of incomes. For example, nominalmonetary incomes of highly-qualified specialists ofthe high-income social group (employed in miningand processing industries, construction, trade,transport and communications, banking and realestate) differ by 2.8 times. Disparities in the levelsof incomes of qualified workers belonging tomiddle-income strata (employed in processingindustries, construction, transport andcommunications, banking as well as publicadministration) amount to 2.2 times. Unqualifiedworkers belonging to low-income strata (employedin agriculture, public administration, education andhealthcare) have incomes differing by 1.6 times.Furthermore, incomes of highly qualified andunqualified specialists employed in the same sectorare not equal either. For example, the averagenominal monthly salary of a qualified specialistemployed in the processing industry was 2.8 timeshigher than of an unqualified worker, with this gap
being 4.0 times in the finance sector. Qualifiedspecialists from the two sectors belong to the high-income strata; unqualified workers - to the middle-income strata.57
Analysis of household incomes from theeducational level standpoint indicates thathouseholds with educated members have higheraverage incomes per person than those withuneducated members. However, the relativelyhigher incomes of such households do notnecessarily provide for a higher level of welfare.Currently, majority of households (bothcategories) have average per capita incomesbetween only 1 to 2 subsistence minimums:currently obtaining education in Kazakhstan doesnot necessarily guarantee a decent standard ofliving because of the dependency burden.
To sum up, in Kazakhstan specialists withdifferent levels of education and/or qualificationtend to have the same level of remuneration. Thiscreates disincentives for good performance byspecialists/workers in a number of sectors/occupations. A significant proportion of graduatesdo not gain adequate economic returns for theirand the state’s investments in education.58
Regular analysis of the relationship between the level
1 Agriculture � � �
2 Industry, including: � � �
3 Mining � � �
4 Processing � � �
5 Construction � � �
6 Trade � � �
7 Transport and communications � � �
8 Finance � � �
9 Real estate � � �
10 Civil service � � �
11 Education � � �
12 Healthcare � � �
* Table 2.5.15 uses the following symbols:� – low-income or with incomes above the subsistence minimum (4,761 tenge in 2002) but below the
minimum consumer budget (9,522 tenge in 2002);� – middle-income or with incomes above the minimum consumer budget (9,522 tenge in 2002) but
below the high-income budget (33,327 tenge in 2002);� – high-income or with incomes above the high-income budget (33,327 tenge in 2002).
Table 2.4.2Assessment of living standards by level of qualification and sectors, 2001–2002
Unqualifiedworkers
Qualifiedworkers
Highly-qualifiedprofessionals
Occupation#Sector
57 Calculated based on: Labour and Employment ofPopulation in Kazakhstan. Statistics Agency ofKazakhstan, 2003. p. 100–101.
58 The system of consumer budgets is employed to assessthe level of living standards.
CHAPTER 2. POVERTY IN KAZAKHSTAN
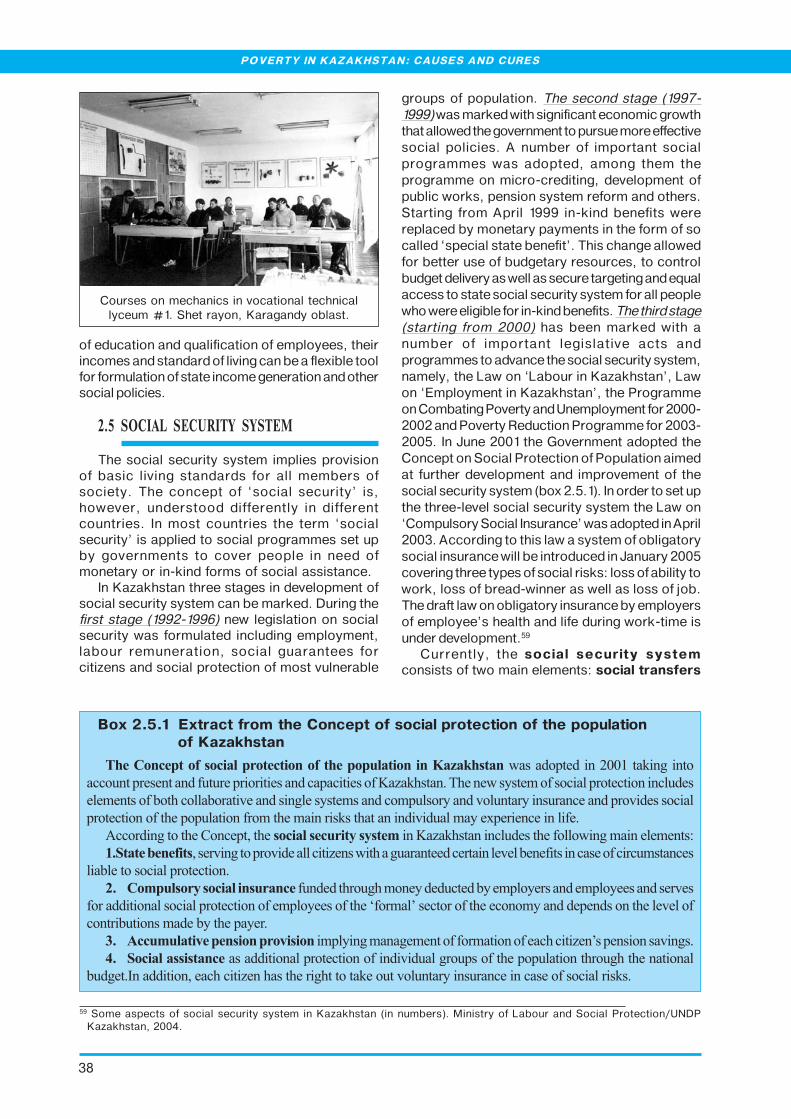
38
POVERTY IN KAZAKHSTAN: CAUSES AND CURES
of education and qualification of employees, theirincomes and standard of living can be a flexible toolfor formulation of state income generation and othersocial policies.
2.5 SOCIAL SECURITY SYSTEM
The social security system implies provisionof basic living standards for all members ofsociety. The concept of ‘social security’ is,however, understood differently in differentcountries. In most countries the term ‘socialsecurity’ is applied to social programmes set upby governments to cover people in need ofmonetary or in-kind forms of social assistance.
In Kazakhstan three stages in development ofsocial security system can be marked. During thefirst stage (1992-1996) new legislation on socialsecurity was formulated including employment,labour remuneration, social guarantees forcitizens and social protection of most vulnerable
groups of population. The second stage (1997-1999) was marked with significant economic growththat allowed the government to pursue more effectivesocial policies. A number of important socialprogrammes was adopted, among them theprogramme on micro-crediting, development ofpublic works, pension system reform and others.Starting from April 1999 in-kind benefits werereplaced by monetary payments in the form of socalled ‘special state benefit’. This change allowedfor better use of budgetary resources, to controlbudget delivery as well as secure targeting and equalaccess to state social security system for all peoplewho were eligible for in-kind benefits. The third stage(starting from 2000) has been marked with anumber of important legislative acts andprogrammes to advance the social security system,namely, the Law on ‘Labour in Kazakhstan’, Lawon ‘Employment in Kazakhstan’, the Programmeon Combating Poverty and Unemployment for 2000-2002 and Poverty Reduction Programme for 2003-2005. In June 2001 the Government adopted theConcept on Social Protection of Population aimedat further development and improvement of thesocial security system (box 2.5.1). In order to set upthe three-level social security system the Law on‘Compulsory Social Insurance’ was adopted in April2003. According to this law a system of obligatorysocial insurance will be introduced in January 2005covering three types of social risks: loss of ability towork, loss of bread-winner as well as loss of job.The draft law on obligatory insurance by employersof employee’s health and life during work-time isunder development.59
Currently, the social security systemconsists of two main elements: social transfers
Box 2.5.1 Extract from the Concept of social protection of the populationof Kazakhstan
(��)�������#�������������������#������������������*�$������������������������""���.��������
�##���������������������������������������#���#���������7�8�.�������6������������ ������#���������#�������#�����
��� �������������#����������������������������� ������#� �����������������������������#�����������������#���
�����#�������������������������� ����� �������.��������������������� �����������#����������
�##��������������@��#��������������������� �� �������7�8�.��������#�������������������� ������� ����<
��'����+�#���������������������������#���8����������������������#�������������������������#�������#��#� ����#��
������������#���������#�����
&� )�������� �������������������������������� ���������#�������� ������������� ������������������
�����������������#���������#��������� ���������������C��� ��&���#������������#��� �����������������������������
#������������� �����������������
,� ���������������������������� ������� ����� ���������� �����������#��#���8��&������������������
�� '�����������������������������������#����������������������������������������������������������������
�������1�������������#��#���8����������������������.�����������������������#�����#���������#�������.��
Courses on mechanics in vocational technicallyceum #1. Shet rayon, Karagandy oblast.
59 Some aspects of social security system in Kazakhstan (in numbers). Ministry of Labour and Social Protection/UNDPKazakhstan, 2004.

39
(box 2.5.2), including pensions, categorical statebenefits, targeted social assistance, housingallowance, one-time payments for childbirth, andsocial services such as provision of prosthetic andorthopaedic equipment, special medical and socialfacilities, providing social care at home as well asother types of social services.
Kazakhstan is the first CIS countryimplementing accumulative pension system.Along with this reform a number of measures wereimplemented to increase pensions paid under thecollaborative pension system. In 2002 1,749 100people received pensions, 97.5 percent of whichwere pensioners by age and 2.5 percent receivedpensions for long service.60 Average pensions in2000-2002 did not exceed subsistence minimum(table 2.5.1). Starting from January 2003 pensionswere increased by 12 percent, almost 1 millionpensioners were receiving pensions equal to5,000-6,000 tenge. However, taking into accountgrowth rates of the consumer price index, majorityof them remained in poverty.61 Starting from June2003 pensions were increased again, this timebased on labour contribution of pensioners. Theminimum pension was increased from 5,000 to5,500 tenge. As a result, the number of pensionerswho received pensions equal to 5,000-6,000tenge reduced two times, average pension sizeincreased by 23.4 percent, and the number ofpensioners receiving pensions in amount of 6,600to 12,000 tenge almost doubled. It is expected thatin 2004 the minimum pensions will be increasedto 6,600 tenge.62
In 2002 there were 453,400 disabled peoplein the country, of which nearly 48,000 werechildren. In December 2001 the Programme onRehabilitation of Disabled for 2003-2005 as wellas draft Law on ‘Social Protection of Disabled inKazakhstan’ were adopted. They aimed at furtherimprovement of medical and social assessmentand rehabilitation of disabled people,development of better prosthetic and orthopaedicequipment system, development of socialservices for rehabilitation and integration of thedisabled in the society.
Starting from January 1, 2003 one-timechildbirth benefits equal to 15 monthly unit rates63
were introduced. This benefit is not dependant onthe income of the family. Along with one-timechildbirth benefits further measures on socialsupport of motherhood and childhood will be
60 Statistical Yearbook for 2003. Statistics Agency of Kazakhstan, 2003, p.73.61 Some Aspects of Social Security System in Kazakhstan. Ministry of Labour and Social Protection/UNDP Kazakhstan,
2004.62 Ibid.63 Monthly unit rate (MUR) is an interim social indicator, which is used to calculate social benefits/payments in Kazakhstan.
It was introduced by Government and in 2003 was equal to 872 tenge.64 Some Aspects of Social Security System in Kazakhstan. Ministry of Labour and Social Protection/UNDP Kazakhstan,
2004.
implemented by introduction of additional childallowances in future. Elaboration of draft Law on‘State Benefits to Mother and Child’ is expected.
A housing allowance is paid to provide financialsupport to low-income citizens to cover theirhousing expenses as well as expenditures onutilities. In 2003 1.6 billion tenge was provided forhousing assistance.64
Despite positive changes in the social securitysystem of Kazakhstan, sizes of the state benefitsremain low (table 2.5.1). For instance, the averageamount of state targeted social assistance wasequal to 998 tenge (or 6.5 USD by officialexchange rate) per each family member in 2002.The assistance was granted to 1,137 millionpeople in 2002.
Table 2.5.1 Social transfers, 2000–2002
Social transfers, 2000 2001 2002tenge
SubsistenceMinimum 4,007 4,596 4,761
Pensions, including 4,462 4,947 5,818
By age (civilpopulation) 4,298 4,773 5,655
Full retirementpensions 4,333 4,807 5,695
Early retirementpensions 2,653 2,980 3,509
Long service (militarypopulation) 11,229 11,829 12,102
Recipients of statesocial benefits,including 3,451 3,630 4,095
(i) Civil population
Old age 2,175 2,325 2,469
Disability 2,990 3,153 3,774
Loss ofbreadwinner 4,144 4,371 4,631
(ii) Military structures
Disability 10,165 9,722 9,740
Loss ofbreadwinner 6,079 6,043 6,018
Source: Living Standards of Population in Kazakhstan.Kazakhstan Statistics Agency, 2003.
CHAPTER 2. POVERTY IN KAZAKHSTAN
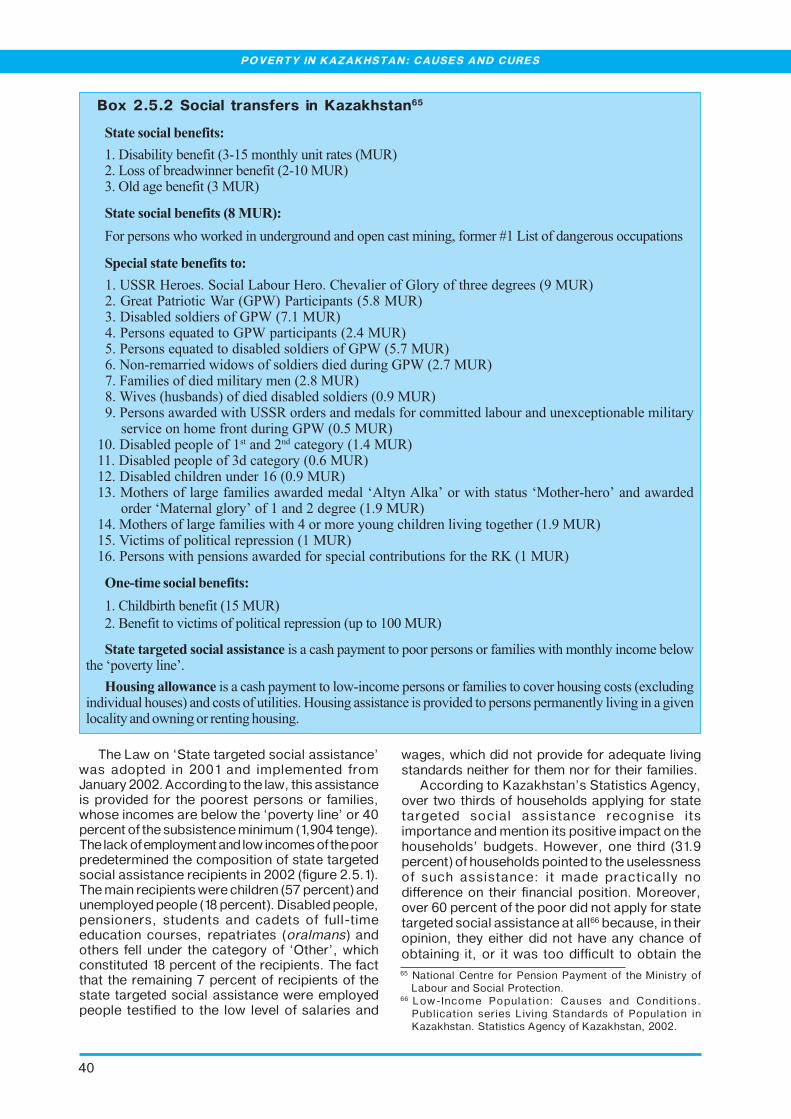
40
POVERTY IN KAZAKHSTAN: CAUSES AND CURES
Box 2.5.2 Social transfers in Kazakhstan65
'�����������+�#���-
��5������������������(/'+� ������������������(H:E)���B���������������������������(�'"�H:E)/��0���������������(/�H:E)
'�����������+�#����./�0123-
F������������������.���������������������������#���� ��������� ���I�B������������������##��������
'�����������+�#������-
��:--E�2�������-�#����B������2�����@�����������������������������������(!�H:E)���������9�������#�D���(�9D)�9����#�������(+���H:E)/��5���������������������9D�( ��H:E),��9��������*����������9D������#�������(��,�H:E)+��9��������*�������������������������������9D�(+� �H:E)%��;��'�� ���������������������������������������9D�(�� �H:E) ��F� �������������� �������� ���(����H:E)���D�����(��������)���������������������������("�!�H:E)!��9��������������������:--E������������ ����������#� ���������������������#����������� �������
�����#������� ����������������9D�("�+�H:E)"��5�����������������������������#��������(�,�H:E)��5������������������/��#��������("�%�H:E)���5��������#��������������%�("�!�H:E)/��H������������������ �������������� �����C��������.�&����������������CH�����'����&������������
������CH�������������&������������������(�!�H:E),��H������������������ �����������,���� ����������#������������������������(�!�H:E)+��3�#�� �����������#��������������(�H:E)%��9������������������������������������#����#���������������������E7�(�H:E)
4�5�����������+�#���-
��@������������������(+�H:E)
���?������������#�� �����������#��������������(������""�H:E)
'���������������������������������#������� ������������������������� ����������� ���������#� �����������C������������&�
������������ ���������#������� ����������'��#� ��������������� ���������#�������������#�����(��#�����������������������)�����#�������������������2���������������#���������������������������� ���������������������������#������������������������������������
The Law on ‘State targeted social assistance’was adopted in 2001 and implemented fromJanuary 2002. According to the law, this assistanceis provided for the poorest persons or families,whose incomes are below the ‘poverty line’ or 40percent of the subsistence minimum (1,904 tenge).The lack of employment and low incomes of the poorpredetermined the composition of state targetedsocial assistance recipients in 2002 (figure 2.5.1).The main recipients were children (57 percent) andunemployed people (18 percent). Disabled people,pensioners, students and cadets of full-timeeducation courses, repatriates (oralmans) andothers fell under the category of ‘Other’, whichconstituted 18 percent of the recipients. The factthat the remaining 7 percent of recipients of thestate targeted social assistance were employedpeople testified to the low level of salaries and
wages, which did not provide for adequate livingstandards neither for them nor for their families.
According to Kazakhstan’s Statistics Agency,over two thirds of households applying for statetargeted social assistance recognise itsimportance and mention its positive impact on thehouseholds’ budgets. However, one third (31.9percent) of households pointed to the uselessnessof such assistance: it made practically nodifference on their financial position. Moreover,over 60 percent of the poor did not apply for statetargeted social assistance at all66 because, in theiropinion, they either did not have any chance ofobtaining it, or it was too difficult to obtain the65 National Centre for Pension Payment of the Ministry of
Labour and Social Protection.66 Low-Income Population: Causes and Conditions.
Publication series Living Standards of Population inKazakhstan. Statistics Agency of Kazakhstan, 2002.
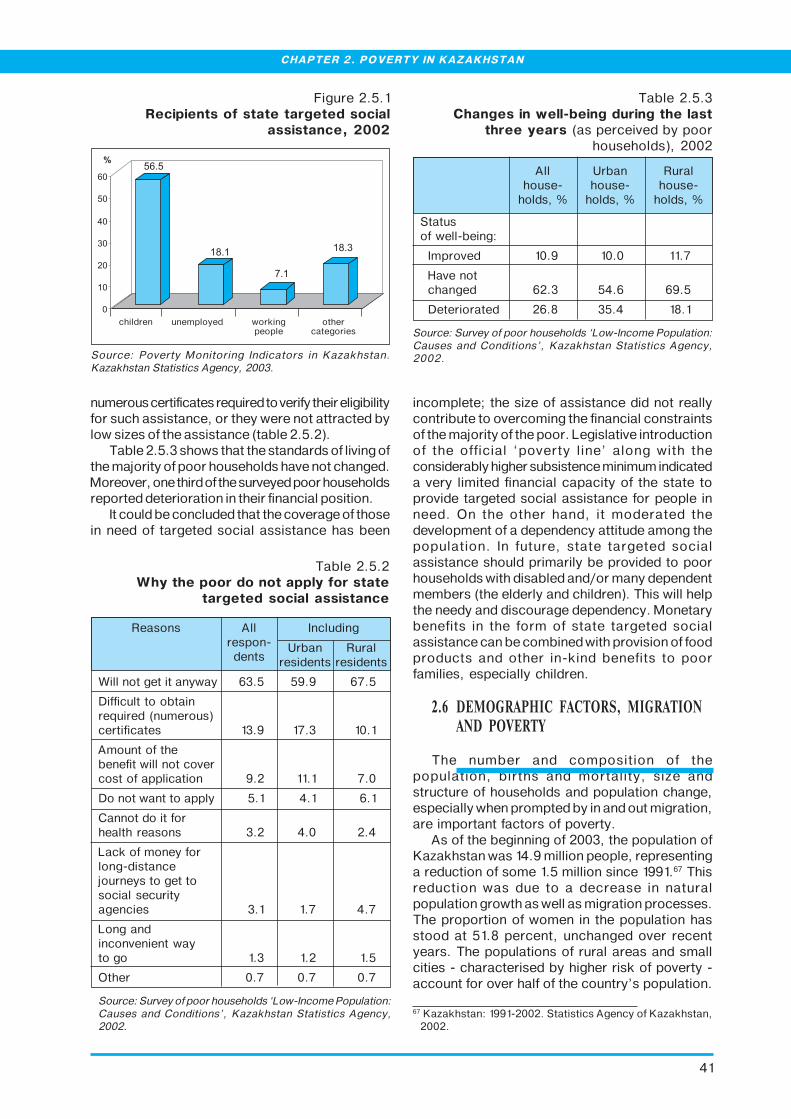
41
numerous certificates required to verify their eligibilityfor such assistance, or they were not attracted bylow sizes of the assistance (table 2.5.2).
Table 2.5.3 shows that the standards of living ofthe majority of poor households have not changed.Moreover, one third of the surveyed poor householdsreported deterioration in their financial position.
It could be concluded that the coverage of thosein need of targeted social assistance has been
incomplete; the size of assistance did not reallycontribute to overcoming the financial constraintsof the majority of the poor. Legislative introductionof the official ‘poverty line’ along with theconsiderably higher subsistence minimum indicateda very limited financial capacity of the state toprovide targeted social assistance for people inneed. On the other hand, it moderated thedevelopment of a dependency attitude among thepopulation. In future, state targeted socialassistance should primarily be provided to poorhouseholds with disabled and/or many dependentmembers (the elderly and children). This will helpthe needy and discourage dependency. Monetarybenefits in the form of state targeted socialassistance can be combined with provision of foodproducts and other in-kind benefits to poorfamilies, especially children.
2.6 DEMOGRAPHIC FACTORS, MIGRATIONAND POVERTY
The number and composition of thepopulation, births and mortality, size andstructure of households and population change,especially when prompted by in and out migration,are important factors of poverty.
As of the beginning of 2003, the population ofKazakhstan was 14.9 million people, representinga reduction of some 1.5 million since 1991.67 Thisreduction was due to a decrease in naturalpopulation growth as well as migration processes.The proportion of women in the population hasstood at 51.8 percent, unchanged over recentyears. The populations of rural areas and smallcities - characterised by higher risk of poverty -account for over half of the country’s population.
Figure 2.5.1Recipients of state targeted social
assistance, 2002
Source: Poverty Monitoring Indicators in Kazakhstan.Kazakhstan Statistics Agency, 2003.
Will not get it anyway 63.5 59.9 67.5
Difficult to obtainrequired (numerous)certificates 13.9 17.3 10.1
Amount of thebenefit will not covercost of application 9.2 11.1 7.0
Do not want to apply 5.1 4.1 6.1
Cannot do it forhealth reasons 3.2 4.0 2.4
Lack of money forlong-distancejourneys to get tosocial securityagencies 3.1 1.7 4.7
Long andinconvenient wayto go 1.3 1.2 1.5
Other 0.7 0.7 0.7
Source: Survey of poor households ‘Low-Income Population:Causes and Conditions’, Kazakhstan Statistics Agency,2002.
Table 2.5.2Why the poor do not apply for state
targeted social assistance
Reasons Allrespon-
dents
Including
Urbanresidents
Ruralresidents
Table 2.5.3Changes in well-being during the last
three years (as perceived by poorhouseholds), 2002
Statusof well-being:
Improved 10.9 10.0 11.7
Have notchanged 62.3 54.6 69.5
Deteriorated 26.8 35.4 18.1
Source: Survey of poor households ‘Low-Income Population:Causes and Conditions’, Kazakhstan Statistics Agency,2002.
Allhouse-
holds, %
Urbanhouse-
holds, %
Ruralhouse-
holds, %
67 Kazakhstan: 1991-2002. Statistics Agency of Kazakhstan,2002.
CHAPTER 2. POVERTY IN KAZAKHSTAN
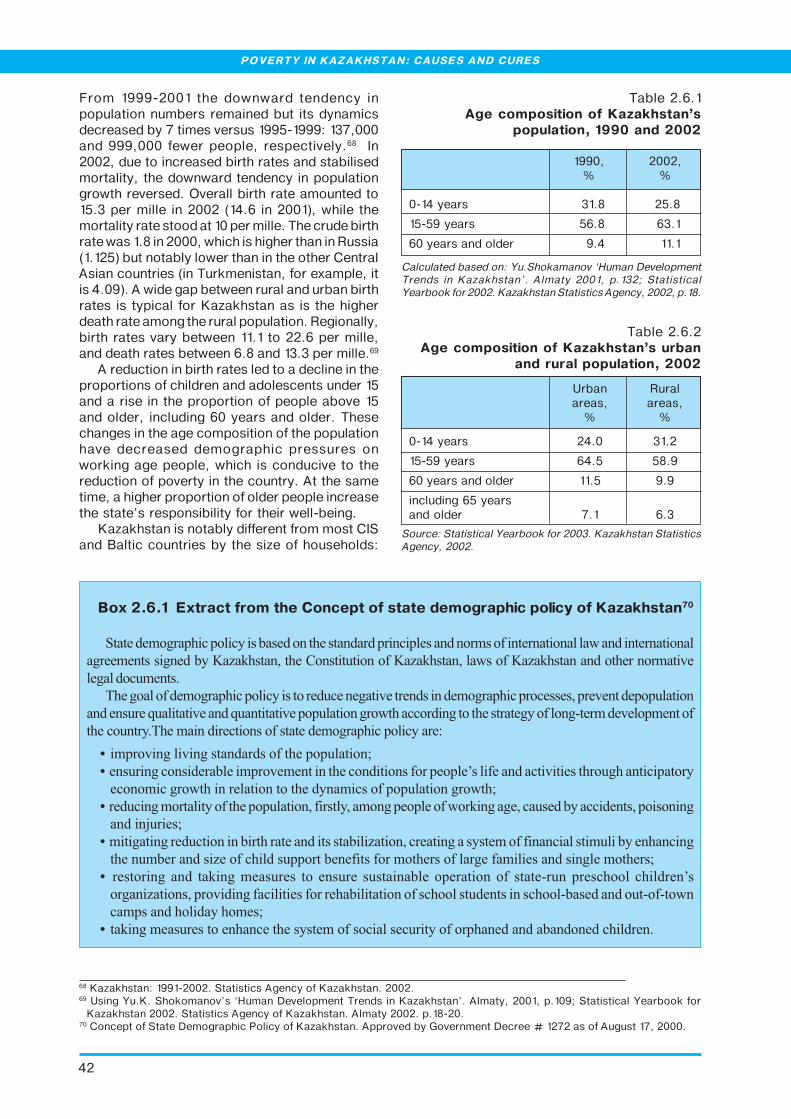
42
POVERTY IN KAZAKHSTAN: CAUSES AND CURES
From 1999-2001 the downward tendency inpopulation numbers remained but its dynamicsdecreased by 7 times versus 1995-1999: 137,000and 999,000 fewer people, respectively.68 In2002, due to increased birth rates and stabilisedmortality, the downward tendency in populationgrowth reversed. Overall birth rate amounted to15.3 per mille in 2002 (14.6 in 2001), while themortality rate stood at 10 per mille. The crude birthrate was 1.8 in 2000, which is higher than in Russia(1.125) but notably lower than in the other CentralAsian countries (in Turkmenistan, for example, itis 4.09). A wide gap between rural and urban birthrates is typical for Kazakhstan as is the higherdeath rate among the rural population. Regionally,birth rates vary between 11.1 to 22.6 per mille,and death rates between 6.8 and 13.3 per mille.69
A reduction in birth rates led to a decline in theproportions of children and adolescents under 15and a rise in the proportion of people above 15and older, including 60 years and older. Thesechanges in the age composition of the populationhave decreased demographic pressures onworking age people, which is conducive to thereduction of poverty in the country. At the sametime, a higher proportion of older people increasethe state’s responsibility for their well-being.
Kazakhstan is notably different from most CISand Baltic countries by the size of households:
Box 2.6.1 Extract from the Concept of state demographic policy of Kazakhstan70
-������� �������#�����#�������������������������������#������������� ����������������������������������������
����� ���������������7�8�.����������@���������������7�8�.��������������7�8�.������������������� �����
��������#� �����
6������������� �������#�����#������������#����������������������� �������#����#��������������������������
�����������*���������������*�������������������������������##������������������������������'��� �������� ������
����#�������6��� ��������#����������������� �������#�����#�����<
• �� ������������������������������������������$
• ����������#������������� ����� �����������#��������������������&������������#���������������������#�������
�#��� �#������������������������������� �#����������������������$
• �����#���� ������������������������������������ �����������������.��������#����������##����������������
������J�����$
• � ��������������#����������������������������������8������#��������������� ���������#������� ������������#���
������ ����������8�����#�������������������������� ������������������ ����������������� ������$
• ���������� ���� ��.���� �������� ��� ������� ������������ ������������� �����'��������#����� #�������&�
������8�������������������#�������������������������������#������������������#����'�������������'��'����
#� ����������������� ��$
• ���.���� ����������������#����������� ������#������#��������������������������������#��������
68 Kazakhstan: 1991-2002. Statistics Agency of Kazakhstan. 2002.69 Using Yu.K. Shokomanov’s ‘Human Development Trends in Kazakhstan’. Almaty, 2001, p.109; Statistical Yearbook for
Kazakhstan 2002. Statistics Agency of Kazakhstan. Almaty 2002. p.18-20.70 Concept of State Demographic Policy of Kazakhstan. Approved by Government Decree # 1272 as of August 17, 2000.
Table 2.6.1 Age composition of Kazakhstan’s
population, 1990 and 2002
1990, 2002,% %
0-14 years 31.8 25.8
15-59 years 56.8 63.1
60 years and older 9.4 11.1
Calculated based on: Yu.Shokamanov ‘Human DevelopmentTrends in Kazakhstan’. Almaty 2001, p.132; StatisticalYearbook for 2002. Kazakhstan Statistics Agency, 2002, p.18.
Table 2.6.2 Age composition of Kazakhstan’s urban
and rural population, 2002
Urban Ruralareas, areas,
% %
0-14 years 24.0 31.2
15-59 years 64.5 58.9
60 years and older 11.5 9.9
including 65 yearsand older 7.1 6.3
Source: Statistical Yearbook for 2003. Kazakhstan StatisticsAgency, 2002.

43
nearly one in three households (31 percent) have5 or more members. At least 37 percent of thetotal population live in such households. Betweenthe 1989 and 1999 (when the two populationcensus were conducted), the number of suchhouseholds reduced the least (table 2.6.3).Achievement of average national per capitaincome level requires great effort on the part ofemployed members of such households.Therefore, high proportion of households withmany dependants remains a potentially decisivefactor of poverty in the country.
Families with children are the maindemographic group among the poor, as it was the
lowers women’s professional status andpredetermines a low-income level for theirfamilies. One of the factors contributing toreduced employment opportunities andprofessional growth of women is the massivereduction in the number of pre-schoolorganisations, by 8 times between 1991-2000.The small rise in this number observed in 2001-2002 appears insignificant (see Section 2.4).More than 86 percent of large families were poorin 2002 (table 2.6.4). Significantly higher numberof poor large families is observed in rural areas,where families tend to have more children, whiletheir incomes are considerably lower than thenational average.
Young families with children are alsoconsidered at high risk of poverty because generallythe mother ‘quits’ active professional activity, at
case during the Soviet times. Children put significantpressure on the employed members of such families.Child support benefits are not yet restored: currentlyfamilies with children are eligible for targeted socialassistance from the state, if their average per capitaincomes are below the ‘poverty line’. In 2001 amonthly payment to a child was no more than 700tenge, whereas in experts’ opinion at least 4-5,000tenge are required for a child under 5 to eat healthyand sufficiently and develop normally. In addition,in families where for various reasons adults do nothave monetary incomes, state targeted socialassistance to children is used to meet needs ofthe whole families.71 Starting from January 2003,one-time childbirth benefits in the amount of 15times monthly unit rate are paid to mothersregardless of a household income level (seeSection 2.5). It is planned to introduce anothertwo types of child benefits.72
Large families, where the number of childrenlimits employment opportunities for mothers, arein a particularly difficult situation. This, in turn,
Table 2.6.3Types and sizes of households,
1989 and 1999
Types and 1989, 1999, 1989-sizes of thousand thousand 1999
households households households change,%
Total, 3,825 3,527 92.2
includingfamiliesconsisting
of 2 members 866 799 92.3
of 3 members 852 802 94.1
of 4 members 973 830 85.8
of 5 and moremembers 1,134 1,096 96.6
Source: Living Standards of Population in Kazakhstan.Kazakhstan Statistics Agency. Almaty, 2002.
least for officially paid maternity leave, while statebenefits do not compensate for her lost contributionsto the family budget.
The risk of poverty incidence is high for single-parent families as well. According to the 1999population census there were 487,200 suchfamilies in Kazakhstan, including 444,800 (91percent) single-mother families.73 An increase inthe number of such households over recent yearshas been caused by both traditional (divorce,husband’s death) and special causes (labourmigration of men from rural to urban areas; men
Table 2.6.4 Poor families with children, 2002
Proportion of poorfamilies with children
(with per capitaincomes under5,000 tenge)
Families with childrenaged under 16 48.2
Including:
with 1 child 34.6
with 2 children 51.2
with 3 children 73.2
with 4 and more children 86.6
Source: Living Standards of Population in Kazakhstan.Kazakhstan Statistics Agency, 2003.
71 Poverty Reduction Conference Materials, April 25-26,2002. Ministry of Economy and Budget Planning/UNDPKazakhstan, 2002.
72 Some Aspects of Social Security System in Kazakhstan.Ministry of Labour and Social Protection/UNDPKazakhstan, 2004.
73 Women and Men in Kazakhstan. Statistics Agency ofKazakhstan. Almaty, 2002.
CHAPTER 2. POVERTY IN KAZAKHSTAN

44
POVERTY IN KAZAKHSTAN: CAUSES AND CURES
leaving the family due to inability to provideadequately for it; alcohol abuse; crimescommitted by unemployed men). Given widespreadinformal employment, the amount and regularity ofalimonies depends on the ‘good will’ of fathers and,as a rule, these do not cover the expenses requiredfor children. All these factors significantly increaseuncertainty and instability of single-parent families’standard of living, especially those consisting ofwomen and children. Poverty among single-parentfamilies is more prevalent in urban areascharacterised by higher levels of divorces anddeaths of working age men.
In 1998-2002 the proportion of children bornout of wedlock rose from 23.6 to 25.9 percentof all newborns. This is more typical in urbanareas, where such births amounted to 29.2percent of all births.74 In such cases state benefitsonly partially cover the child’s subsistenceminimum. Experts link growing numbers ofchildren born out of wedlock to young people’sdesire to first achieve a satisfactory level ofwelfare and then start a family. Experience showsthat young fathers actively seek additional incomesources. However, not all find them: in 2002 onein three men aged 20-29 (96,000 people) wasunemployed. Unlike many other CIS countries, thelevel of divorces is still low in Kazakhstan, whichpositively affects the poverty level in the country(table 2.6.5).
Poverty and problems of the healthcare systemeventually lead to high infant and maternal mortalityin Kazakhstan. In 2002 infant and maternalmortality rates were 17.0 deaths per 1,000
used. Currently, Kazakhstan’s statistics is basedon the ‘soviet’ definition of live birth. 76 Thirty infantswith inborn abnormalities are born per 1,000 ofnewborns. The health index of Kazakhstan’swomen is 30 percent, in some regions 10-20percent. Over 60 percent of pregnant women haveanaemia, the incidence have increased tenfoldover the last decade. Of particular concern isbreast cancer incidence in women. Overall, thelowered status of family and maternity cannotleave the society indifferent and requires effectivemeasures to be developed and taken in order toaddress this problem (see Section 2.8).
Single pensioners of older age are anothersocio-demographic group at high risk of poverty.It is not easy to obtain accurate information aboutpoverty incidence among this category of thepopulation because it is hidden by the specificsof aggregation of official statistics, which do notconsider this group an object for regular statisticalobservation. An indirect indicator of poverty in thiscategory is the fact that in 2001 every seventh (14percent) resident of Kazakhstan aged 65 and olderwas working, while 3,200 and 1,500 respectivelywere either unemployed or looking for differentor extra work.77
The presence of disabled people in ahousehold also appears to increase poverty risk.This factor puts additional and often substantialpressures on the employed ‘healthy’ familymembers. As of 1 October 2003, there were409,500 disabled persons (about 3 percent oftotal population) in Kazakhstan.78 Not only dopeople with disability need extra means ofsubsistence but also appropriate conditions toovercome social isolation (see Section 2.5).
International migration has become anothermost important and enduring factor affecting thepoverty level in the country. Over the period from1991 to 2001 850,000 people entered and 2.9million people left the country. Migration was
Table 2.6.5Marriages and divorces in Kazakhstan,
1991 and 2002
Indicator 1991 2002
Marriages, per 1,000 persons 10.1 6.7
Divorces, per 1,000 persons 3.0 2.1
Source: Statistical Yearbook for Kazakhstan 2003.Kazakhstan Statistics Agency. Almaty, 2003.
newborns and 36.5 deaths per 100,000 live births.75
According to the UN Millennium Development GoalsReport for Kazakhstan, there are striking differencesbetween the official rates and those derived fromthe Demographic and Health Survey, based onwomen’s answers on their fertility history. Accordingto the survey, infant mortality between 1994-1999reached 61.9 deaths per 1,000 live births. Sincenormally infant mortality is calculated as apercentage of live births, it is possible that the infantmortality rates in Kazakhstan would be significantlyhigher if the international definition of live birth were
74 Statistical Yearbook of Kazakhstan 2002. Statistics Agencyof Kazakhstan. Almaty, 2002. p.22.
75 Poverty Monitoring Indicators in Kazakhstan. StatisticsAgency of Kazakhstan, 2003.
76 ‘WHO standard definition’ refers to the live births includeall births, with the exception of stillbirths, regardless ofthe size, gestation age, or ‘viability’ of the newborn infant,or his or her death soon after birth or before the requiredbirth registration date. The ‘Soviet concept’ excludesinfants born with no breath, but with other signs of life(‘stillbirths’ in the Soviet concept) and infants born beforethe end of the 28th week of pregnancy at a weight under1,000 grams or a length under 35 centimeters and who dieduring the first seven days of life (‘miscarriages’).
77 Calculated based on: Labour and Employment ofPopulation in Kazakhstan. Kazakhstan Statistics Agency,2003, p. 40.
78 Materials of the National Conference on Medical and SocialExamination and Rehabilitation of the Disabled. Almaty,2003.
45
negative during the whole period. The maximumupsurge of out-migration was observed in 1994.After that emigration started to decline. In 2002 thenegative migration balance was 62,000 people:nearly two times lower than in 1999.
Direct impact of inter-country migration onpoverty is determined by qualitative structure ofmigrants, particularly by their well-being.Different directions of immigration and migration(most active immigration was from new CentralAsian countries, but out-migration was mostly toRussia) as well as their qualitative compositiondetermined increase in poverty in the country.Among the emigrants were mostly well-off andeducated people whereas among the immigrants– mostly people seeking a better life inKazakhstan.
Among immigrants belonging to the groupswith higher risks of poverty are families ofrefugees and forced migrants. Existence ofsuch groups is determined by the collapse ofSoviet Union as well as by numerous regionalconflicts in former Soviet republics. Age composition
Box 2.6.2 Orphaned children are at poverty risk79
D������������� ����.�����������������J�#��C1 ��� �������-�#����H��.������9����� �����F�#��������5� ����#
��������������5�������6�#���*�������2����1�����������������@���������#*�����B����-.����&�� ��� ������������
� �����F�������������������C9����#����#������������������&������� �&������������.������ �-���� ������
;��� �����""���6������������������������������������ �������������������������(��.���������������������
������������)������� ���������������������������������������������������-�#����������������#���������������
#������������� �������������#����������������������������������������������������������������������������#�����
�����������������������
6��� ���������� �������#��#��������(����������������������������������������#)����<
��1������������#��'� ��������������� �������#�����#�������� ��������&����������*��������� �����������
������#�����������������������������#��
���C9�������#&����������������#���������������������� ��������������������������������@�������������������
C���'��������&�������� ���������������#����������8�������������������������������������6������#� ����
��� �������� ���#�������������������������������#� �����������H������������#���������������
����������� ��������������������������������������������������������� ����������������.���������������
������#��������������������������������������
/�������������������#������������������������������������������������������ ����#�������������������������#�
���������������������'���#�������������#.�����.���������� ����
����������������������������� ������������������������������������������#����������������������������������
��#�����������������6��������������������������������������� �J�������������������������������#�������������
#�����������C����#����&�C ��������&�����C���������&��6����������������������������� ����������#���������#�
#������������#����*�������������#�������������������������#������������������ ���������������������������������
��#.�������#����������������������������������������������������������� ������������������� �J���������������
������#�����������������#��#��������
of refugees and forced migrants significantly differfrom other groups of migrants as it includes largeproportion of children and older people. Refugeesand forced migrants are usually not able to providethemselves with adequate housing as well as jobsat the new place of residence. Definition of a ‘refugee’was introduced in Kazakhstan in December 1997.80
However, this has not introduced changes in thestatus of this people in the country. There are notenough financial resources provided for bettersettlement of immigrants at the new place ofresidence. Moreover, major part of immigrants (in2002) is settled in the oblasts81 characterized byhigh levels of poverty. Oralmans (box 2.6.3) is theother immigration group with higher risk of poverty.
79 Findings of the sociological survey ‘Public Perceptions ofOrphans’ Problems’ by Amanat Foundation.
80 Law on ‘Population Migration in Kazakhstan’ as of 13December 1997.
81 In Kazakhstan ‘oblast’ refers to the main administrativeunit.
CHAPTER 2. POVERTY IN KAZAKHSTAN
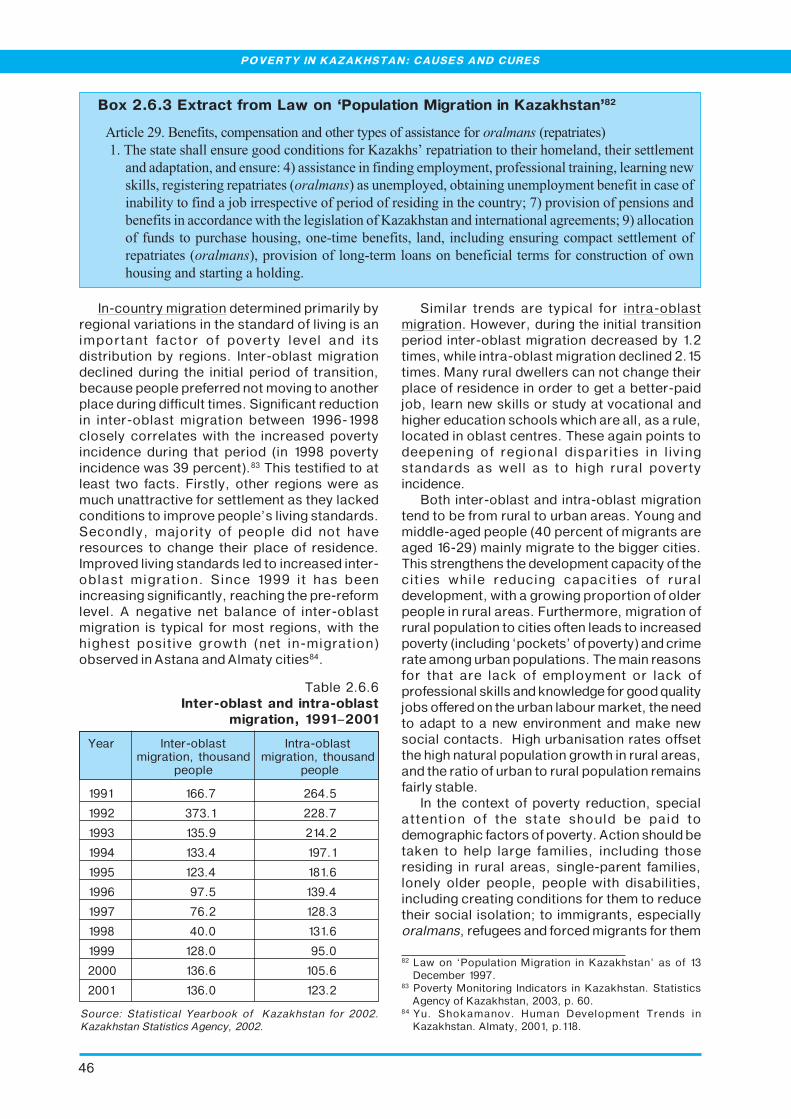
46
POVERTY IN KAZAKHSTAN: CAUSES AND CURES
In-country migration determined primarily byregional variations in the standard of living is animportant factor of poverty level and itsdistribution by regions. Inter-oblast migrationdeclined during the initial period of transition,because people preferred not moving to anotherplace during difficult times. Significant reductionin inter-oblast migration between 1996-1998closely correlates with the increased povertyincidence during that period (in 1998 povertyincidence was 39 percent).83 This testified to atleast two facts. Firstly, other regions were asmuch unattractive for settlement as they lackedconditions to improve people’s living standards.Secondly, majority of people did not haveresources to change their place of residence.Improved living standards led to increased inter-oblast migration. Since 1999 it has beenincreasing significantly, reaching the pre-reformlevel. A negative net balance of inter-oblastmigration is typical for most regions, with thehighest positive growth (net in-migration)observed in Astana and Almaty cities84.
Box 2.6.3 Extract from Law on ‘Population Migration in Kazakhstan’82
����#����!��?��������#� �������������������������������������#���������������(�����������)
��6���������������������������#��������������7�8�.��&������������������������� ������������������ ���
�������������������������<�,)���������#�������������� ���� ��������������������������������������
�.�����������������������������(��������)������� �������������������� ���� ���������������#������
��������������������J����������#����������������������������������#������$� )��������������������������
�������������##�����#��������������������������7�8�.����������������������������� ����$�!)�����#�����
���������������#����������������'�� ����������� �������#����������������#� ��#�������� ������
������������(��������)������������������'��� ����������������#������� ������#������#�����������
�������������������������������
Similar trends are typical for intra-oblastmigration. However, during the initial transitionperiod inter-oblast migration decreased by 1.2times, while intra-oblast migration declined 2.15times. Many rural dwellers can not change theirplace of residence in order to get a better-paidjob, learn new skills or study at vocational andhigher education schools which are all, as a rule,located in oblast centres. These again points todeepening of regional disparities in livingstandards as well as to high rural povertyincidence.
Both inter-oblast and intra-oblast migrationtend to be from rural to urban areas. Young andmiddle-aged people (40 percent of migrants areaged 16-29) mainly migrate to the bigger cities.This strengthens the development capacity of thecities while reducing capacities of ruraldevelopment, with a growing proportion of olderpeople in rural areas. Furthermore, migration ofrural population to cities often leads to increasedpoverty (including ‘pockets’ of poverty) and crimerate among urban populations. The main reasonsfor that are lack of employment or lack ofprofessional skills and knowledge for good qualityjobs offered on the urban labour market, the needto adapt to a new environment and make newsocial contacts. High urbanisation rates offsetthe high natural population growth in rural areas,and the ratio of urban to rural population remainsfairly stable.
In the context of poverty reduction, specialattention of the state should be paid todemographic factors of poverty. Action should betaken to help large families, including thoseresiding in rural areas, single-parent families,lonely older people, people with disabilities,including creating conditions for them to reducetheir social isolation; to immigrants, especiallyoralmans, refugees and forced migrants for them
Table 2.6.6Inter-oblast and intra-oblast
migration, 1991–2001
Year Inter-oblast Intra-oblastmigration, thousand migration, thousand
people people
1991 166.7 264.5
1992 373.1 228.7
1993 135.9 214.2
1994 133.4 197.1
1995 123.4 181.6
1996 97.5 139.4
1997 76.2 128.3
1998 40.0 131.6
1999 128.0 95.0
2000 136.6 105.6
2001 136.0 123.2
Source: Statistical Yearbook of Kazakhstan for 2002.Kazakhstan Statistics Agency, 2002.
82 Law on ‘Population Migration in Kazakhstan’ as of 13December 1997.
83 Poverty Monitoring Indicators in Kazakhstan. StatisticsAgency of Kazakhstan, 2003, p. 60.
84 Yu. Shokamanov. Human Development Trends inKazakhstan. Almaty, 2001, p.118.

47
to settle into the new location and more effectivelyuse their professional capacities. The maincondition to radically reduce child mortality isensuring significant improvement in children’swelfare, especially those from large and single-parent families.
2.7 HEALTH STATUS AND ITS RELATIONTO POVERTY
People’s health status directly affects theircapabilities to actively participate in social life andensure sound living standards. Kazakhstanipeople mention poor health as one of the maincauses of poverty.
Long and healthy life allows people to fruitfullyemploy their physical and human capacities andincrease their personal well-being. Lifeexpectancy at birth is an integral indicator of thelife quality. In Kazakhstan life expectancy hasbeen steadily declining over a number of years. Itwas 71.4 years in 1965, whereas it had droppedto 67.6 in 1991. Only in 2001-2002 some increasein life expectancy at birth was observed (65.6 and65.8 years respectively). Male life expectancy hasfallen most, which can be explained by suchfactors as higher heart disease morbidity andmortality rates as well as higher dispositiontoward stress (table 2.7.1).
Infant mortality rate is the most important factoraffecting the indicator ‘life expectancy at birth’. Adownward trend in this indicator has been observedin Kazakhstan over the last decade: it fell from 27.4per 1,000 live births in 1991 to 17.0 in 2002 (table2.7.3). However, as mentioned earlier, there is awide gap between the official (administrative)statistics and data of the Demographic and HealthSurveys in 1995 and 1999. Firstly, the indicatorsobtained through the Demographic and HealthSurvey are nearly two times higher than official ones;secondly, the Survey findings demonstrate anupward trend of the infant mortality rate (table2.7.3). Such difference might be explained by thefact that Kazakhstan has maintained the old‘soviet’ definition of the live birth, which isconsiderably looser that the WHO-recommendeddefinition used worldwide.86
Major causes of infant mortality are prenatalconditions related to foetal growth, problemsduring delivery or immediately afterwards such as
Table 2.7.1Life expectancy at birth in Kazakhstan,
1997–2002
Life 1997 1998 1999 2000 2001 2002expectancy,
years
Bothgenders 64.4 64.4 65.5 65.4 65.6 65.8
Men 58.5 59.0 60.3 59.8 60.2 60.6
Women 69.9 70.4 71.0 71.3 71.1 71.4
Sources: Poverty Monitoring Indicators in Kazakhstan.Kazakhstan Statistics Agency, 2003; Statistical Yearbook for2003. Kazakhstan Statistics Agency, 2003.
Infant and maternal mortality rates reflect theeffectiveness of the state’s policies aimed atprotection and strengthening of people’s health.As mentioned earlier (see Section 2.1.1), maternalmortality rate is unstable and varies between 67.2per 100,000 newborns in 1991 and 48.6 in 2001(table 2.7.2). The causes of maternal mortalityare shown in figure 2.7.1. According to the UNMillennium Development Goals in KazakhstanReport, Kazakhstan is unlikely to achieve the Target6 aimed at reduced maternal mortality rate by 75percent between 1990 and 2015.85
Table 2.7.2 Maternal mortality rate, 1991–2001
1991 1996 1998 1999 2000 2001
67.2 69.4 77.5 65.3 60.9 48.6
Source: Health of Population and Healthcare in Kazakhstan in1991-2001. Ministry of Health, 2002.
Figure 2.7.1Causes of maternal mortality, 2002
Calculated based on: Living Standard of Population inKazakhstan. Statistics Agency of Kazakhstan, 2003.
85 UN Millennium Development Goals in Kazakhstan, 2002.86 Ibid.
CHAPTER 2. POVERTY IN KAZAKHSTAN

48
POVERTY IN KAZAKHSTAN: CAUSES AND CURES
pre-maturity, asphyxia, trauma and intra-uterineinfections (figure 2.7.2).
increased over the last decade (table 2.7.4). Thecardio-vascular diseases contribute most to highmortality rates in Kazakhstan: in 2002 theyaccounted for 50 percent of all deaths.88
Under-five mortality rate has been declining sincethe mid-1990s, but still remains relatively high,making 22.8 cases per 1,000 live births in 2001.According to the UN Millennium DevelopmentGoals in Kazakhstan Report, Target 5 aimed atreduced under-five mortality rate by 65 percentbetween 1990 and 2015 is unlikely to be achievedin Kazakhstan.87
Over the last 10 years, official morbidity ratesshow some downward trends. However, diseasesare mainly registered when a person applies formedical assistance. Hence, taking into accountthe overall impoverishment of population andlowered access to health care services, it is mostlikely that these figures are under-estimated.
Cardio-vascular disease incidence has
Infant ward. Otrar rayon, South Kazakhstan oblast.
Figure 2.7.3Under-five mortality rate, 1991–2001
Source: UN Millennium Development Goals in Kazakhstan,2002.
87 UN Millennium Development Goals in Kazakhstan, 2002.88 Living Standards of Population in Kazakhstan. Statistics
Agency of Kazakhstan, 2003, p.183.
Table 2.7.4Cardio-vascular diseases and
tuberculosis in Kazakhstan, 1991–2002
Sources: Statistics Yearbook 2003. Statistics Agency ofKazakhstan, 2003.* Health of Population and Healthcare in Kazakhstan in 1991-2001. Kazakhstan Ministry of Health, 2002;
1991* 1026.2 64.4
1996 1038.1 82.5
1998 1100.9 118.8
1999 1333.4 141.0
2000 1288.7 153.2
2001 1396.4 155.7
2002 1984.4 164.8
Morbidity rate,per 100 thousand people
Cardio-vasculardiseases
Tuberculosis
Figure 2.7.2Causes of infant mortality, 2002
Calculated based on: Statistical Yearbook for 2003. StatisticsAgency of Kazakhstan, 2003.
Table 2.7.3Comparing official statistics with findings
of demographic and health survey
Period Infant mortality Infant mortalityrate by official rate by
statistics Demographicand Health Survey
1984-1989 29.6 54.9
1989-1994 26.8 49.7
1994-1999 25.2 61.9
Source: UN Millennium Development Goals in Kazakhstan,2002.

49
At the initial stage of the transition period, due tothe unfavorable economic situation, state budgetdeficit and negative migration balance, thehealthcare facilities network was restructured and‘optimized’ by reducing the number of medicalestablishments. This restructuring reducedavailability, access to and quality of medicalservices, particularly for the poor. For instance,the number of outpatient facilities and polyclinicsproviding primary healthcare services droppedfrom 1,805 in 1991 to 1,005 in 2002. This resultedin the reduction of the total number of hospitalbeds from 140 to 75 per 10,000 people (table2.7.6). In addition, the majority of healthcarefacilities have fallen into decay, with a decliningnumber of physicians and nurses. In 1991-2002the number of physicians fell from 40 to 36 per10,000 people, while nursing staff dropped from121 to 76 per 10,000 people.
Kazakhstan is traditionally a critical region interms of tuberculosis incidence due to a number ofsocio-economic problems, poor health educationamong the population and lack of preventivemedical examinations due to the low material andtechnical base of the health care system (table2.7.6). Kazakhstan has the highest TB incidenceand mortality rates among CIS countries. Incidenceof active TB cases increased 2.6 times between1991-2002 (table 2.7.4). According to the UNMillennium Development Goals in KazakhstanReport, Target 8 to have halted and begun to reversethe incidences of tuberculosis by 2015 is unlikely tobe achieved in Kazakhstan.89
An upsurge of registered HIV cases has beenobserved over the last decade: from 2 cases in1999 to 2,522 cases in 2001, with the overallnumber of cases amounting to 3,257 in 2002(table 2.7.5). The social composition of the HIV-positive population and its distribution by agegroup indicates that the HIV-infected people aremostly at working age and are unemployed. Inother words, HIV-infected people are excludedfrom normal life and are stigmatized by society.Costly medical treatment of HIV infection neededfor people living with HIV/AIDS puts significantfinancial constraints on their families, and henceincreases risk of poverty. According to the UNMillennium Development Goals in KazakhstanReport young people, prisoners, commercial sexworkers and men having sex with men are mostvulnerable to the spread of HIV/AIDS.90
Considering existing tendencies and indicators inis unlikely that Kazakhstan will reach the Target7, which expects that the spread of HIV/AIDSshould have been halted and begun to reverse by2015.
Table 2.7.5HIV incidence in Kazakhstan, 1996–2002
1996 1997 1998 1999 2000 2001 2002
79 437 815 1000 1347 2522 3257
Source: HIV Infection. Informational Statistical Bulletin.Republican Centre for Prevention and Control of AIDS. 2003.
The major cause of poor health of the nation isthe low level of public spending on healthcare inKazakhstan. In 2002 it was 1.9 percent of GDP.91
Due to the economic slump of 1992-1996, publicexpenditure on healthcare reduced almost twotimes.92 Still, despite the recent macroeconomicachievements of the country, the healthcaresector remains under-financed, and publicexpenditures remain relatively low (table 2.2.4).There is also lack of medical insurance schemes.
89 UN Millennium Development Goals in Kazakhstan, 2002.90 Ibid.91 Poverty Monitoring Indicators in Kazakhstan. Kazakhstan
Statistics Agency, 2003.92 UN Millennium Development Goals in Kazakhstan, 2002.
Table 2.7.6Indicators of access to healthcare,
1998–2002
1998 1999 2000 2001 2002
Hospital beds
Overallnumber 123.5 108.2 106.9 110.2 111.9
Per 10,000population 82.6 72.6 72.1 74.4 75.3
Number ofphysicians(not includingdentists)
Overallnumber 53.2 50.6 49.0 51.3 53.7
Per 10,000population 35.6 33.9 33.0 34.6 36.1
Number ofparamedicalspecialists
Overallnumber 120.4 110.4 106.5 109.4 113.4
Per 10,000population 80.5 74.1 71.8 73.8 76.3
Source: Living Standards of Population in Kazakhstan.Statistics Agency of Kazakhstan, 2003.
To develop human capital and reduce poverty,Kazakhstan needs to urgently address challengesof the healthcare sector. Currently, poor populationof the country suffers from little of low access toqualified medical services because of lack of
CHAPTER 2. POVERTY IN KAZAKHSTAN

50
POVERTY IN KAZAKHSTAN: CAUSES AND CURES
healthcare facilities, lack of good quality free-of-charge medical services, and need to pay for medicalservices. Moreover, the situation is furtheraggravated by poor environmental conditions,inadequate preventive measures and lack of healthlifestyles culture.
2.8 GENDER DIMENSIONS OF POVERTY
In Kazakhstan, women and men have equalrights to education and employment. However,reality makes its own amendments. The humanpoverty index (HPI-3) for Kazakhstan indicates therelatively better position of women (see Section2.1.1). Analysis of the HPI components shows thatmen are worse off in terms of life expectancy andeducational level, whereas women are poorer interms of incomes and position on the labourmarket (table 2.8.1).
Male and female life expectancy. Overallnegative demographic trends (shrinking
population, falling life expectancy) are more evidentamong men in Kazakhstan. During 1991-2002 thefemale population shrank by 742,000 people, themale population by 754,000. Over the same periodaverage male life expectancy at birth fell by 2 years(from 62.6 to 60.6), female life expectancy by oneyear (from 72.4 to 71.1). Men live shorter lives thanwomen, on average by 11 years. The average age ofmen is 29, versus 32 in women. According to the1999 population census, women constitute 52percent of population, however there are 948 menper 1,000 women in the composition of the workingage population.
Male and female life expectancies aredeclining primarily due to deteriorating healthstatus and limited financial capacity of the poorto access timely and high-quality healthcare. Asmentioned earlier, women health index is only 30percent, being as low as 20 or 10 percent in someregions. Over 60 percent of women have anemia.In some environmentally unfavorable Aral Searegions this indicator reaches 87 percent, with upto 99 percent in pregnant women.93 However, the1999 Demographic and Health Survey (table 2.8.2)reflect some improvement in the anemia situation:36 percent of anemic women were registered (aspercent of total number of women aged 15-49). Asignificant drop in anemia was registered in South
Tuberculosis dispenser.By Oleg Ionov.
Table 2.8.1Human poverty index by gender,
1998–1999
1998 1999
Men Women Men Women
32.7 32.2 30.1 29.1
Source: Data from Statistics Agency of Kazakhstan
93 UN Millennium Development Goals in Kazakhstan, 2002.
Table 2.8.2Anaemia in women by regions, 1995/1999
Region % of anaemic women (15-49 years old)
1995 1999
severe mild light total severe mild light total
Almaty city 1.1 9.4 27.7 38.2 0.7 6.1 17.0 23.8
South Kazakhstan 0.8 10.6 38.9 50.3 0.2 6.6 18.5 25.3
West Kazakhstan 2.5 16.4 40.0 58.9 3.1 11.1 31.5 45.7
Central Kazakhstan 0.7 8.0 35.1 43.8 1.1 6.3 30.0 37.4
North Kazakhstan 1.1 9.5 36.8 47.4 1.9 8.3 39.2 49.4
East Kazakhstan 0.9 7.3 18.6 26.8
Kazakhstan 1.1 10.6 37.1 48.8 1.2 7.7 26.6 35.5
Source: UN Millennium Development Goals in Kazakhstan, 2002

51
Kazakhstan, from 50 to 25 percent, while in Northand West Kazakhstan anemia incidence remainedhigh in 1999 at 49 and 46 percent respectively.94
Breast cancer tops the list of women’s cancerdiseases. Approximately 60 percent of pregnantwomen have various aftereffects, whilegynecological diseases were identified in 40 to 60percent of women of childbearing age. The poorhealth status of women is aggravated by a highproportion of abortions, which remains the mainway to avoid unwanted pregnancies (in 2002, therewere 53 abortions to 100 deliveries).
Men, in turn, outnumber women in alcoholabuse (90 percent), mental disorder (62 percent)and active tuberculosis (57 percent). The natureof diseases prevalent in men makes them lesscapable of functioning and leads to morepremature deaths. The greater physical andpsychological adaptability of women allows themto cope with typical causes of poor health and stayrelatively socially active.
Gender disparities in education. Against abackground of overall high literacy (99.5 percentaccording to the 1999 population census), menare less educated in Kazakhstan. While there aremore boys under 16 than girls (by 3 percent),proportions of girls and boys enrolled in primary,secondary and higher professional education havebeen changing in favor of girls over the last fewyears: 53.3 percent in 2000, 53.9 percent in 2001and 54.3 percent in 2002. The proportions ofyoung men not enrolled in general secondaryschooling is twice as high as for young girls. Thereare more women with higher (by 24 percent) andvocational (by 39 percent) education than men.The causes of such a situation should be lookedat in the context of the traditional responsibilityof men to provide for the family and, as aconsequence, their employment at an earlier age.The lower educational level of men makes themless competitive and leads to their poverty. Familyheads with higher education have moreopportunities to gain good provision for theirfamilies and are less likely to become poor (figure2.8.1, see also Section 2.4). At the same time,girls, even with some education, find it moredifficult to find highly paid jobs.
Gender aspects of unemployment.Inequality of women and men is apparent, first ofall, on the labour market. In 2002 the number ofmen in the labour force was 4 percent higher thanof women.95 There are 1.7 times more women thanmen, who are not part of the labour force. Thissituation cannot be explained only by women’svoluntary ‘jump’ into the status of housewives:women still actively offer their labour. From 1998-2001 the number of employed women rose by 15percent, whereas this figure rose by just 4 percentfor men. However, the proportion of employedwomen remains low (figure 2.8.2).
The so-called ‘feminisation’ of unemploymentsurfaces: women accounted for 57 percent of theunemployed in 2001 and 59 percent in 2002.Unemployment rate is higher among women thanmen (11.2 and 7.5 percent in 2002). The maincauses of unemployment regardless of gender arerooted in difficulties finding a job after graduationor the absence of any job at all. Women aredisadvantaged as they are more frequentlybecoming redundant because of downsizing and theneed to do housekeeping (table 2.8.3). Analysis ofunemployment by age also indicates genderinequality on the labour market: there are moreunemployed women than men in the majority of agegroups (figure 2.8.3).
Women prefer to study and do not look for jobsin their teens. Female population aged 15-19 inthe overall country’s labour force is 17 percent
Figure 2.8.1Households by educational level
of their heads, 2002
Source: Living Standards of Population in Kazakhstan.Statistics Agency of Kazakhstan, 2003.
Figure 2.8.2Employed population, 1998–2002
Source: Statistical Yearbook 2003. Statistics Agency ofKazakhstan, 2003
94 UN Millennium Development Goals in Kazakhstan, 2002.95 Labour Market in Kazakhstan: 1991-2002. Statistics
Agency of Kazakhstan, 2003.
CHAPTER 2. POVERTY IN KAZAKHSTAN

52
POVERTY IN KAZAKHSTAN: CAUSES AND CURES
less than for males, while the proportion ofunemployed girls in this age is 3 percent more thanunemployed boys.96 Women account for 61 percentof the unemployed population aged 20-54, which isthe most active working age. The situation changesin favour of women, starting from the age of 60,when unemployed men are 2.1 times more thanunemployed women. Lack of data does not allowfor accurate identification of the causes of thisphenomenon. However, it is possible to suppose thefollowing: women begin to actively marketthemselves on the labour market approximatelystarting from age 25 (the level of economic activityequals to 72 percent) after receiving education,having a first child and raising children, with thisactivity practically constant until the age of 60. Thepeak of female activity is at 35-49 years, whenwomen have nearly accomplished their childbearingfunctions and can occupy themselves making acareer. Although there is less demand for women ofthis age on the labour market - there are 1.7 timesmore unemployed women in this age than men -due to subtle discrimination on the part ofemployers. After 60 the level of female economicactivity rapidly drops from 35 percent when aged60-64 to 12 percent when aged above 65. Themajority of women of this age prefer to (or haveto) do housekeeping. Men of this age are two-times more active than women but the malepopulation shrinks by this age by 39 percent.Thus, due to the natural decrease in male numbersand the high number of women rejectingemployment, women still seeking work havebetter chances to get a job, with femaleunemployment falling at this age as a result.
High educational level is advantageous whenjob hunting, especially for women (table 2.8.4).High educational level of women contributes tothe fact that in 2002 there were 16 percent moreemployed women with higher education than men,and with vocational education by 11 percent.
Female unemployment levels are higher thanmale unemployment irrespective of their education,
Table 2.8.3Causes of unemployment, 2002
Dismissal due toliquidation oforganisation 11.1 9.9
Dismissal due toredundancy 14.0 16.1
Voluntary termination 8.2 9.4
Dismissal dueto contract termination 5.4 3.5
Termination ofentrepreneurial activity 0.7 0.3
Running a small holding 1.1 10.6
Absence of employmentafter graduation 17.8 14.1
Absence of any job 34.8 30.7
Other 6.9 5.3
Source: Labour Market in Kazakhstan: 1991-2002. StatisticsAgency of Kazakhstan, 2003.
Proportion of respectiveunemployed men relative
to total number ofunemployed
men, % women, %
Causes
Table 2.8.4Men and women by education and employment, 2002
Educational level Men, % Women, %
Employed Unemployed Employed Unemployed
higher 15.8 9.5 19.9 10.0
incomplete higher 2.5 2.5 2.4 2.4
vocational secondary 25.6 20.6 30.9 29.4
primary vocational 15.3 14.1 9.4 11.0
general secondary 32.9 43.6 29.6 40.6
basic 5.6 7.6 5.1 5.2
primary 2.4 2.0 2.8 1.4
Total 100.0 100.0 100.0 100.0
Source: Labour Market in Kazakhstan: 1991-2002. Statistics Agency of Kazakhstan, 2003.
Figure 2.8.3Unemployment rate by age, 2002
Source: Labour Market in Kazakhstan: 1991-2002. StatisticsAgency of Kazakhstan, 2003.
96 Labour Market in Kazakhstan: 1991-2002. Statistics Agency of Kazakhstan, 2003.

53
excluding unemployed men with only primaryeducation (figure 2.8.4). There are 11 percent moreemployed women with primary education than men,and there are 5 percent less unemployed women inthis category. Probably, jobs not requiring aqualification that are offered to people with thelowest educational level are traditionally taken upby women (cleaning, dish-washing, etc.). Thenarrowest gap is observed in unemployment levelsof women and men with higher education, whichserves as another factor intensifying the importanceof higher education to ensure the nation’s welfare.
High female unemployment level is aggravatedby the difficulty of getting re-employed. Women
spend more time finding employment against abackground of overall growing duration ofunemployment (table 2.8.5).
Income disparities. The main sources ofincome for women (and for general population) are
Source: Labour Market in Kazakhstan: 1991-2002. StatisticsAgency of Kazakhstan, 2003.
Figure 2.8.4Unemployment rate and education, 2002
Table 2.8.5Unemployment by duration and gender,
2001–2002
2001 2002 2001 2002
Less than 1 month 48.1 53.2 51.9 46.8
Up to 3 months 50.5 46.2 49.5 53.8
3 to 6 months 47.5 47.0 52.5 53.0
6 to 12 months 49.3 48.4 50.7 51.6
1 year and more 42.2 38.3 57.8 61.7
5 years and more 34.1 26.7 65.9 73.3
Source: Labour Market in Kazakhstan: 1991-2002. StatisticsAgency of Kazakhstan, 2003.
Duration ofunemployment
Proportion oflong-term
unemployedmen, %
Proportion oflong-term
unemployedwomen, %
salaries, pensions and social benefits. In low-income households, wages account for nearly 66percent of all income. Average monthly salary ofwomen was 9,507 tenge less than for men in 2002with this gap being widest in the finance sector(28,005 tenge) and hotels and catering (25,584tenge). The ratio of female to male salaries hasbeen falling from year to year and, in most cases,does not exceed 78 percent in different sectors(tables 2.8.6 and 2.8.7). The low level of women’ssalaries reinforces their competitiveness on thelabour market on the one hand but contributes totheir poverty on the other.
The fact that women are most often employed inlow-paid sectors such as healthcare and social
Table 2.8.6Men’s and women’s wages, 1999–2002
1999 2000 2001 2002
Average nominalmonthly wage,tengeincluding of 11,864 14,374 17,303 20,323
Men 14,304 17,603 21,511 24,847
Women 9,485 10,819 12,635 15,340
in % relative tosalaries of men 67.6 61.5 58.7 61.7
Source: Statistical Yearbook for 2003. Statistics Agency ofKazakhstan, 2003.
services (79 percent) as well as education (73percent) contributes to their low earnings.Probably due to this, 193 out of 1,000 employedwomen and 171 out of 1,000 employed men (11percent less than women) were looking for adifferent or extra job.97
Despite the higher proportion of women in theoverall population, as a rule, men occupy themanagement positions. In 2002 there were only 11female Members of Parliament - just 9.5 percent ofthe overall number – while a total of 18.5% percentof local government and maslikhat-level deputieswere women in 2002. While there is a clearprevalence of female professionals with higher andvocational education and a wide representation ingovernment agencies (over 50 percent), only 5percent of them are managers.98
Women, as one of the most vulnerable groupsof the population, are recipients of state socialassistance more often then men. Moreover, theminimum set of social benefits paid to the needyincludes two specifically women’s allowances:‘childbirth benefit’ and ‘many-children mothers’
97 Main Indicators of Labour Market in Kazakhstan. StatisticsAgency of Kazakhstan, 2002.
98 Women and Men of Kazakhstan . Gender statistics.Statistics Agency of Kazakhstan, 2003.
CHAPTER 2. POVERTY IN KAZAKHSTAN
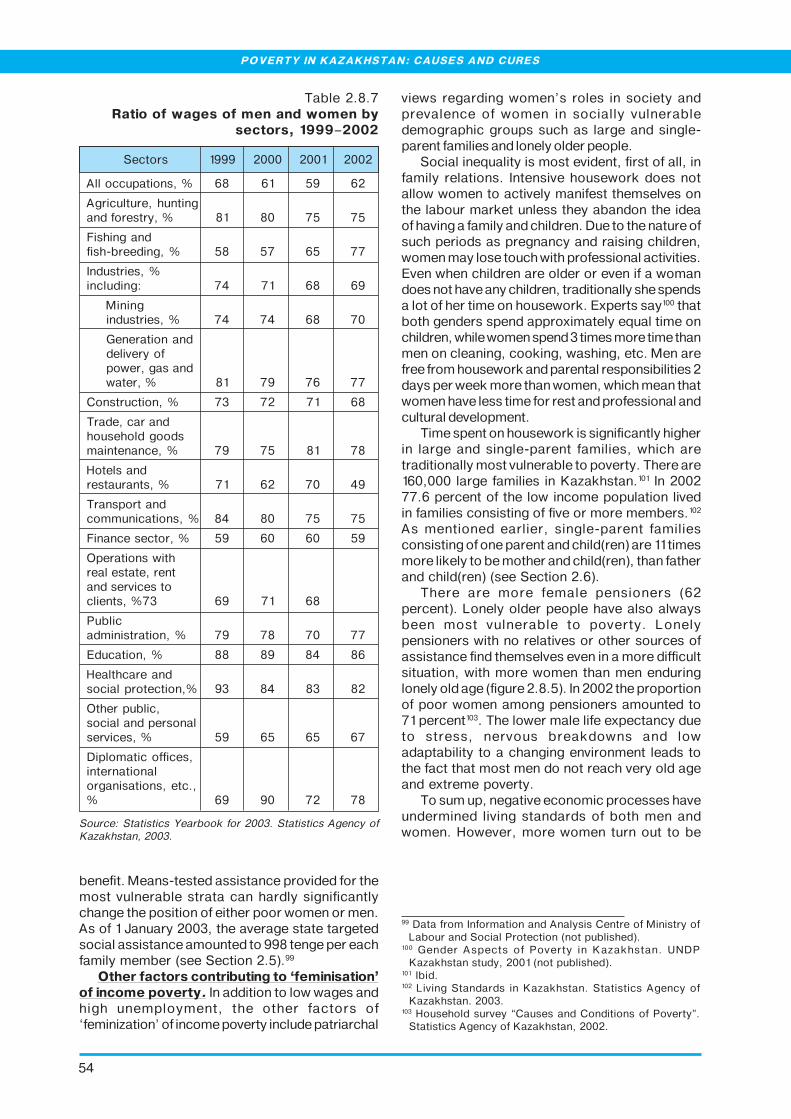
54
POVERTY IN KAZAKHSTAN: CAUSES AND CURES
views regarding women’s roles in society andprevalence of women in socially vulnerabledemographic groups such as large and single-parent families and lonely older people.
Social inequality is most evident, first of all, infamily relations. Intensive housework does notallow women to actively manifest themselves onthe labour market unless they abandon the ideaof having a family and children. Due to the nature ofsuch periods as pregnancy and raising children,women may lose touch with professional activities.Even when children are older or even if a womandoes not have any children, traditionally she spendsa lot of her time on housework. Experts say100 thatboth genders spend approximately equal time onchildren, while women spend 3 times more time thanmen on cleaning, cooking, washing, etc. Men arefree from housework and parental responsibilities 2days per week more than women, which mean thatwomen have less time for rest and professional andcultural development.
Time spent on housework is significantly higherin large and single-parent families, which aretraditionally most vulnerable to poverty. There are160,000 large families in Kazakhstan.101 In 200277.6 percent of the low income population livedin families consisting of five or more members.102
As mentioned earlier, single-parent familiesconsisting of one parent and child(ren) are 11 timesmore likely to be mother and child(ren), than fatherand child(ren) (see Section 2.6).
There are more female pensioners (62percent). Lonely older people have also alwaysbeen most vulnerable to poverty. Lonelypensioners with no relatives or other sources ofassistance find themselves even in a more difficultsituation, with more women than men enduringlonely old age (figure 2.8.5). In 2002 the proportionof poor women among pensioners amounted to71 percent103. The lower male life expectancy dueto stress, nervous breakdowns and lowadaptability to a changing environment leads tothe fact that most men do not reach very old ageand extreme poverty.
To sum up, negative economic processes haveundermined living standards of both men andwomen. However, more women turn out to be
Table 2.8.7 Ratio of wages of men and women by
sectors, 1999–2002
Sectors 1999 2000 2001 2002
All occupations, % 68 61 59 62
Agriculture, huntingand forestry, % 81 80 75 75
Fishing andfish-breeding, % 58 57 65 77
Industries, %including: 74 71 68 69
Miningindustries, % 74 74 68 70
Generation anddelivery ofpower, gas andwater, % 81 79 76 77
Construction, % 73 72 71 68
Trade, car andhousehold goodsmaintenance, % 79 75 81 78
Hotels andrestaurants, % 71 62 70 49
Transport andcommunications, % 84 80 75 75
Finance sector, % 59 60 60 59
Operations withreal estate, rentand services toclients, %73 69 71 68
Publicadministration, % 79 78 70 77
Education, % 88 89 84 86
Healthcare andsocial protection,% 93 84 83 82
Other public,social and personalservices, % 59 65 65 67
Diplomatic offices,internationalorganisations, etc.,% 69 90 72 78
Source: Statistics Yearbook for 2003. Statistics Agency ofKazakhstan, 2003.
benefit. Means-tested assistance provided for themost vulnerable strata can hardly significantlychange the position of either poor women or men.As of 1 January 2003, the average state targetedsocial assistance amounted to 998 tenge per eachfamily member (see Section 2.5).99
Other factors contributing to ‘feminisation’of income poverty. In addition to low wages andhigh unemployment, the other factors of‘feminization’ of income poverty include patriarchal
99 Data from Information and Analysis Centre of Ministry ofLabour and Social Protection (not published).
100 Gender Aspects of Poverty in Kazakhstan. UNDPKazakhstan study, 2001 (not published).
101 Ibid.102 Living Standards in Kazakhstan. Statistics Agency of
Kazakhstan. 2003.103 Household survey “Causes and Conditions of Poverty”.
Statistics Agency of Kazakhstan, 2002.

55
population under 15 (both genders) affected most.About 45 percent of allergic and chronicrespiratory diseases are caused by poorenvironment.
Lack of potable water supply remains an acuteproblem. High disease incidence rates are largelydue to the lack of safe drinking water, as well aspoor status of water supply systems.104 Many peopledrink water, which does not meet sanitary andepidemiologic requirements. Over one third of thepopulation use water that has not been properlypurified. Further 500,000 people have limited accessto drinking water. 19 outbreaks of different infectionstransmitted through bad quality water, includinghepatitis, dysentery and typhoid, were registeredover the last five years. In some regions,consumption of water that does not meet thestandards related to mineralization is linked to highdisease incidence such as urolithiasis andcolelithiasis, heart diseases and digestive systemdisorders. Status of many water sources, as well asthe ground water quality, has worsened due topollution by industrial, municipal, drainage and otherwaste water. Because of this many water sourceshave nearly lost their natural capacity for self-purification and self-renewal.
The safety of piped water depends on thesanitary and technical conditions of waterpipelines. In 2000 the proportion of piped waternot meeting sanitary and chemical standards was9.1 percent, not meeting microbiologic standards– 4.1 percent. Nearly 50 percent of the populationconsumes drinking water not meetingmineralization and hardness standards, with 3.9percent of drinking water not meetingbacteriological standards. Only two thirds ofhouseholds were satisfied with the quality of coldwater.105
Only half of houses (53.7 percent) had tapwater in 2002, which is 14.8 percent lower than in2000, when this figure was the highest. Thenumber of functioning water pipelines decreased;their sanitary and technical conditions worsened.Overall, 13.3 percent of water pipelines were notoperational, with 23.4 percent of them notmeeting sanitary and technical standards.106
Poor status of water supply systems leads toincreased consumption of water from wells,reservoirs and irrigation ditches. However, qualityof ground water has deteriorated, and the majorityof water sources have lost their natural capacityfor self-purification and self-renewal. The
among the poor due to both higher proportion offemale population in the overall population andremaining social and economic inequalities. Genderinequality is backed up by dogmas regardingwomen’s roles in society, which do not go beyondsexual and childbearing functions, as well as labourdiscrimination. The ‘feminisation’ of income povertyand inability of men to provide for their families’ well-being affects the physical and cultural developmentof their children and, as a result, the future of thecountry. Therefore, addressing female povertyshould be a top priority when developing any stateprogrammes for poverty reduction.
2.9 ENVIRONMENTAL ASPECTS OF POVERTY
The country’s environmental situation hasbeen deteriorating rapidly over the last 12-15years. This has negatively affected the health andwelfare of Kazakhstani people and aggravatedpoverty. Life expectancy has fallen, there hasbeen a tendency of depopulation, with groups of
Source: Living Standards of Population in Kazakhstan.Statistics Agency of Kazakhstan, 2003.
Figure 2.8.5The poor by gender and age, 2002
104 Programme on Poverty Reduction for 2003-2005.Approved by Government Decree #296 as of 26 March2003.
105 Living Standards of Population in Kazakhstan. StatisticsAgency of Kazakhstan, 2003.
106 Ibid.
CHAPTER 2. POVERTY IN KAZAKHSTAN
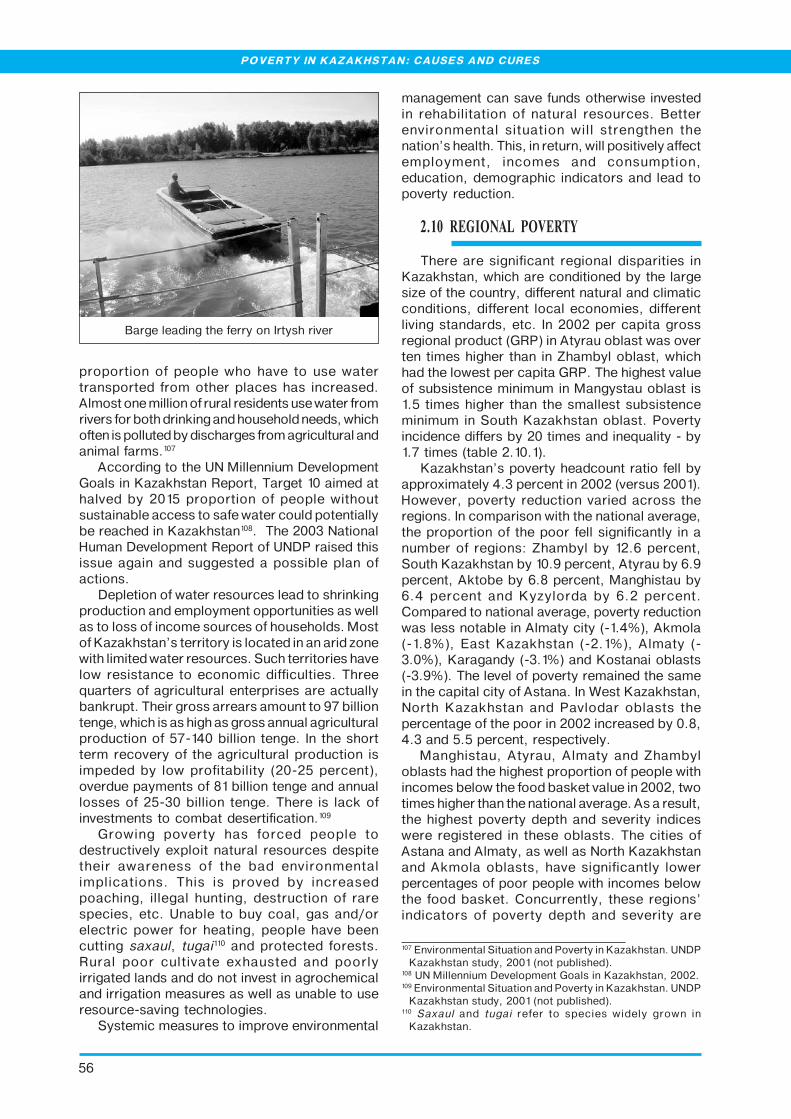
56
POVERTY IN KAZAKHSTAN: CAUSES AND CURES
proportion of people who have to use watertransported from other places has increased.Almost one million of rural residents use water fromrivers for both drinking and household needs, whichoften is polluted by discharges from agricultural andanimal farms.107
According to the UN Millennium DevelopmentGoals in Kazakhstan Report, Target 10 aimed athalved by 2015 proportion of people withoutsustainable access to safe water could potentiallybe reached in Kazakhstan108. The 2003 NationalHuman Development Report of UNDP raised thisissue again and suggested a possible plan ofactions.
Depletion of water resources lead to shrinkingproduction and employment opportunities as wellas to loss of income sources of households. Mostof Kazakhstan’s territory is located in an arid zonewith limited water resources. Such territories havelow resistance to economic difficulties. Threequarters of agricultural enterprises are actuallybankrupt. Their gross arrears amount to 97 billiontenge, which is as high as gross annual agriculturalproduction of 57-140 billion tenge. In the shortterm recovery of the agricultural production isimpeded by low profitability (20-25 percent),overdue payments of 81 billion tenge and annuallosses of 25-30 billion tenge. There is lack ofinvestments to combat desertification.109
Growing poverty has forced people todestructively exploit natural resources despitetheir awareness of the bad environmentalimplications. This is proved by increasedpoaching, illegal hunting, destruction of rarespecies, etc. Unable to buy coal, gas and/orelectric power for heating, people have beencutting saxaul, tugai110 and protected forests.Rural poor cultivate exhausted and poorlyirrigated lands and do not invest in agrochemicaland irrigation measures as well as unable to useresource-saving technologies.
Systemic measures to improve environmental
management can save funds otherwise investedin rehabilitation of natural resources. Betterenvironmental situation will strengthen thenation’s health. This, in return, will positively affectemployment, incomes and consumption,education, demographic indicators and lead topoverty reduction.
2.10 REGIONAL POVERTY
There are significant regional disparities inKazakhstan, which are conditioned by the largesize of the country, different natural and climaticconditions, different local economies, differentliving standards, etc. In 2002 per capita grossregional product (GRP) in Atyrau oblast was overten times higher than in Zhambyl oblast, whichhad the lowest per capita GRP. The highest valueof subsistence minimum in Mangystau oblast is1.5 times higher than the smallest subsistenceminimum in South Kazakhstan oblast. Povertyincidence differs by 20 times and inequality - by1.7 times (table 2.10.1).
Kazakhstan’s poverty headcount ratio fell byapproximately 4.3 percent in 2002 (versus 2001).However, poverty reduction varied across theregions. In comparison with the national average,the proportion of the poor fell significantly in anumber of regions: Zhambyl by 12.6 percent,South Kazakhstan by 10.9 percent, Atyrau by 6.9percent, Aktobe by 6.8 percent, Manghistau by6.4 percent and Kyzylorda by 6.2 percent.Compared to national average, poverty reductionwas less notable in Almaty city (-1.4%), Akmola(-1.8%), East Kazakhstan (-2.1%), Almaty (-3.0%), Karagandy (-3.1%) and Kostanai oblasts(-3.9%). The level of poverty remained the samein the capital city of Astana. In West Kazakhstan,North Kazakhstan and Pavlodar oblasts thepercentage of the poor in 2002 increased by 0.8,4.3 and 5.5 percent, respectively.
Manghistau, Atyrau, Almaty and Zhambyloblasts had the highest proportion of people withincomes below the food basket value in 2002, twotimes higher than the national average. As a result,the highest poverty depth and severity indiceswere registered in these oblasts. The cities ofAstana and Almaty, as well as North Kazakhstanand Akmola oblasts, have significantly lowerpercentages of poor people with incomes belowthe food basket. Concurrently, these regions’indicators of poverty depth and severity are
107 Environmental Situation and Poverty in Kazakhstan. UNDPKazakhstan study, 2001 (not published).
108 UN Millennium Development Goals in Kazakhstan, 2002.109 Environmental Situation and Poverty in Kazakhstan. UNDP
Kazakhstan study, 2001 (not published).110 Saxaul and tugai refer to species widely grown in
Kazakhstan.
Barge leading the ferry on Irtysh river

57
Table 2.10.1Poverty indicators by regions, 2002
Kazakhstan 24.2 8.9 4,761 6.1 2.2
Manghistau oblast 39.8 20.4 6,453 11.37 4.08
Almaty oblast 36.3 17.0 4,622 10.1 3.81
Zhambyl oblast 35.8 12.9 3,956 8.82 3.14
Atyrau oblast 34.1 17.7 6,045 10.95 4.66
Kyzylorda oblast 32.3 7.8 4,198 6.78 2.09
West Kazakhstan oblast 28.0 7.60 4,876 6.44 2.22
South Kazakhstan oblast 27.5 7.3 3,819 5.73 1.79
Aktobe oblast 22.6 11.6 4,979 6.78 2.78
Kostanai oblast 22.3 12.9 4,515 7.77 3.64
Pavlodar oblast 21.6 8.3 4,790 5.1 1.76
East Kazakhstan oblast 20.0 16.3 4,638 5.1 1.91
Karagandy oblast 19.3 6.5 4,937 4.59 1.56
Akmola oblast 18.6 3.2 4,872 3.3 1.04
North Kazakhstan oblast 14.3 4.1 4,732 3.01 0.94
Almaty city 4.1 0.7 5,212 0.62 0.17
Astana city 2.2 - 4,777 0.25 0.05
Source: Poverty Monitoring Indicators in Kazakhstan. Statistics Agency of Kazakhstan, 2003.
Povertydepth,%
Povertyseverity, %
Subsistenceminimum,
tenge
Proportion of populationwith incomes ( %)
below thesubsistence
minimum
below thefood basket
value
considerably lower than the national average.In 2002 there were no regions in Kazakhstan
with high (six subsistence minimums) and highmiddle (three subsistence minimums) livingstandards (table 2.10.2). According to the table,based on average population purchasingcapacity, living standards of the regions can begrouped into the following three categories: ‘lowmiddle’, ‘middle low’ and ‘low low’.
The highest income purchasing power indexwas recorded in Astana and Almaty cities, whichalso have per capita GRP higher than the nationalaverage. The population of those cities can affordthe comfortable consumption level (see Section1.2). Astana and Almaty cities belong to a groupof regions with low-middle living standards(I). The two largest cities of Kazakhstan withhighest living standards in the country wereexpected to have the lowest poverty level. Indeed,the lowest poverty levels were registered in Astanaand Almaty cities, which constituted 2.2 and 4.1percent of the total population.
Generally, the two cities provide relatively goodconditions for human development. This manifestsitself in the higher life expectancy in Astana andAlmaty, which were 68.6 in 2002. Almaty city hasmany educational institutions of all levels as it
used to be the capital city. Astana on the contraryhas the lowest enrollment rate at all levels ofeducation between the ages 6-24, which constitutedonly 64.3 percent in 2002. This problem is likely tobe transitional, triggered by the high in-migrationrate to the new capital and lack of education facilitiesand infrastructure.
The second group (II) with middle low livingstandards includes 8 northern and central oblasts:Karagandy, East- Kazakhstan, West-Kazakhstan,Pavlodar, North-Kazakhstan, Kostanay, Akmolaand Aktobe oblasts.
Karagandy, East-Kazakhstan, West-Kazakhstan, Pavlodar and Aktobe oblasts areindustrial regions, neither capital city regions, norgas and oil monopolies. All of them, except forthe West-Kazakhstan oblast, have predominantlyurban population, with the working age populationmostly employed in infrastructure. Population’spurchasing capacity is middle low. Due to thelower GRP per capita and income purchasingpower, as well as higher economic inequalitiescompare to group I, these oblasts have notablyhigher poverty incidence. In 2002 the povertyheadcount ration in this group fluctuated between 28(West-Kazakhstan oblast) and 19.3 percent(Karaganda oblast).
CHAPTER 2. POVERTY IN KAZAKHSTAN

58
POVERTY IN KAZAKHSTAN: CAUSES AND CURES
Table 2.10.2Regional indicators, 2002
Three regions in this group, namely, Kostanai,Akmola and Northern-Kazakhstan are agricultural.The lower GRP per capita is explained by thepredominantly agricultural economies in theseregions. Incomes of the three oblast residents aregenerated from agricultural activities and householdland plot. Poverty level in these three oblasts matchesthat of the other oblasts in this group. The North-Kazakhstan oblast ranked lowest on povertyincidence (14.3 percent), owing to the lowesteconomic inequalities in the group.
Life expectancy at birth was almost the same for
all the oblasts in Group II, ranging from 64 to 65.6years. This is lower than in Group I, due to poorerliving conditions of the residents (health care, housingconditions, etc.). Educational problems in theregions differ, from lowest coverage of children andyoung people at the age of 6 to 24 by education inAktobe oblast to the highest in the East Kazakhstanoblast. This is conditioned by many (contradicting)factors such as lack of educational institutions, bigdistances between settlements and oblast/rayoncentres, early employment as well as preference toobtain education outside the oblast.
Kazakhstan 1,36 1645,8 24,2 0,312 65,8 75,4
I. High (morethan six SM) No
II. Highmiddle(3-6 SM) No
1 Astana city 2,83 2535,7 2,2 0,300 68,6 64,3
2 Almaty city 2,02 2921,4 4,1 0,238 68,6 107,3
IV. Highlow(1.7-2 SM) No
3 Aktobe oblast 1,57 1638,4 22,6 0,328 64,0 63,4
4 East Kazakhstan oblast 1,57 1144,8 20,0 0,337 65,0 71,8
5 Karaganda oblast 1,54 1497,8 19,3 0,326 64,1 77,6
6 North Kazakhstan oblast 1,43 880,9 14,3 0,282 64,5 69,9
7 Kostanay oblast 1,42 1122,1 22,3 0,335 65,6 68,1
8 Akmola oblast 1,41 941,2 18,6 0,315 64,6 72,9
9 Pavlodar oblast 1,31 1607,3 21,6 0,294 65,3 76,6
10 West Kazakhstan oblast 1,28 2028,7 28,0 0,330 64,5 79,3
11 South Kazakhstan oblast 1,15 640,5 27,5 0,261 66,9 75,2
12 Atyrau oblast 1,14 5628,8 34,1 0,410 64,1 81,6
13 Mangistau oblast 1,14 4073,0 39,8 0,344 64,1 80,7
14 Zhambyl oblast 1,11 525,4 35,8 0,279 66,6 70,3
15 Almaty oblast 1,10 692,9 36,3 0,288 67,3 63,5
16 Kyzylorda oblast 1,04 1148,5 32,3 0,309 65,2 68,1
1iIncome used for consumption.Sources: Living Standards of Population in Kazakhstan. Statistics Agency of Kazakhstan, 2003 Poverty Monitoring Indicators in Kazakhstan. Statistics Agency of Kazakhstan, 2003.
##
Gro
up
ing
of
reg
ion
s b
yp
op
ula
tio
n p
urc
ha
sin
gc
ap
ac
ity Region
Po
pu
lati
on
pu
rch
asi
ng
ca
pa
cit
y (
nu
mb
er
of
SM
in
pe
rc
ap
ita
mo
ne
tary
in
co
me
)1
GR
P p
er
ca
pit
a (
US
D a
t th
ee
xch
an
ge
ra
te)
Pe
rce
nta
ge
of
po
pu
lati
on
wit
hin
co
me
s b
elo
w t
he
sub
sist
en
ce
min
imu
m
Gin
i c
oe
ffic
ien
t b
y 2
0 p
erc
en
tg
rou
ps
Humandevelopment
indicators
Lif
e e
xpe
cta
nc
y a
tb
irth
Pro
po
rtio
n o
fst
ud
en
ts a
t a
ll le
vels
of
ed
uc
ati
on
(a
t th
ea
ge
6-2
4),
%
V. Middlelow(1.3-1.7 SM)
VI. Lowlow (lessthan 1.3 SM)
III. Lowmiddle(2-3 SM)

59
The third group (III) includes SouthKazakhstan, Atyrau, Mangistau, Zhambyl, Almatyand Kyzylorda oblasts. The population purchasingpower was lowest in the country being only 15percent higher than the respective regionalsubsistence minimums. Consequently, the highestpoverty levels were observed in most oblasts: from27.5 percent in South Kazakhstan to 39.8 percentin Mangistau oblast.
Reasons behind high poverty incidence aredifferent. Atyrau and Mangistau oblasts arecountry’s oil-and-gas centres. The oblasts had thehighest per capita GRP, 5-10 times exceeding thesame indicators in other oblasts of the Group III.Industrial production output exceeds that of theagricultural production by 9 times in Atyrau, and by40 times in Mangistau. Those employed in the oil-and-gas sector earn the highest monetary incomesin the country. However, the proportion of employedin this sector was insignificant in the total number ofthe employed. This can be explained by the fact thatthe shift-based employment has been widespreadin the oil-and-gas sector, and lack of employmentopportunities for the local labour. As a result,incomes of the majority of local population remainlow. Therefore, high levels of poverty in Atyrau andMangistau oblasts are due to low purchasing powerof local population and high levels of economicinequalities prompted by monopolistic character ofthe oil-and-gas industry.
Poverty in the southern agricultural regions ofthe country (South Kazakhstan, Zhambyl andAlmaty oblasts) is conditioned by predominantlyrural population with low incomes. Only Kyzylordaoblast has predominantly urban population andsome industries. However, again with only oil-and-gas sectors developing, almost one third of theoblast’s employed are employed in agriculture, whichgenerates little income. This group has relatively lowlevel of economic inequalities as compared to thenational average, but high poverty incidence due tolow purchasing power of the majority of populationin these regions.
To sum up, among the poorest oblasts ofKazakhstan there are both regions with relativelyhigh per capita GRP such as Atyrau and Manghistauoblasts, and regions with low development levelssuch as Almaty, Zhambyl, Kyzylorda oblasts. Forthe former, poverty reduction efforts should focuson pro-poor growth so that the wealth generatedfrom national oil and gas resources benefits the entirepopulation of the regions. This requiresdiversification of their local economies andredistribution of resources for the benefit of the poor.For the latter, creating conditions for acceleratedeconomic growth should become a priority of state’spoverty reduction strategy. In both groups, povertycan be reduced through increased productiveemployment, improved effectiveness of social
security system, infrastructure development andsolution of environmental problems.
Due to differences in population numbers, sizesand compositions of families determined bydemographic processes as well as nationaltraditions, numbers of state targeted assistancerecipients vary significantly across regions (table2.10.3). In 2002 the highest number of statetargeted social assistance recipients resided inSouth Kazakhstan, Almaty and Kyzylordaoblasts: over one third of the recipients. In allseven oblasts of the group III, with the lowest livingstandards (table 2.10.1), the state targetedassistance recipients constituted about 60percent of the total. Another 30 percent oftargeted social assistance recipients resided inthe regions of the group II, and only 10 percentwere the residents of the relatively prosperousgroup I regions.
Table 2.10.3Recipients of state targeted social
assistance by regions, 2002
Oblast Number of recipients,thousand people
Republic of Kazakhstan 1,137.3
South Kazakhstan oblast 164.6
Almaty oblast 132.5
Kyzylorda oblast 130.6
Karagandy oblast 89.9
Aktobe oblast 89.4
East Kazakhstan oblast 88.3
Atyrau oblast 82.8
Zhambyl oblast 82.8
West Kazakhstan oblast 56.4
Pavlodar oblast 55.2
Akmola oblast 42.5
North Kazakhstan oblast 37.1
Manghistau oblast 32.1
Kostanai oblast 31.5
Almaty city 18.7
Astana city 2.9
Source: Information and Analysis Centre of the Ministry ofLabour and Social Protection of Kazakhstan, 2003.
�����
Recent years have seen significant economicgrowth in Kazakhstan, which has been conduciveto overall poverty reduction. Nevertheless, 24% ofthe Kazakhstani population in 2002 lived in absolutepoverty with incomes below the subsistenceminimum of 4,761 tenge, or 31 US dollars per month.
CHAPTER 2. POVERTY IN KAZAKHSTAN

60
POVERTY IN KAZAKHSTAN: CAUSES AND CURES
In addition, more than half of the population was atpoverty risk as they had low incomes (higher thanthe survival level but lower than twice the subsistenceminimum), which were not sufficient for the decentstandard of living. The percentage of the populationwith incomes below the food basket level wasdeclining slowly, signaling the continuing threat ofmalnutrition. There were significant variations ofpoverty incidence from region to region. Ruralpoverty was twice as high as in the urban areas.Women tend to be poorer than men.
The main causes of poverty are unemploymentand low incomes. Despite increasing employmentand average incomes, the situation in the labormarket is not conducive to poverty reduction. Thereport shows that in 2002 over 44% of employeesreceived low wages, which did notprovide for anadequate standard of living, neither for theemployees nor for their families. Furthermore,despite positive macroeconomic changes, theproportion of low-paid employees has remainedmore or less constant. The purchasing power ofsalaries in many sectors of the economy rangesfrom low to medium. Only in the finance sectorand mining industries is the purchasing power ofsalaries high. The proportion of employed personswho are self-employed has now increased to40%. This significant increase in the number ofself-employed people brings additionaldevelopment challenges such as the low wagesthey typically earn and insufficient coverage bysocial security schemes.
Unemployment remains a serious socio-economic problem. Despite falling unemploymentrates, the problems of unemployment amongyouth and women, unemployment in rural areas,and chronic long-term unemployment for manypeople persist.
Furthermore, the report indicatesdisproportionately high growth in gross capitalformation, exceeding the growth in expenditureson household consumption both in absolute termsand as a growth rate. This discrepancy needs tobe further investigated to ensure a good balancebetween investments in physical infrastructureand already low individual incomes, primarilysalaries and wages.
In the field of education there are two majorchallenges for the poor: low quality and accessto education, particularly in remote rural areas.This is relevant for all levels of education.Kazakhstan has achieved the MillenniumDevelopment Goals of providing universal primaryeducation and eliminating gender disparities inprimary and secondary education. However,enrolment rates are slipping, and the lack ofschools and teachers has become a problem,particularly in remote rural areas. Furthermore, theeducation system still fails to provide for the
development of a wide range of life skills, focusinginstead on providing children with theoreticalknowledge rather than preparing them for livingin the real world, interacting freely with other peopleand being good citizens.
In recent years, the profiles of graduates fromhigher and vocational education institutions haveprogressively failed to meet the demands of thelabour market. Large discrepancies persist betweenthe graduates’ qualifications and the demands of adeveloping economy. Basic vocational training failsto supply the economy with qualified workers. Inmost sectors earnings of employees do not reflecttheir qualifications and professionalism, thusundermining incentives for better performance. Themajority of qualified graduates do not enjoy adequatepay-offs in comparison with personal andgovernment investment in their education. In manycases, financial responsibilities for extended familiesfurther aggravate the situation.
Currently, state social benefits and targetedsocial assistance have failed to provide for decentliving standards for their beneficiaries. In order toreduce the poverty risk faced by people the socialsecurity system, including the pension system,needs to be improved in terms of targeting andefficiency.
The poor also face serious challenges relatedto health. The recent deterioration of many healthindicators in Kazakhstan was caused by thefollowing factors: reduced public spending onhealth care, decreasing numbers of qualifiedphysicians, deteriorating health care facilities,insufficient preventive measures, low quality ofmedical services, environmental degradation, andlow cultural commitment to healthy lifestyles. Therange of free health care services guaranteed bythe state tend to be low quality. Hence the poorwho cannot afford to pay for medical services donot receive adequate treatment/prophylactics.Most medical insurance schemes are notaffordable for the majority of population.
Poverty is also related to migration anddemographic factors. High emigration can leadto a so-called “brain drain.” Immigration coupledwith internal migration affects the living conditionsof migrants, in particular oralmans (repatriates) andrefugees. Migration from rural to urban areas (highurbanization rates) aggravates urban poverty.Large families with many children further increasethe risk of poverty, especially in rural areas. Othervulnerable groups are single-parent families, theelderly and the disabled.
Both women and men were affected by theeconomic transition. However, women make upa larger proportion of the poor because, first, theyconstitute a larger proportion of the overallpopulation and, second, they are subject topersistent social and economic inequalities.
61
Gender inequality is reinforced by traditionalstereotypes restricting women’s roles toreproductive functions coupled with hiddendiscrimination in employment. Therefore,addressing female poverty should be a top prioritywhen developing any state programme for povertyreduction.
Environmental quality has plummeted inKazakhstan, affecting people’s health and well-being as well as increasing poverty. During the1990s, two interconnected environmentalproblems became apparent: environmentaldegradation undermined people’s health and well-being and, in turn, poverty aggravatedenvironmental problems. High morbidity rates arecaused in part by the lack of potable water as wellas poor conditions in many water supply systems.Potable water supply is high on the nationaldevelopment agenda.
Finally, there are significant differences inpoverty between regions. Gross regional product(GRP) per capita varies from region to region.However, a high level of economic developmentin a region does not necessarily result in improvedliving conditions for its residents. In Kazakhstan,
both advanced regions (Mangistau and Atyrau) andless developed ones (Almaty, South Kazakhstan,Zhambyl and Kyzylorda oblasts) have among thehighest levels of poverty in the country. In the former,the redistribution of revenues from oil and gasextraction to benefit the entire local population,including the poor, should become a key strategyfor poverty reduction. In less developed regions withhigh poverty levels, state interventions should aimat accelerating economic growth. In both cases,productive employment opportunities, enhancedsocial security systems, improved socialinfrastructure and solutions to environmentalproblems are key elements in reducing poverty.
In summary, the impact of the recent economicgrowth, largely driven by the oil and gas sector,on the living standards of Kazakhstani populationcould have been stronger. To ensure sustainableimpact of economic growth on people’s well-being, national revenues should be used moreprudently. Given the favourable macroeconomicsituation in Kazakhstan, increased publicspending on education, health care and socialsecurity should become another importantcomponent of national social policy.
CHAPTER 2. POVERTY IN KAZAKHSTAN

62
POVERTY IN KAZAKHSTAN: CAUSES AND CURES
3.1 COMPARING URBAN AND RURALPOVERTY
In Kazakhstan, as in many other countries, therisk of poverty is higher for people living in ruralthan urban areas (figure 3.1.1). The rural povertyincidence1 was 34.7% in 2002, which is twice ashigh as in urban areas (15.6%). The ratio ofKazakhstan’s urban and rural human povertyindex (see Section 2.1.1) was 1.24 in 2001 (27.6and 22.1% respectively).2 This was conditionedby relatively higher incomes and better educationof urban residents.
The rural poverty is also deeper than in urbanareas: the average per capita incomes of the ruralpoor are much lower than the subsistenceminimum. Incomes of the poorest urban residentsare at least 60 percent higher than those of thepoorest rural dwellers (table 3.1.2). Accordingly,in 2002 the rural poverty depth index was 9.0percent (compared to 3.6 percent in urban areas),and rural and urban poverty severity indices were3.4 and 1.3 percent respectively3.
Regional poverty distribution indicates that in2002 the highest urban poverty levels were inAtyrau, Mangistau and Zhambyl oblasts, whileAstana and Almaty cities as well as the NorthKazakhstan oblast had the lowest proportion ofpeople living below subsistence minimum (figure3.1.1). The highest level of rural poverty wasregistered in Manghistau oblast where nearlyevery rural resident is poor, i.e. has income belowthe subsistence minimum. In 2002 the proportionof rural poor in this oblast was 84.6 percent (figure3.1.1).
The profiles of urban and rural poverty differslightly. Irrespective of the place of residence, thepoor in Kazakhstan are made up of working-agepopulation (both unemployed and employed withlow incomes) and children under 16 (table 3.1.1).In rural areas, there are slightly more childrenamong the poor, which is because of the highernumber of large families in rural settlements.
CHAPTER 3. SPECIFICS OF URBAN AND RURAL POVERTYIN KAZAKHSTAN
Figure 3.1.1Urban and rural poverty by regions, 2002
Source: Living Standards of Population in Kazakhstan.Statistics Agency of Kazakhstan, 2003.
1 Poverty incidence refers to the proportion of populationwith incomes below the subsistence minimum.
2 National Human Development Report 2002 for Kazakhstan‘Rural Development in Kazakhstan: Challenges andProspects’. UNDP Kazakhstan, 2002.
3 Poverty Monitoring Indicators in Kazakhstan. StatisticsAgency of Kazakhstan, 2003.

63
Salaries and pensions are main sources ofincome for both rural and urban population.However, for rural residents self-employment andconsumption from their household land plots ismore important than for their urban peers (table3.1.2).
Table 3.1.1Who are the urban and rural poor, 2002
Categories of poor population Urban Ruralpoor poor
Poor population including: 100 100
Working-age population(including employed andunemployed) 59.0 56.8
Children 31.3 35.1
Pensioners 9.6 8.1
Source: Household budget survey by Statistics Agency ofKazakhstan
Both urban and rural residents have only littlesavings, as they have to spend most of theirincomes on consumption. The poorest residentsspend 97-98 percent of their income onconsumption, and the richer - 94 percent.Regardless of the place of residence, the poortend to spend more on food (57-59 percent of totalconsumption expenditure); the richer spend more(50-54 percent) on non-food goods and services(figure 3.1.2 and figure 3.1.3). The proportion ofexpenditure on services (19-23 percent) is similarfor both poor and richer households due to highcosts of utilities and transport throughout thecountry.
Table 3.1.2Income sources of urban
and rural poor, 2002
Income sources Urban RuralPoor, % of Poor, % oftotal urban total rural
respondents respondents
Paid employment 68.5 62.8
Self-employment 13.9 19.4
Pension 33.2 37.2
Stipend 1.0 0.2
Foodstuffs fromhousehold’s land plot 26.4 59.8
Selling products fromhousehold’s land plot 4.5 21
Income from property 0.6 0.5
Assistance of relatives,friends 18.3 14
Social assistance 12.3 14.5
Short-term services 9.0 11.5
Other 9.8 9.2
Source: Living Standards of Population in Kazakhstan.Statistics Agency of Kazakhstan, 2003.
On average, monetary incomes are 2.3 timeslower in rural than in urban areas. Subsequently,rural expenditures for consumption are twice aslow compared to the urban pattern.4 Incomes ofthe poorest rural households constitute 75percent of the incomes of the poorest urbanresidents (table 3.1.3).
Table 3.1.3Comparing incomes of urban
and rural poor, 2002
Urban Rural Urbanhouseholds, households, to rural
tenge tenge incomeratio
Incomes ofthe poorest10% of thepopulation 21,070 13,090 1,61
Incomes ofthe poorest20% of thepopulation 27,164 16,080 1,69
Source: Living Standards of Population in Kazakhstan,Statistics Agency of Kazakhstan, 2003.
Residents of Beskaragay rayon,East Kazakhstan oblast
4 Poverty Monitoring Indicators in Kazakhstan. StatisticsAgency of Kazakhstan, 2003.
CHAPTER 3. SPECIFICS OF URBAN AND RURAL POVERTY IN KAZAKHSTAN

64
POVERTY IN KAZAKHSTAN: CAUSES AND CURES
Figure 3.1.2Urban household consumption
expenditure pattern, 2002
Source: Living Standards of Population in Kazakhstan.Statistics Agency of Kazakhstan, 2003.
nutrition model’) than the general population ofthe country. Furthermore, given their relativelylower incomes of rural households tend toconsume less meat and dairy products, eggs, fruitand vegetables compared to urban households.Despite the higher share of consumption fromhousehold land plots among the rural households(60 compared to 26 percent in urban areas), itdoes not provide for adequate nutrition (table3.1.4).
Figure 3.1.3Rural household consumption
expenditure pattern, 2002
Source: Living Standards of Population in Kazakhstan.Statistics Agency of Kazakhstan, 2003.
Overall, food consumption increases as thehousehold’s income grows. As mentioned inSection 2.1, the poor consume relatively morebread products and cereals (‘carbohydrate
Table 3.1.4Level of well-being of the poor, 2002
Rural Urbanpoor poor
responses, responses,% %
Low income notsufficient even foradequate nutrition 12.8 18
Earned income providesfor food only with otherbasic needs beinglargely unmet 38.3 39.8
Earned incomeprovides for adequatenutrition, however,can neither buy clothingand footwear nor ableto pay for services 33.4 28.1
Needs of adequatenutrition, clothing,footwear and buyingservices are met toa certain extent 13.3 12.2
Earned incomeis enough for adequatenutrition, clothing,footwear, buyingservices and forpurchase of somedurables (such asdomestic appliancesfor instance) 1 1
No financial problems 1.2 1
Source: Living Standards of Population in Kazakhstan.Statistics Agency of Kazakhstan, 2003.
Income inequality in urban areas is slightlyhigher than in the rural ones: in 2002 the gapbetween the richest and poorest 10 percent of theurban population (assets coefficient) was 9 times,while in the rural areas it was 8 times.5
The gap between rural and urban unemploy-ment significantly widened in 2001 and 2002
5 Living Standards of Population in Kazakhstan. StatisticsAgency of Kazakhstan, 2003.

65
(figure 3.1.4) with rural unemployment shrinkingand becoming lower than in the urban areas. In2002 the unemployment rates in urban and ruralareas were 10.9 and 7.4 percent respectively.Urban residents accounted for 66 percent of thetotal number of the unemployed. In rural areasthe problem of unemployment is also acute as thenumber of employers is so limited that peoplecannot effectively search for a job.
The proportion of population living in urbancompared to rural areas has almost not changedduring last years. In 2002 the urban populationaccounted for 56 percent, whereas the ruralpopulation amounted to 44 percent of the totalpopulation (table 3.1.5. and see section 2.6).
The natural increase of rural population barelyexceeds the number of out-migrants. Internal
Figure 3.1.4Urban and rural unemployment
Source: Poverty Monitoring Indicators in Kazakhstan.Statistics Agency of Kazakhstan, 2003, p.63.
Table 3.1.5Rural demographics by regions, 2001
Proportion of rural Rural areas, Density of rural Ruralresidents, % thousand square population, people population
km per square km growth
Kazakhstan 44 2,648.6 2.8 7.7
Akmola 60,0 121,1 3,6 ...
Aktobe 44,9 298,1 1,0 4,2
Almaty 71,4 220.2 6.2 5.8
Atyrau 41,7 115.1 1.6 10.3
East Kazakhstan 55,0 251.6 3.2 -1.2
Karagandy 27,7 416.2 0.9 -0.5
Kostanay 58,4 185,3 3,0 -0,9
Kyzylorda 67,5 409,6 1.8 15.3
Mangistau 28,4 148,6 0,6 ...
North Kazakhstan 72,0 97.8 5.0 -1.5
Pavlodar 32,0 97,5 2,5 1,3
South Kazakhstan 64,4 116.4 11.3 15.6
West Kazakhstan 58,4 150.6 2.3 ...
Zhambyl 54,7 144.0 3.7 ...
Source: Atlas: Rural Development in Kazakhstan. UNDP Kazakhstan, 2003.
migration from rural to urban area is promptedby population’s strife for higher standard of living.In general, such migrants contributed to the ranksof the poor among the urban population.
Changes of the demographic situation in therural areas are largely conditioned by majorchanges in the reproductive behavior: birth ratescontinue to decline. The UNDP survey indicatedthat in 2002 a quarter of rural families (25.9percent) had 2 children, 22.2 percent - 3 childrenand 14.8 percent - 4 and more children. Childrenunder age of 7 out-number those aged 8-16, whichindicates a downward trend in rural birth rates.6
In rural areas, the proportion of children and
adolescents under 15 years is 8.5 percent, whichis higher than in urban areas, and the proportionof people aged 15-59 years is 6.4 percent lower.These are another factors increasing the risk ofpoverty among rural residents.
Further, poor health status and bad housingconditions contribute to poverty. Majority of urbanhouseholds (over 80 percent) identified lack ofmoney to receive paid-for health care as the keyreason for not accessing high-quality health careservices (table 3.1.7). Nearly 46 percent ofhouseholds cannot afford to buy medicines.
6 Findings of sociological survey of rural rayons by UNDPKazakhstan, 2002.
CHAPTER 3. SPECIFICS OF URBAN AND RURAL POVERTY IN KAZAKHSTAN

66
POVERTY IN KAZAKHSTAN: CAUSES AND CURES
Table 3.1.6Access to free-of-charge medical
treatment, 2001
Accessibility of Urban poor Rural poorfree-of-charge Medical responses, responses,Treatment % %
Households who facedhealth problems 68.8 56.6
including:
Families who receivedmedical treatment 42.5 44.6
Families who did notreceive medicaltreatment 34.2 33.1
Families who receivedpartial medical care 23.3 22.3
Source: Living Standards of Population in Kazakhstan.Statistics Agency of Kazakhstan, 2002.
The poor believe that increased salaries andpensions as well as expanded employmentopportunities would help improving their financialposition (table 3.1.9). Both urban and rural poorconsider increased salaries as the most importantfactor to improve their living standard. The secondmost important factor for them is the availabilityof jobs. The significantly higher proportion of ruralrespondents pointing to this factor indicates that‘availability of jobs’ has become an acute issuein rural areas.
Table 3.1.8Housing conditions of poor
households, 2002
Are the household Urban Ruralmembers satisfied with responses, responses,their housing conditions % %
Are not satisfied withtheir housing conditions 32.1 24.5
Are satisfied with theirhousing conditions 65.6 72.7
Difficult to answer 2.3 2.8
Source: Living Standards of Population in Kazakhstan.Statistics Agency of Kazakhstan, 2003.
Table 3.1.7Access to healthcare services, 2001
Reasons why household Urban poor Rural poormembers lack access responses, responses,(or have restricted % %access) to health care
Lack of money to accesspaid services 80.2 74.3
Lack of free medicalservices 7.3 12.4
Lack of requiredprofessionals 2.1 5.5
Lack of time to undergotreatment 1.8 3.3
Other (self-treatment,use of alternativemedicine, lack of moneyfor comprehensive care,etc.) 8.6 7.6
Source: Living Standards of Population in Kazakhstan.Statistics Agency of Kazakhstan, 2002.
Table 3.1.9Factors to improve people’s well-being
(as perceived by the poor), 2002
Identified factors Proportionof responses (%)
Urban Ruralpoor poor
Availability of jobs 29.3 40.4
Professional growth 2.2 1.4
Increased salaries 49.9 42.5
Increased pensions 13.2 10.2
Start-up capital (loans)to set up own business 1.4 1.8
Small business loans 0.4 1.1
Receive land to cultivate 0.1 0.4
Improved health status 1.6 1.3
Migration within country(from urban to ruralareas and vice versa) 0.0 0.2
Emigration 0.4 0.1
Increased socialbenefits 1.0 0.3
Increased targetingof social assistance 0.3 0.2
Other 0.2 0.1
Source: Living Standards of Population in Kazakhstan.Statistics Agency of Kazakhstan, 2003.
3.2 CRISIS OF COMPANY TOWNS
Urban poverty is most severe in the so-called‘company towns’.7 In the centrally plannedeconomy the company towns performed well, butafter the collapse of the Soviet Union these citiescould not adapt to the new conditions. Thesituation in company towns differs by the severityof crisis of the local economy, availability ofnatural and productive resources, geographical
7 ‘Company towns’ are defined as small cities with less than50,000 people. Their economies as well as socialinfrastructure were during the time of Soviet Union fullydependent on a single large enterprise performance.
67
location, climatic conditions, state ofinfrastructure, etc.
The common problems are as follows:• out-migration of population, particularly of
qualified working age people;• collapse of industrial enterprises, non-
competitiveness of products and lack of theirdemand;
• higher unemployment than the national andregional average;
• low incomes and wages;• dilapidation of public utilities, most of which
were built in the 1960s;• abandoned houses requiring significant
maintenance expenditure;• bad conditions of roads of regional and local
significance coupled with remoteness ofmany cities;
• limited access to safe drinking water;• lack of local budget resources since they are
based on ‘residual’ principle;• environmental challenges.8
The demographic situation in companytowns can be regarded as negative, hamperingtheir economic development. Nevertheless, onefifth of the country’s urban population lives incompany towns. Over the 1995-2000 the numberof residents in such cities and towns fell by 90,000or 4.7 percent. In some towns it fell by 40 percent,whereas the proportion of working age populationfell by up to 27 percent. The labour forceparticipation rate in company towns is 58 percent.This was largely caused by out-migration becauseof economic downturn and shrinking labourmarket. A large proportion of migrants arequalified workers and young people. Accordingto local authorities and people, approximately 10percent of the remaining population of companytowns would migrate but are not able to do sobecause of lack of money (64 percent of therespondents), uncertainty about obtainingemployment in a new place (24 percent) and thepresence of relatives that cannot be left alone (12percent). Increase of population in companytowns is based of in-migration of rural residentsfrom adjacent villages and of forced migrants withpoor skills. This negatively affects the quality oflabour force.
The living standards of people in companytowns depend largely on the state ofinfrastructure, natural and climatic conditions andcapacity for small business development. Thereremain significant disparities in both livingstandards and quality of life in company towns9.The majority of local residents believe that during1995-2000 their living standards either did notchange (20 percent) or worsened (41 percent).Some 39 percent of respondents noted positivechanges in their lives. In some company towns
the proportion of positive responses is even higher:71 percent in Khromtau, 80 percent in Ereimentauand Aris, 93 percent in Turkestan and Prioziorsk.On the other hand, residents of Serebryansk,Karazhal and Arkalyk pointed to deterioration oftheir living conditions. Major problems, in people’sopinion, include improper functioning of the heatingsystems (28 percent of all respondents), irregularwater supply (25 percent), lack of telephoneconnections (19 percent), inadequate energy supply(11 percent), inadequate nutrition (19 percent) andlack of clothes (15 percent). Southern companytowns suffered most from energy supply problems.Such problems are often caused by arrears of largeenergy-users. In Almaty oblast, on the contrary,energy supply has improved. A problem commonto all company towns is access to utilities,especially for low-income groups of population(large families, disabled people, pensioners, etc.)
One third of the residents indicated lack ofemployment opportunities as the main cause ofpoverty in company towns. Also, they pointed tolow salaries and pensions (20 percent); delayedpayment of salaries and pensions (19 percent);costly utilities (17 percent); everyday problems (12percent); poor housing conditions (8 percent) andlow social benefits (5 percent).
The poverty profile is similar to the nationalpoverty profile:
• large families with many children (65percent);
• youth (44 percent);• families with one parent unemployed (38
percent);• children (38 percent);• single parent families (36 percent);• retirees (29 percent);The difficult situation for children and young
people is further aggravated by pessimisticattitudes, lack of opportunities and hope for abetter future.
Reduced access to health care services hasalso negatively affected the standards of living incompany towns. Unavailability of free-of-chargehealth care services, restricted access to thoseservices especially for chronic patients who nolonger can afford medical treatment (95 percentof respondents). The poor cannot afford medicaltreatment in hospitals (only 9 percent ofrespondents were treated in hospitals). In general,54 percent of respondents complained about pooraccess to health care services.
Poverty and low living standards in companytowns are exacerbated by low educational levels:only 5-10 percent holding higher educationdegrees and 15-20 percent have vocational
8 Company Towns Survey. Asian Development Bank, 2002.9 Ibid.
CHAPTER 3. SPECIFICS OF URBAN AND RURAL POVERTY IN KAZAKHSTAN

68
POVERTY IN KAZAKHSTAN: CAUSES AND CURES
secondary education. About 72 percent ofrespondents were not satisfied with the quality ofeducation. The bad quality of education furtherreduces competitiveness of the young people onthe labour market.
Employment and unemployment incompany towns. Currently there are not enoughjobs available for residents of company towns.Industrial enterprises have either shut down orstand idle (the latter refers to approximately 40percent of all enterprises). The number of publicenterprises decreased by 30 percent between1995 and 2000.
Development of private entrepreneurship isconstrained by lack of financial resources andinsufficient knowledge and skills of potentialentrepreneurs. Consequently, more than one third(37 percent) of the labour force in company townsdoes not have secure employment. Smallbusinesses could greatly contribute to povertyreduction in company towns. More than 45percent of respondents expressed their wish toset up their own businesses, however, they areconstrained by lack of start-up capital and limitedaccess to credit resources: high interest rates,lack of collateral, cumbersome credit applicationprocedures and short credit period.
Unemployment in company towns reaches 47percent. The number of unemployed tripled over1999-2000, while the number of registeredunemployed grew 1.5 times. In many companytowns the long-term unemployment persists:nearly 87 percent of the unemployed did not workfor more than 12 months. Even qualified peoplefind it difficult to obtain a job. The majority of theunemployed (59 percent) have secondaryeducation; nearly one third (27 percent) hasvocational education. The number of unemployedwith higher education grew 2.4 times.
The unemployed survive through cultivatinghousehold land plots (26 percent), small retailtrade (24 percent), short-term jobs (22 percent),assistance from relatives (16 percent), sale ofhousehold belongings (6 percent), renting outhouses (over 3 percent) and begging and ‘forced’criminal activities (2 percent).
Incomes of company towns’ residents arelow and do not provide for a decent standard ofliving. Their monetary incomes constitute 30-80percent of the corresponding regional subsistenceminimum. The lowest incomes are in agriculturalcenters, where people cultivate their householdland plots to survive. For example, average percapita incomes in Stepnyak and Derzhavinskamount to 40 and 48 percent of the Akmola oblastsubsistence minimum respectively. In Aralsk,Kyzylorda Oblast, they are equal to 43 percent ofthe corresponding subsistence minimum.
Salaries in company towns are 30-60 percent
10 Company Towns Survey. Asian Development Bank survey,2002.
11 Findings of the sociological survey of rural rayons by UNDPKazakhstan, 2002.
12 In Kazakhstan ‘rayon’ refers to an administrative territorialunit below oblast level.
lower than the national average: in Alga the averagewage constitutes 40 percent of the national average;in Stepnyak - 55; in Abai - 57 and in Arkalyk – 63percent. Many idle enterprises have extensivearrears of wages. In 2000 in Abai it was 101 milliontenge, in Arkalyk – 86, Stepnyak - 12, Alga - 11million tenge.
In 2000 the proportion of population below thesubsistence minimum was 49 percent in Stepnyak,41 in Derzhavinsk, 22.6 in Fort-Shevchenko, 21.8in Shalkar and 17 percent in Aralsk.10
Lack of employment and low incomes result ina high degree of dependency. Almost 44 percentof the local population is dependent on somebodyelse’s support. Only 28 percent of residents ofcompany towns have a wage/salary income andfor more than 15 percent pensions are their mainsource of income. 6 percent of people’s incomecomes from social benefits (monetary and in-kind)from the state and stipends. Only 2 percent of thelocal population run their own businesses and 0.1percent receive income from property.
Low incomes pre-determine the consumptionpattern of poor households; the largest proportionof income is spent for basic needs such as food(53 percent), utilities (34 percent) and transport(8 percent). Only 5 percent of the income remainsfor purchasing clothing, footwear and othergoods. Purchases of furniture and domesticappliances are not at all possible for the poor.
In sum, poverty in company towns is deep andpersistent and leads to destitution and personaldegradation.
3.3 PORTRAIT OF RURAL POOR
In 2002 UNDP supported a survey of ruralareas11 with the aim to assess poverty and livingstandards based on people’s perceptions andexpert opinions. This section is based on thesurvey findings. The findings of the surveyconfirmed that the political and economictransition in Kazakhstan brought about significantchanges to the rural life and prompted multipleproblems. The remoteness of most ruralsettlements (auls) from oblast and rayon12 centersand the poor integration of local economies intonational economic and social processes hasfurther aggravated the challenges of ruraldevelopment (figure 3.3.1).

69
The survey highlighted the following causes ofrural poverty as perceived by rural residents:
• Lack of employment and inability to secure ajob (54.7 percent of the respondents)
Figure 3.3.1Main social and economic problems in
rural areas as identified by people
Box 3.3.1 Rural people about causes of poverty13
>�������������� ��������� ���������������������� �!������"�������K1�&��������������������������H�
��������������� """��������� ����$� �� ����������������������������/""��������6����������������� �
�� ���� �� ������ ������ �������������������L
>���#����$%����� ����������&�"������L9��������������������������������#�����������������������#�����6��
��#��� ������������������ �����������������:�������������������������������#������������ �.�������
�������L�
>�'�����(%������������������ �!������"������L6�����#��� �����������������������������������������������.
������ ������������ �� ����������������� ������'�������""'+"����������������1�����������������������
���������������#�������������#�����.�� ��.�����L�
>���)���$*������+��&���������&�"������L6�����#���������#� ����#�� �����������������������#���������
�������������������������������������������#�������� �#��������6����������##�����������'��� ������L�
>�,�)����-��+��� ��������&�����"������L1���������������� ��������������,'+����������� �����������������
������� �������##���������!!����#���L�
>�.�����/��!����0������� �!������"������L���������������� �����������6�����#����#���������������������
�������������������������1��������������������������������#������ �����������������#������������L�
>�1�.��������� ���0������� �!������"������LE����������� ���� ����� 1����.� ���� �� #������������6��
������� �������������1���������������+"""������������������.������1����������������"""������L�
>�1�1���--���� ���������������������� �!������"������L���������������������������K����'���'���L
�������������#���������������������������� ����#�������������������������� ����4���������������4���
�� ���L�
>�'�����$*������+��&���������&�"������L6�����#���������#����#������������������������������������
���������L�
>�"�� �� ��2��3�#������� ���������0������� �!������"������L5����������� ��� ������������;��#�������
����������6����.� ������������������H��#��������#�������������#������6������������#����������������1
#�������������� ��D����������#���������������������� �L�
>�4�2���! &�5�����������������0������� �!������"�������K6�����������������������������������#����
����������6����#���������������� ��������������5������������������������������� �����������������������
+"����#��������#����&��#���#�����6�����������������������*��� ���$��#��������.���������&���������L�
• Low salaries, pensions and other socialpayments (25.7 percent)
• Prevalence of extended (‘multi-generation’)families with many dependants (non-workingfamily members or relatives, disabled peopleand children) – 20.6 percent
Poverty is further aggravated by poor housingconditions and heating (40 percent), insufficientnutrition (23.8 percent), inability to pay for healthcare services and medicines (18.8 percent), lackof clothing and footwear (17.4 percent).
In the last three years, the living conditions ofthe majority of rural people have not improved (56percent). One third of respondents (32 percent)indicated that their living standards had evenworsened. Only 12 percent of respondentsconsidered that they had become better off.
Rural economy and poverty. Today the oil-and-gas sector (in Atyrau oblast) and trade (insouthern oblasts) are considered most profitable inthe rural areas. However, those sectors fail toprovide a long-term base for revival of rural
Source: Findings of the sociological survey of rural rayons byUNDP Kazakhstan, 2002.
13 Findings of sociological survey of rural rayons, conducted at request of UNDP Kazakhstan in 2002.
CHAPTER 3. SPECIFICS OF URBAN AND RURAL POVERTY IN KAZAKHSTAN

70
POVERTY IN KAZAKHSTAN: CAUSES AND CURES
economies, because they cannot ensure productiveemployment for the rural people. Experts believe thattraditional economic activities such as livestockbreeding, plant growing and public and civil serviceshould be developed to stimulate rural economies.To that end, experts believe that the additional publicinvestments are needed.
To stimulate agricultural development, taxationis perceived as important instrument by the experts(54 percent of responses). Most respondentsunderline that the absence of a state purchasingsystem for agricultural produce has been a majorobstacle for the agricultural development. Due tolimited credit resources the producers are not ableto process the agricultural products, which lowersthe profitability of the agricultural production. Therural people are forced to sell their agriculturalproduce (to intermediaries) often cheaper than theirnet cost. Another issue is the remoteness of mostrural settlements from major roads and markets.
Income of a typical rural household. The surveyidentified the following main sources of rural incomes(figure 3.3.2).
The average per capita monetary income of
Figure 3.3.2Main sources of income
of a typical rural household
Source: Findings of the sociological survey of rural rayons byUNDP Kazakhstan, 2002.
the rural population was estimated during thesurvey (table 3.3.1).14 It showed that the ruralincomes were low, ranging from 852 to 3,285tenge, they also vary from region to region. Thesefigures are lower than the subsistence minimum.
Live without power in Aktasty village,Egindibulak rayon, Karagandy oblast
In the context of very low monetary incomes ofthe rural residents, the households’ land plotshave become an important source of incomes.Generally, 72 percent of respondents pointed tovital importance of household land plots for theirhouseholds’ survival (figure 3.3.4). The leastnumber of such families was identified in Atyrau(20 percent) and South Kazakhstan (23 percent)oblasts. In the regions with lowest estimatedmonetary incomes such as East Kazakhstan (43percent), Karagandy (53 percent) and NorthKazakhstan (77 percent) oblasts they are evenmore important for survival.
Figure 3.3.3Importance of household
land plots for rural people
Source: Findings of the sociological survey of rural rayons byUNDP Kazakhstan, 2002.14 It was defined as average monthly income of a household
per one member including, children and dependants, i.e.the total income of a household for the previous month wassummed up and then divided by the number of householdmembers.
Table 3.3.1Rural incomes as identified
by people, 2002
Oblast Estimated averageper capita income, tenge
Almaty 3,285
Atyrau 1,334
South Kazakhstan 1,115
Karagandy 980
East Kazakhstan 878
North Kazakhstan 852
Source: Findings of the sociological survey of rural rayons byUNDP Kazakhstan, 2002.

71
The survey also showed that in most casesagricultural produce from households land plotsis consumed by the households themselves. Thisis typical for more than half of the households (61percent, table 3.3.3). It should be noted howeverthat some households sell their land plotagricultural produce to intermediaries (privatedealers). However, to estimate the actual size ofsuch transactions was not feasible in the survey.
Table 3.3.2 Importance of household land plots for rural residents by oblasts
(% of respondents having a household plot)
Oblast Could not survive Very important Not very Not importantwithout it but could survive important at all
without it
North Kazakhstan 89% 7% 3% 1%
East Kazakhstan 76% 16% 7% 1%
Karagandy 76% 18% 3% 3%
South Kazakhstan 66% 19% 14% 1%
Almaty 56% 28% 14% 2%
Atyrau 56% 20% 23% 1%
Source: Findings of the sociological survey of rural rayons by UNDP Kazakhstan, 2002.
Assistance in Kazakhstan’ in 2001, which poorlydefined rules and regulations for provision of thestate targeted social assistance as well asintroduced tough registration procedures. Inaddition, the state funding was not sufficient tomeet the demand. Furthermore, only 34 percentof respondents knew the content of the Law on‘State Targeted Social Assistance inKazakhstan’.
The number of people applying for state socialassistance has also been declining because of thefollowing reasons:
• lack of trust that the assistance will begranted (55 percent);
• size of the assistance is low compare to‘application’ costs, e.g. transport costs dueto remoteness of rural settlements fromsocial security agencies located in rayon andoblast centres (40 percent);
• requirement to obtain a number of certificates,which is difficult because of procrastinationand bureaucracy (13 percent).
Consume Sell thethemselves surplus
Average 61% 26%
Almaty 62% 23%
Atyrau 78% 17%
East Kazakhstan 69% 23%
Karagandy 55% 31%
North Kazakhstan 43% 42%
South Kazakhstan 57% 21%
Source: Findings of the sociological survey of rural rayons byUNDP Kazakhstan, 2002.
Table 3.3.3Usage of agricultural produce from
household land plots
Thus, a rural household receives additional in-kind income from its land plots. However, with lowmonetary incomes, it still cannot afford balancednutrition (figure 3.3.5).
Given the higher poverty incidence in ruralareas, the state targeted social assistance ismore important for rural than for urban poor.However, the survey also indicates that theproportion of the poor receiving state targetedsocial assistance has fallen. In 2002 almost halfof the applicants (46 percent) for the state socialassistance did not qualify. This is linked to theadoption of the Law on ‘State Targeted Social
Figure 3.3.4Nutrition deficiencies of rural people
Source: Findings of the sociological survey of rural rayons byUNDP Kazakhstan, 2002.
CHAPTER 3. SPECIFICS OF URBAN AND RURAL POVERTY IN KAZAKHSTAN
Oblast

72
POVERTY IN KAZAKHSTAN: CAUSES AND CURES
Rural unemployment. In rural areas, the labourforce participation rate has been fluctuating over thelast three years due to demographic processes andmigration. Rural unemployment has significantlyundermined the standard of living and quality of lifein rural areas, lowered access of rural population toeducational and healthcare services, and changedtheir reproductive behaviour.
According to the survey, 46 percent of ruralpeople are unemployed. One third of the unemployedof working age are looking for a job and 6 percentwilling to start up their own business. However, 60percent of them are neither seeking job nor want todo so because they don’t believe in the possibility offinding a job in the rural areas (table 3.3.4). Thestate is the main employer for rural people as itprovides 33 percent of all jobs (table 3.3.5).
The survey identified another important factor
that hampers setting up a family or small-scalebusiness or changing life for the better. It is lackof access to education (figure 3.3.5).
Access to health care There are a number of
Table 3.3.4Why unemployed people do not seek a job
No hope Do not know Healthof finding where and problems
a job how to find a job
Average 40% 23% 6%
Almaty 23% 9% 4%
Atyrau 45% 29% 2%
East Kazakhstan 40% 21% 9%
Karagandy 36% 20% 7%
North Kazakhstan 60% 17% 9%
South Kazakhstan 38% 32% 6%
Source: Findings of the sociological survey of rural rayonsby UNDP Kazakhstan, 2002.
Table 3.3.5Main employers in rural areas
Government funded Private sector Farms Self-employmentorganizations
and institutions
Average 33% 29% 22% 16%
Almaty 27% 38% 21% 14%
Atyrau 45% 20% 19% 16%
East Kazakshtan 34% 14% 22% 20%
Karagandy 35% 28% 21% 16%
North Kazakhstan 26% 34% 26% 13%
South Kazakhstan 31% 28% 23% 18%
Source: Findings of the sociological survey of rural rayons by UNDP Kazakhstan, 2002.
• limited access to specialized, and sometimesprimary health care, of rural residents living inremote areas;
• lack of healthy lifestyle culture;• malnutrition and lack of balanced nutrition;• limited access to safe water supply systems;• poor environmental situation;• severe climatic conditions.According to rural residents, the quality of health
care continues to fall. In 6 settlements (out of 36settlements surveyed) there are no medicalattendant’s service delivery points; in 24settlements people lack access to emergency healthcare; in 5 settlements there are no paediatricians;in 13 settlements women lack access to birth deliveryattended by skilled medical personnel, which is onlyavailable in rayon centres. 23 settlements arelocated as far as 30 kilometres from the nearesthospital, 35 kilometres from the nearest polyclinicand 20 km away from the nearest medicalassistant’s services delivery point. 8 settlements donot have pharmacies; hence people cannot buymedicine when needed. Moreover, nearly none ofthe respondents can afford medicines. Due to lackof access to the specialised medical services,
Source: Findings of the sociological survey of rural rayonsby UNDP Kazakhstan, 2002.
Figure 3.3.5Education in rural areas
factors negatively affecting the health status of ruralpeople, including:
• falling living standard and quality of life;
Oblast
Oblast

73
majority of rural people, especially those living 200-500 kilometers away from oblast/rayon hospitals,have to travel to Astana or Almaty to receive therequired specialised medical treatment.
The rural residents seem to be not satisfied withthe rural health care system:
• 74.1 percent of respondents cannot accesshealth services;
• 60.5 percent are not satisfied with the qualityof health services and qualifications of localmedical personnel;
• 70 percent did not receive the guaranteed free-of-charge health care;
• 27 percent received some guaranteed free-of-charge medical care;
• 3 percent received the guaranteed free-of-charge health care.
81 percent of respondents do not know whathealth services are included in the guaranteed set offree-of-charge healthcare. The figure 3.3.7 indicatesthe main factors determining the poor status of therural healthcare.
Access to education. In accordance withnational legislation, the free-of-charge pre-schooling for children aged 5-6 is compulsory inKazakhstan.15 Types of pre-school establishmentsinclude traditional kindergartens, school/nurseries,and schools. According to the survey a number ofchildren aged 1-6 attending pre-school facilities(kindergartens) has decreased. The major causeshave been falling birth rates, negative migrationprocesses and consequences of the ‘optimisation’of the pre-school education. It is more frequently thatchildren from poor rural families do not go to schoolbecause of the low standard of living (62 percent)and insufficient attention of parents towards theirchildren’s upbringing (38 percent). The latter mayeventually result in child neglect and homelessness.
In rural areas, choices of parents and childrenare limited: pre-schooling is provided mainly inschools. Despite the efforts to restore the networkof pre-school facilities, in the 2002-2003 academicyear not all first graders had basic knowledgerequired for schooling: in Almaty oblast - 30.8percent of first-graders, in Karagandy oblast - 84.5percent, in East Kazakhstan - 89.2 percent and inNorth Kazakhstan - 93.1 percent.
There is lack of school facilities in the rural areasof the surveyed regions. Atyrau oblast needs 18primary schools in rural areas, North Kazakhstan –15, Almaty - 6. South Kazakhstan oblast needs 14schools (4 primary, 1 basic secondary and 9secondary), Karagandy oblast needs 3 schools (2primary and 1 secondary). In addition, there is lackof school-based boarding facilities for children fromremote and under-populated rural settlements,which either do not have schools of appropriate levelor any at all.
The absolute majority of the respondents wouldlike to provide for education of their children. 72Source: Findings of the sociological survey of rural rayons
by UNDP Kazakhstan, 2002.
Figure 3.3.6Challenges of rural healthcare
Table 3.3.6School-based boarding facilities in 2002/2003 academic year
Almaty 10 3 7 1,091 211 880 759 145 614
Atyrau 25 1 24 1,639 93 1,546 1,518 93 1,425
East Kazakhstan 25 8 17 6,864 2,011 4,853 1,452 624 828
Karagandy 20 4 16 1,008 530 478 857 395 462
North Kazakhstan 18 3 15 2,584 190 2,394 498 149 349
South Kazakhstan 7 3 4 2,722 1,925 797 543 317 226
Source: Findings of the sociological survey of rural rayons by UNDP Kazakhstan, 2002 (information from Kazakhstan Ministryof Education and Science).
Oblast Schools with boardingfacilities
Students that need to accessschool-based boarding
facilities
Students accessingschool-based boarding
facilities
total urbansettle-ments
ruralsettle-ments
total urbansettle-ments
ruralsettle-ments
total urbansettle-ments
ruralsettle-ments
15 Presidential Decree #3834 dated January 28, 1998 ‘On Measures to implement the Kazakhstan’s 2030 DevelopmentStrategy’.
CHAPTER 3. SPECIFICS OF URBAN AND RURAL POVERTY IN KAZAKHSTAN

74
POVERTY IN KAZAKHSTAN: CAUSES AND CURES
percent of respondents would like their children toreceive higher education. Only 28 percent aim forsecondary education or vocational training for theirchildren. However, access to higher professionaleducation is restricted for many rural people; hencedemand for education cannot be met because ofthe low living standards. Rural people (67 percent)consider that high tuition fees is the main barrier foreducation; 8 percent believe their children shouldwork to earn their living; 8 percent do not have‘connections’ to access free-of-charge education;16 percent complained about the low quality ofeducation in rural areas.
The survey showed that in rural areas, there islack of primary professional education institutions.Not every rayon centre has professional schools and
lyceums. In Almaty oblast there are 12 professionalschools, Atyrau - 5, East Kazakhstan - 13,Karagandy - 6, North Kazakhstan - 17 and SouthKazakhstan - 10. At the same time, the labourmarket of those oblasts need specialists to work incattle breeding and land cultivation.
Rural children have less access to out-of-schooleducation than their urban peers, which is requiredfor development of children’s creative abilities, forvocational guidance and for adapting to social life.In rural areas, there are only musical and sportsschools. None of the rural rayons surveyed has artclubs, classes for young mechanics/naturalists/tourists. The year-round camp operates only inSouth Kazakhstan oblast.
16 Aksakals refer to the elderly of a settlement perceived asinformal community leader.
17 Atlas: Rural Development in Kazakhstan. UNDPKazakhstan, 2003.
18 Information from Ministry of Culture, Information and PublicAccord.
Almaty 9 1 11 6 13 4
Atyrau 3 2 19 12 9 4
East Kazakhstan 10 4 26 13 24 11
Karagandy 11 2 17 3 26 3
North Kazakhstan 3 1 4 3 14 5
South Kazakhstan 10 9 22 10 - -
Table 3.3.7Specialised schools and out-of-school establishments
Source: Findings of the sociological survey of rural rayons by UNDP Kazakhstan, 2002 (information from Kazakhstan Ministryof Education and Science).
Oblast Out-of-schoolestablishments
Types of establishments
specialised schools
musical sports
total in ruralsettlements
total in ruralsettlements
total in ruralsettlements
Social and political life in rural settlements.Majority of respondents (65 percent) are unawareof the work by local authorities: rural people do notperceive local authorities as advocating theirinterests and do not apply to them for help. 34.6percent of respondents believe that to improve theirwell-being they should rely on themselves and ontheir family members, 21.2 percent hope for supportfrom central authorities and 8 percent rely on thework of local authorities. 51 percent of respondentsare convinced that local authorities do not havemeans to help the rural population; hence eachhousehold has to survive on its own.
34 percent of respondents do not believe thattraditional community based organizations such ascouncil of aksakals,16 etc. play a role in their lives,29 percent - play a moderate role, and only 7 percentappreciate work of such organisations. In thiscontext, alternative organizations helping bothpreserve traditions and addressing the most acuterural problems are religious organizations. 72
percent of respondents evaluate performance ofreligious organizations positively. There are morereligious than any other types of non-governmentalorganisations (NGO) in rural areas. For example, inrural areas of Almaty oblast there are 7 branches ofpolitical parties, 88 social movements, 34 rayoncultural centres and 462 religious organisations.17
Rural NGOs constitute only 8 percent ofregistered NGOs in Kazakhstan (3,500 in 2001)with only one third of them actually working18. Thescarcity and underdevelopment of NGOs in ruralareas can be explained by the following:
· lack of information about NGOs in rural areas;· many rural settlements are remote from cities,
which makes it difficult to register an NGO;

75
· there are no adequate physical, financial andother conditions for full-fledged operation ofNGOs in rural areas.19
�����
As mentioned earlier, there are significantdifferences in poverty incidence in rural and urbanareas in Kazakhstan. In 2002 the rural poverty levelwas twice as high as urban poverty. However, theprofile of urban and rural poverty is similar.Regardless of the place of residence, the poor arechildren, unemployed and employed people with lowsalaries and wages as well as the elderly.
Income poverty in urban areas is lower than inrural areas because of the relatively high incomesand educational levels of urban residents. However,income disparities among urban households aremore evident than in rural areas. Urban poverty ismost deep and persistent in so-called companytowns, where it causes destitution and personaldegradation.
The transition caused major changes in the lifeof rural residents and brought about a range of newsocio-economic problems. Rural poverty, as is thecase generally in the country, is caused primarily byunemployment and low incomes. The number ofextended families with many dependents is anotherfactor of rural poverty. The remoteness of most ruralsettlements from oblast and rayon centers and thepoor integration of local economies into nationaleconomic and social processes have further
aggravated the challenges of rural development.Employment opportunities are scant in rural
areas, in particular for young people. The state stillprovides most rural jobs, which are in the socialsector. Given the scarcity of jobs available for ruralresidents, job-hunting fails in most cases. In thiscontext, household land plots have become animportant means of survival for rural families. In mostcases the rural household itself consumes most ofthe produce from the household land plot and only asmall portion is sold. However, self-produced foodis still not sufficient for adequate nutrition.
Other factors negatively affecting the livingstandards of rural residents are degraded physical andsocial infrastructure, the lack of safe drinking andirrigation water, and environmental deterioration. Thedilapidated state of rural roads inhibits the economicdevelopment of many rural settlements. Shrinkingsocial infrastructure (schools, hospitals, cultural andsports facilities) imposes restraints on the access ofrural poor to those services, particularly in remoteareas. Rural people perceive higher education as animportant social goal; still, most of them cannot affordadequate schooling for their children.
The rural population is largely unaware of majornational policies, laws and regulatory instrumentsaffecting their lives. Local authorities appear unableto represent their constituencies in addressing ruraldevelopment issues. Moreover, rural residents donot take active political or social stands and optinstead for a “wait-and-see” position.
19 National Human Development Report 2002 ‘Rural Development in Kazakhstan: Challenges and Prospects’. UNDPKazakhstan, 2002.
CHAPTER 3. SPECIFICS OF URBAN AND RURAL POVERTY IN KAZAKHSTAN
76
POVERTY IN KAZAKHSTAN: CAUSES AND CURES
Poverty is a multidimensional phenomenon thathas deep socio-economic, cultural andpsychological roots. It is conditioned by time andlocation. Historical developments within individualcountries must be taken into account whenmeasuring poverty. Poverty remains a seriousproblem for Kazakhstan. Despite the impressiveeconomic performance since 1999, every fourthperson in the country lives in poverty and is deprivedof opportunities and choices for humandevelopment. The recent economic growth fail tochange lives of the majority of Kazakhstanipopulation for the better. The social consequencesof transition affected negatively the quality as wellas access to health care and educational servicesregardless of where people live: urban or rural area,southern or northern part of the country. With theimpressive economic growth since 1999, there arenow the necessary conditions for sustained solutionof social problems.
Recognizing the poverty problem, theGovernment of Kazakhstan has committed itselfto address the issue. Back in 1997 with the adoptionof the ‘Long-term Development Strategy 2030’,‘public health, education and well-being ofKazakhstan citizens’ were declared among sevennational development challenges. The PovertyReduction Programme for 2003-2005 wasapproved. It considers poverty in the humandevelopment perspective and aims at povertyreduction through creating conditions for economicgrowth, productive employment, increasedpopulation’s incomes, improved poor people’saccess to healthcare and education, socialprotection of the population, increased efficiency ofcivil service with civil society participation in decisionmaking. The Programme is implemented in line withother national and sectoral programmes, i.e.‘Education’, ‘Health of the Nation’, “RuralDevelopment Programme 2004-10’, ‘DrinkingWater 2002-2010’, ‘Programme for CounteractingHIV/AIDS for 2001-05’, and others. Currently, theGovernment of Kazakhstan is formulating mid-termprogrammes in the field of health care, educationand social security, which aim at improving thefunding schemes in these areas.
As many other countries, Kazakhstan hassigned the UN Millennium Declaration committingitself to the achievement of the MillenniumDevelopment Goals (MDG). The country has alreadyachieved two of the Millennium Development Goals:
CONCLUSIONS AND RECOMMENDATIONS
to provide universal primary education and toprovide equal access to education for boys and girls.Two other goals – halving the proportion of people(a) living below the subsistence minimum and (b)without access to safe potable water – will probablybe met by 2015. Other MDGs remain majordevelopment challenges for the nation includingreducing maternal mortality by three-quarters,reducing under-five mortality by two-thirds,reversing the spread of HIV/AIDS, and ensuringenvironmental sustainability. This report has beenprepared in support of the 2002 MDG Report forKazakhstan attempting to provide in-depth analysisof the MDG 1 on poverty and other relevant targets.
Poverty in Kazakhstan as in other CIS countriesis caused in part by the transition: economicrecession, adverse conditions in the labor marketand inequalities in the distribution of nationalwealth, which were triggered by geopolitical andeconomic turmoil during the initial period ofindependence and restructuring. The social securitysystems failed to effectively mitigate poverty. Otherchallenges are falling quality of health care andeducation services, demographic and migrationprocesses as well as gender, regional andenvironmental concerns. The report provides acomprehensive account of those factors to analysethe causes of human poverty and identify possiblecures to remedy the situation.
ECONOMIC GROWTH AND HIGHERINCOMES
As mentioned earlier, the recent years have seensignificant economic growth in Kazakhstan. TheGDP per capita reached the level of USD 1,520 in2002. Notable poverty reduction at every percent ofeconomic growth (in 1999-2002 this proportion was0.65 percent per 1 percent of economic growth) wasconducive to poverty reduction and achieving goalsand targets set by the national Poverty ReductionProgramme and the 1st Millennium DevelopmentGoal on halving poverty by 2015. Over the periodfrom 1996 to 2002 the income poverty level fell from34 percent in 1996 to 24 percent in 2002.
However, 24 percent of Kazakhstani populationin 2002 was still living below the subsistenceminimum of 4,761 tenge, or 31 US dollars per month.More than half of the population was at poverty riskwith low incomes, which were not sufficient for

77
sustaining people’s physical and intellectualcapacities needed for the decent standard of living.
The main causes of such situation areunemployment and low wages. The report indicatesthat the situation on the labor market is notconducive to poverty reduction despite increasingemployment and average incomes. The relativelyhigh proportion of low-paid employees remains moreor less constant. In 2002 over 44 percent ofemployees received low wages, which did notprovide for adequate standard of living neither forthe employees nor to their families. Only in thefinance sector and oil, gas and mining industrieswere decent salaries earned. Despite fallingunemployment rates, the problems ofunemployment among the youth and women,unemployment in rural areas, and chronic long-termunemployment for many people remain. Currently,the long term unemployed constitute 70 percent ofall unemployed. The proportion of self-employedpersons has now increased to 40 percent. Thissignificant increase in the number of self-employedpeople brings additional development challengessuch as the low wages they typically earn andinsufficient coverage by social security schemes.
In other words, the recent economic growthdriven primarily by the oil and gas sector haspositively affected only a small part of theKazakhstani population in terms of increasedincomes and employment opportunities. For furtherreduction of poverty Kazakhstan has to achieve pro-poor sustainable economic growth leading toexpanding productive employment opportunities.Major prerequisites for this are continuingrestructuring of the economy beyond oil, gas andmining as well as consistent growth of processingindustries and economic sectors producing goodsand services for the population.
The other major challenge is the need forsubstantial increase in salaries and wages for atleast half of the employees. This is an indication ofdisproportions in the final uses of GDP and the statebudget resources. The low wages are paid ineducation, healthcare and social security as well asin civil service, which testifies to the unattractivenessof those vital sectors to qualified personnel.Government policy then should aim at raising thereal wages in education, healthcare, social securityand civil service in the first place. Minimum sector-specific wages for major professions can be set uptaking into account job qualities, family structuresand regional living standards. The governmentemployment policy also should envisageintroduction of incentives for the employers, e.g. taxbreaks, subsidies, etc., to create jobs in such sectorsas agriculture, forestry, processing industries andeconomic sectors producing goods and services forthe population. This will lead to expansion ofproductive employment opportunities throughout
the country and help the vulnerable groups ofpopulation. A national employment programmewould prompt the above. Resolving the issue ofincreased number of the self-employed, which earnrelatively low incomes and are not fully included inthe social security system, requires actions aimedat facilitating entrepreneurial activities andenhancing effectiveness and access to credit andmicro-credit resources.
The employment programme should pay specialattention to long-term unemployed and youngpeople. However, traditional employment measures(unemployment benefits, training and retrainingprogrammes for the unemployed, micro-crediting)are not sufficient to solve the problem of the long-term unemployment. Taking into account othercountries experience, it is recommended to establishemployment agencies that can provide consulting,psychological and social rehabilitation services,promote initiative groups of the long-termunemployed to enhance their skills and knowledgein effective job-hunting, as well as provide for qualityprofessional training and retraining. The issue ofyouth unemployment is important to address as itmay lead to persistent poverty in future.
In most sectors earnings of employees do notreflect their qualifications and professionalism, thusundermining incentives for better performance. Themajority of qualified graduates do not enjoy adequatepay-offs in comparison with personal andgovernment investment in their education. Analysisof relationship between the level of education andqualification and remuneration of employees canbecome another tool for formulation of state’sincome-generation policy.
Measures aimed at small and medium enterprisedevelopment are also crucial within the employmentpolicy. Entrepreneurs can be supported through theimproved legislation, taxation mechanisms,accessible credits, less bureaucracy and othermeasures. Labour market diversification will alsosignificantly promote entrepreneurship.
Last but not least, the expenditure on GDP atthe current rate of the gross capital formation needsto be looked into because it is important that theproduction investments do not restrict, to the extentpossible, the social sphere development, includingthe already low individual incomes, primarily salariesand wages.
Given the current national economic needs vis-a-vis labour market as well as the continuing out-migration from Kazakhstan, government is tryingto attracked qualified people to immigrate toKazakhstan especially targeting advancedqualifications is topical for Kazakhstan. Efficientsupport in immigrants’ settlements, specificallyaddressing housing and access to land is to beprovided. Internal migration should also beoptimised.
CONCLUSIONS AND RECOMMENDATIONS

78
POVERTY IN KAZAKHSTAN: CAUSES AND CURES
Gross regional product per capita as well aspoverty incidence varies from region to region inKazakhstan. However, regions with relatively highergross regional product per capita do not necessarilyhave lower poverty levels. Both regions with relativelyhigher GRP (Atyrau and Mangistau oblasts) and lessdeveloped ones (Almaty, South Kazakhstan,Zhambyl and Kyzylorda oblasts) are among theregions with highest incidence of poverty in thecountry. In the former, the redistribution of revenuesfrom oil and gas extraction to benefit the entire localpopulation, including the poor, should become a keystrategy for poverty reduction. In less developedregions with high poverty levels, state interventionsshould aim at accelerating economic growth. In bothcases, productive employment opportunities,enhanced social security systems, improved socialinfrastructure and solutions to environmentalproblems are key elements in reducing poverty.
To address the issue of regional disparities,formulation and effective implementation ofintegrated regional development programmes areessential. Furthermore, reallocation of resourcesbetween regions is instrumental to support theregions lagging behind.
Both women and men were affected by thetransition. However, women are at higher povertyrisk because, first, they constitute a largerproportion of the overall population and, second,they are subject to persistent social and economicinequalities. Gender inequality is reinforced bytraditional stereotypes restricting women’s roles toreproductive functions coupled with hiddendiscrimination in employment. The state should payspecial attention to gender issue by formulating andimplementing gender sensitive legislation andprogrammes.
Poverty assessment and monitoring asimportant part of poverty reduction should not berestricted to income poverty measurement but bebroadened to include the human poverty indicators.In this perspective, indicators reflecting humandevelopment (life expectancy, unemployment,infant mortality, maternal mortality and others) areused to measure poverty along with traditionalmeasures of income poverty such as income levels,subsistence levels, and purchasing power. In facthuman development indicators include the wholerange of Millennium Development Goals and targets.
In summary, the recent economic growth drivenby the oil and gas sector has positively affected onlysmall part of the Kazakhstani population in termsof increased incomes and employmentopportunities. To ensure the sustainable impact ofeconomic growth on people’s well-being, nationalrevenues should be used more prudently. To thatend, the country’s economy should be directedtoward securing productive employment and decentwages. Given the favourable macroeconomic
situation in Kazakhstan, increased public spendingon education, health care and social security shouldbecome another important component of nationalsocial policy.
The Report does not address the issue of physicalinfrastructure. Nevertheless, it is one of the majorfactors affecting poverty in this country, sinceinadequate infrastructure aggravates livingconditions of people, particularly the poor. TheGovernment should commit itself to its solution.
POVERTY AND EDUCATION
Education has a clear and comprehensive effecton quality of life. A higher education level in thecountry - with other factors being equal - should leadto higher labour productivity, increased GDP andreduced poverty. Education provides opportunitiesfor people to realise their capabilities more fully,promoting better prospects for employment, betterfinancial position and reducing the risk of poverty.
Kazakhstan has achieved the MillenniumDevelopment Goals of universal primary educationand gender disparity in primary and secondaryeducation. However, incomplete enrolments inschools are emerging, and the lack of schools andteachers has become a problem, particularly inremote rural areas. The quality of education includingcurricula, textbooks, and teacher qualifications aswell as learning achievements requires urgentattention. Since quality education should not onlyprovide pure theoretical knowledge but also preparea person for living in real world, interacting freelywith other people and being a good citizen, it isimportant to pay special attention to life skillsdevelopment. To reach this goal, the neweducational concept should help inject professionalcreativity and desire for self-education throughoutthe entire life of a citizen. Given Kazakhstan’s desireto create a state with advanced and innovativetechnologies, it is also necessary to focus on theuse of ICT tools and ICT education. Linked to thequality of education, there is a need for improvingthe monitoring system to oversee the schools’performances.
Educational system in Kazakhstan shouldmatch the country’s changing needs and beintegrated into global educational framework.Poverty reduction depends primarily on decreasingthe unemployment. In this context, wider access toquality education should increase the number ofspecialists who will be able to satisfy the needs oflabor market. Today, the vocational educationsystem fails to supply the economy with qualifiedworkers. Therefore one of the priorities is to increasethe number of graduates with vocational educationas well as development of the network of vocationalschools and colleges.

79
At present the involvement by private sector ineducation is very limited but the natural interest thebusiness has in quality and competitive specialistsmust be utilized to a greater extent. The connectionsbetween employers and higher educationalinstitutions can be reinforced through research ofthe labour market demand as well as internshipopportunities at the would-be jobs. The employersalso should promote on-the-job training, which couldbe stimulated by the state through a system ofincentives.
In the field of education there are many challengesfor the poor. While some of these problems could beresolved through building new schools and repairingexisting ones, the overall problem is in developmentof a comprehensive strategy with feasible financialmechanism for its implementation. Within thecurrent educational framework, oblasts areresponsible for education management. However,the lack of coordination between levels of authorityleads to various problems constantly faced bystudents and their parents. It is extremely urgent toanalyze and reform the infrastructure with specialfocus on rural/urban and regional misbalances. Onlya sound decentralized system of educationmanagement will provide for a successful solutionof existing problems and implementation of theeducation reform on a regional level.
The envisaged reform of education will be alsoaimed at improving management capacitiesthrough introduction of democratic principles suchas accountability, effectiveness and transparencyin decision-making and implementation. The role ofcivil society in ensuring these principles at all levelsof education is underestimated in Kazakhstan. Thegrowing role of parent councils, boards of trusteeswill help to ensure better quality of education as wellas taking care of social needs of children: nutrition,access to schools, etc.
To increase the access of the poor to educationthe state should further develop the system ofgrants and credits, since high tuition fees are limitingfor the poor, as well as more opportunities tocombine studies and work, e.g. throughcorrespondence or evening courses. The educationsector problems will not be overcome unless thepublic spending on education is increasedsignificantly. In the developed countries it constitutes5-6 percent of GDP.
POVERTY AND PUBLIC HEALTH
The poor also face serious challenges related tohealth. The recent deterioration of many healthindicators in Kazakhstan was caused by thefollowing factors: reduced public spending on healthcare, decreasing numbers of qualified physicians,deteriorating health care facilities, insufficientpreventive measures, general impoverishment of the
population, environmental degradation, and lowcultural commitment to healthy lifestyles.
During transition, government healthcareexpenditure has reduced almost two times. As aresult, the network of healthcare facilities wasrestructured and ‘optimized’ by reducing the numberof medical establishments, including primarymedical care. The number of physicians and nursesalso has fallen. This negatively affected the qualityof medical care and reduced access to medicalservices, especially for the poor, especially fromremote rural areas. Addressing the challenges in thehealthcare sector is one of the most effective waysto preserve and enhance human capital as well asto reduce poverty.
Currently, state funded healthcare facilitiesprovide only the minimum set of free-of-chargemedical services. The need to pay for many vitalhealthcare services seriously limits the access to thequalified medical care for people with low incomesand the poor. There is a severe lack of preventivemeasures and insufficient healthy lifestyle culture. Itis critical that the awareness on reproductive healthpractices of general population is increased. On topof these, most people are not satisfied with thequality of medical services provided by the medicalpersonnel.
Related to poverty is the issue of malnutrition,which currently affects more than 1 million people inKazakhstan. The proportion of people with incomesbelow the food-basket has been increasing onlyslowly, signaling the continuing threat ofmalnutrition. There is relatively high prevalence ofanaemia, especially among women as well as iodinedeficiency undermining mental health. Theprevalence of underweight, stunting and wastingchildren under age of five is also a big concern.
Environmental quality has plummeted, affectingpeople’s health and well-being. There have been twointerconnected environmental problems:environmental degradation undermining people’shealth and aggravated environmental problems dueto poverty. High morbidity rates are in partconditioned by the lack of potable water as well aspoor conditions in many water supply systems.Potable water supply stands high on the nationaldevelopment agenda. Consumption of drinkingwater of insufficient quality especially in the ruralareas should be halted and reversed.
Improved public health, longer life expectancies,and decreased mortality rates, including infant andmaternal mortality rates, should become prioritiesin state policy. However, to resolve the above issues,the substantially increased funding is needed for thehealth sector. Increased public spending onhealthcare from 2 to 5-6 percent of GDP would matchthe spending in developed countries. Private medicalinsurance schemes can provide an additional sourceof funding for the health sector.
CONCLUSIONS AND RECOMMENDATIONS

80
POVERTY IN KAZAKHSTAN: CAUSES AND CURES
THE ROLE OF SOCIAL PROTECTIONIN POVERTY REDUCTION
Subsistence minimum is an important instrumentof the state social policy when fighting poverty. It isactually used worldwide as a criterion of absolutepoverty and called ‘poverty line’ as it correspondsto the minimum level of income that satisfies verybasic human needs. In Kazakhstan it is also used tomeasure the poverty incidence. However, the currentproportion of food (70 percent) and non-food (30percent) items in the subsistence minimum does notreflect the actual ratio between householdexpenditures for food and non-food goods andservices. At present, even the poor householdsspend more than 30 percent of their income on thenon-food items. It is also recommended to separatethe housing expenses. The report therefore suggeststhat the subsistence minimum needs to be revisedto include the food basket and non-food items andservices at the recommended ratio of 60:40.Currently, the subsistence minimum is calculatedbased on a combined (normative and statistical)approach. Another consideration for the future is touse a normative approach for the calculation of theoverall subsistence minimum (that goes beyond thefood basket). The subsistence minimum will then bebased on the food basket and a set of non-foodgoods and services identified, based on thenormative consumption.
Kazakhstan’s social security system is on theedge. The pension system does not provide decentliving standards for its beneficiaries. Bothcategorical social benefits and new targetedassistance schemes have been so low therefore werenot sufficient for lifting people out of poverty. All theseundermine social security for people facing socialrisks.
Currently, state benefits and targeted socialassistance do not provide for decent livingstandards for their beneficiaries. In order to reducethe poverty risk faced by people the social securitysystem, including the pension system, needs to beimproved in terms of targeting and efficiency.Further, in the future a number of activities needs tobe implemented, including increasing the size ofsocial payments.
Compulsory social insurance should become themajor form of social protection of the population.Social policy should also target gender equality vis-a-vis socio-labour relations. Special attentionshould be paid to large families, especially thoseresiding in rural areas, single-parent families, lonelyolder people, people with disabilities, includingcreating conditions for them to reduce their socialisolation; to immigrants, especially oralmans,refugees and forced migrants for them to settle intothe new location and more effectively use their
professional capacities. State targeted socialassistance (in cash) can be combined with in-kindbenefits of food, non-food items and services forthe poor families, particularly the children.
Social protection legislation should besupportive to family formation to addressdemographic factors of poverty. Increased care forthe family and motherhood as well as childhoodbenefits are needed. Government measures tosystematically provide young families with supportmeasures such as housing allowances and accessto mortgage.
The system of social workers applied in manycountries can be introduced in Kazakhstan. It wouldnarrow the targeting and flexibility of povertyreduction measures, since it presupposes immediateaccess to the poor and the vulnerable includingorphans, homeless children and unattended minors.To that end, necessary legislation should be passed,capacity of local governments built, educationalprogrammes majoring in ‘social work’ introducedin vocational and higher education.
The social services institutions have to bepromoted and quality of their services improved,especially services for the family and children (familyplanning and reproduction centers), as well as socialservices for the youth. Targeting programmes tore-integrate the disabled people into the labour forcewill reduce their dependency on social assistanceand raise spirit.
If the international definition of the poverty line isaccepted, then the necessary changes should bemade to national legislation to set the criteria forthe state targeted social assistance. As theminimum food basket is the most essential part ofthe subsistence minimum, it is recommended thatits value serve as criterion for the state targetedsocial assistance. Indeed persons/households livingbelow this level need some type of assistance fromthe state until they can improve their standard ofliving
CHALLENGES OF RURAL AND URBANPOVERTY
In Kazakhstan, as in many other countries, therisk of poverty is higher for rural than for urbanresidents. The rural poverty incidence was 34.7percent in 2002, which is twice as high as in urbanareas (15.6 percent). This was conditioned byrelatively higher incomes and better education ofurban residents. However, income disparitiesamong urban households are more evident than inrural areas. The profile of urban and rural poverty issimilar. Regardless of the place of residence, thepoor are mostly children, unemployed and employedpeople with low salaries and wages.
Urban poverty is most deep and persistent in so-
81
called company towns, where it causes destitutionand personal degradation. On top of the generalpoverty factors (unemployment and low wages)poverty in company towns persists due to a declininglabour force, low educational levels, lack ofentrepreneurial skills, poor healthcare andcrumbling infrastructure. In many cases povertyaggravates pessimism in the younger generation,undermining their hopes for a better future.
As mentioned earlier, the rural poverty incidenceis higher than the urban. The remoteness of mostrural settlements from oblast and rayon centres andthe poor integration of local economies into nationaleconomic and social processes have furtheraggravated the challenges of rural development.Rural poverty, as is the case generally in the country,is caused primarily by unemployment and lowincomes. Apart from economic factors,demographic factors also affect rural poverty suchas the prevailing number of large extended familieswith high numbers of dependents.
Given very low incomes, household garden plotshave become an imperative means of survival in ruralareas. In most cases the rural household itselfconsumes most of the produce from the householdgarden plot and only small portion is sold. This,however, does not suffice for adequate nutrition.Employment opportunities are scant, in particularfor young people. The state still provides most ruraljobs, which are in the social sector. Given thescarcity of jobs available for rural residents, job-hunting fails in most cases.
Other factors negatively affecting the livingstandards of rural residents are degraded physicaland social infrastructure, the lack of safe drinkingand irrigation water, and environmentaldeterioration. The dilapidated state of rural roadsinhibits the economic development of many ruralsettlements. Shrinking social infrastructure (schools,hospitals, cultural and sports facilities) imposesrestraints on the access of rural poor to those services.
State support to rural development should beaimed at reviving traditional economic activitiessuch as livestock breeding, land cultivation as wellas public and civil service. To that end, the additionalpublic investments are needed. In addition, taxationpolicy should be made conducive to agriculturaldevelopment. The issue of the state purchasingsystem for agricultural produce needs to be lookedinto. The state has to create a framework for easyaccess to credit resources, including micro-lending,for the agricultural producers to raise the profitabilityof the agricultural production. Apart from credits,consulting in veterinary, zoo-technical, agronomic,marketing and information services will be of help.
In the long run, this will change rural residents’lifestyles, enlarge employment base and foster self-employment of the rural poor.
INSTITUTIONAL FRAMEWORKFOR POVERTY REDUCTION
A concerted effort by the government and aclear-cut distribution of roles are prerequisites foreffective poverty reduction. At the central level,basics for the poverty reduction policies should belaid down, sources and mechanisms of fundingdefined, legislative framework developed, andcommon monitoring mechanisms to measurepoverty from the human development perspectiveapplied. At the local level, clear mechanisms ofnational poverty reduction policy implementationshould be set forth including efficient resourceallocation. State taxation policy is an importantmechanism of national wealth redistribution. Thestate shall provide the taxpayers with informationon how the revenues generated through taxationare re- allocated.
Civil society organizations should take an activestance along with the government in addressingpoverty reduction issues. These include researchinstitutes and non-governmental organizations aswell as religious organizations. Setting up a researchcenter on poverty reduction under the governmentwould be a justified measure. Charity organizations,traditional charity activities on the part of religiousorganizations, non-governmental organizationsparticipation in discussions on poverty issues,trainings, pro-poor social projects and othersmeasures would foster national initiatives on povertyreduction. An important role should be given todeveloping civil dialogue and promoting tradeunions: socio-labour relations should be stipulatedvia agreements between trade unions, employerassociations and the government. The mass mediais an important vehicle for increased transparencyand democratic participation. Donor assistance interms of credits and technical support will enlargethe funding base and build on civil society capacitiesby referring to international experience in povertyreduction. Efficient local government based onmaterial and financial resources matching spendingauthority with profitable resources. Both poor andnon-poor people’s social involvement, localcommunity mobilization, initiative groups and self-help groups’ promotion are prerequisites for inclusivedecision-making, which would ultimately affectpeople’s living standards.
CONCLUSIONS AND RECOMMENDATIONS

82
POVERTY IN KAZAKHSTAN: CAUSES AND CURES
BIBLIOGRAPHY
LEGAL ACTS OF THE REPUBLIC OF KAZAKHSTAN
1. Law on ‘Subsistence Minimum in Kazakhstan’, as of 16 November 19992. Law on ‘State Targeted Social Assistance in Kazakhstan’, as of 17 July 20013. Law on ‘Special State Benefits in Kazakhstan’, as of 5 April 19994. Law on ‘State Social Benefits to Disabled, Loss of Breadwinner, and by Age in Kazakhstan’, as
of 16 June 19975. Law on ‘Pensions in Kazakhstan’, as of 20 June 1997.6. Law on ’Labour in Kazakhstan’, as of 10 December 19997. Law on ‘Employment in Kazakhstan’, as of 23 January 2001.8. Law on ‘Republican Budget for 1999’9. Law on ‘Republican Budget for 2000’10. Law on ‘Republican Budget for 2001’.11. Law on ‘Republican Budget for 2002’12. Law on ‘Republican Budget for 2003’13. Law on ‘Population Migration in Kazakhstan’, as of 13 December 199714. Law on ‘Education in Kazakhstan’, as of 7 June 199915. Law on ‘Housing Relations in Kazakhstan’ as of 16 April 1997.16. ‘Determining the Poverty Line’. Government’s Decree #537 as of 8 April 200017. ‘Measures to implement the Kazakhstan’s 2030 Development Strategy’. Presidential Decree
#3834 as of January 28, 1998.
STATE STRATEGIC AND PROGRAMME DOCUMENTS OF KAZAKHSTAN
1. Nursultan Nazarbaev. Kazakhstan-2030. Welfare, Security and Growth of Well-being of allKazakhstanis: Presidential Address to the People of Kazakhstan. Almaty, 1997.
2. State Rural Development Programme for 2004-2010. Approved by the Presidential Decree#1143 on 10 June 2003.
3. State Programme ‘Health of the Nation’. Approved by the Presidential Decree #4153 on 16November 1998.
4. State Programme ‘Education’. Approved by the Presidential Decree #448 on 30 September2000.
5. Programme on Poverty Reduction for 2003-2005. Approved by the Government’s Decree #296on 26 March 2003.
6. Sectoral Programme ‘Drinking Water’ for 2002-2010. Approved by the Government’s Decree#93 on 23 January 2002.
7. Programme on Counteracting AIDS Epidemics in Kazakhstan for 2001-2005. Approved by theGovernment’s Decree #1207 on 14 September 2001.
8. Programme on Combating Poverty and Unemployment for 2000-2002. Approved by theGovernment’s Decree #833 on 3 June 2000, with amendments dated of 23 May 2002.
9. Social Protection Concept of Kazakhstan. Approved by Government’s Decree #886 on of 27June 2001.
10. State Demography Policy Concept of the Republic of Kazakhstan. Approved by Government’sDecree #1272 on 17 August 2000.
STATISTICAL PUBLICATIONS
1. Poverty Monitoring Indicators in Kazakhstan. Statistics Agency of Kazakhstan/UNDPKazakhstan, Almaty, 2003.
2. Express Information. Statistics Agency of Kazakhstan as of November 10, 2003.3. System of National Accounts. Statistics Agency of Kazakhstan, Almaty, 2003.
83
4. Kazakhstan: 1991-2002. Statistics Agency of Kazakhstan, Almaty, 2002.5. Statistical Year-Book 2003. Statistics Agency of Kazakhstan, Almaty, 2003.6. Statistical Year-Book 2002. Statistics Agency of Kazakhstan, Almaty, 2002.7. Statistical Year-Book 2001. Statistics Agency of Kazakhstan, Almaty, 2001.8. Regions of Kazakhstan 2002. Statistics Agency of Kazakhstan, Almaty, 2002.9. Living Standards of Population. Statistics Agency of Kazakhstan, Almaty, 2003.10. Living Standards of Population. Statistics Agency of Kazakhstan, Almaty, 2002.11. Living Standards of Population of the Republic of Kazakhstan. Monitoring. Statistics Agency of
Kazakhstan, Almaty, 2002.12. Household Survey ‘Causes and Conditions of Poverty’. Statistics Agency of Kazakhstan,
Almaty, 2002.13. Household Survey ‘Causes and Conditions of Poverty’. Statistics Agency of Kazakhstan,
Almaty, 2001.14. Labour and Employment of Population in Kazakhstan. Statistics Agency of Kazakhstan,
Almaty, 2003.15. Labour Market in Kazakhstan: 1991-2002. Statistics Agency of Kazakhstan, Almaty, 200316. Main Indicators of Labour Market in Kazakhstan 2002. Statistics Agency of Kazakhstan,
Almaty, 2002.17. Main Indicators of Labour Market in Kazakhstan 2001. Statistics Agency of Kazakhstan,
Almaty, 2001.18. Women and Men of Kazakhstan. Gender Statistics. Statistics Agency of Kazakhstan, Almaty,
2003.19. Women and Men of Kazakhstan. Gender Statistics. Statistics Agency of Kazakhstan, Almaty,
2002.20. Women and Men of Kazakhstan. Gender Statistics. Statistics Agency of Kazakhstan, Almaty,
2001.21. Education in Kazakhstan. Statistics Agency of Kazakhstan, Almaty, 2002.22. Statistical Methodologies. Statistics Agency of Kazakhstan, Almaty, 2001.23. Health of People and Health Care in Kazakhstan in 1991-2002. Ministry of Health, Astana, 2002.24. Health of Population of Kazakhstan and Performance of Health Facilities in 2001 (statistical
report). Ministry of Health, Astana, 2002.25. HIV Infection. Statistical Bulletin. Republican Centre for Prevention and Control of AIDS, Almaty,
2003.26. Oblast Socio-Economic Passports as of the end of 2002 (not published) collected by Presidential
Administration.27. Data from National Centre for Pension Payment of the Ministry of Labour and Social Protection
(not published).28. Socio-economic situation in Russia. January and December 2002. State Statistics Committee of
Russian Federation, 2002.
UNDP AND OTHER UN AGENCIES
1. Human Development Report 2003. UNDP 2003.2. Human Development Report 2000. UNDP 2000.3. Human Development Report 1999. UNDP, 1999.4. Human Development Report 1997. UNDP 1997.5. Halving Extreme Poverty. An Action Strategy for the United Nations, 2000 (www.undg.org).6. UN Millennium Development Goals in Kazakhstan, 2002.7. National Human Development Report of Kazakhstan 2002 ‘Rural Development in Kazakhstan:
Challenges and Prospects’. UNDP Kazakhstan, 2002.8. National Human Development of Kazakhstan 2000 ‘Fighting Poverty for a Better Future’. UNDP
Kazakhstan, 2000.9. Atlas: Rural Development in Kazakhstan. UNDP Kazakhstan, 2003.10. Rural Areas of Kazakhstan: New Aspects of Typology. UNDP Kazakhstan, (in Russian)11. UNDP Kazakhstan Study ‘Gender Aspects of Poverty in the Republic of Kazakhstan’, 2001 (not
published).12. UNDP Kazakhstan Study ‘Environmental Situation and Poverty in Kazakhstan’, 2001 (not
published).13. Findings of sociological survey of rural rayons, conducted at request from UNDP Kazakhstan by
Kazakhstan Institute for Social and Economic Information and Forecasting in 2002 (notpublished).
BIBLIOGRAPHY
84
POVERTY IN KAZAKHSTAN: CAUSES AND CURES
14. Final Report of the joint UNDP/ILO project on ‘Decent Work: Integrated Approach to SocialSphere in Kazakhstan’, Astana 2003.
15. National Nutrition Survey. Kazakhstan Nutrition Institute/UNDP, 2001 (in Russian).16. Materials of Conference on Poverty Reduction 25-26 April 2002. Ministry of Economy and Trade/
UNDP Kazakhstan, 2002.17. Some Aspects of Social Security System in Kazakhstan (in numbers). Ministry of Labour and
Social Protection/UNDP Kazakhstan, 2004 (in Russian).18. Human Development Textbook. UNDP Kazakhstan/Kazakhstan Economic University, 2004.19. Human Development Textbook. UNDP Russia/Moscow State University School of Economics,
2000.20. Social Monitor 2003. UNICEF MONEE Project, 2003.
OTHER PUBLICATIONS
1. Yu. Shokamanov. Human Development in Kazakhstan: Measurement Methodology andAnalysis. Almaty, 2003.
2. Russia in Figures in 2003. Statistics Book. Russian National Statistics Committee. Moscow2003, p.388
3. Recommendations to improve living standards indicators. Statistics of the CIS countries. CISStatistics Committee, 2003. Issue 6.
4. Commonwealth of Independent States in 2002. Statistical Yearbook. CIS Statistics Committee,2003.
5. Company Towns Survey. Asian Development Bank, 2002 (not published).6. World Development Report 2000/2001. Attacking Poverty. World Bank, 2001.7. Making Transition Work for Everyone: Poverty and Inequality in Europe and Central Asia. World
Bank, 2001.8. Yu. Shokamanov. Human Development Trends in Kazakhstan. Almaty, 2001.9. A. Razumov. Poverty Monitoring in the Russian Federation. Moscow ILO Bureau, 2001.10. Social Policy, Living Standards and Quality of Life. V.N. Bobkov, A. P. Pochinok, eds. Moscow,
2001.11. Avo Trumm ‘Evaluative Comments to the Poverty Reduction Programme of Kazakhstan for
2003-2005’. Astana, 2001 (not published).12. V.N. Bobkov. The system of consumer budgets and the possibility of using it in social policy.
Living Standards of Population in the Regions/ Russian Living Standards Centre. Moscow,2000. Issue ¹7-8.
13. International Seminar on Poverty Assessment The Statistics of the CIS countries, CIS StatisticsCommittee, 1999. Issue 20.
14. Russia and the World. V.S. Avtonomov and T.P. Subbotina, eds. St Petersburg, EconomicSchool Publishing Agency, 1999.
15. Sociological survey ‘Public Perceptions of Orphans’ Problems’, conducted in the framework ofthe project on ‘Realization of the Social Marketing Programme to Optimize Local AdoptionProcess and Develop Technologies to Obtain Live Experience by Children in Boarding Schools’by Corporate Fund ‘Amanat’ (not published).
16. Materials of Republican Conference on “Topical Problems of Medical and Social Expertise andRehabilitation of Disabled”. Almaty, 2003.
9. www.unstats.org/unsd10. www.ohchr.org11. www.worldbank.org12. www.ilo.org/kilm13. www.adb.org/statistics/poverty14. www.oecd.org15. www.who.int
1. www.president.kz2. www.zakon.kz3. www.enbek.kz4. www.undg.org5. www.un.org6. www.un.kz7. www.undp.org8. www.undp.kz
WEB-SITES

85
ANNEXES

86
POVERTY IN KAZAKHSTAN: CAUSES AND CURES
POVE
RTY
IN K
AZAK
HST
AN, 2
002

87
Annex 1
GLOSSARY ON POVERTY
1. POVERTY AND ITS MEASUREMENT
A human condition characterized by sustained or chronic deprivationof the resources, capabilities, choices, security and power necessaryfor the enjoyment of an adequate standard of living and other civil,cultural, economic, political and social rights.
According to the absolute approach, poor people are those who haveless than a certain absolute minimum. In other words, the concept ofabsolute poverty is based on establishing a list of a persons minimumbasic needs (for example, the minimum consumer basket or thesubsistence minimum), and the amount of resources needed to satisfythese needs. In particular, to determine needs for grocery items,physiological norms for calorie, protein, fat and carbohydrate intakeare used.
According to the relative approach, wealth indicators for definingpoverty are related to the predominant level of material wealth in agiven country, rather than to minimum needs. In other words, peoplewho have less than others are considered to be poor. In practice,according to this concept the relative poverty line is established asrelative percentage of household’s average or median income.
The subjective approach is based on the peoples subjectiveassessment of their living standards, it gives a possibility to the peoplethemselves to judge if they are poor and if their income is enough to livea normal life. In this regard, this concept is closely connected with theprinciples of freedom and dignity of the human being and its rights todecent living standards, standard nutrition, access to health careservices, education and other social and economic achievements ofsociety. The subjective approach is widely used for qualitative analysisalong with quantitative analysis.
The incidence of poverty, expressed as a headcount ratio, is simply anestimate of the percentage of people with income below the subsistenceminimum. It does not indicate anything about the depth or severity ofpoverty and thus does not capture any worsening of the conditions ofthose already in poverty.
Subsistence level is the value of goods and services at prevailing pricesnecessary to meet the basic requirements of a human being forsupporting life. The subsistence minimum in Kazakhstan is anobjectively determined level of income (expenditure) proportionate tothe value of goods and services included in the consumer basket.
The minimum consumer’ basket includes goods and services necessaryto meet the basic requirements of a human being to support life. Theconsumer’s basket consists of food basket, which includes foodstuffnecessary to meet a certain nutritional intake expressed by calorieintake (2172 kcals), and 30% added for essential non-food items andservices that comprise a minimum requirement; such as clothes, shoes,housing and different kinds of services.
Poverty
Poverty Headcount Ratio(or Incidence of Poverty)
Subsistence Minimum
Minimum ConsumerBasket
ANNEXES
88
POVERTY IN KAZAKHSTAN: CAUSES AND CURES
Poverty depth index shows how poor are the poor and it measuresaverage consumption/income shortfall of poor population expressedas a proportion of absolute poverty line (subsistence minimum inKazakhstan). Poverty incidence is considered as deep if average income(consumption) of the poor is far below the poverty line (subsistenceminimum in Kazakhstan).
Poverty severity index shows how poor are the poorest of the poor, i.e.income inequality among the poor. Poverty severity is an additionalcharacteristic of poverty, when the poverty headcount ratio and povertydepth index don’t change. The higher value of the poverty severityindex means more severe conditions of poverty.
The food basket cost in Kazakhstan is calculated in order to meet acertain nutritional intake of an individual expressed mainly by calorieintake. The food basket contains the items at the per-capita level of2172 kcals per day, which refers to the WHO standard. The food basketalso considers local/national food habits and the availability of thegoods in the local market.
Incidence of food poverty is measured as proportion of the populationwith income/consumption levels below a food basket cost.
A comprehensive aggregate index reflecting various aspects ofdeprivation in a person s life in all three main elements reflected in theHuman Development Index (HDI): longevity, knowledge and decentstandard of living. The difficulty of measuring other components ofhuman development, such as political freedom and personal safety,makes it impossible to include them in the poverty indices.a) HPI-1 for developing countries was for the first time calculated in theGlobal Human Development Report for 1997 via the following formula:
([ ) ] 3/133
32
31 3/1 Ρ+Ρ+Ρ=−HPI , where
Ð1 the percentage of people not expected to survive to the age of 40;
Ð2 percentage of illiterate adults;
Ð3 the percentage of people without access to safe water, health care
services, and percentage of underweight children under age of 5.
b) In the Global Human Development Report for 1999 HPI-2 for developedcountries was calculated via the following formula:
([ ) ] 4/134
33
32
31 4/2 Ρ+Ρ+Ρ+Ρ=−HPI , where
Ð1 the percentage of people not expected to survive to the age of 60;
Ð2 the percentage of functionally illiterate people;
Ð3 the percentage of people with income below 50% of the average
disposable personal income in the country;Ð
4 the level of long-term unemployment (unemployment for 12 months
or more)c) The HPI-3 for Kazakhstan was calculated in 2000 via the followingformula:
( )[ ] 3/134
33
32
31 4/3 ����HPI +++=− , where
Ð1 - the percentage of population not surviving till the age of 60;
Ð2 - the percentage of 16-year olds dropping out of school;
Poverty Depth Index
Poverty Severity Index
Food Basket Cost
Incidence of FoodPoverty (or proportion ofpopulation with incomebelow food basket cost)
Human Poverty Index(HPI)
ANNEXES

89
Labour Force
Labour Force ParticipationRate
Employment
Employment Rate
Unemployment
Unemployment Rate
2. EMPLOYMENT AND UNEMPLOYMENT
Labour force refers to part of country’s population (labour supplyavailable for production of goods and services) including those employed(people above a specific age who, during the reference period, were inpaid employment at work, self-employed or with a job but not at work)and unemployed (people above a specific age who, during the referenceperiod, were without work, currently available for work and seekingwork).
Provides an indication of the relative size of the country s labour supplyavailable for the production of goods and services. It is expressed as apercentage of the number of persons in the labour force in the totalnumber of working-age population.
Labour activity , which brings to a person income or remuneration,necessary to meet their humanneeds;
Full employment refers to a situation when everyone who wants a jobis employed, all labour resources of a country are fully utilized. Frictionalunemployment is not taken into account. It is suggested that such asituation means full use of all labour resources of the country.
Self-employment - an occupation in which remuneration idependson profit raised from production of goods and services (and the personsown consumption is considered as part of profit).
Shows share of the total number of employed as a percentage of thelabour force.
A social and economic phenomenon determined by lack of demand onthe labour market for a part of labour force; a condition in which peopleare willing and able to work, but cannot find a job.
Unemployment (general) is determined on the basis of the LabourForce Survey by Statistics Agency in compliance with the ILOrequirements. A person is called unemployed if the following criteria aremet: à) does not have a job/income b) actively seeks a job c) is willingto start a job in a certain period of time (as a rule, within two weeks).
Official (registered) total number of registered/recorded unemployedwithout consideration of seasonal fluctuations. This indicator does notshow hidden unemployment.
Hidden unemployment covers the employees, who are considered byofficial statistics as employed, however, in fact they are in forced leavesor work reduced working hours.
Long-term unemployed are the unemployed for 12 or more months.
Unemployment rate (general) refers to a proportion of unemployed intotal labour force. The general unemployment rate is calculated basedon the Labour Force Survey by the Kazakhstan Statistics Agency usingILO methodology. A person is considered employed if (s)he works atleast an hour a week.
Official (registered) unemployment rate refers to a proportion of
Ð3 - the percentage of population with consumption below the
subsistence minimum;Ð
4 - the general unemployment level.
Human Development Index was developed by UNDP in the early 1990s.It is a composite index measuring average achievement in three basicdimensions of human development a long and healthy life (lifeexpectancy at birth rate), knowledge (adult literacy rate and thecombined primary, secondary and tertiary gross enrolment rate) anddecent standards of living (GDP per capita, PPP US$).
Human Development Index(HDI)
ANNEXES
90
POVERTY IN KAZAKHSTAN: CAUSES AND CURES
unemployed, registered in state employment bodies, in the total labourforce.
Unemployment among the labour force categorized by different agegroups. It is a percentage distribution of the unemployed by age groups.In Kazakhstan the indicator refers to the proportion of unemployed ata given age to the total number of population at the same age.
Unemployment categorized by different levels of educational attainment.Specifically the indicator is a percentage distribution of the unemployedby levels of schooling. In Kazakhstan the indicator refers to theproportion of unemployed with a given level of education in the totalnumber of people who have the same level of education.
For the purpose of this indicator the term youth covers persons aged 15to 24 years; the term adult refers to those aged 25 and over.
(a) youth unemployment rate (youth unemployment as a percentageof the youth labour force);
(b) ratio of the youth unemployment rate to the adult unemploymentrate;
(c) youth unemployment as a proportion of total unemployment; and(d) youth unemployment as a proportion of the youth population.
Number of months during which a person was unemployed.
Minimum wage is a minimum monetary payment guaranteed byConstitution to all employees irrespective of the ownership (state orprivate) of the employer.
Nominal wage refers to any monthly remuneration, including basicwages, wage supplements, bonuses, premiums and one-timepayments.
Real Wage Index refers to the nominal wages index adjusted for thechanges in purchasing power measured by the consumer price index.
3. INCOME AND INEQUALITY
Inequality
Gini Coefficient
Assets Coefficient(Richest-to-Poorest Ratio)
Consumer BudgetsSystem
This is the difference in income and living standards between the differentgroups of population, which are caused by a number of reasons ofeconomic, regional, social, cultural and political nature.
Gini coefficient, which is one of the income differentiation indexes,measures the extent to which the distribution of income (orconsumption) among individuals or households within a country deviatesfrom a perfectly equal distribution. A value of 0 represents perfectequality, a value of 1 perfect inequality.
Assets coefficient reflects the income gap between the richest and thepoorest population of a country. It is calculated as correlation betweentotal incomes of the richest 10% of population and total incomes of thepoorest 10% of population. Belongs to a group of income concentrationindices.
A system of social standards, measuring different levels of well-beingamong the population:
- Subsistence Minimum (SM),- Minimum Consumer Budget (MCB) and- High Income Budget (HIB).
The subsistence minimum (SM) is a measure of absolute poverty . Itrefers to the monetary income a person needs to purchase goods and
Unemployment by Age
Unemployment by Level ofEducation
Youth Unemployment
Average UnemploymentDuration
Minimum Wage
Nominal Wage
Real Wage Index

91
Minimum Pension
Average Pension(Assigned)
Social Benefit on disability,loss of breadwinner andold age
Social Benefit to formerrecipients of in-kindbenefits
Social Benefit to thosewho worked in former List#1 jobs
4. SOCIAL SECURITY IN KAZAKHSTAN
services in a minimum consumer basket would satisfy basic humanneeds, at the level accepted by society at a particular stage of itsdevelopment. A normative-statistical approach is used to calculate thesubsistence minimum in Kazakhstan.
Minimum consumer budget is equal to twice the subsistence minimum.It refers to the higher levels of income compared to the subsistenceminimum that provides better living conditions as well as better qualityof life. It provides for the comfortable level of consumption.
High-income budget is equal to seven times the subsistence minimum.This social standard provides for an advanced level of consumption.
This system was introduced by specialists of Russian Living StandardsCentre in 1993.
Refers to the correlation between an average income and the subsistenceminimum. It defines how many sets of goods and services of thesubsistence minimum can be obtained for the populations’ incomes.
Low - the value of the income purchasing power index is less thantwo.
Average - the value of the income purchasing power index is higherthan two, but less than seven.
High - the value of the income purchasing power index is higher thanseven.
Incomes obtained by household members, such as wages, incomesfrom entrepreneurial activity, pensions, stipends, benefits,compensations and other payments (including charity), dividends, rentsand other incomes from property, income from household productionand other monetary incomes.
Incomes can be nominal (not excluding taxes and other mandatorypayments) and disposable (excluding above mentioned payments).
Average income is calculated by dividing the total amount of incomeby the total population.
Real income adjusted for changes in consumer prices. It is a rationbetween monetary income and the consumer price index.
Real disposable income income, excluding mandatory payments andtaxes, taking into account changes in consumer prices.
Populations PurchasingPower
Average HouseholdIncome
Minimum amount of pension defined by the State under the provisionsof pension legislation.
Average monthly amount of pension per pensioner. It is calculated as acorrelation between the total sum of assigned monthly pensions to allregistered pensioners and their number at the end of the year.
Regular monetary transfers to citizens who need them due to disability,loss of breadwinner and old age.
Monetary transfer to those who need special social protection - amonetization of former in-kind additions to the pension or salary. It isgiven regardless of other types of allowances. Persons eligible for thebenefit include participants and disabled of the World War II, families ofdead military personnel/policemen, persons rewarded with orders andmedals of the Former Soviet Union for their hard work during the WorldWar II, etc.
Monetary transfer to those who worked underground and open mining,in jobs with harmful and/or especially work conditions for men (List#1). The eligibility criteria are: men at the age of 53 who have 20 yearswork experience, including at least 10 years in jobs on the List; women
ANNEXES

92
POVERTY IN KAZAKHSTAN: CAUSES AND CURES
at the age of 48 who have at least 10 years of work experience, of which7 years must have been in jobs on the List. The benefit is given regardlessof the workers wage. After reaching pension age, the recipients decidewhether to continue receiving the benefit, or start receiving a pension.
Housing benefit is a monetary transfer to low-income residents whoown or rent housing to cover housing costs and/or utilities. Housingbenefit is determined and paid from local budget.
State targeted social assistance is a monetary transfer to poor persons(families) with incomes below the poverty line established quarterly foreach oblasts, Almaty and Astana cities. The poverty line in Kazakhstanis established annually as percentage of the subsistence minimum(minimum consumer basket), defined depending upon availability ofbudget financial resources. In 2002 the poverty line was fixed at 40% ofthe subsistence minimum.
The poverty line in Kazakhstan is used specifically as criteria for thestate targeted social assistance. It is established annually as percentageof the subsistence minimum (minimum consumer’s basket), defineddepending upon availability of budget financial resources. In 2002 thepoverty line was fixed at 40% of the subsistence minimum.
Housing Allowance
State Targeted SocialAssistance
Poverty Line as criteria forstate targeted socialassistance (in Kazakhstan)
5. MACROECONOMIC INDICATORS
Gross Domestic Product(GDP)
Real GDP Growth
Gross National Product, orGross National Income(GNP, or GNI)
-Macroeconomic indicator representing the total output of goods andservices for final use produced by an economy, by both residents andnon-residents, during a given period of time, regardless of the allocationto domestic and foreign claims and is calculated without makingdeductions for depreciation. There are three methods of GDP calculation:
Production method calculates and sums up the gross value addedcreated in all industries or sectors of the economy, provides data foranalysis of the industrial and sector structure of the economy.
Income distribution method calculates and sums up the componentsof income paid to all institutional units engaged in the production ofgoods and services; yields the data required to analyze the structure ofthe income originating in the process of GDP production remuneration,operating surplus, production and import taxes, etc.
Final expenditure method comprises the total expenditure of all units onfinal consumption, gross capital formation (investment) and exports,provides data for an analysis of the structure of the overall GDP, establishingthe ratio between final consumption and capital formation, between theconsumption of goods and services by households (individual consumption)and by general government bodies (collective consumption).
GDP by industrial origin refers to the breakdown of GDP by sectors ofeconomy, such as industry, agriculture or services as defined accordingto the International Standard Industrial Classification (ISIC) system.Industry refers to the mining and quarrying, manufacturing, constructionand public utilities, including gas, water and electricity. Agriculture refersto agriculture, hunting, fishery and forestry. Services refer to wholesaleand retail trade; restaurants and hotels; transport, storage andcommunications; finance, insurance, real estate and business services;and community, social and personal services.
Refers to the annual changes in GDP output as a percent to the previousyear.
A macroeconomic indicator reflecting the final product produced by aneconomy during a given period of time, calculated at market prices.GNP includes both cost of the products produced in the country andoutside the country using industries belonging to the country.
93
6. DEMOGRAPHIC INDICATORS AND REPRODUCTIVE BEHAVIOR
Macroeconomic indicator showing aggregate value of goods andservices produced during a given period of time in a certain region of thecountry.
Refers to the GDP value divided by the average annual population of thecountry.
The consumer price index measures changes over time in the generallevel of prices and services that a reference population acquires, usesor pays for. A consumer price index is estimated as a series of summarymeasures of the period-to-period proportional change in the prices of afixed set of consumer goods and services of constant quantity andcharacteristics, acquired, used or paid for by the reference population.Each summary measure is constructed as a weighted average of alarge number of elementary aggregate indices. Each of the elementaryaggregate indices is estimated using a sample of prices for a definedset of goods and services obtained in, or by residents of, a specificregion from a given set of outlets or other sources of consumption goodsand services.
Refers to the rate of increase of the level of prices (measured by theconsumer price index) during a given period.
The number of units of a country’s currency required to purchase thesame representative basket of goods and services (or similar basket ofgoods and services) that a US dollar (the reference currency) would buyin the United States.
Gross Regional Product(GRP)
GDP per Ñapita
Consumer Price Index(CPI)
Inflation Rate
Purchasing Power Parities(PPP)
Life Expectancy at Birth
Rate of Natural PopulationIncrease
Rate of Children Involved inDivorce
Total Fertility Rate
Crude Birth Rate
Birth Rate by Age
Life Births
Life expectancy at birth is a widely used measure of general level ofmortality in a country. This is a theoretical number of years a new-bornwould live if the age-specific mortality rates in the year of birth are takenas constant.
Rate of natural population increase is the difference between the numberof births and the number of deaths during the given year divided bymid-year population.
The rate of children involved in divorce shows the number of childrenaged 0-17 involved in divorces per 1,000 people aged 0-17.
Total fertility rate is the overall measure of fertility, which represents anaverage number of children a woman would bear during reproductiveperiod (15 to 49) if the age-specific fertility rates remained unchangedduring her lifetime.
Crude birth rate measures the frequency of childbirths in a population.It represents a number of life births per 1,000 mid-year people. -
Birth rate by age measures the frequency of childbirths among womenof a certain age group. It represents a number of life births amongwomen of a certain age group per mid-year female population in thesame age group.
There are two definitions of the live birth notion. WHO standarddefinition refers to the live births include all births, with the exception ofstillbirths, regardless of the size, gestation age, or viability of thenewborn infant, or his or her death soon after birth or before the requiredbirth registration date. The Soviet concept excludes infants born withno breath, but with other signs of life (stillbirths in the Soviet concept)and infants born before the end of the 28th week of pregnancy at aweight under 1,000 grams or a length under 35 centimeters and whodie during the first seven days of life (miscarriages). In Kazakhstan theSoviet concept is used to define live births.
ANNEXES
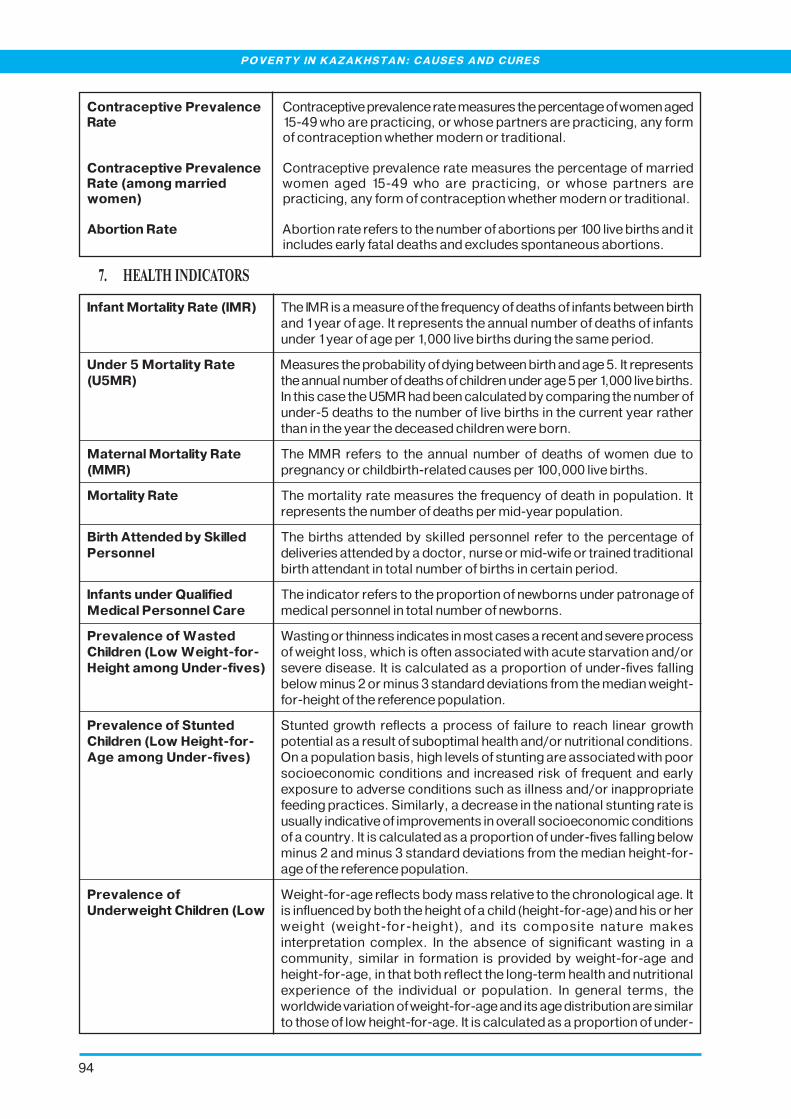
94
POVERTY IN KAZAKHSTAN: CAUSES AND CURES
Contraceptive prevalence rate measures the percentage of women aged15-49 who are practicing, or whose partners are practicing, any formof contraception whether modern or traditional.
Contraceptive prevalence rate measures the percentage of marriedwomen aged 15-49 who are practicing, or whose partners arepracticing, any form of contraception whether modern or traditional.
Abortion rate refers to the number of abortions per 100 live births and itincludes early fatal deaths and excludes spontaneous abortions.
Contraceptive PrevalenceRate
Contraceptive PrevalenceRate (among marriedwomen)
Abortion Rate
7. HEALTH INDICATORS
Infant Mortality Rate (IMR)
Under 5 Mortality Rate(U5MR)
Maternal Mortality Rate(MMR)
Mortality Rate
Birth Attended by SkilledPersonnel
Infants under QualifiedMedical Personnel Care
Prevalence of WastedChildren (Low Weight-for-Height among Under-fives)
Prevalence of StuntedChildren (Low Height-for-Age among Under-fives)
Prevalence ofUnderweight Children (Low
The IMR is a measure of the frequency of deaths of infants between birthand 1 year of age. It represents the annual number of deaths of infantsunder 1 year of age per 1,000 live births during the same period.
Measures the probability of dying between birth and age 5. It representsthe annual number of deaths of children under age 5 per 1,000 live births.In this case the U5MR had been calculated by comparing the number ofunder-5 deaths to the number of live births in the current year ratherthan in the year the deceased children were born.
The MMR refers to the annual number of deaths of women due topregnancy or childbirth-related causes per 100,000 live births.
The mortality rate measures the frequency of death in population. Itrepresents the number of deaths per mid-year population.
The births attended by skilled personnel refer to the percentage ofdeliveries attended by a doctor, nurse or mid-wife or trained traditionalbirth attendant in total number of births in certain period.
The indicator refers to the proportion of newborns under patronage ofmedical personnel in total number of newborns.
Wasting or thinness indicates in most cases a recent and severe processof weight loss, which is often associated with acute starvation and/orsevere disease. It is calculated as a proportion of under-fives fallingbelow minus 2 or minus 3 standard deviations from the median weight-for-height of the reference population.
Stunted growth reflects a process of failure to reach linear growthpotential as a result of suboptimal health and/or nutritional conditions.On a population basis, high levels of stunting are associated with poorsocioeconomic conditions and increased risk of frequent and earlyexposure to adverse conditions such as illness and/or inappropriatefeeding practices. Similarly, a decrease in the national stunting rate isusually indicative of improvements in overall socioeconomic conditionsof a country. It is calculated as a proportion of under-fives falling belowminus 2 and minus 3 standard deviations from the median height-for-age of the reference population.
Weight-for-age reflects body mass relative to the chronological age. Itis influenced by both the height of a child (height-for-age) and his or herweight (weight-for-height), and its composite nature makesinterpretation complex. In the absence of significant wasting in acommunity, similar in formation is provided by weight-for-age andheight-for-age, in that both reflect the long-term health and nutritionalexperience of the individual or population. In general terms, theworldwide variation of weight-for-age and its age distribution are similarto those of low height-for-age. It is calculated as a proportion of under-
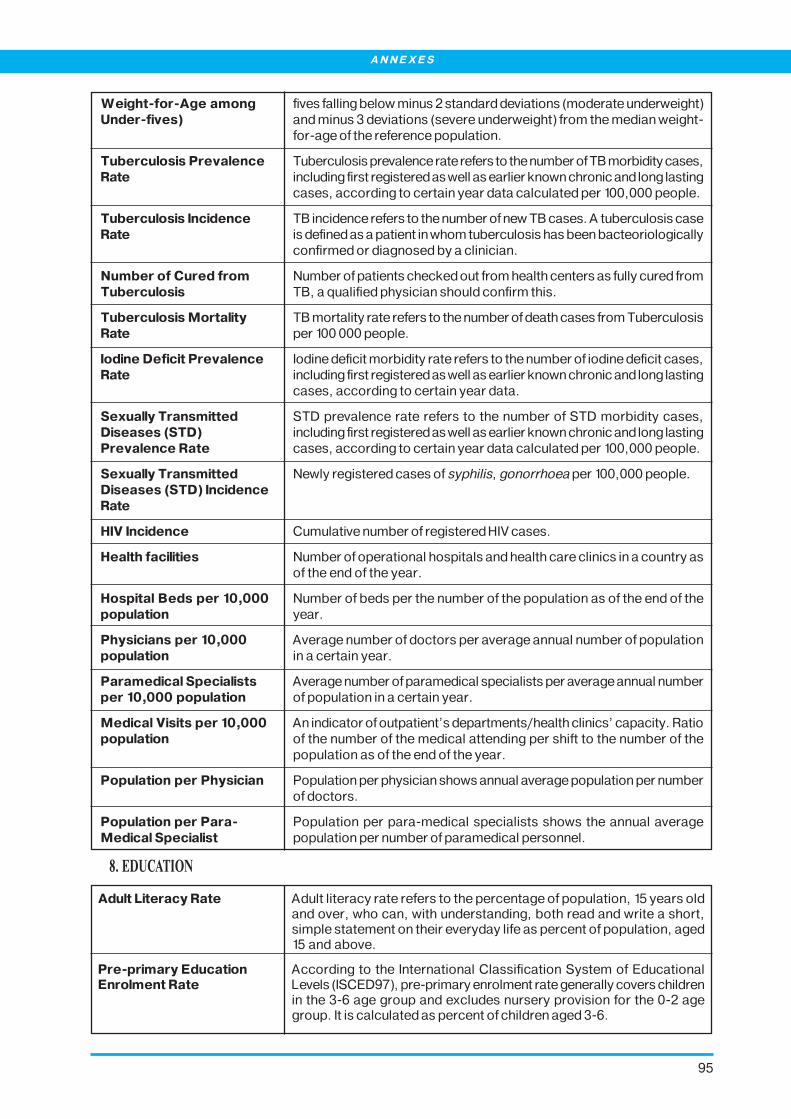
95
8. EDUCATION
Weight-for-Age amongUnder-fives)
Tuberculosis PrevalenceRate
Tuberculosis IncidenceRate
Number of Cured fromTuberculosis
Tuberculosis MortalityRate
Iodine Deficit PrevalenceRate
Sexually TransmittedDiseases (STD)Prevalence Rate
Sexually TransmittedDiseases (STD) IncidenceRate
HIV Incidence
Health facilities
Hospital Beds per 10,000population
Physicians per 10,000population
Paramedical Specialistsper 10,000 population
Medical Visits per 10,000population
Population per Physician
Population per Para-Medical Specialist
fives falling below minus 2 standard deviations (moderate underweight)and minus 3 deviations (severe underweight) from the median weight-for-age of the reference population.
Tuberculosis prevalence rate refers to the number of TB morbidity cases,including first registered as well as earlier known chronic and long lastingcases, according to certain year data calculated per 100,000 people.
TB incidence refers to the number of new TB cases. A tuberculosis caseis defined as a patient in whom tuberculosis has been bacteoriologicallyconfirmed or diagnosed by a clinician.
Number of patients checked out from health centers as fully cured fromTB, a qualified physician should confirm this.
TB mortality rate refers to the number of death cases from Tuberculosisper 100 000 people.
Iodine deficit morbidity rate refers to the number of iodine deficit cases,including first registered as well as earlier known chronic and long lastingcases, according to certain year data.
STD prevalence rate refers to the number of STD morbidity cases,including first registered as well as earlier known chronic and long lastingcases, according to certain year data calculated per 100,000 people.
Newly registered cases of syphilis, gonorrhoea per 100,000 people.
Cumulative number of registered HIV cases.
Number of operational hospitals and health care clinics in a country asof the end of the year.
Number of beds per the number of the population as of the end of theyear.
Average number of doctors per average annual number of populationin a certain year.
Average number of paramedical specialists per average annual numberof population in a certain year.
An indicator of outpatient’s departments/health clinics’ capacity. Ratioof the number of the medical attending per shift to the number of thepopulation as of the end of the year.
Population per physician shows annual average population per numberof doctors.
Population per para-medical specialists shows the annual averagepopulation per number of paramedical personnel.
Adult Literacy Rate
Pre-primary EducationEnrolment Rate
Adult literacy rate refers to the percentage of population, 15 years oldand over, who can, with understanding, both read and write a short,simple statement on their everyday life as percent of population, aged15 and above.
According to the International Classification System of EducationalLevels (ISCED97), pre-primary enrolment rate generally covers childrenin the 3-6 age group and excludes nursery provision for the 0-2 agegroup. It is calculated as percent of children aged 3-6.
ANNEXES

96
POVERTY IN KAZAKHSTAN: CAUSES AND CURES
Basic Education EnrolmentRate
General SecondaryEducation Enrolment Rate
Higher EducationEnrolment Rate
Students per Teacher
Basic education often called compulsory schooling or elementaryschooling normally lasts from age 6 or 7 to age 14 or 15. This is oftendivided into primary (to age 10) and lower secondary levels.
According to the ISCED97 general secondary education in CIS countriestypically comprises the two or three upper classes of the comprehensiveschool. It is calculated as a proportion of children aged 11-17 enrolled insecondary school of all kinds in total number of children aged 11 - 17.
According to the ICSED07 tertiary enrolment provides a non-doctorate-related university degree or recognized equivalent.
Shows the workload of the teacher. Ratio of total number of studentsto the total number of teachers.
9. PHYSICAL INFRASTRUCTURE
Access to Safe Water
Proportion of watersupply from stand-alonesources, with qualitybelow microbiologicalstandards
Proportion of ruralsettlements notconnected with roads
Phone Sets
Personal Computers
Internet Users(registered)
Motor Vehicles inPersonal Use
Population with access to safe water is the share of the population withreasonable access to an adequate amount of safe water (includingtreated surface water and untreated but uncontaminated water suchas springs, sanitary wells, and protected boreholes).
Stand-alone water supply sources are wells, springs, and artesian wellswithout distribution networks.
Percentage of the rural settlements that are not connected with roadsof general use.
Number of phone sets in households per 100 households as definedbased on household budget survey by Statistics Agency.
Number of personal computers in households per 100 households asdefined based on household budget survey by Statistics Agency.
Number of Internet users in households per 100 households as definedbased on household budget survey by Statistics Agency.
Number of motor vehicles in households per 100 households as definedbased on household budget survey by Statistics Agency.
10. DRUG CONTROL AND CRIME PREVENTION
Alcoholism Morbidity Rate
Drug Addiction MorbidityRate
Crime Rate
Alcoholism morbidity rate refers to the number of alcoholism morbiditycases including first registered as well as earlier known chronic andlong lasting cases, according to certain year data.
Drug addiction morbidity rate refers to the number of morbidity casesfrom drug abuse including first registered as well as earlier known chronicand long lasting cases, according to certain year.
The percentage of the population who perceive that they have beenvictimized by certain types of crime in a preceding year.

97
LIST OF SOURCES
1. 2002 Statistical Yearbook for Kazakhstan. Statistics Agency of Kazakhstan, 2002.
2. Poverty Monitoring Indicators for Kazakhstan. Statistics Agency of Kazakhstan /UNDPKazakhstan, 2003.
3. Main Indicators of Labour Market in Kazakhstan. Statistics Agency of Kazakhstan, 2002.
4. Methodological Concepts of Statistics. Statistics Agency of Kazakhstan, 1999.
5. Health of Population and Health Care in Kazakhstan in 1991-2001. Ministry of Health, 2002.
6. Law on State Targeted Social Assistance as of 17 July 2001.
7. Law on State Social Benefit by Age, Loss of Breadwinner and for Disability in Kazakhstan as of 5April 1999.
8. Law on Special State Benefit in Kazakhstan as of 13 July 1999.
9. Law on Housing Relation in Kazakhstan as of 16 April 1997.
10. Final Report of joint ILO/UNDP Project on Decent Work: Integrated Approach to Social Sphere inKazakhstan, 2003.
11. Human Development Report 1997. UNDP, 1997.
12. Human Development Report 2002 Deepening Democracy in a Fragmented World. UNDP, 2002.
13. National Human Development Report 2002 Rural Development in Kazakhstan: Challenges andProspects. UNDP Kazakhstan, 2002.
14. Human Development Textbook. Kazakh Economic University/UNDP Kazakhstan, 2003.
15. Human Development Textbook. Economic Department of Moscow State University/UNDPRussia, 2000.
16. Kazakhstan Living Standards During the Transition. World Bank Report. March 1998.
17. Social Monitor 2003. MONEE project, UNICEF, 2003.
18. ILO Key Indicator of Labour Market Database 2001-2002 (www.ilo.org/kilm).
19. United Nations Statistics Department Common Database (www.unstats.org/unsd/index.htm).
20. ADB Glossary of Poverty Statistics (www.adb.org/statistics/poverty).
21. OECD Glossary of Statistical Terms(http://cs3-hq.oecd.org/scripts/stats/glossary/index.htm).
22. WHO Global Database on Child Growth and Malnutrition(www.who.int/nutgrowthdb/into_text.htm).
23. Office of High Commissioner on Human Rights. www.ohchr.org.
ANNEXES

98
POVERTY IN KAZAKHSTAN: CAUSES AND CURES
Annex 2
MILLENNIUM DEVELOPMENT GOALS AND TARGETS
MDG 1: Eradicate extreme poverty and hunger
Target 1: Halve, between 1990 and 2015, the proportion of people whose income is less thanone dollar a day
Target 2: Halve, between 1990 and 2015, the proportion of people who suffer from hunger
MDG 2: Achieve universal primary education
Target 3: Ensure that, by 2015, children everywhere, boys and girls alike, will be ableto complete a full course of primary education
MDG 3: Promote gender equality and empower women
Target 4: Eliminate gender disparity in primary and secondary education, preferably by 2005,and to all levels of education no later than 2015
MDG 4: Reduce child mortality
Target 5: Reduce by two thirds, between 1990 and 2015, the under-five mortality rate
MDG 5: Improve maternal health
Target 6: Reduce by three quarters, between 1990 and 2015, the maternal mortality ratio
MDG 6: Combat HIV/AIDS, malaria and other diseases
Target 7: Have halted by 2015 and begun to reverse the spread of HIV/AIDSTarget 8: Have halted by 2015 and begun to reverse the incidence of malaria and other major
diseases
MDG 7: Ensure environmental sustainability
Target 9: Integrate the principles of sustainable development into country policies andprogrammes and reverse the loss of environmental resources
Target 10: Halve by 2015, the proportion of people without sustainable access to safe drinkingwater
Target 11: Achieve by 2020, a significant improve in the lives of at least 100 million slum dwellers.
MDG 8. Develop global partnership for development
Target 12. Develop further an open, rule-based, predictable, non-discriminatory trading andfinancial system.
Target 13. Address the special needs of less developed countries.Target 14. Address the special needs of landlocked developing countries.Target 15. Dear comprehensively with the debt problems of developing countries through
national and international measures.Target 16. Develop and implement strategies for decent and productive work for youth.Target 17. Provide access to affordable essential drugs in developing countries.Target 18. Make available the benefits of new technologies, especially information and
communications.
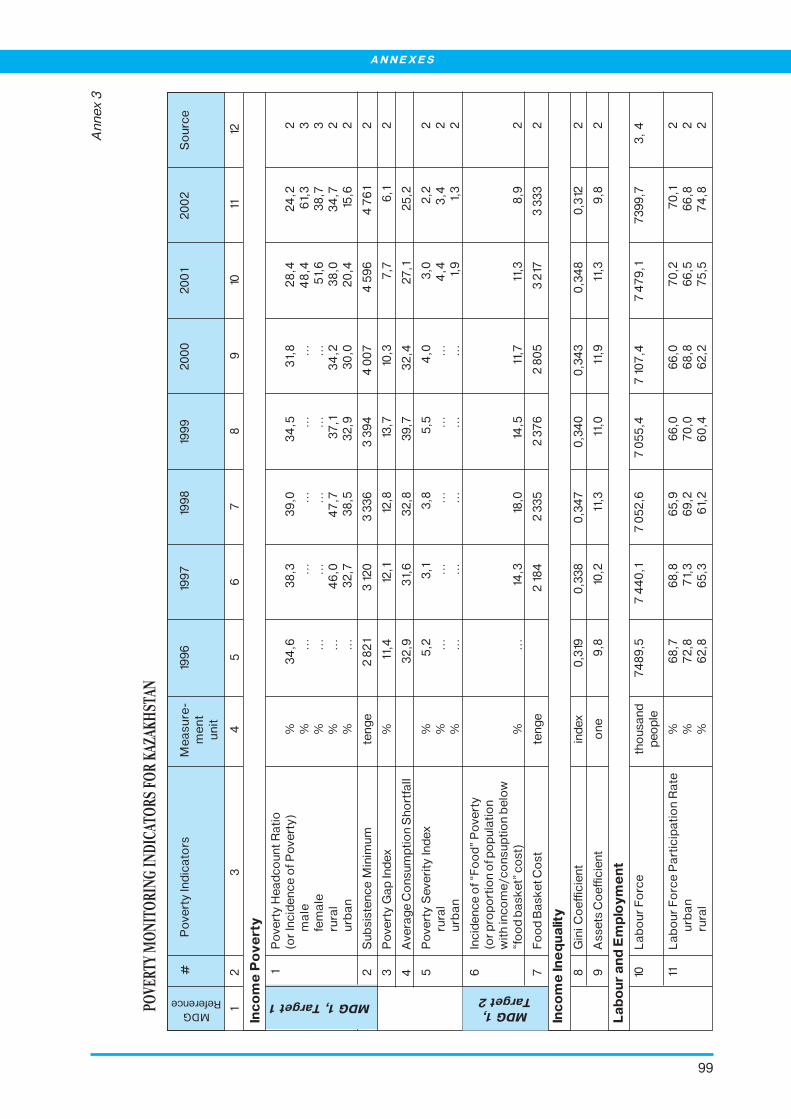
99
POVE
RTY
MON
ITOR
ING
INDI
CATO
RS F
OR K
AZAK
HST
AN
An
ne
x 3
MDG 1, Target 1
12
34
56
78
910
1112
#
Po
vert
y In
dic
ato
rsM
ea
su
re-
199
619
97
199
819
99
20
00
20
01
20
02
So
urc
em
en
tu
nit
MDGReference
MDG 1,Target 2
Inco
me
Po
ve
rty
1P
ove
rty H
ea
dc
ou
nt
Ra
tio
(or
Inc
ide
nc
e o
f Po
vert
y)
%3
4,6
38
,33
9,0
34
,53
1,8
28
,42
4,2
2m
ale
%..
...
...
...
...
.4
8,4
61,
33
fem
ale
%..
...
...
...
...
.5
1,6
38
,73
rura
l%
...
46
,04
7,7
37
,13
4,2
38
,03
4,7
2u
rba
n%
...
32
,73
8,5
32
,93
0,0
20
,415
,62
2S
ub
sist
en
ce
Min
imu
mte
ng
e2
82
13
12
03
33
63
39
44
00
74
59
64
76
12
3P
ove
rty G
ap
Ind
ex
%11
,412
,112
,813
,710
,37
,76
,12
4A
vera
ge
Co
nsu
mp
tio
n S
ho
rtfa
ll3
2,9
31,
63
2,8
39
,73
2,4
27
,12
5,2
5P
ove
rty S
eve
rity
Ind
ex
%5
,23
,13
,85
,54
,03
,02
,22
rura
l%
...
...
...
...
...
4,4
3,4
2u
rba
n%
...
...
...
...
...
1,9
1,3
2
6In
cid
en
ce
of “
Fo
od
” P
ove
rty
(or
pro
po
rtio
n o
f po
pu
lati
on
wit
h in
co
me
/co
nsu
pti
on
be
low
“fo
od
ba
ske
t” c
ost
)%
...
14,3
18,0
14,5
11,7
11,3
8,9
2
7F
oo
d B
ask
et C
ost
ten
ge
2
18
42
33
52
37
62
80
53
217
3 3
33
2
Inco
me
Ine
qualit
y
8
Gin
i C
oe
ffic
ien
tin
de
x0
,319
0,3
38
0,3
47
0,3
40
0,3
43
0,3
48
0,3
122
9A
sse
ts C
oe
ffic
ien
to
ne
9,8
10,2
11,3
11,0
11,9
11,3
9,8
2
Labo
ur
and E
mp
loym
ent
10
La
bo
ur
Fo
rce
tho
usa
nd
74
89
,57
44
0,1
7 0
52
,67
05
5,4
7 1
07
,47
47
9,1
73
99
,73
, 4
pe
op
le
11L
ab
ou
r F
orc
e P
art
icip
ati
on
Ra
te%
68
,76
8,8
65
,96
6,0
66
,07
0,2
70
,12
urb
an
%7
2,8
71,
36
9,2
70
,06
8,8
66
,56
6,8
2ru
ral
%6
2,8
65
,36
1,2
60
,46
2,2
75
,57
4,8
2
ANNEXES

100
POVERTY IN KAZAKHSTAN: CAUSES AND CURES
12
34
56
78
910
1112
12E
mp
loym
en
t R
ate
%8
7,0
87
,08
6,9
86
,58
7,2
89
,69
0,7
4m
ale
%..
...
.5
4,2
52
,45
2,5
91,
19
2,5
4fe
ma
le%
...
...
45
,84
7,6
47
,58
8,0
88
,84
rura
l%
86
,18
6,4
86
,18
5,8
86
,59
2,2
92
,62
urb
an
%8
7,6
87
,48
7,4
87
,08
7,7
87
,48
9,1
2
13E
mp
loym
en
t R
ati
o%
69
,56
9,8
67
,06
7,0
67
,87
2,8
...
10
14U
ne
mp
loym
en
t R
ate
(G
en
era
l)%
13,0
13,0
13,1
13,5
12,8
10,4
9,3
2m
ale
%..
...
...
...
...
.8
,97
,54
fem
ale
%..
...
...
...
...
.12
,011
,24
rura
l%
13,9
13,6
13,9
14,2
13,5
7,8
7,4
2u
rba
n%
12,4
12,6
12,6
13,0
12,3
12,6
10,9
2
15A
vera
ge
Un
em
plo
ym
en
tD
ura
tio
nm
on
ths
5,9
6,0
6,0
7,4
7,5
7,9
6,1
2m
ale
am
on
ths
5,9
5,9
7,0
7,2
8,4
8,6
...
fem
ale
am
on
ths
6,0
6,1
7,6
7,7
8,8
8,9
...
16U
ne
mp
loym
en
t b
y L
eve
lo
f Ed
uc
ati
on
b%
...
...
...
...
...
10,4
9,3
5te
rtia
ry%
...
...
...
...
...
6,1
5,4
5in
co
mp
lete
te
rtia
ry%
...
...
...
...
...
13,1
9,4
5se
co
nd
ary
vo
ca
tio
na
l%
...
...
...
...
...
10,1
8,6
5p
rim
ary
vo
ca
tio
na
l%
...
...
...
...
...
10,3
9,2
5g
en
era
l se
co
nd
ary
%..
...
...
...
...
.12
,512
,15
ba
sic
se
co
nd
ary
%..
...
...
...
...
.12
,210
,75
pri
ma
ry%
...
...
...
...
...
7,4
6,1
5
17U
ne
mp
loym
en
t b
y A
ge
b%
...
...
...
...
...
10,4
9,3
515
ye
ars
%..
...
...
...
...
.10
,013
,75
16-1
9%
...
...
...
...
...
24
,62
0,6
52
0-2
4%
...
...
...
...
...
16,9
16,0
52
5-2
9%
...
...
...
...
...
11,9
10,6
53
0-3
4%
...
...
...
...
...
9,8
8,9
53
5-3
9%
...
...
...
...
...
9,2
8,4
54
0-4
4%
...
...
...
...
...
8,5
7,7
54
5-4
9%
...
...
...
...
...
7,7
7,5
55
0-5
4%
...
...
...
...
...
7,2
7,5
55
5-5
9%
...
...
...
...
...
7,0
6,4
56
0-6
4%
...
...
...
...
...
5,0
3,7
56
5-6
9%
...
...
...
...
...
2,6
0,3
57
0 y
ea
rs a
nd
ove
r%
...
...
...
...
...
1,4
...
5

101
12
34
56
78
910
1112
So
cia
l Se
curity
2
4M
inim
um
Pe
nsi
on
ten
ge
...
58
0,0
2 3
95
,03
00
0,0
3 5
00
,04
00
0,0
4 3
36
,02
25
Ave
rag
e P
en
sio
n (A
ssig
ne
d)
ten
ge
...
3 2
83
,03
55
4,0
4 2
13,0
4 2
70
,04
46
2,0
4 9
47
,02
rura
late
ng
e..
...
.3
53
7,0
3 5
71,
03
87
7,0
4 3
80
,05
15
3,0
urb
an
ten
ge
...
...
...
...
...
...
...
26
Sta
te S
oc
ial B
en
efit
(bre
ad
-w
inn
er
loss
, d
isa
bili
ty, o
ld a
ge
)dte
ng
e..
...
...
.3
55
83
55
63
73
04
17
88
27
Nu
mb
er
of
Be
ne
fic
iari
es
of
the
Sta
te S
oc
ial B
en
efit
(bre
ad
-th
ou
san
dw
inn
er
loss
, d
isa
bili
ty, o
ld a
ge
)d p
eo
ple
...
...
...
67
4,5
68
1,7
64
9,1
65
0,0
8
28
Sp
ec
ial S
tate
Be
ne
fit
(fo
rme
rin
-kin
d b
en
efits
)ete
ng
e..
...
...
.1
28
01
25
01
33
11
413
8
29
Nu
mb
er
of
Be
ne
fic
iari
es
of
the
Sp
ec
ial S
tate
Be
ne
fit
(fo
rme
rth
ou
san
din
-kin
d b
en
efits
)ep
eo
ple
...
...
...
1 0
20
,21
174
,81
03
6,8
1 0
08
,38
30
Sta
te S
pe
cia
l Be
ne
fit
(fo
r p
eo
ple
wo
rke
d a
t th
e u
nd
erg
rou
nd
min
es
an
d m
inin
g w
ork
s,fo
rme
r L
ist
#1)
fte
ng
e..
...
...
...
.5
26
04
96
36
25
58
31
Nu
mb
er
of
Be
ne
fic
iari
es
of
the
Sta
te S
pe
cia
l Be
ne
fit
(fo
rp
eo
ple
wo
rke
d a
t th
eu
nd
erg
rou
nd
min
es
an
d m
inin
gw
ork
s, fo
rme
r L
ist
#1)
f p
eo
ple
...
...
...
...
1 4
95
5 6
69
6 8
03
8
32
Ho
usi
ng
Allo
wa
nc
e j
ten
ge
...
...
...
...
...
...
66
4
33
Po
vert
y L
ine
(a
s e
ligib
ility
cri
teri
on
fo
r S
tate
Ta
rge
ted
So
cia
l Ass
ista
nc
ein
Ka
zak
hst
an
)gte
ng
e..
...
...
...
.1
50
81
70
71
90
49
34
Sta
te T
arg
ete
d S
oc
ial
Ass
ista
nc
e (a
vera
ge
)hte
ng
e..
...
...
...
...
...
.9
98
,09
35
Nu
mb
er
of
Be
ne
fic
iari
es
of
Sta
teth
ou
san
dT
arg
ete
d S
oc
ial A
ssis
tan
ce
hp
eo
ple
...
...
...
...
...
...
1 13
7,0
9
Eco
no
my
3
6G
ross
Do
me
stic
Pro
du
ct (
GD
P)
ANNEXES
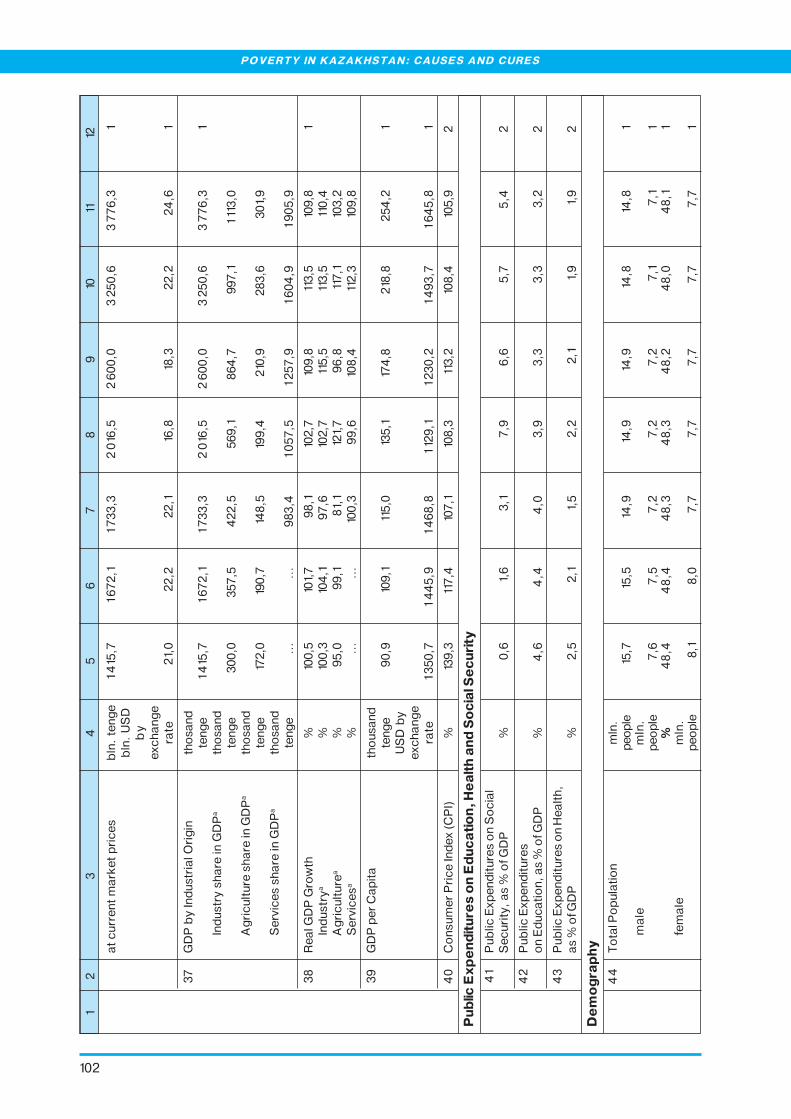
102
POVERTY IN KAZAKHSTAN: CAUSES AND CURES
12
34
56
78
910
1112
at
cu
rre
nt
ma
rke
t p
ric
es
bln
. te
ng
e1
415
,71
67
2,1
1 7
33
,32
016
,52
60
0,0
3 2
50
,63
77
6,3
1b
ln.
US
Db
ye
xch
an
ge
rate
21,
02
2,2
22
,116
,818
,32
2,2
24
,61
37
GD
P b
y In
du
stri
al O
rig
inth
osa
nd
ten
ge
1 4
15,7
1 6
72
,11
73
3,3
2 0
16,5
2 6
00
,03
25
0,6
3 7
76
,31
Ind
ust
ry s
ha
re in
GD
Pa
tho
san
dte
ng
e3
00
,03
57
,54
22
,55
69
,18
64
,79
97
,11
113
,0A
gri
cu
ltu
re s
ha
re in
GD
Pa
tho
san
dte
ng
e17
2,0
190
,714
8,5
199
,42
10,9
28
3,6
30
1,9
Se
rvic
es
sha
re in
GD
Pa
tho
san
dte
ng
e..
...
.9
83
,41
05
7,5
1 2
57
,91
60
4,9
1 9
05
,9
38
Re
al G
DP
Gro
wth
%10
0,5
101,
79
8,1
102
,710
9,8
113,5
109
,81
Ind
ust
rya
%10
0,3
104
,19
7,6
102
,711
5,5
113,5
110
,4A
gri
cu
ltu
rea
%9
5,0
99
,18
1,1
121,
79
6,8
117
,110
3,2
Se
rvic
esa
%..
...
.10
0,3
99
,610
8,4
112
,310
9,8
39
GD
P p
er
Ca
pit
ath
ou
san
dte
ng
e9
0,9
109
,111
5,0
135
,117
4,8
218
,82
54
,21
US
D b
ye
xch
an
ge
rate
1 3
50
,71
44
5,9
1 4
68
,81
129
,11
23
0,2
1 4
93
,71
64
5,8
1
40
Co
nsu
me
r P
ric
e In
de
x (C
PI)
%13
9,3
117
,410
7,1
108
,311
3,2
108
,410
5,9
2
Public
Exp
enditure
s o
n E
ducatio
n, H
ealth a
nd S
ocia
l Se
curi
ty
4
1P
ub
lic E
xpe
nd
itu
res
on
So
cia
lS
ec
uri
ty,
as
% o
f GD
P%
0,6
1,6
3,1
7,9
6,6
5,7
5,4
2
42
Pu
blic
Exp
en
dit
ure
so
n E
du
ca
tio
n,
as
% o
f GD
P%
4,6
4,4
4,0
3,9
3,3
3,3
3,2
2
43
Pu
blic
Exp
en
dit
ure
s o
n H
ea
lth
,a
s %
of G
DP
%2
,52
,11,
52
,22
,11,
91,
92
De
mo
gra
phy
4
4T
ota
l Po
pu
lati
on
mln
.p
eop
le15
,715
,514
,914
,914
,914
,814
,81
ma
lem
ln.
pe
op
le7
,67
,57
,27
,27
,27
,17
,11
%4
8,4
48
,44
8,3
48
,34
8,2
48
,04
8,1
1fe
ma
lem
ln.
pe
op
le8
,18
,07
,77
,77
,77
,77
,71

103
%5
1,6
51,
65
1,7
51,
75
1,8
52
,05
1,9
14
5U
rba
n/R
ura
l P
op
ula
tio
n R
ati
o%
...
55
.8..
.5
5.9
55
.95
5.8
57
.43
44
.24
4.1
44
.14
4.2
43
.6
46
Life
Exp
ec
tan
cy a
t B
irth
ye
ars
63
,66
4,0
64
,56
5,5
65
,46
5,6
65
,82
ma
leye
ars
58
,05
8,4
59
,06
0,3
59
,86
0,2
60
,62
fem
ale
ye
ars
69
,76
9,9
70
,47
1,0
71,
37
1,1
71,
32
47
Ra
te o
f Na
tura
l Po
pu
lati
on
pe
r 1,
00
0In
cre
ase
po
pu
lati
on
5,6
4,8
4,6
4,6
4,7
4,8
5,3
2ru
ral
pe
r 1,
00
0p
op
ula
tio
n10
,48
,87
,97
,97
,98
,08
,02
urb
an
pe
r 1,
00
0p
op
ula
tio
n1,
81,
81,
82
,02
,32
,43
,32
48
Ave
rag
e H
ou
seh
old
Siz
ep
ers
on
s3
,63
,53
,53
,43
,43
,73
,62
rura
lp
ers
on
s4
,24
,14
,34
,24
,14
,64
,42
urb
an
pe
rso
ns
3,1
3,0
3,0
3,1
3,1
3,2
3,1
2
49
Pro
po
rtio
n o
f Ho
use
ho
lds,
co
nsi
stin
g o
f:%
...
100
100
100
100
100
100
31
pe
rso
n%
...
1010
1110
1312
32
pe
rso
ns
%..
.18
1819
1919
193
3 p
ers
on
s%
...
22
24
25
25
20
20
34
pe
rso
ns
%..
.2
62
52
62
62
12
23
5 a
nd
mo
re p
ers
on
s%
...
24
23
192
02
72
63
50
Pro
po
rtio
n o
f Ho
use
ho
lds
he
ad
ed
by:
%..
...
...
...
...
.10
0,0
100
,03
ma
le%
...
...
...
...
...
53
,26
1,0
3fe
ma
le%
...
...
...
...
...
46
,83
9,0
3
51
Pro
po
rtio
n o
f Ho
use
ho
lds
wit
h:
as
% o
fho
useh
old
sw
ith
ch
ildre
n3
1 c
hild
as
% o
fho
useh
old
sw
ith
ch
ildre
n..
.2
83
13
23
24
24
53
2 c
hild
ren
as
% o
fho
useh
old
sw
ith
ch
ildre
n..
.2
42
22
12
03
53
43
12
34
56
78
910
1112
ANNEXES

104
POVERTY IN KAZAKHSTAN: CAUSES AND CURES
12
34
56
78
910
1112
3 c
hild
ren
as
% o
fho
useh
old
sw
ith
ch
ildre
n..
.9
87
614
143
4 a
nd
mo
re c
hild
ren
as
% o
fho
useh
old
sw
ith
ch
ildre
n..
.4
43
29
73
52
Ra
te o
f c
hild
ren
invo
lve
dp
er
1,0
00
in d
ivo
rce
po
pu
lati
on
ag
ed
0-1
77
,16
,87
,25
,25
,66
,1..
.10
Re
pro
ductive
Be
havio
ur
5
3T
ota
l Fe
rtili
ty R
ate
%2
,01,
91,
81,
81,
81,
81,
92
54
Cru
de
Bir
th R
ate
pe
r 1,
00
0p
eo
ple
16,3
15,2
14,8
14,2
14,6
14,8
15,3
2
55
Bir
th r
ate
by a
ge
iliv
e b
irth
sp
er
1,0
00
wo
me
n2
un
de
r a
ge
of
20
live
bir
ths
pe
r 1,
00
0w
om
en
44
,63
9,2
36
,53
5,2
32
,62
9,7
27
,02
20
-24
ye
ars
live
bir
ths
pe
r 1,
00
0w
om
en
149
,813
6,6
131,
113
2,3
131,
712
8,4
129
,62
25
-29
live
bir
ths
pe
r 1,
00
0w
om
en
116
,411
2,6
107
,89
9,1
103
,910
4,3
109
,22
30
-34
live
bir
ths
pe
r 1,
00
0w
om
en
60
,95
8,1
59
,45
9,4
63
,56
5,3
69
,82
35
-39
live
bir
ths
pe
r 1,
00
0w
om
en
26
,02
5,4
25
,32
6,1
28
,12
9,9
33
,12
40
-44
live
bir
ths
pe
r 1,
00
0w
om
en
5,6
5,9
5,6
5,6
6,0
6,3
6,9
24
5-4
9liv
e b
irth
sp
er
1,0
00
wo
me
n0
,60
,50
,50
,50
,60
,50
,42

105
MDG 4,Target 5
MDG 5,Target 6
12
34
56
78
910
1112
15-4
9liv
e b
irth
sp
er
1,0
00
wo
me
n6
0,7
56
,65
4,7
51,
15
2,3
52
,05
3,7
2
56
Liv
e B
irth
s2
53
,22
32
,42
22
,42
16,0
22
0,4
219
,32
27
,27
57
Co
ntr
ac
ep
tive
Pre
vale
nc
e R
ate
%o
f wo
me
na
ge
d 15
-49
...
38
,9..
.3
2,9
32
,43
5,9
37
,42
58
Co
ntr
ac
ep
tive
Pre
vale
nc
e R
ate
% o
fa
mo
ng
ma
rrie
d w
om
en
ma
rrie
dw
om
en
ag
ed
15
-49
...
...
...
66
,1..
...
...
.10
59
Ab
ort
ion
Ra
tea
bo
rtio
ns
pe
r 10
0 li
veb
irth
s7
6,7
67
,56
7,1
65
,26
1,7
63
,3..
.10
He
alth
60
Infa
nt
Mo
rta
lity R
ate
(IM
R)
pe
r 1,
00
0b
orn
aliv
e2
5,4
24
,92
1,6
20
,719
,619
,417
,02
61
Un
de
r-five
Mo
rta
lity R
ate
pe
r 1,
00
0(U
5M
R)ñ
bo
rn3
3,2
32
,62
8,9
26
,82
5,4
22
,82
1,7
10
62
Ma
tern
al
Mo
rta
lity R
ate
(M
MR
)ñ p
er
100
,00
0p
op
ula
tio
n5
2,9
59
,05
4,8
49
,64
4,2
49
,25
1,9
2
63
Bir
ths
Att
en
de
d b
y S
kill
ed
Pe
rso
nn
el
%9
8,1
97
,69
8,0
97
,89
8,3
98
,59
8,9
64
Mo
rta
lity R
ate
pe
r1,
00
0p
op
ula
tio
n10
,710
,410
,29
,810
,110
,010
,02
65
Infa
nts
Un
de
r Q
ua
lifie
d M
ed
ica
lP
ers
on
ne
l Ca
re%
100
,010
0,0
100
,010
0,0
100
,010
0,0
100
,02
66
Pre
vale
nc
e o
f W
ast
ed
Ch
ildre
n(L
ow
We
igh
t-fo
r-H
eig
ht a
mo
ng
Un
de
r-fi
ves)
%..
...
...
.1,
8..
...
...
.11
67
Pre
vale
nc
e o
f S
tun
ted
Ch
ildre
n(L
ow
He
igh
t-fo
r-A
ge
am
on
gU
nd
er-
five
s)%
...
...
...
9,7
...
...
...
11
ANNEXES
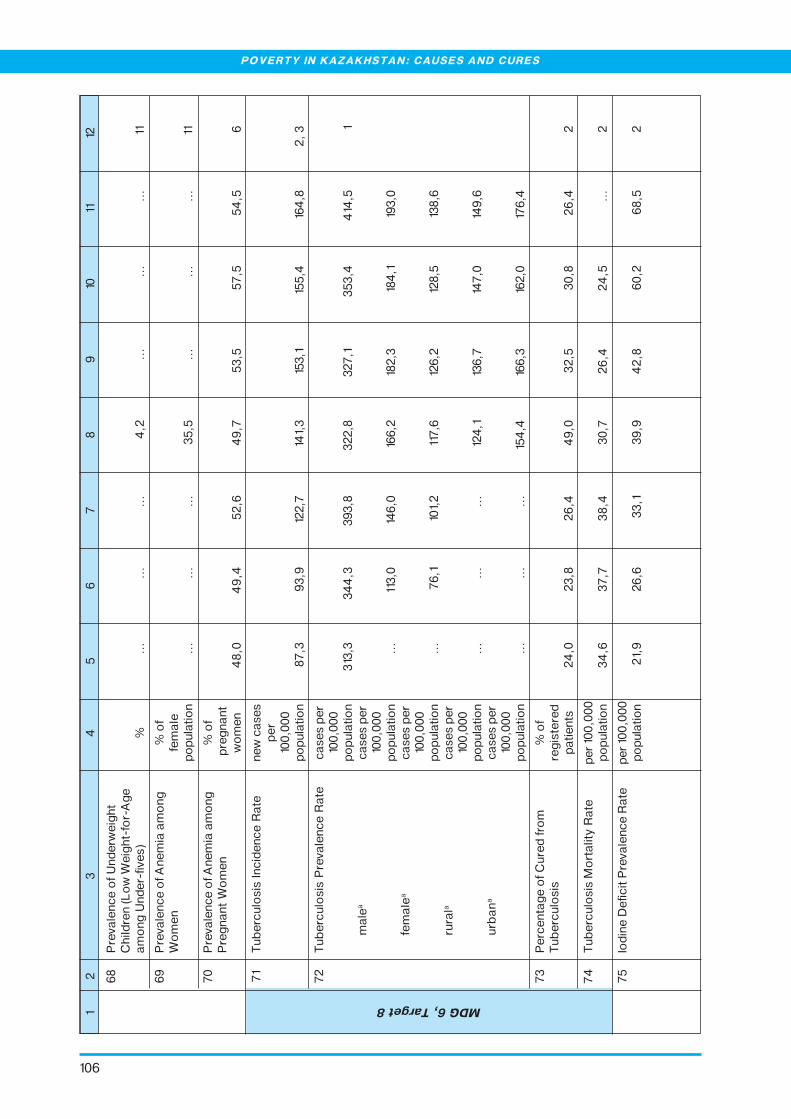
106
POVERTY IN KAZAKHSTAN: CAUSES AND CURES
MDG 6, Target 86
8P
reva
len
ce
of
Un
de
rwe
igh
tC
hild
ren
(L
ow
We
igh
t-fo
r-A
ge
am
on
g U
nd
er-
five
s)%
...
...
...
4,2
...
...
...
11
69
Pre
vale
nc
e o
f A
ne
mia
am
on
g%
of
Wo
me
nfe
ma
lep
op
ula
tio
n..
...
...
.3
5,5
...
...
...
11
70
Pre
vale
nc
e o
f A
ne
mia
am
on
g%
of
Pre
gn
an
t W
om
en
pre
gn
an
tw
om
en
48
,04
9,4
52
,64
9,7
53
,55
7,5
54
,56
71
Tu
be
rcu
losi
s In
cid
en
ce
Ra
ten
ew
ca
ses
pe
r10
0,0
00
po
pu
lati
on
87
,39
3,9
122
,714
1,3
153
,115
5,4
164
,82
, 3
72
Tu
be
rcu
losi
s P
reva
len
ce
Ra
tec
ase
s p
er
100
,00
0p
op
ula
tio
n3
13,3
34
4,3
39
3,8
32
2,8
32
7,1
35
3,4
414
,51
ma
lea
ca
ses
pe
r10
0,0
00
po
pu
lati
on
...
113,0
146
,016
6,2
182
,318
4,1
193
,0
fem
ale
ac
ase
s p
er
100
,00
0p
op
ula
tio
n..
.7
6,1
101,
211
7,6
126
,212
8,5
138
,6
rura
lac
ase
s p
er
100
,00
0p
op
ula
tio
n..
...
...
.12
4,1
136
,714
7,0
149
,6
urb
an
ac
ase
s p
er
100
,00
0p
op
ula
tio
n..
...
...
.15
4,4
166
,316
2,0
176
,4
73
Pe
rce
nta
ge
of
Cu
red
fro
m%
of
Tu
be
rcu
losi
sre
gis
tere
dp
ati
en
ts2
4,0
23
,82
6,4
49
,03
2,5
30
,82
6,4
2
74
Tu
be
rcu
losi
s M
ort
alit
y R
ate
pe
r 10
0,0
00
po
pu
lati
on
34
,63
7,7
38
,43
0,7
26
,42
4,5
...
2
7
5Io
din
e D
efi
cit
Pre
vale
nc
e R
ate
pe
r 10
0,0
00
po
pu
lati
on
21,
92
6,6
33
,13
9,9
42
,86
0,2
68
,52
12
34
56
78
910
1112

107
MDG 6,Target
7
12
34
56
78
910
1112
76
Se
xua
lly T
ran
smit
ted
Dis
ea
ses
ne
wly
(ST
D)
Inc
ide
nc
e R
ate
are
gis
tere
dc
ase
s o
fsy
ph
ilis
an
dg
on
orr
he
ap
er
100
,00
0p
op
ula
tio
n3
60
,03
70
,12
39
,13
20
,63
22
,93
15,5
...
10
77
Se
xua
lly T
ran
smit
ted
Dis
ea
ses
pe
r(S
TD
) P
reva
len
ce
Ra
te10
0,0
00
po
pu
lati
on
2S
yp
hili
s, a
ll fo
rms
per
10
0,0
00
po
pu
lati
on
23
1,2
26
8,9
23
1,4
182
,216
1,4
140
,612
3,2
2,
3ru
ralñ
per
10
0,0
00
po
pu
lati
on
...
...
...
...
104
,69
0,0
79
,12
urb
an
ñp
er 1
00
,00
0p
op
ula
tio
n..
...
...
...
.2
06
,318
0,0
157
,02
Go
no
rrh
oe
ap
er 1
00
,00
0p
op
ula
tio
n11
0,0
91,
18
1,9
81,
98
8,2
89
,58
6,6
2,
3ru
ralñ
per
10
0,0
00
po
pu
lati
on
...
...
...
...
31,
83
2,9
31,
52
urb
an
ñp
er 1
00
,00
0p
op
ula
tio
n..
...
...
...
.13
2,8
133
,412
9,0
2
78
HIV
Inc
ide
nc
ep
eo
ple
79
43
78
151
00
01
34
72
52
23
25
77
ma
lep
eo
ple
...
...
...
...
26
99
50
55
47
fe
ma
lep
eo
ple
...
...
...
...
78
22
518
17
7
9H
ea
lth
Fa
cili
tie
su
nit
s1
24
4,0
1 0
06
,09
91,
09
17,0
93
8,0
98
1,0
1 0
05
,02
80
Ho
spit
al B
ed
s p
er
10 0
00
be
ds
top
op
ula
tio
n10
,00
0p
op
ula
tio
n10
0,3
89
,87
9,6
72
,67
2,1
74
,47
5,3
2
81
Ph
ysi
cia
ns
pe
r 10
00
0p
ers
on
sp
op
ula
tio
n to
10
,00
0p
op
ula
tio
n3
7,4
35
,33
5,6
34
,33
3,9
34
,63
6,1
2
82
Pa
ram
ed
ica
l Sp
ec
ialis
ts p
er
pe
rso
ns
10 0
00
po
pu
lati
on
to 1
0,0
00
po
pu
lati
on
90
,58
5,0
77
,77
4,1
71,
87
3,8
76
,32
83
Me
dic
al V
isit
s p
er
10 0
00
me
dic
al
po
pu
lati
on
visi
ts p
er
10,0
00
po
pu
lati
on
199
,018
2,0
181,
017
3,0
170
,016
6,0
168
,52
ANNEXES

108
POVERTY IN KAZAKHSTAN: CAUSES AND CURES
MDG 7,Target 10
MDG 2, Target 4MDG 2, Target 31
23
45
67
89
1011
12
84
Po
pu
lati
on
pe
r P
hysi
cia
np
ers
on
s2
69
,02
81,
02
83
,02
95
,03
04
,02
89
,02
77
,02
85
Po
pu
lati
on
pe
r P
ara
-Me
dic
al
Sp
ec
ialis
tp
ers
on
s10
5,0
118
,012
5,0
135
,014
0,0
136
,013
1,0
2
Education
86
Ad
ult
Lit
era
cy R
ate
%9
8,9
99
,19
9,3
99
,59
9,5
99
,5..
.4
ma
lea
%9
9,7
99
,79
9,8
99
,89
9,9
99
,9..
.
fem
ale
a%
99
,79
9,8
99
,99
9,3
99
,99
9,9
...
87
Pre
-Pri
ma
ry E
du
ca
tio
n%
of
En
rolm
en
t (n
et
rate
s)p
op
ula
tio
na
ge
d 3
-6..
.12
,312
,510
,511
,913
,9..
.10
88
Ba
sic
Ed
uc
ati
on
En
rolm
en
t%
of
(gro
ss r
ate
s)re
leva
nt
po
pu
lati
on
94
,79
4,2
94
,19
4,3
99
,610
0,1
...
10
89
Up
pe
r S
ec
on
da
ry E
du
ca
tio
nE
nro
lme
nt
(ge
ne
ral a
nd
% o
fvo
ca
tio
na
l/te
ch
nic
al;
po
pu
lati
on
gro
ss r
ate
s) a
ge
d 1
5-1
85
7,3
57
,45
9,8
59
,65
2,1
54
,5..
.10
90
Hig
he
r E
du
ca
tio
n E
nro
lme
nt
% o
f(g
ross
ra
tes)
po
pu
lati
on
ag
ed
19
-24
16,2
18,7
21,
12
4,1
29
33
,4..
.10
91
Stu
de
nts
pe
r T
ea
ch
er
pe
rso
ns
12,8
12,4
12,4
11,8
11,6
11,2
13,5
2
92
Gir
ls t
o B
oys
Ra
tio
, a
ll le
vels
en
rolm
en
ta%
...
...
1,0
11,
02
11,
01
1,0
2
93
Gir
ls t
o B
oys
Ra
tio
, P
rim
ary
Le
vel E
nro
lme
nta
%0
,98
0,9
80
,97
0,9
70
,96
0,9
50
,96
94
Gir
ls t
o B
oys
Ra
tio
, S
ec
on
da
ryL
eve
l En
rolm
en
ta%
1,0
91,
05
1,0
91,
09
1,1
1,1
1,0
9
95
Gir
ls t
o B
oys
Ra
tio
, T
ert
iary
Le
vel E
nro
lme
nta
%..
...
.1,
151,
02
1,0
71,
07
1,0
7
Ho
usin
g
96
Po
pu
lati
on
usi
ng
imp
rove
dw
ate
r so
urc
es
%..
.5
8,3
61,
46
3,1
67
,85
2,5
52
,812
97
Pro
po
rtio
n o
f wa
ter
sup
ply
fro
m s
tan
d-a
lon
e u
nit
s, w
ith
qu
alit
y b
elo
w m
icro
bio
log
ica
lst
an
da
rds
%9
,012
,67
,77
,78
,0..
...
.12
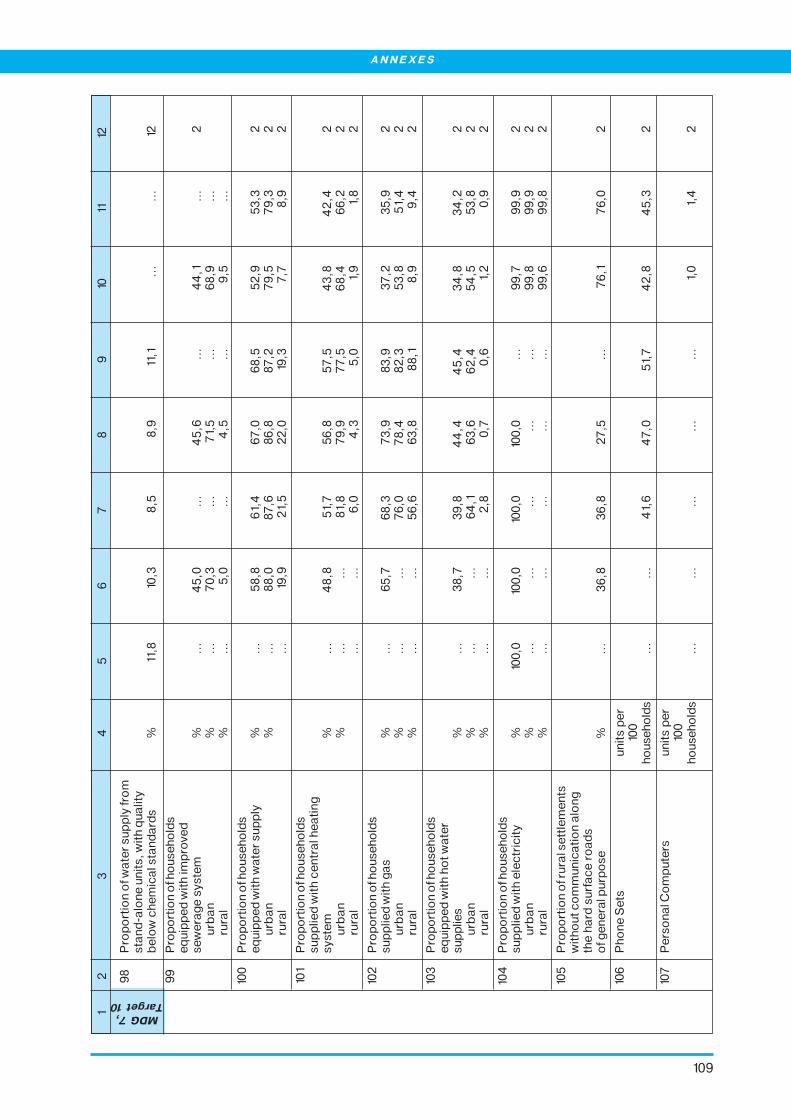
109
98
Pro
po
rtio
n o
f wa
ter
sup
ply
fro
mst
an
d-a
lon
e u
nit
s, w
ith
qu
alit
yb
elo
w c
he
mic
al s
tan
da
rds
%11
,810
,38
,58
,911
,1..
...
.12
9
9P
rop
ort
ion
of h
ou
seh
old
se
qu
ipp
ed
wit
h im
pro
ved
sew
era
ge
syst
em
%..
.4
5,0
...
45
,6..
.4
4,1
...
2u
rba
n%
...
70
,3..
.7
1,5
...
68
,9..
.ru
ral
%..
.5
,0..
.4
,5..
.9
,5..
.
100
Pro
po
rtio
n o
f ho
use
ho
lds
eq
uip
pe
d w
ith
wa
ter
sup
ply
%..
.5
8,8
61,
46
7,0
68
,55
2,9
53
,32
urb
an
%..
.8
8,0
87
,68
6,8
87
,27
9,5
79
,32
rura
l..
.19
,92
1,5
22
,019
,37
,78
,92
101
Pro
po
rtio
n o
f ho
use
ho
lds
sup
plie
d w
ith
ce
ntr
al h
ea
tin
gsy
ste
m%
...
48
,85
1,7
56
,85
7,5
43
,84
2,4
2u
rba
n%
...
...
81,
87
9,9
77
,56
8,4
66
,22
rura
l..
...
.6
,04
,35
,01,
91,
82
102
Pro
po
rtio
n o
f ho
use
ho
lds
sup
plie
d w
ith
ga
s%
...
65
,76
8,3
73
,98
3,9
37
,23
5,9
2u
rba
n%
...
...
76
,07
8,4
82
,35
3,8
51,
42
rura
l%
...
...
56
,66
3,8
88
,18
,99
,42
103
Pro
po
rtio
n o
f ho
use
ho
lds
eq
uip
pe
d w
ith
ho
t w
ate
rsu
pp
lies
%..
.3
8,7
39
,84
4,4
45
,43
4,8
34
,22
urb
an
%..
...
.6
4,1
63
,66
2,4
54
,55
3,8
2ru
ral
%..
...
.2
,80
,70
,61,
20
,92
104
Pro
po
rtio
n o
f ho
use
ho
lds
sup
plie
d w
ith
ele
ctr
icit
y%
100
,010
0,0
100
,010
0,0
...
99
,79
9,9
2u
rba
n%
...
...
...
...
...
99
,89
9,9
2ru
ral
%..
...
...
...
...
.9
9,6
99
,82
105
Pro
po
rtio
n o
f ru
ral s
ett
lem
en
tsw
ith
ou
t c
om
mu
nic
ati
on
alo
ng
the
ha
rd s
urf
ac
e r
oa
ds
of g
en
era
l pu
rpo
se%
...
36
,83
6,8
27
,5..
.7
6,1
76
,02
106
Ph
on
e S
ets
un
its
pe
r10
0h
ou
seh
old
s..
...
.4
1,6
47
,05
1,7
42
,84
5,3
2
107
Pe
rso
na
l Co
mp
ute
rsu
nit
s p
er
100
ho
use
ho
lds
...
...
...
...
...
1,0
1,4
2
MDG 7,Target 10
12
34
56
78
910
1112
ANNEXES

110
POVERTY IN KAZAKHSTAN: CAUSES AND CURES
No
tes
12
34
56
78
910
1112
108
Inte
rne
t U
sers
(R
eg
iste
red
)u
nit
s p
er
100
ho
use
ho
lds
...
...
88
5,0
11 8
23
,03
02
40
0,0
65
2 7
12,0
...
2
109
Mo
tor
Ve
hic
les
in P
ers
on
al
un
its
pe
rU
se
100
ho
use
ho
lds
62
,06
1,0
62
,06
4,0
65
,06
6,0
...
2
Dru
g C
ircula
tio
n C
ontr
ol a
nd C
rim
inalit
y
11
0M
orb
idit
y R
ate
(A
lco
ho
lism
)p
er
100
,00
0p
op
ula
tio
n9
7,0
24
6,0
215
,019
2,0
215
,02
58
,03
49
,12
ma
lea
pe
r10
0,0
00
po
pu
lati
on
...
46
5,0
40
7,0
36
0,0
39
6,0
46
9,0
618
,6fe
ma
lea
...
41,
03
7,0
36
,04
7,0
61,
09
8,7
111
Mo
rbid
ity R
ate
(D
rug
Ad
dic
tio
n)
pe
r10
0,0
00
po
pu
lati
on
23
,56
0,1
65
,56
4,5
80
,08
4,2
...
2
112
Cri
me
Ra
tec
rim
es
pe
r10
0,0
00
po
pu
lati
on
11,0
8,1
9,1
9,3
10,2
10,3
9,1
2
a F
igu
res
we
re e
sti
ma
ted
by
Ka
zak
hs
tan
Sta
tis
tic
s A
ge
nc
y u
po
n r
eq
ue
st
fro
m U
ND
PK
aza
kh
sta
n.
b T
he
ind
ica
tor
is c
alc
ula
ted
sin
ce
20
01,
wh
en
Ka
zak
hst
an
Sta
tist
ics
Ag
en
cy s
tart
ed
La
bo
ur
Fo
rce
Su
rve
y.
c 2
00
2 f
igu
res a
re e
sti
ma
ted
by
Ka
zak
hsta
n S
tati
sti
cs A
ge
nc
y u
po
n r
eq
ue
st
fro
m U
ND
PK
aza
kh
sta
n.
d L
aw
on
Sta
te S
oc
ial
Be
ne
fit
wa
s in
tro
du
cd
in
19
99
.
e L
aw
on
Sp
ec
ial
Sta
te B
en
efi
t w
as
intr
od
uc
es
in 1
99
9.
f L
aw
on
Sta
te S
pe
cia
l B
en
ed
its
wa
s in
tro
du
ce
d i
n 2
00
0.
g T
he “
po
vert
y lin
e in
Kaz
akhs
tan
was
intr
od
uced
by
Law
on
Sub
sist
ence
Min
imum
whi
ch b
ecam
ee
ffe
cti
ve s
inc
e J
an
ua
ry 1
, 2
00
0.
It s
erv
es
as
elig
ibili
ty c
rite
rio
n f
or
sta
te t
arg
ete
d s
oc
ial
ass
ista
nc
e a
nd
eq
ua
ls t
o 4
0%
of
sub
sist
en
ce
min
imu
m (
as
of
20
02
).h
In K
aza
kh
sta
n t
he
sta
te t
arg
ete
d s
oc
ial
assis
tan
ce
wa
s i
ntr
od
uc
ed
in
20
02
by
La
w o
nS
tate
Ta
rge
ted
So
cia
l A
ssis
tan
ce
.i
20
02
Fig
ure
s p
ub
lish
ed
in 2
00
3 K
aza
kh
sta
n S
tati
stic
al Y
ea
rbo
ok
by K
aza
kh
sta
n S
tati
stic
sA
ge
nc
y.
j D
ata
fro
m I
nfo
rma
tio
n a
nd
An
aly
sis
Ce
ntr
e o
f M
inis
try
of
La
bo
ur
an
d S
oc
ial
Pro
tec
tio
n,
20
04
.
So
urc
es
12
00
3 S
tati
stic
al
Ye
arb
oo
k f
or
Ka
zak
hst
an
.2
Po
vert
y M
on
ito
rin
g I
nd
ica
tors
in
Ka
zak
hst
an
. U
ND
P/K
aza
kh
sta
n S
tati
stic
s A
ge
nc
y,
20
03
.3
Liv
ing
Sta
nd
ard
s o
f P
op
ula
tio
n i
n K
aza
kh
sta
n.
Ka
zak
hst
an
Sta
tist
ics
Ag
en
cy
, 2
00
3.
4L
ab
ou
r a
nd
Em
plo
ym
en
t o
f P
op
ula
tio
n i
n 2
00
3.
Ka
zak
hst
an
Sta
tist
ics
Ag
en
cy,
20
03
.5
Ma
in I
nd
ica
tors
of
La
bo
ur
Ma
rke
t in
Ka
zak
hst
an
in
20
02
. K
aza
kh
sta
n S
tati
stic
sA
ge
nc
y,
20
02
.6
He
alt
h o
f P
op
ula
tio
n a
nd
He
alt
h C
are
in
th
e R
K,
199
1-2
00
1, M
inis
try o
f H
ea
lth
, 2
00
2.
7H
IV I
nfe
cti
on
. In
form
ati
on
al
Sta
tist
ica
l B
ulle
tin
fo
r 2
00
2 b
y R
ep
ub
lica
n C
en
ter
fo
rP
reve
nti
on
an
d C
on
tro
l o
f H
IV/A
IDS
.8
Fig
ure
s w
ere
pro
vid
ed
by D
ep
art
me
nt
of
Bu
dg
et
Pro
gra
mm
es
Fin
an
cin
g a
nd
So
cia
l A
ssis
tan
ce
of
the
Min
istr
y o
f L
ab
ou
r a
nd
So
cia
l P
rote
cti
on
of
Ka
zak
hst
an
up
on
re
qu
est
fro
m U
ND
P K
aza
kh
sta
n i
n 2
00
3.
9F
igu
res
we
re p
rovi
de
d b
y I
nfo
rma
tio
n a
nd
An
aly
sis
Ce
ntr
e u
nd
er
Min
istr
yo
f L
ab
ou
r a
nd
So
cia
l P
rote
cti
on
of
Ka
zak
hst
an
up
on
re
qu
est
fro
m U
ND
PK
aza
kh
sta
n i
n 2
00
3.
10S
oc
ial
Mo
nit
or
20
03
. U
NIC
EF
, 2
00
3.
11D
em
og
rap
hic
an
d H
ea
lth
Su
rve
y 1
99
5,
199
9,
UN
FP
A.
12N
ati
on
al
Hu
ma
n D
eve
lop
me
nt
Re
po
rt 2
00
2 “
Ru
ral
De
velo
pm
en
t in
Ka
zak
hst
an
:C
ha
llen
ge
s a
nd
Pe
rsp
ec
tive
s”,
UN
DP
Ka
zak
hst
an
, 2
00
3.

111
Annex 4
UNDP KAZAKHSTAN – LIST OF THEME REPORTS FOR 2002-2004
Published Reports
1. Non-Governmental Organizations of Kazakhstan: Past, Present, Future. UNDP Kazakhstan,2002 (in Russian, English and Kazakh)http://www.undp.kz/library_of_publications/center_view.html?id=107
2. Rural Areas of Kazakhstan: New Aspects of Typology. UNDP Kazakhstan, 2002 (in Russian)http://www.undp.kz/library_of_publications/center_view.html?id=336
3. Donor Assistance to Kazakhstan. An Overview – 2002. UNDP Kazakhstan, 2003 (in English)http://www.undp.kz/library_of_publications/center_view.html?id=321
4. Perception of Corruption in Kazakhstan by Public Officials, Private Business and Civil Society.UNDP Kazakhstan, 2003 (in Russian and English)http://www.undp.kz/library_of_publications/center_view.html?id=384
5. Environment and Development Nexus in Kazakhstan. UNDP Kazakhstan, 2004 (in Russian andEnglish)http://www.undp.kz/library_of_publications/center_view.html?id=2147
6. Water Resources of Kazakhstan in the New Millennium. UNDP Kazakhstan, 2004 (in Russianand English)http://www.undp.kz/library_of_publications/center_view.html?id=2496
Reports to be published
1. Small Business in Kazakhstan: Tendencies and Perspectives (in Russian and English)2. Microcrediting in Kazakhstan: Facts and Figures (in Russian, English and Kazakh)3. Status of Oralmans in Kazakhstan (in Russian, English and Kazakh)4. Women in Kazakhstan (in Russian, English and Kazakh)5. Kazakhstan’s Trade and Implications of WTO Accession (in Russian and English)6. Status of Information and Communication Technologies in Kazakhstan.7. Democratic Reforms in Kazakhstan (in Russian, English and Kazakh)8. Kazakhstan’s Agriculture – Status and Needs9. Kazakhstan’s Industrial Development – Status and Needs
ANNEXES

112
POVERTY IN KAZAKHSTAN: CAUSES AND CURES
AUTHOURS GROUP
Vyacheslav Bobkov - Leader of Expert Team, Director, Russian Living Standards Centre,PhD in economics, professor
Vladimir Litvinov - Deputy Director – Head of Living Standards and Monitoring Unit, RussianLiving Standards Centre, PhD in economics, professor
Tatiana Stepanova - Head of Consumer Budgets and Social Protection Unit, Russian LivingStandards Centre, PhD in economics
Nikolay Malikov - Head of Social Development Unit, Russian Living Standards Centre,PhD in philosophy
Alevtina Gulugina - Deputy Head of Living Standards and Monitoring Unit, Russian LivingStandards Centre, PhD in economics
Michael Smirnov - Leading expert of Living Standards and Monitoring Unit, RussianLiving Standards Centre, PhD in economics
Zaure Mukhamedkarimova - National Consultant, UNDP Kazakhstan
UNDP CONSULTATIVE BOARD
Fikret Akcura - UN Resident Coordinator/UNDP Resident RepresentativeGordon Johnson - Deputy Resident Representative, UNDP KazakhstanSvetlana Islamova - Development Coordinator/Poverty Unit Chief, UNDP KazakhstanSelima Salamova - Poverty Programme Associate, UNDP KazakhstanZhanna Bakauova - UN Coordination Officer-Analyst, UNDP KazakhstanMalin Berggren - Junior Professional Officer, UNDP KazakhstanZhanar Sagimbayeva - Economic Transition Adviser, UNDP KazakhstanGaukhar Mukhatzhanova - Media and Outreach Specialist, UNDP Kazakhstan
UNDP COORDINATION GROUP
Svetlana Islamova - Development Coordinator/Poverty Unit Chief, UNDP KazakhstanSelima Salamova - Poverty Programme Associate, UNDP KazakhstanAlma Buirakulova - Poverty Research Assistant, UNDP KazakhstanMaral Sheshembekova - Project Manager, UNDP Poverty ProjectAliya Ilyassova - National Consultant, UNDP Poverty Project
TECHNICAL SUPPORT
Translation in English - Irina BuchinskayaEditing in Russian - Larisa Lukina
- Svetlana Islamova- Selima Salamova- Alma Buirakulova
Editing and proof-readingin English - Svetlana Islamova
- Malin Berggren- Selima Salamova- Alma Buirakulova
Translation in Kazakh - Kaysar ZhorabekovCover Design - Zauresh MadanovaLayout - Nikolay Georgiadi
Photos -Photos from archive of the Small Grants project of UNDP Semipalatinsk Programme,sociological survey of rural areas by UNDP Kazakhstan, and photos of Pavel Tischenko and Oleg Ionovsubmitted for the UNDP supported Anti-Poverty Exhibition