Embed Size (px)
Citation preview

Poverty as a social phenomenon; policies of social security
European Social Policy course

Poverty and social security 2
Poverty and social security
Social context of poverty How to understand and measure poverty
and the distribution of wealth Incidence of poverty How to fight poverty Systems of social security

Poverty and social security 3
Social context of poverty Cultural context of poverty (example of Indian rural women or
St. Franciscus) Association with the concepts of
life chances (Ralf Dahrendorf 1979) Social exclusion/inclusion Social marginalization Social differentiation, stratification… Social cohesion, social trust, (… social capital)
Relevant contexts: Labour market Family Living area Responsiveness of public/social policies / efficiency of states Individual history, phase of the life course Social protection

Poverty and social security 4
Risk of poverty and social status – EU 15Source: Joint report on social inclusion (2004)
Poverty and social security 5
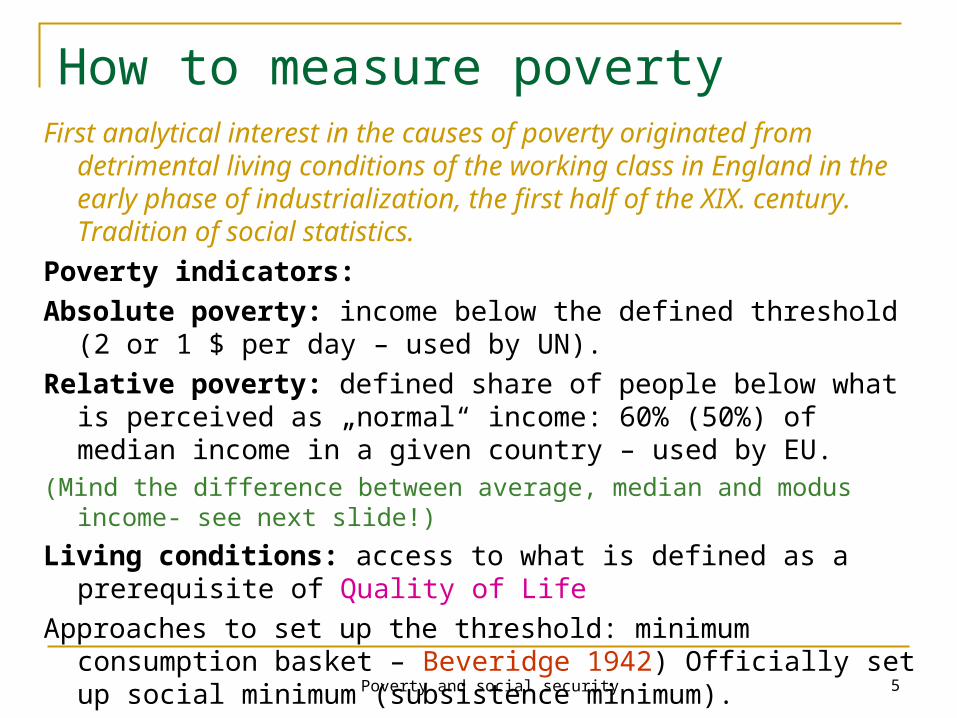
How to measure poverty First analytical interest in the causes of poverty originated
from detrimental living conditions of the working class in England in the early phase of industrialization, the first half of the XIX. century. Tradition of social statistics.
Poverty indicators:Absolute poverty: income below the defined threshold (2 or 1
$ per day – used by UN). Relative poverty: defined share of people below what is
perceived as „normal“ income: 60% (50%) of median income in a given country – used by EU.
(Mind the difference between average, median and modus income- see next slide!)
Living conditions: access to what is defined as a prerequisite of Quality of Life
Approaches to set up the threshold: minimum consumption basket – Beveridge 1942) Officially set up social minimum (subsistence minimum).
Poverty and social security 6
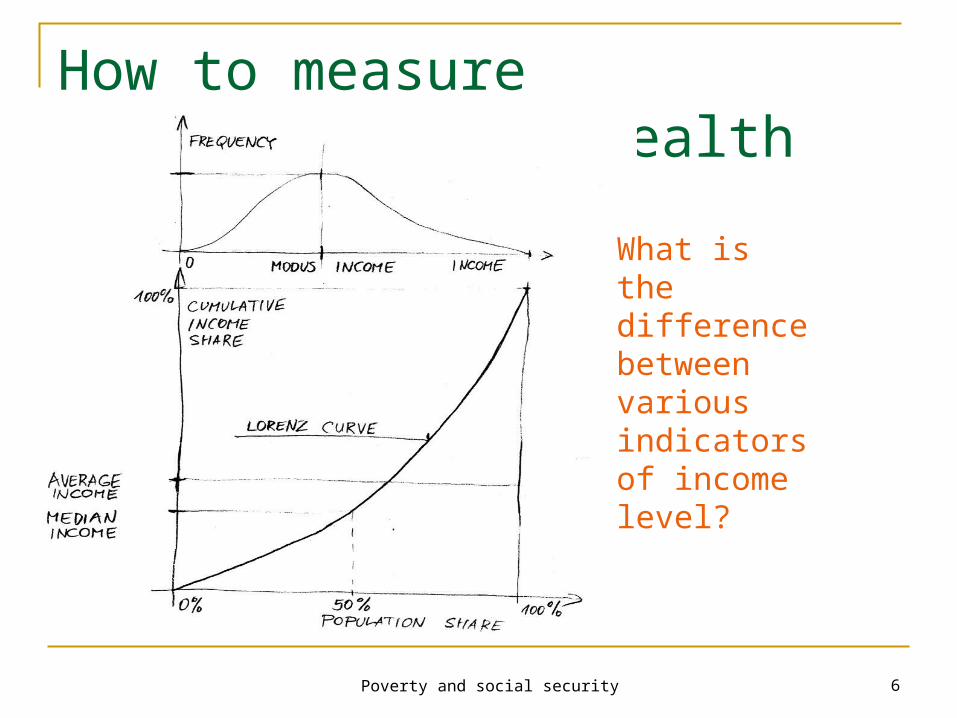
How to measure distribution of wealth
What is the difference between various indicators of income level?

Poverty and social security 7
How to measure distribution of wealthThe Gini coefficient can be understood by looking at the Lorenz curve, which plots the proportion of total income held by each percentile of the population, ranked in order of income.A. Complete Income
EqualityB. Lorenz Curve for a Typical Income Distribution
Population share (%) Population share (%)The Lorenz curve of Diagram A represents complete equality of income, and is the 45-degree line joining the bottom left-hand corner of the diagram to the top right-hand corner. Here, the bottom 10 per cent of the population receives 10 per cent of total income, the bottom 20 per cent receives 20 per cent of the total income and so on. Complete inequality would be represented by a Lorenz curve which was made up of the horizontal axis and the vertical axis on the far right-hand side. Diagram B shows the Lorenz curve for a typical income distribution. The curve lies below the line of complete equality. The Gini coefficient is the ratio of the area between the Lorenz curve and the 5-degree line, i.e. the shaded area in Diagram B, to the total area under the 45-degree line. If incomes become more unequally distributed, the Lorenz curve bulges further away from the complete equality line and the area between the curve and the 45-degree line increases. Thus the Gini coefficient rises with rising inequality and falls with falling inequality.
Poverty and social security 8
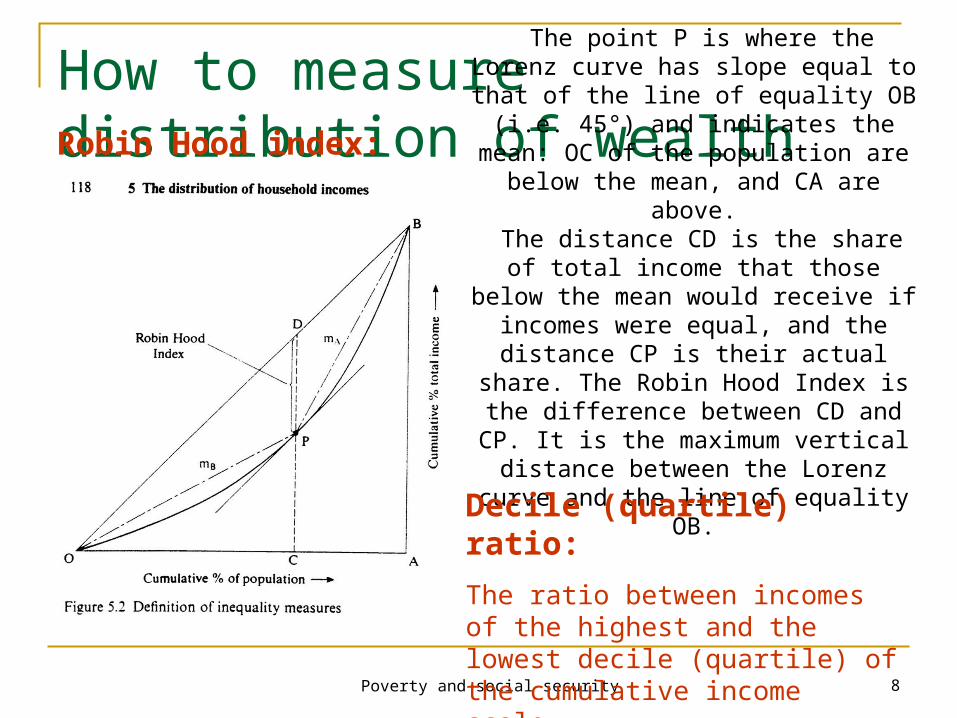
How to measure distribution of wealth
The point P is where the Lorenz curve has slope equal to that of the
line of equality OB (i.e. 45°) and indicates the mean: OC of the
population are below the mean, and CA are above.
The distance CD is the share of total income that those below the
mean would receive if incomes were equal, and the distance CP is their
actual share. The Robin Hood Index is the difference between CD and CP. It is the maximum vertical distance between the Lorenz curve and the
line of equality OB.
Robin Hood index:
Decile (quartile) ratio:
The ratio between incomes of the highest and the lowest decile (quartile) of the cumulative income scale.
Poverty and social security 9
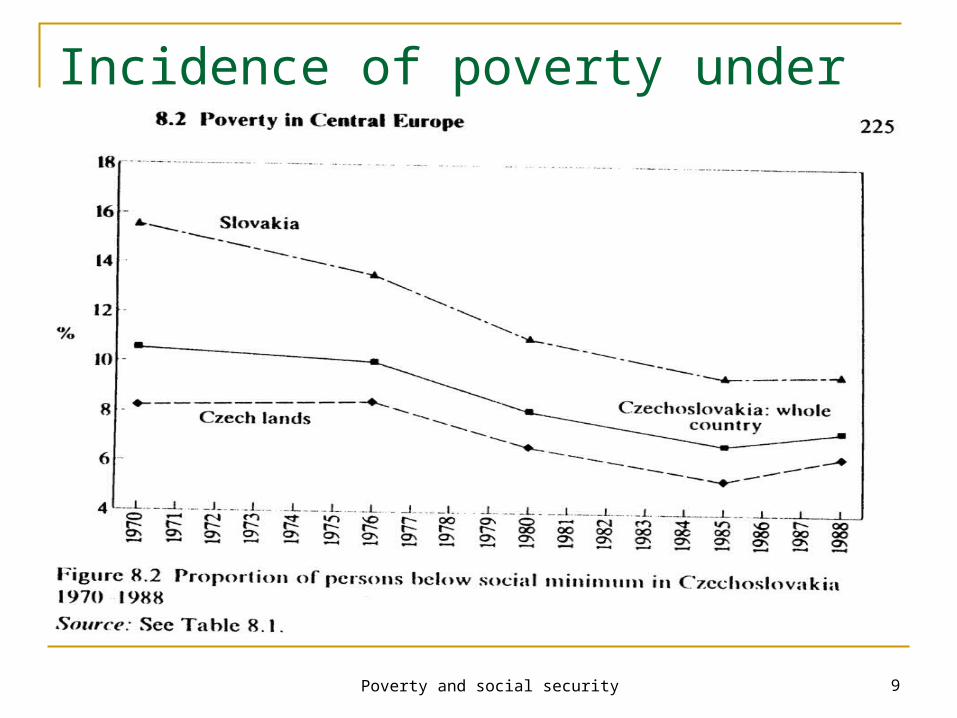
Incidence of poverty under Communism

Poverty and social security 10
Comparison of income distribution in socialist Czechoslovakia and United Kingdom

Poverty and social security 11
Poverty in the beginning of the transformation – East and West

Poverty and social security 12
Poverty in the beginning of the transformation – East and West
Per cent of median income 50% 60%
Nordic countriesDenmark 1992 7.1 14.2Finland 1991 5.8 11.2Norway 1991 6.1 12.1Sweden 1992 6.3 11.1Continental EuropeAustria 1987 6.7 12.2Belgium 19925.5 11.4France 1989 9.4 15.8Germany 1989 5.8 11.7Luxembourg 1991 4.2
12.1 Netherlands 1991 6.7 11.8
Source: Computations from Luxembourg Income Study (LIS) micro database.
Relative poverty rates: persons below a fraction of median income, 22 industrialized countries, early 1990s
Southern EuropeItaly 1991 10.9 19.0Spain 1990 10.5 17.9Anglo-Saxon countriesAustralia 1989 12.0 19.4Canada 1991 11.4 17.1Ireland 1987 11.7 19.9United Kingdom 1991 14.6 23.0United States 1991 18.0 24.2Central and Eastern EuropeCzech Republic 1992 2.1 6.0Hungary 1992 8.6 14.7Poland 1992 9.9 16.3Russia 1992 19.7 26.4Slovak Republic 1992 2.0 5.8

Poverty and social security 13
Median household income in income quartiles Source: EQLS data, Fahey, T. (2004)
0
500
1000
1500
2000
2500
3000
3500Tu
rkey
Rom
ania
Bul
garia
.
Latv
ia
Lith
uani
a
Est
onia
Pol
and
Slo
vaki
a
Hun
gary
.
Cze
ch R
ep
Mal
ta
Gre
ece
Slo
veni
a
Por
tuga
l
Cyp
rus
Spa
in
.
Sw
eden U
K
Fran
ce
Ger
man
y
Italy
Finl
and
Bel
gium
Net
herla
nds
Aus
tria
Irela
nd
Den
mar
k
Luxe
mbo
urg
€ P
PS
4th (top) q'tile
3rd q'tile
2nd q'tile
1st (low) q'tile
Poverty and social security 14
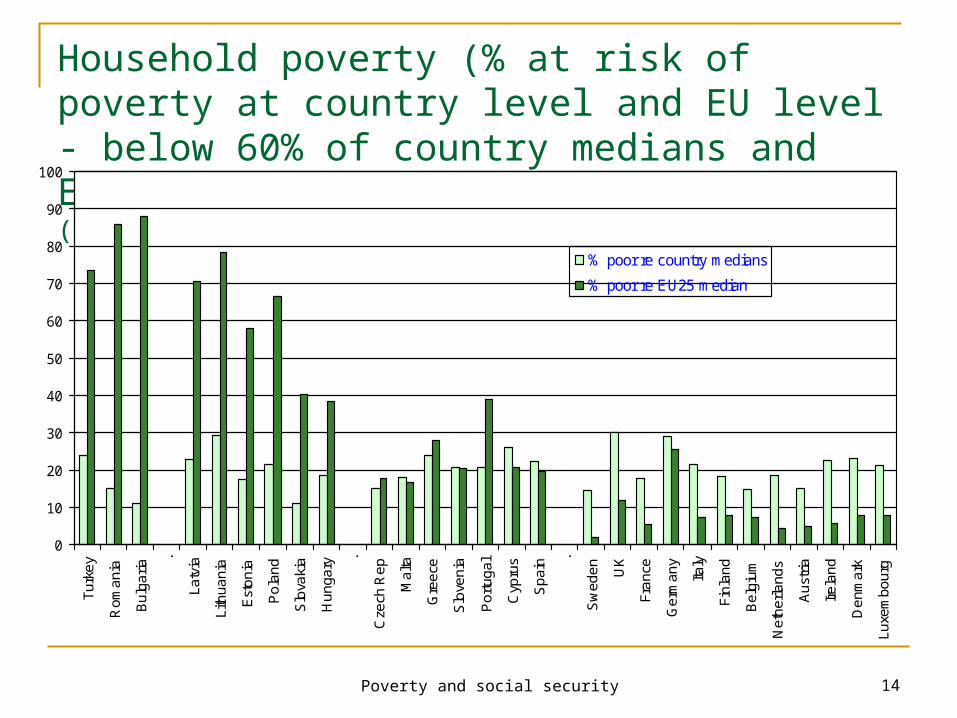
Household poverty (% at risk of poverty at country level and EU level - below 60% of country medians and EU25 median) Source: EQLS data, Fahey, T. (2004)
0
10
20
30
40
50
60
70
80
90
100
Turk
ey
Ro
man
ia
Bul
gari
a .
Latv
ia
Lith
uani
a
Est
oni
a
Pol
and
Slo
vaki
a
Hu
ngar
y .
Cze
ch R
ep
Mal
ta
Gre
ece
Slo
veni
a
Por
tuga
l
Cyp
rus
Spa
in
.
Sw
ede
n
UK
Fran
ce
Ge
rman
y
Italy
Finl
and
Bel
gium
Ne
ther
land
s
Aus
tria
Irela
nd
De
nmar
k
Luxe
mbo
urg
% poor re country medians
% poor re EU25 median

Poverty and social security 15
Global poverty Half the world — nearly three billion people — live on
less than two dollars a day. The GDP (Gross Domestic Product) of the poorest 48
nations (i.e. a quarter of the world’s countries) is less than the wealth of the world’s three richest people combined.
Nearly a billion people entered the 21st century unable to read a book or sign their names.
Less than one per cent of what the world spent every year on weapons was needed to put every child into school by the year 2000 and yet it didn’t happen.
1 billion children live in poverty (1 in 2 children in the world). 640 million live without adequate shelter, 400 million have no access to safe water, 270 million have no access to health services. 10.6 million died in 2003 before they reached the age of 5 ( roughly 29,000 children per day) Source: http://www.globalissues.org/TradeRelated/Poverty.asp

Poverty and social security 16
GDP per capita and quality of life Source: EQLS data, Fahey, T. (2004)
2 3 4 5 6 7 8 9
Number of quality of life deficits (scale: 0-19)
0
10000
20000
30000
40000
50000
GD
P p
er c
ap
ita
PP
S
R Sq Linear = 0.73

Poverty and social security 17
How to fight poverty
„Problem of poverty is the problem of the rich.“
„Policy matters“Stein Ringen (1987)
Social policies: Preventive: to prevent social
marginalization and exclusion caused by poverty
Ameliorative: to help people in need, on the edge of poverty, poor
A mixture of both

Poverty and social security 18
Some social policy concepts
Narrow: social assistance
Broad: creating social conditions favourable for human lives
Ameliorative: to help the people in need, on the edge of poverty, poor
Active: to prevent social marginalization and exclusion caused by poverty
Social consumption as nonproductive spending
Social investment: nurturing human resources for future societal development

Poverty and social security 19
Social security as an instrument of redistributionLayers of social security →Criterium ↓
State social support
Social insurance
Social assistance
Recipients Demogrants
Wage earners and people whose insurance is paid by the state
The poor(needy)
Technique of redistribution
Categorized benefits
Insurance benefits
Means-tested services and benefits
Delivering institutions
State State, public bodies, increasingly commercial sector
State, municipalities, civic organizations
Poverty and social security 20
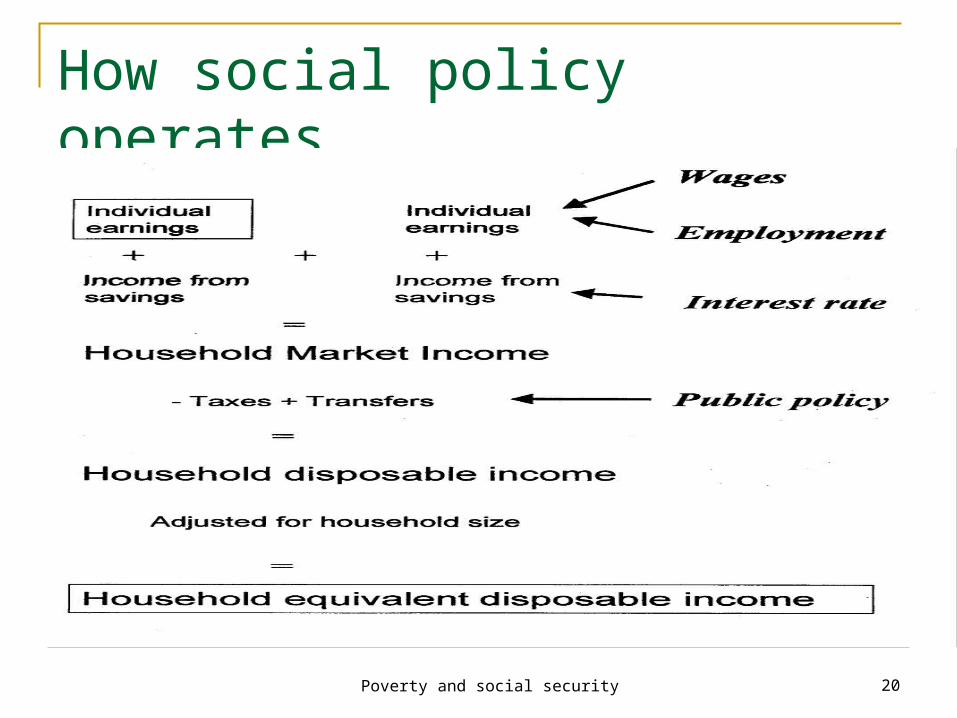
How social policy operates

Poverty and social security 21
Distribution of incomes before and after social transfers in Canada

Poverty and social security 22
Reduction of poverty by social transfers – comparison of EU 15 Source: Joint report on social inclusion (2004)

Poverty and social security 23
Redistributive impact of social benefits

Poverty and social security 24
Impact of social expenditure on poverty – EU 15Source: Joint report on social inclusion (2004)

Poverty and social security 25
Are income differences in your country too large: distribution of answers, affluent democraciesStrongly
agreeAgree
Neitheragree nordisagree
DisagreeStronglydisagree
TOTAL
Austria 41.6 44.7 9.1 4.5 0.1 100
Canada 26.7 41.5 16.3 12.5 3.1 100
France 60.0 26.8 7.4 5.0 0.8 100
Germany 29.4 52.8 10.7 6.5 0.6 100
Great Britain 30.6 50.7 12.3 5.8 0.6 100
Japan 38.6 30.5 18.3 7.5 5.0 100
Netherlands 15.7 48.2 21.7 12.6 1.8 100
New Zealand 29.4 43.8 13.5 11.8 1.6 100
Norway 22.4 50.1 13.8 12.0 1.8 100
Portugal 82.2 13.8 1.8 1.4 0.9 100
Spain 35.9 53.4 7.4 3.1 0.3 100
Sweden 29.2 41.9 18.1 8.4 2.4 100
Switzerland 18.8 36.1 37.0 7.3 0.7 100
Av. OECD 35.4 41.1 14.4 7.6 1.5 100

Poverty and social security 26
Are income differences in your country too large: distribution of answers, post-communist countries
Stronglyagree
AgreeNeither
agree nordisagree
DisagreeStronglydisagree
TOTAL
Bulgaria 84.0 12.8 1.4 0.8 0.9 100
Czech Rep 60.3 27.5 6.0 4.2 2.1 100
Hungary 68.2 25.0 3.5 2.9 0.3 100
Latvia 57.2 39.5 1.8 1.3 0.2 100
Poland 47.7 41.6 6.3 3.5 0.9 100
Russia 79.1 16.7 1.9 1.1 1.3 100
Slovenia 49.7 41.3 4.8 3.6 0.6 100
Av. CEECs 63.8 29.2 3.7 2.5 0.9 100
Source: ISSP (1999), own calculations

Poverty and social security 27
Global fight against poverty In 2000, 189 United Nations countries signed the
Millennium Declaration, which led to the adoption of the Millennium Development Goals, a set of eight goals to be achieved by 2015: Eradicate extreme poverty and hunger Achieve universal primary education Promote gender equality and empower women Reduce child mortality Improve maternal health Combat HIV/AIDS, malaria, and other diseases Ensure environmental sustainability Develop a global partnership for development.
Source: http://web.worldbank.org/WBSITE/EXTERNAL/TOPICS/EXTPOVERTY/

Poverty and social security 28
Poverty and Social Security
1. Beveridge, W.: Social Insurance and Other Services. London, Her Majesty‘s Stationery Office 1942 (reprinted 1966).
2. Dahrendorf, R.: Life Chances. London, Weidenfeld & Nicolson 1979.
3. Fahey, T.: Living Standards Graphs, Berlin, Social Science Center, October 2004. Powerpoint presentation at the seminar.
4. Förster, M.F. – Tóth, I.G.: Poverty, ineqalities and social policies in the Visegrad countries. In: Economics of Transition, 1997, Vol. 5 (2), pp. 505-510.
5. Hills, J.: Taxation for the Enabling State.6. Joint report on social inclusion. Brussels, Council of the EU, 5.
March 2004.7. Luxembourg Income Study (LIS) micro database.8. Ringen, St.: The Possibility of Politics. Oxford, Clarendon Press
1987.