Embed Size (px)
Citation preview

Poverty and InequalityPoverty and Inequality
What Is Poverty?What Is Poverty?
Population Trends and Policies
PovertyPovertyPopulation Trends
What is poverty? What is poverty?
During my life, where and how have I During my life, where and how have I encountered poverty?encountered poverty?
Who have I known that was poor?Who have I known that was poor?
How do I know they were poor?How do I know they were poor?
What were the reasons that they were poor?What were the reasons that they were poor?
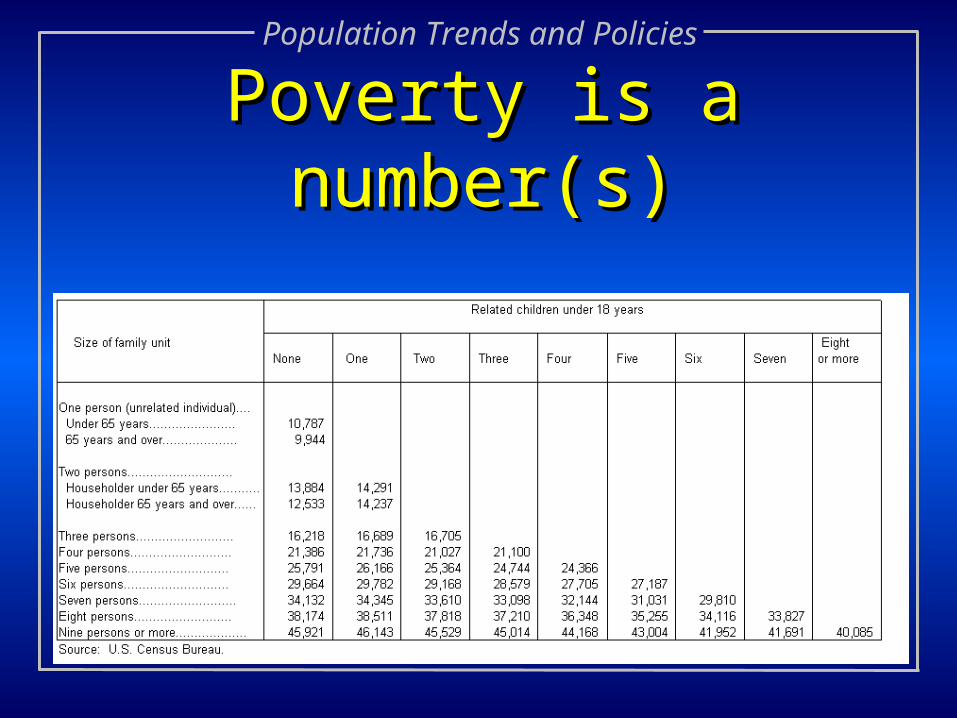
Poverty is a number(s)Poverty is a number(s)
2007 Poverty Thresholds2007 Poverty Thresholds
Population Trends and Policies

Americans in PovertyAmericans in Poverty
Population Trends
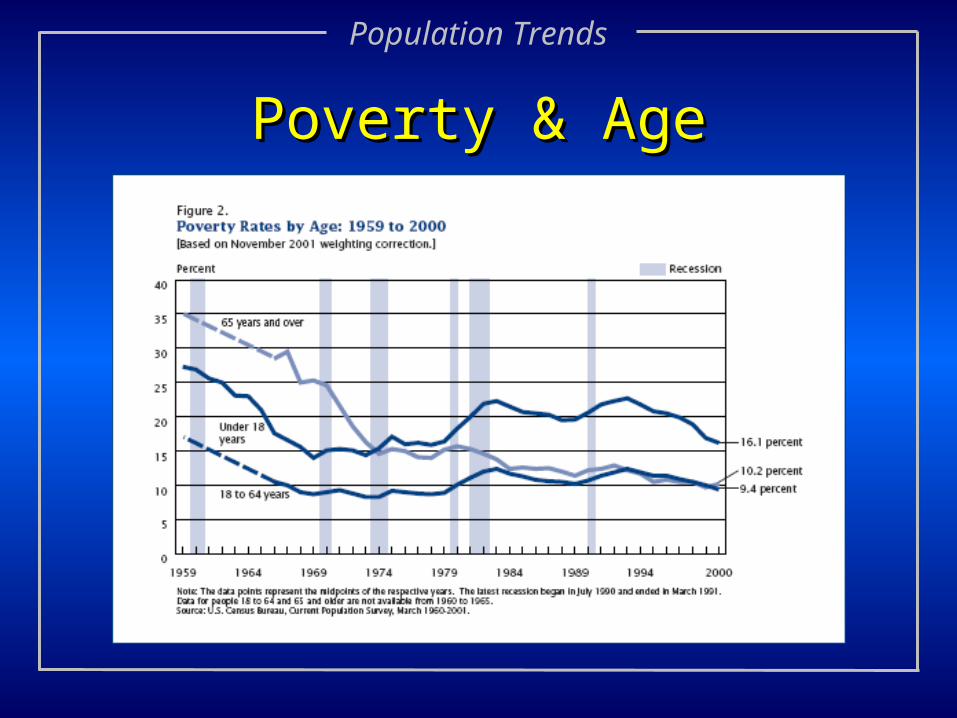
Poverty & AgePoverty & Age
Population Trends
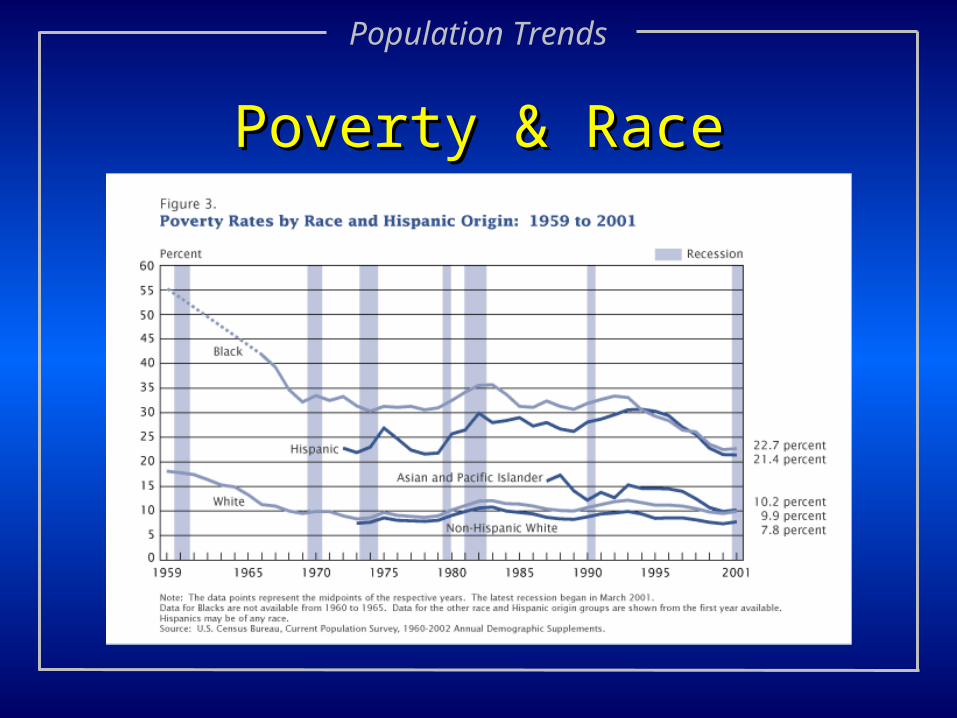
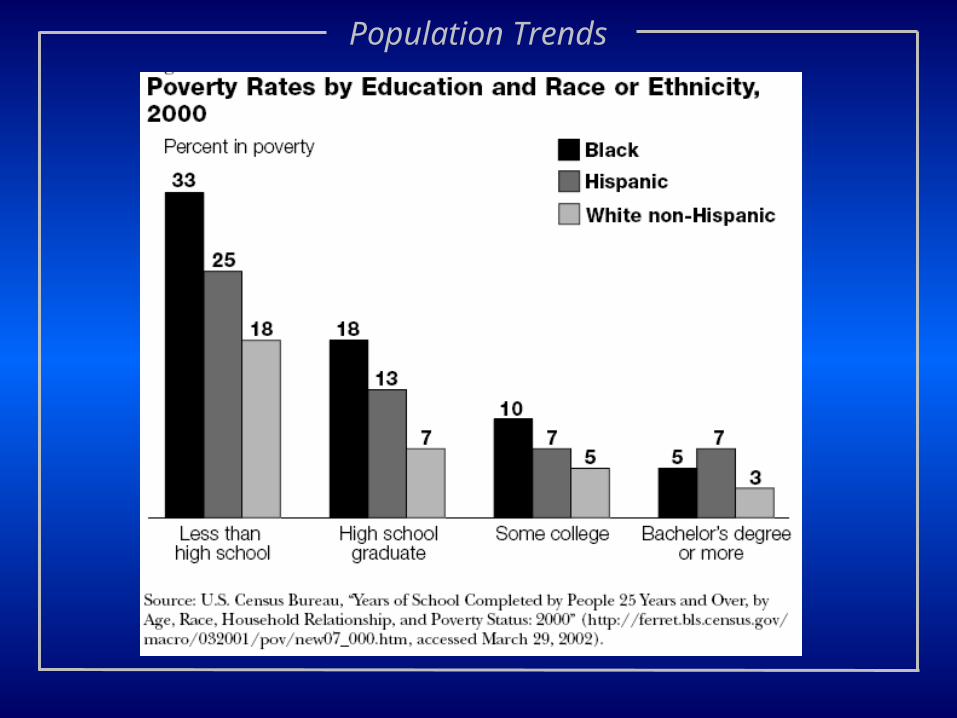
Poverty & RacePoverty & Race
Population Trends

Poverty & Family StructurePoverty & Family Structure
Population Trends
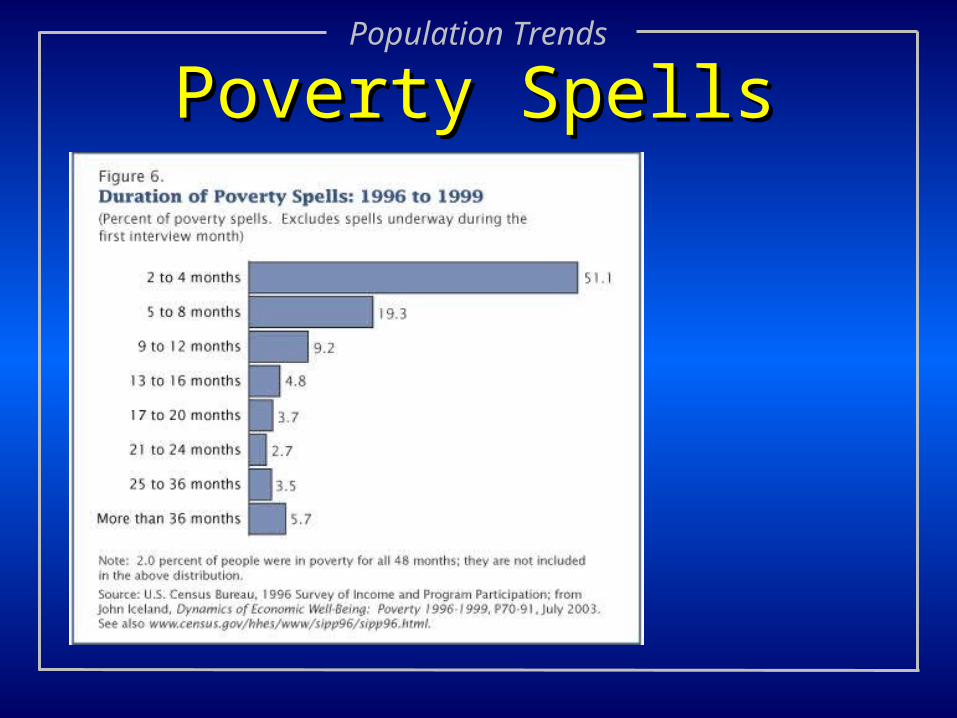
Poverty SpellsPoverty SpellsPopulation Trends
Population Trends

Poverty & GeographyPoverty & GeographyPopulation Trends
Population Trends and Policies
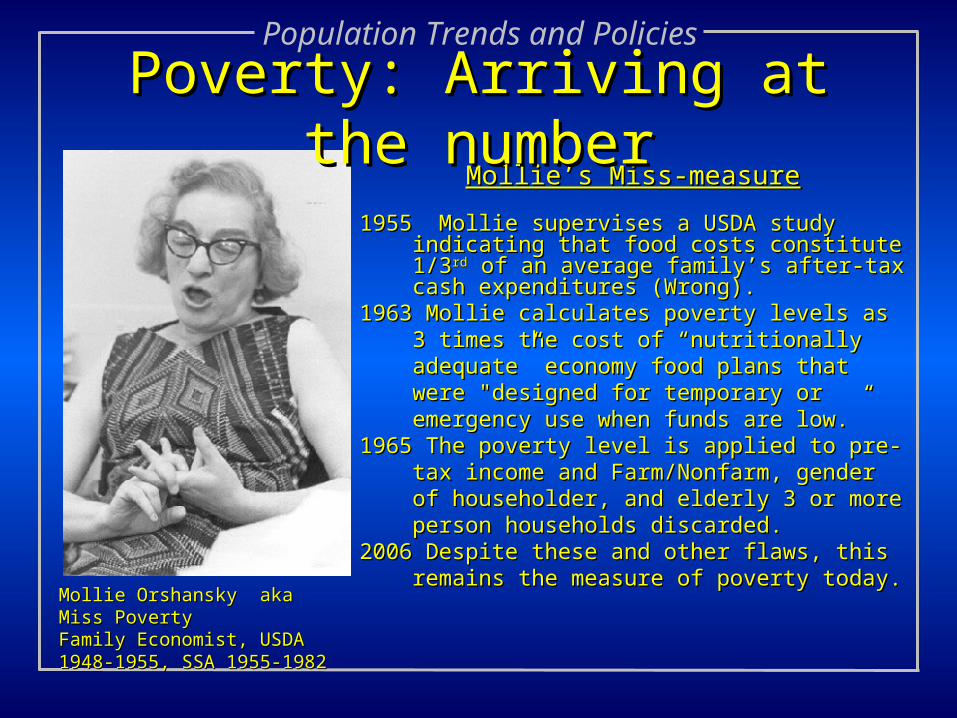
Mollie’s Miss-measureMollie’s Miss-measure
1955 Mollie supervises a USDA study indicating 1955 Mollie supervises a USDA study indicating that food costs constitute 1/3that food costs constitute 1/3 rdrd of an average of an average family’s after-tax cash expenditures (Wrong). family’s after-tax cash expenditures (Wrong).
1963 Mollie calculates poverty levels as 3 times the 1963 Mollie calculates poverty levels as 3 times the cost of “nutritionally adequate” economy cost of “nutritionally adequate” economy food plans that were "designed for temporary food plans that were "designed for temporary or emergency use when funds are low.”or emergency use when funds are low.”
1965 The poverty level is applied to pre-tax income 1965 The poverty level is applied to pre-tax income and Farm/Nonfarm, gender of householder, and Farm/Nonfarm, gender of householder, and elderly 3 or more person households and elderly 3 or more person households discarded. discarded.
2006 Despite these and other flaws, this remains the 2006 Despite these and other flaws, this remains the measure of poverty today.measure of poverty today.
Poverty: Arriving at the numberPoverty: Arriving at the number
Mollie Orshansky aka Miss PovertyMollie Orshansky aka Miss PovertyFamily Economist, USDA 1948-Family Economist, USDA 1948-1955, SSA 1955-19821955, SSA 1955-1982

Food Expenditures as a Share of Food Expenditures as a Share of Disposable Personal IncomeDisposable Personal Income
Population Trends
18.6
15.1
9.9
0
5
10
15
20
25
30
1930 1935 1940 1945 1950 1955 1960 1965 1970 1975 1980 1985 1990 1995 2000 2005

Underestimating PovertyUnderestimating PovertyAre families more diverse now than they were in 1965?Are families more diverse now than they were in 1965?Do the adult relationships/ages in a family influence Do the adult relationships/ages in a family influence
spending?spending?Do families spend the same proportion of their income on Do families spend the same proportion of their income on
food now than they did in 1950?food now than they did in 1950?Can a family in 2006 survive on the cost of an “economy” Can a family in 2006 survive on the cost of an “economy”
food budget multiplied by 3?food budget multiplied by 3?Do families eat outside the home more today than in 1965?Do families eat outside the home more today than in 1965?Does food cost the same in every part of the country or even Does food cost the same in every part of the country or even
a city? a city? Does anything cost the same in every part of the country?Does anything cost the same in every part of the country?Does every family incur the same expenses?Does every family incur the same expenses?
Population Trends

Adjusting The Poverty “Line”Adjusting The Poverty “Line”In 1995 a panel of poverty experts was convened to study the In 1995 a panel of poverty experts was convened to study the
concepts and methods underlying the poverty measure. The concepts and methods underlying the poverty measure. The expert panel recommended that:expert panel recommended that:
1. Actual costs for food, clothing, and shelter, rather than a budget for 1. Actual costs for food, clothing, and shelter, rather than a budget for food, be used; food, be used;
2. A better method be used to adjust for family size;2. A better method be used to adjust for family size;3. Adjustment to reflect geographic differences in housing costs; 3. Adjustment to reflect geographic differences in housing costs; 4. Government food and housing benefits not in the form of cash, and tax-4. Government food and housing benefits not in the form of cash, and tax-
related benefits such as the Earned Income Tax Credit, be included related benefits such as the Earned Income Tax Credit, be included as family income;as family income;
5. Mandatory expenses such as taxes, work expenses, child care costs, 5. Mandatory expenses such as taxes, work expenses, child care costs, child support payments, and out-of-pocket medical care costs be child support payments, and out-of-pocket medical care costs be deducted from family income; anddeducted from family income; and
6. A different Census survey, the Survey of Income and Program 6. A different Census survey, the Survey of Income and Program Participation, be used to derive annual figures on the number of poor.Participation, be used to derive annual figures on the number of poor.
Population Trends
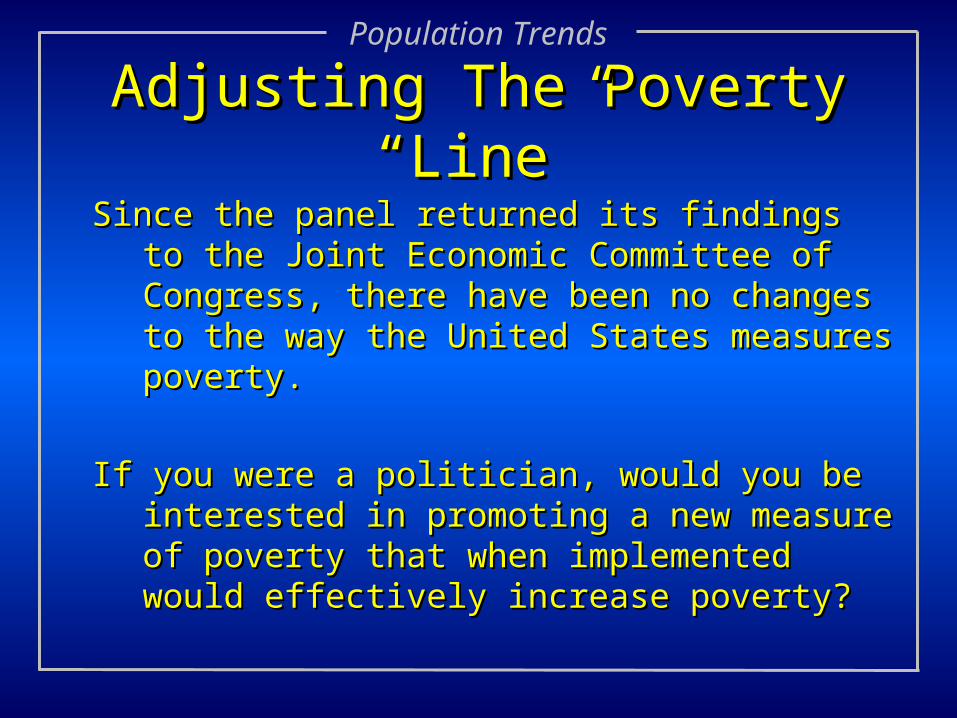
Adjusting The Poverty “Line”Adjusting The Poverty “Line”
Since the panel returned its findings to the Joint Since the panel returned its findings to the Joint Economic Committee of Congress, there have Economic Committee of Congress, there have been no changes to the way the United States been no changes to the way the United States measures poverty.measures poverty.
If you were a politician, would you be interested in If you were a politician, would you be interested in promoting a new measure of poverty that when promoting a new measure of poverty that when implemented would effectively increase poverty?implemented would effectively increase poverty?
Population Trends
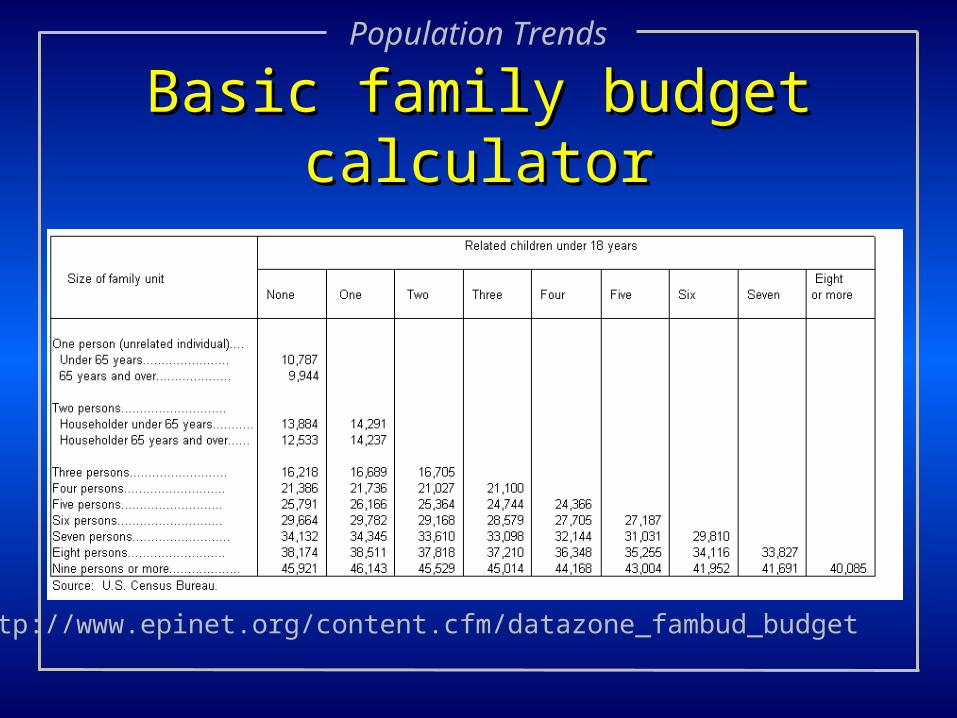
Basic family budget calculatorBasic family budget calculator
Population Trends
http://www.epinet.org/content.cfm/datazone_fambud_budget
Poverty and PolicyPoverty and Policy
Programs intended to reduce poverty:Programs intended to reduce poverty:““Welfare”, TANF, EITC, SSI, Food Stamps, Head Start, Housing AssistanceWelfare”, TANF, EITC, SSI, Food Stamps, Head Start, Housing Assistance
How has welfare policy changed over the past How has welfare policy changed over the past several decades?several decades?
Welfare Reforms, Changes in BudgetsWelfare Reforms, Changes in Budgets
Have our policies been effective?Have our policies been effective?
Population Trends

Population Trends
• Temporary Assistance for Needy Families (TANF) is Temporary Assistance for Needy Families (TANF) is a block grant created by the Personal Responsibility a block grant created by the Personal Responsibility and Work Opportunity Reconciliation Act of 1996, as and Work Opportunity Reconciliation Act of 1996, as part of a federal effort to “end welfare as we know part of a federal effort to “end welfare as we know it.” it.”
• The TANF block grant replaced the Aid to Families The TANF block grant replaced the Aid to Families with Dependent Children (AFDC) program, which with Dependent Children (AFDC) program, which had provided cash welfare to poor families with had provided cash welfare to poor families with children since 1935. children since 1935.
““Welfare”Welfare”
Source: Center on Budget and Policy Priorities.
Population Trends
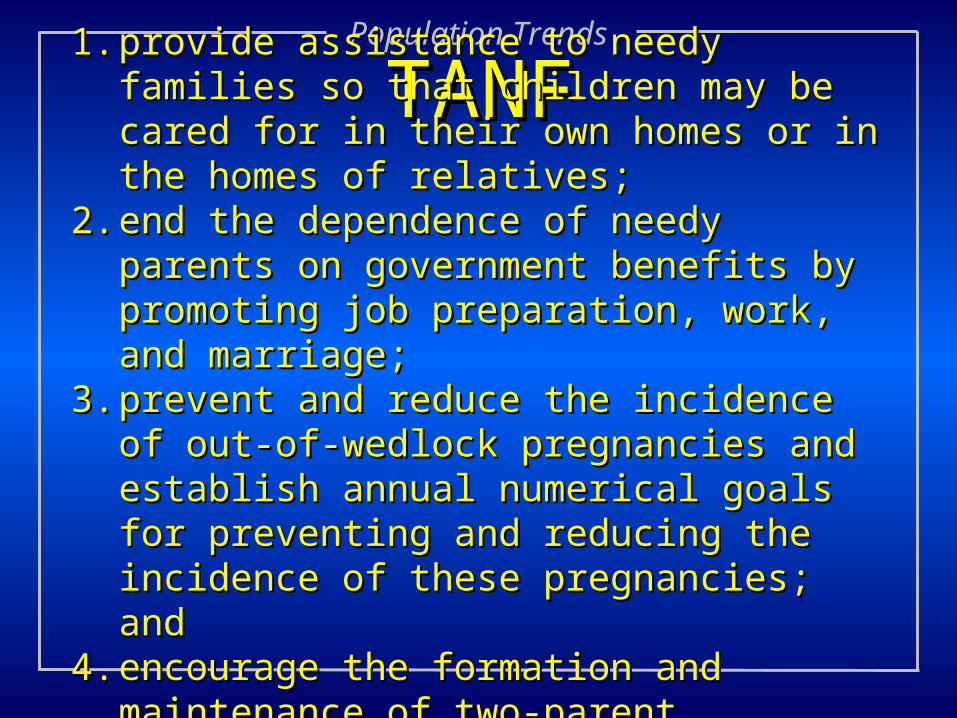
TANFTANF1.1. provide assistance to needy families so that provide assistance to needy families so that
children may be cared for in their own homes or in children may be cared for in their own homes or in the homes of relatives; the homes of relatives;
2.2. end the dependence of needy parents on end the dependence of needy parents on government benefits by promoting job preparation, government benefits by promoting job preparation, work, and marriage; work, and marriage;
3.3. prevent and reduce the incidence of out-of-prevent and reduce the incidence of out-of-wedlock pregnancies and establish annual wedlock pregnancies and establish annual numerical goals for preventing and reducing the numerical goals for preventing and reducing the incidence of these pregnancies; and incidence of these pregnancies; and
4.4. encourage the formation and maintenance of two-encourage the formation and maintenance of two-parent families. parent families.

Population Trends
TANF and WorkTANF and Work1.1. Recipients (with few exceptions) must work as Recipients (with few exceptions) must work as
soon as they are job ready or no later than two soon as they are job ready or no later than two years after coming on assistance.years after coming on assistance.
2.2. Single parents are required to participate in work Single parents are required to participate in work activities for at least 30 hours per week. activities for at least 30 hours per week.
3.3. Two-parent families must participate in work Two-parent families must participate in work activities 35 or 55 hours a week, depending upon activities 35 or 55 hours a week, depending upon circumstances.circumstances.
4.4. Failure to participate in work requirements can Failure to participate in work requirements can result in a reduction or termination of benefits to result in a reduction or termination of benefits to the family.the family.

Population Trends
Source: Center on Budget and Policy Priorities.

Population Trends
• Total, inflation-adjusted spending from all federal Total, inflation-adjusted spending from all federal and state revenue sources on the four traditional self-and state revenue sources on the four traditional self-sufficiency programs - child care subsidies, sufficiency programs - child care subsidies, employment services, cash assistance, and emergency employment services, cash assistance, and emergency assistance - fell from $744 million in 1993-95 to assistance - fell from $744 million in 1993-95 to $478 million in the 2003-05 budget period.$478 million in the 2003-05 budget period.
• Because funding for the four traditional self-Because funding for the four traditional self-sufficiency programs has not remained at 1993-95 sufficiency programs has not remained at 1993-95 levels, Oregon’s low-income families have lost a total levels, Oregon’s low-income families have lost a total of $861 million in support over the last decade.of $861 million in support over the last decade.
• In 2005-07, despite Oregon’s return to economic In 2005-07, despite Oregon’s return to economic growth, these programs were cut even more.growth, these programs were cut even more.
TANF in OregonTANF in Oregon
Source: Oregon Center for Public Policy.

Population Trends
• By 2005, eligibility shrank to 46 percent of the federal By 2005, eligibility shrank to 46 percent of the federal poverty level for a mother with two children. In 1991, it poverty level for a mother with two children. In 1991, it was at 66 percent of poverty.was at 66 percent of poverty.
• Less than two percent of Oregon TANF cash assistance Less than two percent of Oregon TANF cash assistance recipients had earnings from work in 2005. recipients had earnings from work in 2005.
• Nationally, 25 percent of adult TANF recipients were Nationally, 25 percent of adult TANF recipients were employed in 2004.employed in 2004.
• The number of able-bodied families with children in The number of able-bodied families with children in Oregon who were poor in 2001-03 stood at about 65,000, Oregon who were poor in 2001-03 stood at about 65,000, essentially the same number as when welfare reform essentially the same number as when welfare reform began in the mid-1990s.began in the mid-1990s.
• Lifetime benefit limit of 60 months was started in 2003.Lifetime benefit limit of 60 months was started in 2003.
TANF in OregonTANF in Oregon
Source: Oregon Center for Public Policy.

Population Trends
Population Trends
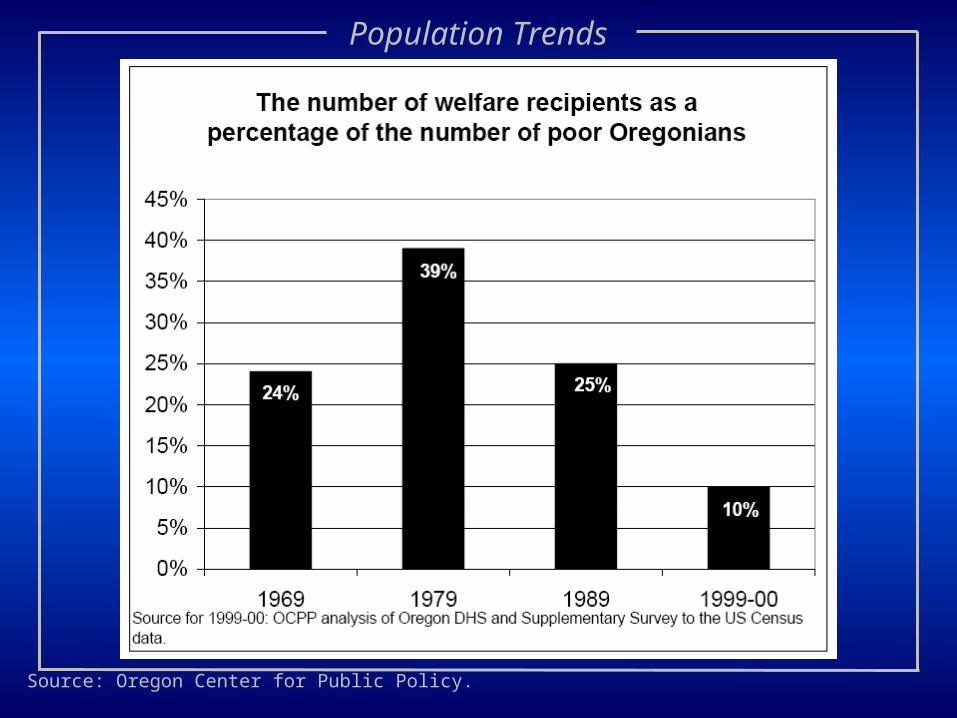
Source: Oregon Center for Public Policy.

Population Trends
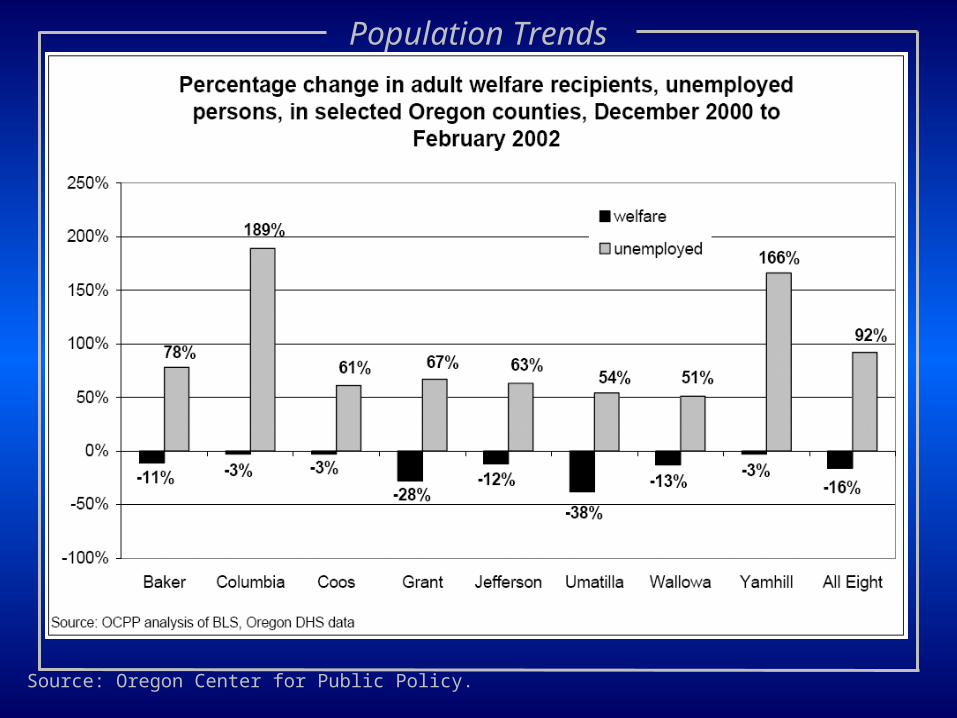
Source: Oregon Center for Public Policy.
Population Trends
Source: Oregon Center for Public Policy.

Population Trends
Source: Oregon Center for Public Policy.

Population Trends
Source: Oregon Center for Public Policy.

Population Trends
• The Food Stamp Program has made severe hunger The Food Stamp Program has made severe hunger rare in America. rare in America.
• In the late 1960s, medical research found that In the late 1960s, medical research found that American children suffered and died from diseases American children suffered and died from diseases related to severe malnutrition. related to severe malnutrition.
• In 1979, after the Food Stamp Program became In 1979, after the Food Stamp Program became available nationwide, physicians discovered that available nationwide, physicians discovered that severe malnutrition had become rare, a result they severe malnutrition had become rare, a result they attributed to the Food Stamp Program. attributed to the Food Stamp Program.
• Today, the Food Stamp Program is the largest anti-Today, the Food Stamp Program is the largest anti-hunger program in America.hunger program in America.
Food StampsFood Stamps
Source: Oregon Center for Public Policy.
Population Trends
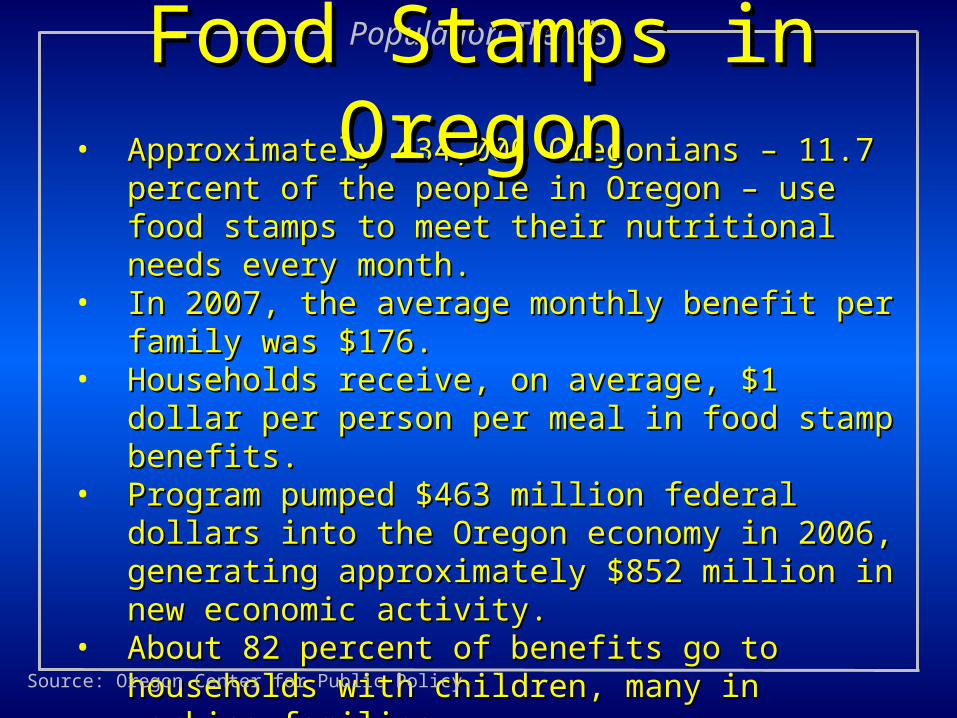
• Approximately 434,000 Oregonians – 11.7 percent of the Approximately 434,000 Oregonians – 11.7 percent of the people in Oregon – use food stamps to meet their people in Oregon – use food stamps to meet their nutritional needs every month.nutritional needs every month.
• In 2007, the average monthly benefit per family was $176.In 2007, the average monthly benefit per family was $176.• Households receive, on average, $1 dollar per person per Households receive, on average, $1 dollar per person per
meal in food stamp benefits.meal in food stamp benefits.• Program pumped $463 million federal dollars into the Program pumped $463 million federal dollars into the
Oregon economy in 2006, generating approximately $852 Oregon economy in 2006, generating approximately $852 million in new economic activity.million in new economic activity.
• About 82 percent of benefits go to households with About 82 percent of benefits go to households with children, many in working families. children, many in working families.
• Most of the rest go to households with seniors or people Most of the rest go to households with seniors or people with disabilities. with disabilities.
Food Stamps in OregonFood Stamps in Oregon
Source: Oregon Center for Public Policy.

Population Trends
• Early this decade, Oregon had one of the highest Early this decade, Oregon had one of the highest hunger rates in the country. hunger rates in the country.
• By expanding the use of food stamps the state’s By expanding the use of food stamps the state’s hunger rate significantly improved. Oregon used a hunger rate significantly improved. Oregon used a federal policy tool – “categorical eligibility” – to federal policy tool – “categorical eligibility” – to reach more low-income, working families, reach more low-income, working families, particularly those with high child care or housing particularly those with high child care or housing costs, and those with modest assets such as a reliable costs, and those with modest assets such as a reliable car for getting to work. car for getting to work.
• Oregon’s hunger rate is now near the middle among Oregon’s hunger rate is now near the middle among all the states.all the states.
Food Stamps in OregonFood Stamps in Oregon
Source: Oregon Center for Public Policy.

Population Trends
• About 35 million Americans, including nearly one in About 35 million Americans, including nearly one in five children, live in households that have difficulty five children, live in households that have difficulty affording food. affording food.
• Nationally, only 60 percent of those eligible for food Nationally, only 60 percent of those eligible for food stamps receive them. stamps receive them.
• The program's "standard deduction" has been frozen The program's "standard deduction" has been frozen since 1995, reducing typical monthly benefit by $37.since 1995, reducing typical monthly benefit by $37.
• The $10 minimum benefit has not been adjusted for The $10 minimum benefit has not been adjusted for inflation in 30 years reducing its value by 2/3rds.inflation in 30 years reducing its value by 2/3rds.
• Since 1986, child care costs have doubled, but the Since 1986, child care costs have doubled, but the cap on the allowable child care deduction has cap on the allowable child care deduction has increased only slightly. increased only slightly.
Food StampsFood Stamps
Source: Oregon Center for Public Policy.

Population Trends
• An estimated 169,000 households in Oregon live with An estimated 169,000 households in Oregon live with hunger or the threat of hunger, according to USDA. hunger or the threat of hunger, according to USDA. This includes low-income working families with This includes low-income working families with children and senior citizens living on fixed incomes.children and senior citizens living on fixed incomes.
• In Oregon, the participation rate is about 83 percent, In Oregon, the participation rate is about 83 percent, one of the highest in the country. one of the highest in the country.
• Despite Oregon’s efforts, about 76,000 eligible Despite Oregon’s efforts, about 76,000 eligible Oregonians miss out on food stamps. Oregonians miss out on food stamps.
• Expanding by 5% would provide for and additional Expanding by 5% would provide for and additional 26,000 low-income Oregonians, bring about $18 26,000 low-income Oregonians, bring about $18 million into our local economy, and result in about million into our local economy, and result in about $33 million in new economic activity in the state. $33 million in new economic activity in the state.
Food Stamps in OregonFood Stamps in Oregon
Source: Oregon Center for Public Policy.
Class and InequalityClass and InequalityPopulation Trends
What is relative deprivation? What is relative deprivation?
Is relative well-being as important as absolute Is relative well-being as important as absolute economic well being?economic well being?
How is inequality different from Poverty?How is inequality different from Poverty?
Does a “rising tide lift all boats”?Does a “rising tide lift all boats”?
Population Trends and Policies
Poverty & Race: State of the Dream
“Utilizing such diverse indicators as income, wealth, homeownership, poverty, unemployment, and infant mortality, this report looks at the gap between the legacy of Dr. King and the America of 2004.”
•Where progress has occurred in closing the black-white divide, it has been so slow that it would take decades, or even centuries, at the same pace of progress for African Americans to reach parity with white Americans.
•In some areas, the racial gap has actually widened since the 1960s.

Population Trends and Policies

Population Trends and Policies