Embed Size (px)
Citation preview

Poverty and Distributional Impact of Poverty and Distributional Impact of Poverty and Distributional Impact of Poverty and Distributional Impact of Alternative Rice Policies in the PhilippinesAlternative Rice Policies in the PhilippinesAlternative Rice Policies in the PhilippinesAlternative Rice Policies in the Philippines
Caesar B. Cororaton and Krista Danielle S. Yu
Virginia Tech / De La Salle University
Henry Sy Sr. Hall
De La Salle University, Manila
March 31, 2017

Objective/MethodObjective/MethodObjective/MethodObjective/Method
• To analyze the poverty and distributional effects of alternative rice policies in the Philippines:
• Limit imports of rice
• Eliminate rice QR
• Tariffy rice QR and use revenue as cash transfer
• Rice tariffs reduced to 25 percent in 10 years
• Economy-wide model (CGE) linked to poverty microsimulation

Rice and PovertyRice and PovertyRice and PovertyRice and Poverty(percentage of total expenditure)(percentage of total expenditure)(percentage of total expenditure)(percentage of total expenditure)
Poor Non-Poor
2009 2012 2009 2012
Philippines
Total food 60.1 61.0 40.7 41.5
Cereals 25.7 25.6 10.9 11.1
Rice 19.7 19.4 8.1 7.9
Rural
Total food 60.7 61.8 45.0 45.1
Cereals 26.8 26.5 14.8 13.8
Rice 20.4 20.2 11.6 10.3
Urban
Total food 58.2 57.8 38.5 38.9
Cereals 22.0 22.2 8.9 9.1
Rice 17.3 16.3 6.3 6.2
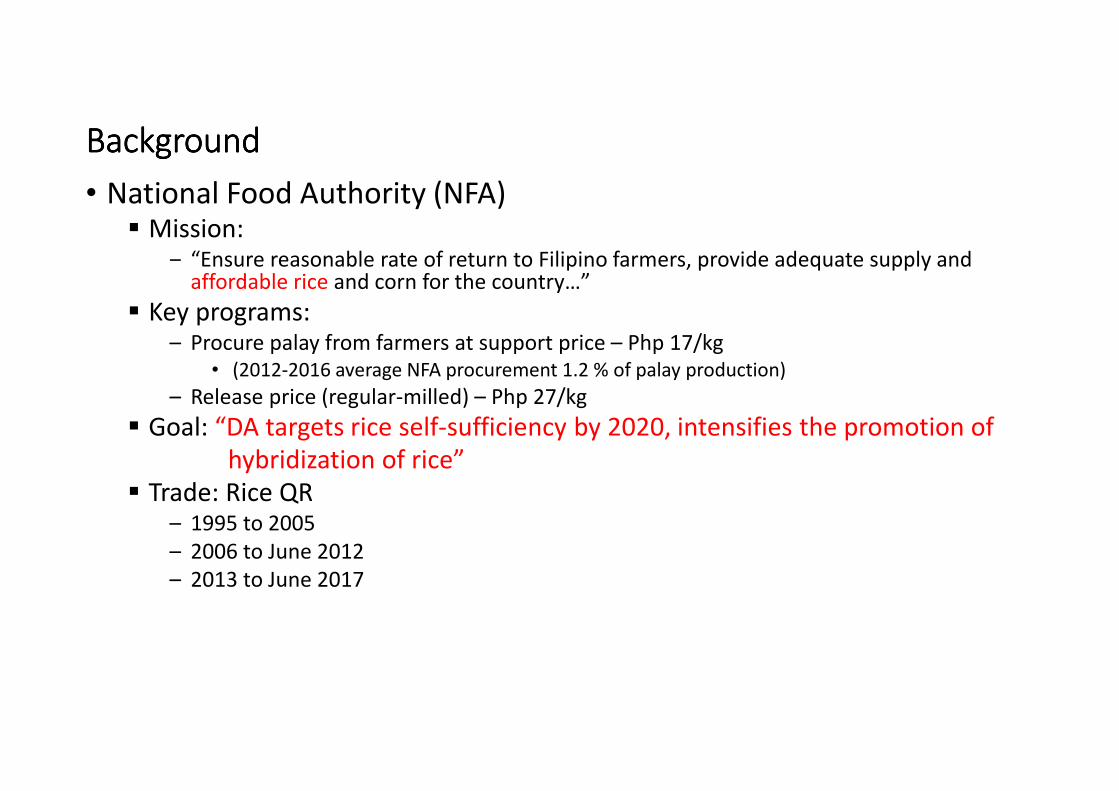
BackgroundBackgroundBackgroundBackground
• National Food Authority (NFA)� Mission:
‒ “Ensure reasonable rate of return to Filipino farmers, provide adequate supply and affordable rice and corn for the country…”
� Key programs:– Procure palay from farmers at support price – Php 17/kg
• (2012-2016 average NFA procurement 1.2 % of palay production)
– Release price (regular-milled) – Php 27/kg
� Goal: “DA targets rice self-sufficiency by 2020, intensifies the promotion of
hybridization of rice”
� Trade: Rice QR– 1995 to 2005
– 2006 to June 2012
– 2013 to June 2017

The Impact of QR on prices
P*
Q*
P
Q
S
D
0

The Impact of QR on prices
Pw
P
Q
S
D
0
Pd
Q0 Q1

Rice Price Gap (25% broken)Rice Price Gap (25% broken)Rice Price Gap (25% broken)Rice Price Gap (25% broken)
0.00
5.00
10.00
15.00
20.00
25.00
30.00
35.00
40.00
45.00
2000 2001 2002 2003 2004 2005 2006 2007 2008 2009 2010 2011 2012 2013 2014 2015 2016
Ph
p/k
g
Philippines Vietnam Thailand NFA release
2013-2016 Price Gap 82.8 %
Vietnam and Thai FOB prices (25% broken) + 20%
2013-2016 Ave Price Php/kg
Phil. – 37.5
VNM/THA – 20.5

The Impact of QR on prices
Pw
P
Q
S
D
0
Pd
Q0 Q1
Quota Rent

Estimation of Rice Quota RentEstimation of Rice Quota RentEstimation of Rice Quota RentEstimation of Rice Quota Rent
Philippine price, Php/kg 38.83
Average of Vietnam and Thailand prices, Php/kg 19.76
Price gap, Php/kg 19.07
Imports, million kg 1,283
Value of imports at Philippine price, million Php 49,793
Value of imports at Vietnam and Thailand prices, million Php 25,342
Estimate of quota rent, million Php 24,451
Estimate of rate quota rent, % 49.10

The Impact of QR on prices
Pw
P
Q
S
D
0
Pd
Q0 Q1
Quota Rent = PhP 24.451 Billion Quota owners
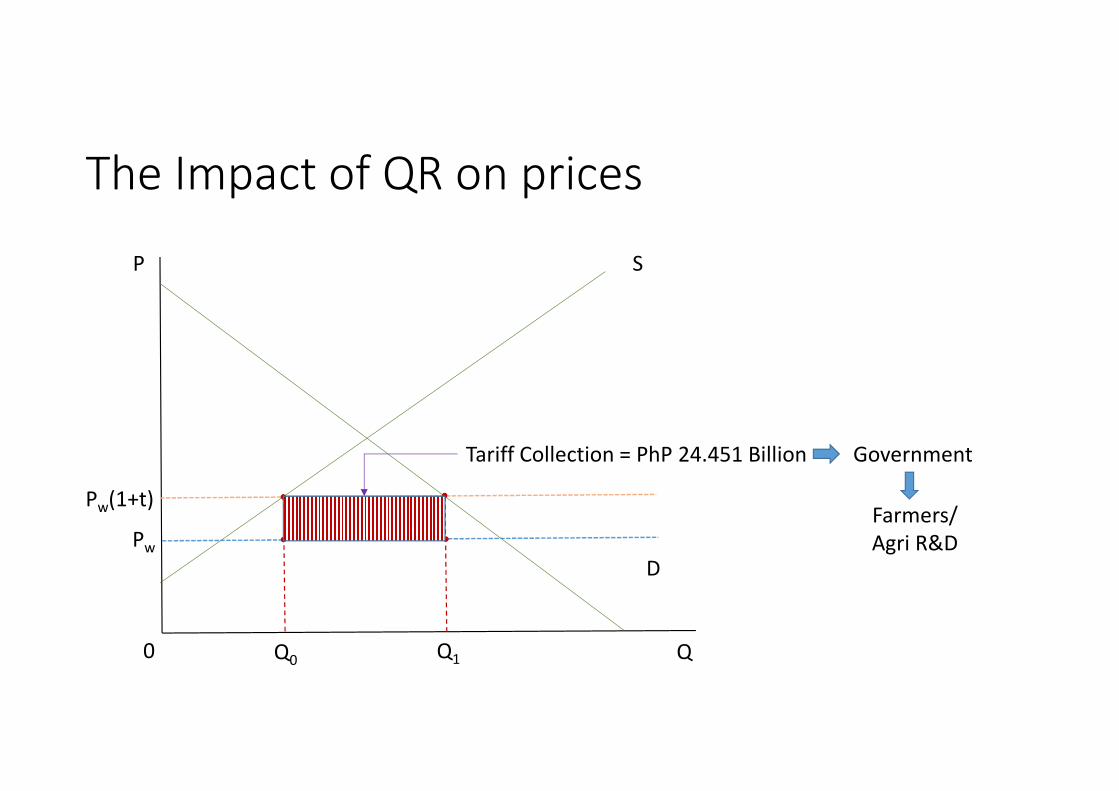
The Impact of QR on prices
Pw
P
Q
S
D
0
Pw(1+t)
Q0 Q1
Tariff Collection = PhP 24.451 Billion Government
Farmers/
Agri R&D
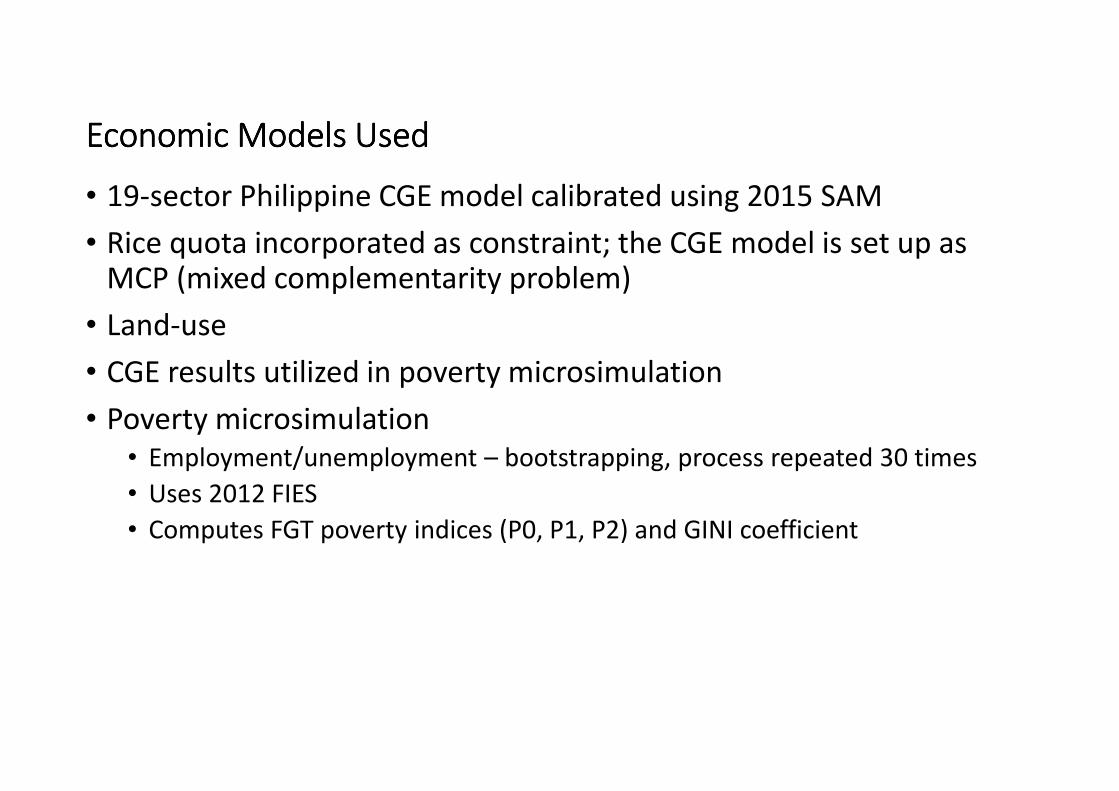
Economic Models UsedEconomic Models UsedEconomic Models UsedEconomic Models Used
• 19-sector Philippine CGE model calibrated using 2015 SAM
• Rice quota incorporated as constraint; the CGE model is set up as MCP (mixed complementarity problem)
• Land-use
• CGE results utilized in poverty microsimulation
• Poverty microsimulation
• Employment/unemployment – bootstrapping, process repeated 30 times
• Uses 2012 FIES
• Computes FGT poverty indices (P0, P1, P2) and GINI coefficient

Alternative Rice ScenariosAlternative Rice ScenariosAlternative Rice ScenariosAlternative Rice Scenarios
• SIM 1 – Rice imports reduced by 50% (towards rice self-sufficiency)
• SIM 2 – Rice quota eliminated
• SIM 3 – Rice quota replaced by tariff equivalent; tariff revenue earmarked as cash transfer:
• 40 % decile 1
• 30% decile 2
• 20% decile3
• 7% decile 4
• 3% decile 5
• SIM 4 – Rice tariff reduced gradually to 25% in 10 years, tariff revenue earmarked as cash transfer

Effects on Palay and Rice, Effects on Palay and Rice, Effects on Palay and Rice, Effects on Palay and Rice, % % % % ch.ch.ch.ch. from basefrom basefrom basefrom base
Production Imports Consumption
SIM1 - Reduced Imports
Volume Palay 4.42 10.18 4.43
Rice 5.35 -50.00 -1.92
Price Palay 2.26 0.00 2.26
Rice 6.91 37.06 9.49
SIM 2- Quota eliminated
Volume Palay -7.62 -15.63 -7.63
Rice -9.20 113.26 3.49
Price Palay -3.71 0.00 -3.71
Rice -10.85 -32.93 -14.65
SIM 3 - Tariffication + Cash transfer
Volume Palay 0.21 0.48 0.21
Rice 0.25 1.60 0.41
Price Palay 0.11 0.00 0.11
Rice 0.31 -0.13 0.26
SIM 4 - Gradual reduction in tariff + Cash transfer
Volume Palay -1.77 -3.42 -1.77
Rice -2.15 28.71 1.82
Price Palay -0.52 0.00 -0.52
Rice -0.76 -8.13 -2.00
SIM 1 – rice imports cut by
50%
SIM 2 – rice quota eliminated
SIM 3 – rice quota replaced by
tariff equivalent; revenue as
cash transfer
SIM 4 – rice tariff reduced
gradually to 25% in 10 years;
revenue as cash transfer
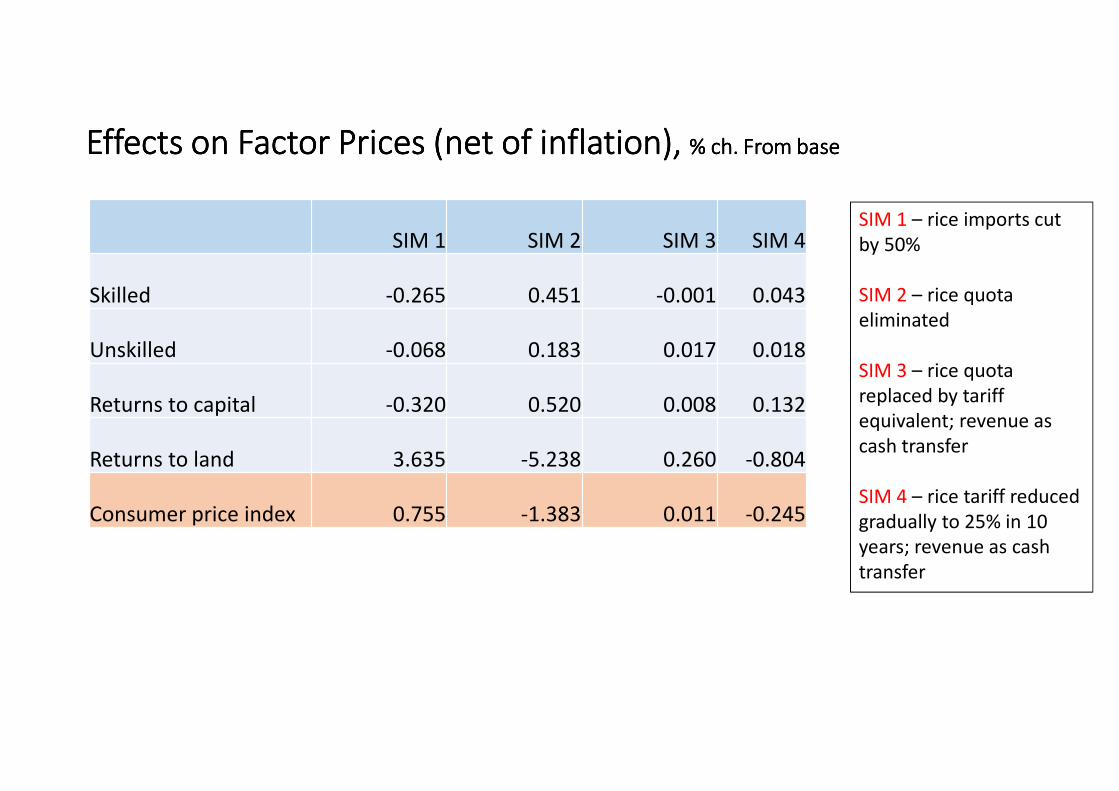
Effects on Factor Prices (net of inflation), Effects on Factor Prices (net of inflation), Effects on Factor Prices (net of inflation), Effects on Factor Prices (net of inflation), % % % % ch.ch.ch.ch. From baseFrom baseFrom baseFrom base
SIM 1 SIM 2 SIM 3 SIM 4
Skilled -0.265 0.451 -0.001 0.043
Unskilled -0.068 0.183 0.017 0.018
Returns to capital -0.320 0.520 0.008 0.132
Returns to land 3.635 -5.238 0.260 -0.804
Consumer price index 0.755 -1.383 0.011 -0.245
SIM 1 – rice imports cut
by 50%
SIM 2 – rice quota
eliminated
SIM 3 – rice quota
replaced by tariff
equivalent; revenue as
cash transfer
SIM 4 – rice tariff reduced
gradually to 25% in 10
years; revenue as cash
transfer

Effects on LandEffects on LandEffects on LandEffects on Land----Use, Use, Use, Use, % % % % ch.ch.ch.ch. From baseFrom baseFrom baseFrom base
Base
share SIM 1 SIM 2 SIM 3 SIM 4
Palay 45.8 5.50 -10.02 0.22 -1.50
Corn 8.6 -4.08 6.62 -0.06 1.83
Coconut 15.7 -3.27 5.20 -0.13 1.41
Sugar 6.8 -3.19 5.09 -0.11 1.43
Other crops 7.7 -7.92 14.01 -0.43 2.02
Other uses* 15.5 -5.15 8.85 -0.29 1.74
*Excluding land for dwellings
SIM 1 – rice imports cut
by 50%
SIM 2 – rice quota
eliminated
SIM 3 – rice quota
replaced by tariff
equivalent; revenue as
cash transfer
SIM 4 – rice tariff reduced
gradually to 25% in 10
years; revenue as cash
transfer

Effects on Household Income and Prices, Effects on Household Income and Prices, Effects on Household Income and Prices, Effects on Household Income and Prices, % % % % ch.ch.ch.ch. from basefrom basefrom basefrom base
SIM 1
Income Prices
H1 0.56 1.92
H2 0.56 1.81
H3 0.57 1.61
H4 0.57 1.40
H5 0.57 1.18
H6 0.57 1.01
H7 0.56 0.86
H8 0.55 0.72
H9 0.54 0.58
H10 0.53 0.38
SIM 2
Income Prices
-1.06 -3.15
-1.05 -2.98
-1.06 -2.67
-1.06 -2.36
-1.07 -2.02
-1.06 -1.77
-1.06 -1.54
-1.05 -1.32
-1.02 -1.11
-1.50 -0.81
SIM 3
Income Prices
5.13 0.06
2.01 0.06
0.97 0.05
0.28 0.05
0.09 0.04
-0.01 0.03
-0.02 0.02
-0.03 0.01
-0.03 0.00
-0.56 -0.01
SIM 4
Income Prices
23.98 -0.49
9.27 -0.46
4.36 -0.42
1.12 -0.38
0.27 -0.33
-0.21 -0.30
-0.22 -0.27
-0.23 -0.24
-0.23 -0.21
-0.86 -0.16
SIM 1 – rice imports cut by
50%
SIM 2 – rice quota
eliminated
SIM 3 – rice quota replaced
by tariff equivalent;
revenue as cash transfer
SIM 4 – rice tariff reduced
gradually to 25% in 10
years; revenue as cash
transfer
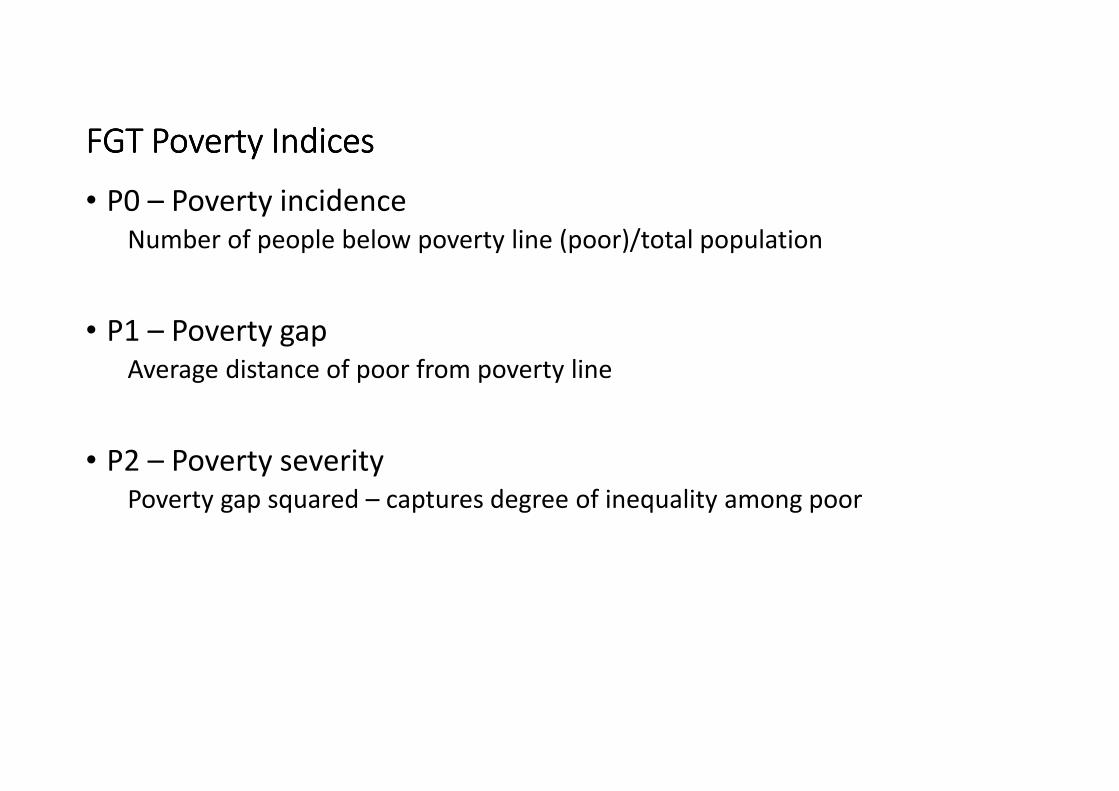
FGT Poverty IndicesFGT Poverty IndicesFGT Poverty IndicesFGT Poverty Indices
• P0 – Poverty incidence
Number of people below poverty line (poor)/total population
• P1 – Poverty gap
Average distance of poor from poverty line
• P2 – Poverty severity
Poverty gap squared – captures degree of inequality among poor

Poverty and Distribution Effects of Rice PoliciesPoverty and Distribution Effects of Rice PoliciesPoverty and Distribution Effects of Rice PoliciesPoverty and Distribution Effects of Rice Policies
Base 2012 SIM 1
Level Level % ch.
GINI 0.4713 0.4722 0.204
Philippines
P0 24.848 24.972 0.499
P1 6.836 6.920 1.224
P2 2.679 2.724 1.701
Urban
P0 11.570 11.682 0.965
P1 2.794 2.845 1.817
P2 0.989 1.015 2.606
Rural
P0 35.584 35.718 0.377
P1 10.105 10.215 1.091
P2 4.044 4.106 1.522
SIM 2
Level % ch.
0.4686 -0.569
24.227 -2.502
6.589 -3.616
2.559 -4.470
11.309 -2.257
2.689 -3.738
0.945 -4.491
34.671 -2.566
9.742 -3.589
3.864 -4.466
SIM 3
Level % ch.
0.4686 -0.568
24.454 -1.587
6.558 -4.067
2.512 -6.233
11.425 -1.259
2.691 -3.662
0.933 -5.745
34.988 -1.674
9.685 -4.157
3.788 -6.329
SIM 4
Level % ch.
0.4613 -2.114
22.581 -9.124
5.562 -18.646
1.961 -26.777
10.556 -8.764
2.321 -16.923
0.744 -24.803
32.303 -9.219
8.182 -19.031
2.946 -27.167
SIM 1 – rice imports cut
by 50%
SIM 2 – rice quota
eliminated
SIM 3 – rice quota
replaced by tariff
equivalent; revenue as
cash transfer
SIM 4 – rice tariff reduced
gradually to 25% in 10
years; revenue as cash
transfer

Palay and the Number of PoorPalay and the Number of PoorPalay and the Number of PoorPalay and the Number of Poor
4.42
-7.62
0.21
-1.77
2.26
-3.71
0.11
-0.52
-10.0
-5.0
0.0
5.0
10.0
SIM 1 SIM 2 SIM 3 SIM 4
Palay Production, % from base
Volume Price
124
-622 -394
-2,267-3,000
-2,000
-1,000
0
1,000
Sim 1 Sim 2 Sim 3 Sim 4
Change in the Number of People Below Poverty Line
(thousand)
SIM 1 – rice imports cut
by 50%
SIM 2 – rice quota
eliminated
SIM 3 – rice quota
replaced by tariff
equivalent; revenue as
cash transfer
SIM 4 – rice tariff reduced
gradually to 25% in 10
years; revenue as cash
transfer

Policy InsightsPolicy InsightsPolicy InsightsPolicy Insights
• Domestic prices of rice are 80% higher than comparable rice from Vietnam and Thailand
• Limiting entry of cheaper rice will hurt vulnerable poor households
• Rice is NOT affordable, especially for poor households; runs counter to NFA’s mission of making rice affordable for Filipinos
• Current rice policy (rice QR) is cash transfer from poor to rich; heavy burden on low income households
• Rice policy reform is critical in making the rice market equitable
• Convert QR to tariff and earmark revenue as cash transfer to poor, assistance to palay farmers, for productivity improvement, etc.