Embed Size (px)
Citation preview

Hindawi Publishing CorporationAdvances in Civil EngineeringVolume 2012, Article ID 267584, 10 pagesdoi:10.1155/2012/267584
Research Article
Pounding Effects in Simply Supported Bridges Accounting forSpatial Variability of Ground Motion: A Case Study
G. Tecchio, M. Grendene, and C. Modena
Department of Structural and Transportation Engineering, University of Padova, Via Marzolo 9, 35131 Padova, Italy
Correspondence should be addressed to G. Tecchio, [email protected]
Received 2 January 2012; Accepted 24 March 2012
Academic Editor: Sami W. Tabsh
Copyright © 2012 G. Tecchio et al. This is an open access article distributed under the Creative Commons Attribution License,which permits unrestricted use, distribution, and reproduction in any medium, provided the original work is properly cited.
This study carries out a parametrical analysis of the seismic response to asynchronous earthquake ground motion of a longmultispan rc bridge, the Fener bridge, located on a high seismicity area in the north-east of Italy. A parametrical analysis hasbeen performed investigating the influence of the seismic input correlation level on the structural response: a series of nonlineartime history analyses have been executed, in which the variation of the frequency content in the accelerograms at the pier bases hasbeen described by considering the power spectral density function (PSD) and the coherency function (CF). In order to include theeffects due to the main nonlinear behaviours of the bridge components, a 3D finite element model has been developed, in whichthe pounding of decks at cap-beams, the friction of beams at bearings, and the hysteretic behaviour of piers have been accountedfor. The sensitivity analysis has shown that the asynchronism of ground motion greatly influences pounding forces and deck-pierdifferential displacements, and these effects have to be accurately taken into account for the design and the vulnerability assessmentof long multispan simply supported bridges.
1. Introduction
Earthquake ground motion is usually assumed as a spatiallyuniform dynamic input in seismic analysis; this assumptionis correct for structures standing on a reasonably restrictedarea, in which the soil characteristics are presumed to behomogeneous and the seismic wave propagating velocity canbe neglected, but becomes inadequate for spatial structuresstanding on large sites such as extended foundations or dams,and long-estending structures such as bridges, viaducts,tunnels, and pipelines. In these cases the spatial variabilityof ground motion should be considered to avoid grossevaluation errors or at least underestimation of the dynamicresponse, since the phenomenon affects the response consid-erably and, hence, the level of protection of these structures(Lupoi et al. [1]). In particular for long multispan simplysupported bridges, a spatial variation in the input acting atsupports (pier and abutment foundations) should be consid-ered since it can induce pounding effects and deck unseating.It has been observed during the recent major seismic eventsthat this kind of bridge structure very often experiencespounding phenomena between adjacent structural segments(between neighbouring decks or cap-beams and decks, with
a component of impact force transferred to the piers), whichcan amplify differential movements between adjacent spansand determine cracks or brittle fractures at beam endings.These amplified differential displacements can induce pull-off and drop collapses of spans when the displacementcapacity of the bearing devices is exceeded or the seatinglength of girders is not sufficient for them to rest on theirsupports during strong ground motions.
For this type of bridges are required quite complex nu-merical models to represent with acceptable approximationthe global structural response taking into account the incho-erency of the seismic excitation at the supports, the impactphenomena between neighbouring structural segments, andthe nonlinear behaviour of the substructural components(piers and decks).
In the present study, the acceleration and displacementtime histories at the several prescribed locations on theground surface corresponding to the bridge supports, aregenerated using the spectral representation method [2–4]. Inorder to generate the stochastic field, three basic componentsare required: (i) power spectral density (PSD) which givesthe frequency content of the random process, (ii) coherencyfunction (CF) which gives an analytical representation of

2 Advances in Civil Engineering
spatial variation of the ground motion in the frequencydomain, and (iii) shape function (SF) for determining anonstationary random process in the time domain. Someexpressions have been proposed for the target spectral den-sity (i.e., the Clough-Penzien form [5], and the expressionsgiven by seismic codes [6]), for the coherency function[7–10] for the shape function [9]. The generated timehistories are compatible with prescribed response spectraand duration of strong ground motions for the consideredseismic area and reflect the wave passage and loss ofcoherence effects.
As regards evaluation of the pounding effects, it has tobe said that the interest of researchers is quite recent; theproblem was first investigated by [11] who studied thepounding phenomenon between two adjacent buildings,modelling the collision through impact elements whichconnected simple single-degree of freedom structures. In1992 the same problem was examined also by [12]; in1998 the study made by [11] was taken up again andapplied to bridge structures in [13]. Further investigationswere developed in [14] on the numerical simulation of thepounding process with the aim of calibrating the impactelement between neighbouring structures by comparing thenumerical results with the exact solution based on the wavepropagation theory. In recent years more complex finiteelements models have been developed: a numerical 3Dsimulation applied to a multispan simply supported bridgeis described in [15].
From the aforementioned studies interesting conclusionscan be drown for an improved modelling of the poundingeffect:
(1) pounding between adjacent segments can be de-scribed with fair accuracy through an impact ele-ment characterised by stiffness and damping (whichaccounts for energy dissipation);
(2) it has been noted in [13] that there is no need ofmodelling the entire structure for long bridges inorder to assess the middle span response with fairaccuracy; it is enough to study the seven centralspans since there are no relevant differences in thenumerical results between a model with an infinitenumber of span and a seven-span model;
(3) in the finite element model the stiffness k1 of theimpact element should be calibrated considering thenumber n of finite elements which compose the deck([14]);
(4) it is important to define opportunely the time stepused for the integration in the time-domain to avoidthat colliding adjacent segments of neighbouringdecks may behave like rigid bodies, since theyinfluence the dynamic response with their axialdeformation.
In the present study state-of-the-art models have been usedto simulate the asynchronous ground motion as a multisup-port seismic excitation and describe the pounding effects, asdescribed in Section 2.
Figure 1: Fener bridge: (a) lateral view of the bridge on the Piaveriver.
140
900
112.5 225 112.5
735
16 225 225
Figure 2: Typical transverse section of the superstructure.
900
150
175
1050
400
150
BeamSlabCap-beam
175
350
Joint (2 cm)
pport = 50 cm
Figure 3: Pier elevation and longitudinal section.
2. Seismic Response Accounting forSpatial Variability of Ground Motion:A Sensitivity Analysis
2.1. The Fener Bridge. This study carries out a parametricalanalysis of the seismic response to asynchronous earthquakeground motion of a long multispan rc bridge, the Fenerbridge (see Figures 1, 2, 3 and 4), located in the Venetoregion, in the Treviso province.
It represents an important overcrossing of the Piave riverfor the region road network. It was built in the mid nineteenseventies, and it consists of 24 regular spans having thesame length of 24.75 m, except for the lateral spans nearabutments, which are shorter (in particular at one end there

Advances in Civil Engineering 3
∅150
23∅20 longitudinal bars
∅10/20 cm stirrups
(a)
126
60
140
610
12
(b)
Figure 4: Cross sections of (a) typical column with reinforcement and (b) typical longitudinal precast concrete beam.
are two spans with reduced lengths of 18 m and 17.5 m,respectively, whilst at the other end only the last span has aslightly shorter lenght of 23.75 m). The overall structure isabout 579 m long.
The deck lodging two lanes has an overall width of 9metres; the deck structure is made up by four I-shapedprecast beams with a constant height of 1.4 m and by a16 cm high rc slab. The transverse distribution of trafficloads is obtained through 3 orthogonal rc girders positionedin the middle and at both ends of each span. Piers havea portal-shaped structure with circular rc columns, whoseheight varies gradually along the plan from a minimum of5 to 8 m roughly, since the deck slope in the longitudinaldirection is about 2%, while the extrados levels of plinths atthe base remain constant. Piers raise on deep foundations asillustrated in Figure 3.
The pier section is shown in Figure 4(a): reinforcementfor each of the two columns is provided by 23 longitudinalbars of 20 mm diameter and transverse stirrups of 10 mmdiameter (pitch = 20 cm).
The materials used for piers can be classified as follows:
(i) concrete: grade C25/30;
(ii) reinforcing steel: smooth bars, characteristic yieldstress fyk = 315 MPa.
According to the national seismic zonation map, Fenerbridge is located in an area characterised by PGA = 0.25 g,on a soil of medium stiffness (type B soil, according to thenational zonation map [16]).
2.2. FE Model of the Multisupported Structure. In the numer-ical model of the bridge elements with linear and nonlinearbehaviour have been adopted in order to represent effectivelythe global structural response: main beams, cap-beams, andtransverse girders have been modelled with linear beamelements, the rc slab has been modelled with plate elements,whilst a nonlinear behaviour has been adopted for columnsto simulate their hysteretic behaviour (using the Takeda-model [17] see Figure 5), for gap elements simulating impactbetween adjacent structural segments, and for frictionalconnections between longitudinal beams and cap-beams.
For the pier-element it has been necessary to assign ininput a nonlinear force-displacement law, which has been
obtained through a push-over analysis both in the longitudi-nal direction, where the column has a cantilever deflection,and in the transverse direction where the piers behaviouris that of a portal frame. A lumped plasticity element hasbeen employed for modelling the piers; the derived force-displacement curves are plotted below (see Figures 7 and 8).
Girders sit on cap-beams without any bearing devicestherefore restraint of superstructure segments from longi-tudinal displacement is given only by friction; the force-displacement law for frictional bearings is assumed as anidealized rigid-plastic behaviour, with a friction coefficienttaken as μ = 0.60 in the analysis (see Figure 6). In thetransverse direction a rigid restraint between deck and capbeam is assumed: the cap-beam lateral sides, being in directcontact with beams and acting as shear keys, do not allow anydifferential displacement.
Pier-deck pounding has been modelled through non-linear gap elements which react only under compression,after the initial gap closure corresponding to the joint width(2 cm).
The gap element stiffness k1 has been determinednormalising to 1 parameter γ in the following expression[14]:
γ = k1L
nEA, (1)
where A is the deck cross section, E its elastic modulus, Lthe span length, and n the number of finite elements intowhich the span length has been divided, taken as n = 10 inthis study. In particular for the impact element a dampingequivalent to energy dissipation has not been considered anda perfectly elastic collision has been modelled since impactenergy dissipation does not influence the global structureresponse significantly [13].
As to external restraints, they have been consideredfixed both in translation and rotation, because foundationsare plinths on piles and in a first approximation the soil-structure interaction can be neglected. The superstructuresegments not considered in the model (which represent aboundary condition to it) have been substituted with gapelements as illustrated in [13].
The FE model of the bridge and the related nonlineardynamic analyses have been performed using CSI SAP2000release 9 software [18]. The model represents only the 7central spans of the bridge (see Figure 9), with adequate

4 Advances in Civil Engineering
dm
rk
Previous yield
No yield
dy
ku
0
k0
rk0
F
d
dp
βdp
Fy+
Fy−
ku = 0(k dy/dm)α
(a)
F
d
Gap
k1
(b)
Figure 5: Models for (a) hysteretic behaviour of piers (Takeda model) and (b) gap element between adjacent structural segments.
F
d
μP
Figure 6: Connection between girder and cap-beam (frictionalbehaviour).
boundary conditions, instead of all the 24 spans; this hasallowed to reduce substantially the computational effort dueto the nonlinear effects included, without influencing thenumerical accuracy of results because, as reported in [13],the seismic response of the central span in a model with anumber of spans not less than five is a good approximationof the response obtained modelling the complete structure.
2.3. Charactherisation of Spatial Variability. In the presentstudy, the acceleration and displacement time histories atseveral prescribed locations on the ground surface corre-sponding to the bridge supports are generated using thespectral representation method. A uniform soil type isconsidered. As mentioned before, in order to generate thestochastic field, three basic components are required: (i)power spectral density function, (ii) coherency function, and(iii) shape function.
2.3.1. Power Spectral Density Function. Different analyticalmodels for PSD are advanced by some authors; in this studythe expressions given in EC8 [6] have been used, which are
approximate relations for power spectra corresponding tothe site-dependent response spectrum proposed in the code.The expressions are derived as follows:
Sa = 0.2ξ′A2T1.4 for T < TB,
Sa = 6ξ′V 2T−0.74 for TB < T < Tc,
Sa = 300ξ′D2T−3.1 for T > Tc,
(2)
where Sa is the acceleration power spectrum, ξ′ is the valueof the damping ratio, A, V , and D are the values of spectralacceleration, velocity and displacement, and TB and TC arethe response spectrum parameters.
2.3.2. Coherency Function. Assuming that the seismic wavefield can be completely described by a single plane vawe, itsspatial variation can be quantified by means of the coherencyfunction, which expresses the dependence in the frequencydomain between the PSD of time histories ground motionsoccuring at two different stations k and l (with relativedistance given by dkl) [15]. It is generally defined as follows:
γkl(ω) =⎧⎪⎨
⎪⎩
Skl(ω)√Skk(ω) · Sll(ω)
for Skk /= Sll,
0 for Skk · Sll = 0,(3)
where ω is the circular frequency, Skk(ω) and Sll(ω) denotethe autopower spectral density of the time histories at thestations k and l and Skl(ω) is the cross-spectral densityfunction of the considered pair of processes.
In general γkl(ω) is complex valued; its bounded modulus0 ≤ |γkl(ω)| ≤ 1 measures the linear statistical dependencebetween the two time-histories: in particular γkl = 1represents perfect correlation between the two motions,whereas γkl = 0 denotes complete lack of linear dependence,which means totally uncorrelated signals.
There are several models available in literature for thecoherency function; in the present study the formulation

Advances in Civil Engineering 5
F F
(a)
0
200
400
600
800
0 0.02 0.04 0.06 0.08
Displacement (m)Fo
rce
(kN
)
(b)
Figure 7: Piers behaviour in the longitudinal direction: (a) deflection shape; (b) force-displacement curve.
F F
(a)
00 0.02 0.04
200
400
600
800
Displacement (m)
Forc
e (k
N)
(b)
Figure 8: (a) Piers behaviour in the transverse direction: deflection shape; (b) force-displacement curve.
XYZ
Figure 9: Three-dimensional FE model of the seven central spans.
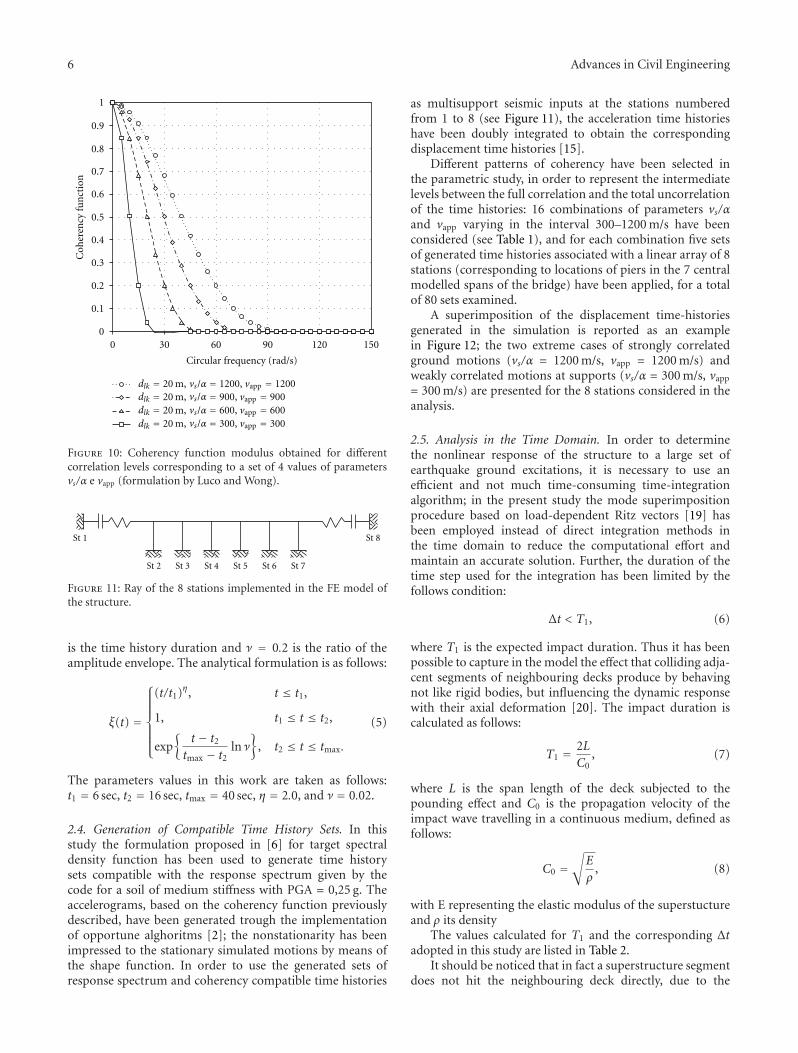
given in [10] has been adopted (see Figure 10), and itsgeneral expression is
γkl(dkl,ω) = exp
{
−(α · ω · dkl
vs
)2}
· exp
{
iω · dklvapp
}
, (4)
where the first term represents the geometrical incoherence,which arises from the scattering of waves in the heteroge-neous soil medium, while the second term accounts for the
velocity of seismic waves and the difference in the timesof arrival at different stations (vawe-passage effect). Theparameters describing these phenomena are, respectively(vs/α), in which vs is the shear wave velocity in the medium,α a measure of loss of the coherency rate with distanceand frequency, vapp, is the value of the apparent horizontalvelocity of the surface wave. The relative distance between thetwo different stations k and l is given by the span length dkl,while ω is the circular frequency. Both parameters (vs/α) andvapp usually vary in the range [300 m/s,∞[; if (vs/α) → ∞and vapp → ∞, the modulus of coherency function tends tobe 1: the two signals are then totally correlated (identical andin-phase ground motions).
2.3.3. Shape Function. The shape function of the oscillatoryprocess is defined in a general exponential form as suggestedin [15]; it is the normalised envelope function of the timehistory and is governed by the parameters t1 and t2 whichdefine the ramp duration and the decay starting time; tmax
6 Advances in Civil Engineering
0
0.1
0.2
0.3
0.4
0.5
0.6
0.7
0.8
0.9
1
Circular frequency (rad/s)
Coh
eren
cy fu
nct
ion
= 20 m, = 1200, vapp = 1200= 20 m, = 900, vapp = 900= 20 m, = 600, vapp = 600= 20 m, = 300, vapp = 300
0 30 60 90 120 150
vs/αvs/αvs/αvs/α
dlkdlkdlkdlk
Figure 10: Coherency function modulus obtained for differentcorrelation levels corresponding to a set of 4 values of parametersvs/α e vapp (formulation by Luco and Wong).
St 1
St 2 St 3 St 4 St 5 St 6 St 7
St 8
Figure 11: Ray of the 8 stations implemented in the FE model ofthe structure.
is the time history duration and ν = 0.2 is the ratio of theamplitude envelope. The analytical formulation is as follows:
ξ(t) =
⎧⎪⎪⎪⎪⎪⎨
⎪⎪⎪⎪⎪⎩
(t/t1)η, t ≤ t1,
1, t1 ≤ t ≤ t2,
exp{
t − t2tmax − t2
ln ν
}
, t2 ≤ t ≤ tmax.
(5)
The parameters values in this work are taken as follows:t1 = 6 sec, t2 = 16 sec, tmax = 40 sec, η = 2.0, and ν = 0.02.
2.4. Generation of Compatible Time History Sets. In thisstudy the formulation proposed in [6] for target spectraldensity function has been used to generate time historysets compatible with the response spectrum given by thecode for a soil of medium stiffness with PGA = 0,25 g. Theaccelerograms, based on the coherency function previouslydescribed, have been generated trough the implementationof opportune alghoritms [2]; the nonstationarity has beenimpressed to the stationary simulated motions by means ofthe shape function. In order to use the generated sets ofresponse spectrum and coherency compatible time histories
as multisupport seismic inputs at the stations numberedfrom 1 to 8 (see Figure 11), the acceleration time historieshave been doubly integrated to obtain the correspondingdisplacement time histories [15].
Different patterns of coherency have been selected inthe parametric study, in order to represent the intermediatelevels between the full correlation and the total uncorrelationof the time histories: 16 combinations of parameters vs/αand vapp varying in the interval 300–1200 m/s have beenconsidered (see Table 1), and for each combination five setsof generated time histories associated with a linear array of 8stations (corresponding to locations of piers in the 7 centralmodelled spans of the bridge) have been applied, for a totalof 80 sets examined.
A superimposition of the displacement time-historiesgenerated in the simulation is reported as an examplein Figure 12; the two extreme cases of strongly correlatedground motions (vs/α = 1200 m/s, vapp = 1200 m/s) andweakly correlated motions at supports (vs/α = 300 m/s, vapp
= 300 m/s) are presented for the 8 stations considered in theanalysis.
2.5. Analysis in the Time Domain. In order to determinethe nonlinear response of the structure to a large set ofearthquake ground excitations, it is necessary to use anefficient and not much time-consuming time-integrationalgorithm; in the present study the mode superimpositionprocedure based on load-dependent Ritz vectors [19] hasbeen employed instead of direct integration methods inthe time domain to reduce the computational effort andmaintain an accurate solution. Further, the duration of thetime step used for the integration has been limited by thefollows condition:
Δt < T1, (6)
where T1 is the expected impact duration. Thus it has beenpossible to capture in the model the effect that colliding adja-cent segments of neighbouring decks produce by behavingnot like rigid bodies, but influencing the dynamic responsewith their axial deformation [20]. The impact duration iscalculated as follows:
T1 = 2LC0
, (7)
where L is the span length of the deck subjected to thepounding effect and C0 is the propagation velocity of theimpact wave travelling in a continuous medium, defined asfollows:
C0 =√
E
ρ, (8)
with E representing the elastic modulus of the superstuctureand ρ its density
The values calculated for T1 and the corresponding Δtadopted in this study are listed in Table 2.
It should be noticed that in fact a superstructure segmentdoes not hit the neighbouring deck directly, due to the

Advances in Civil Engineering 7
Table 1: Combinations of vs/α and vapp values considered in the parametric study.
Vawe-passage effectGeometrical incoherence
vs/α (m/s)
vapp (m/s) 300 600 900 1200
300 x x X x
600 x x X x
900 x x X x
1200 x x X x
St 1St 2St 3St 4
St 5St 6St 7St 8
0 5 10 15 20 25 30 35 40 45
t (s)
10
0
−10
Gro
un
d di
spl.
(cm
)
(a)
St 1St 2St 3St 4
St 5St 6St 7St 8
0 5 10 15 20 25 30 35 40 45
t (s)
10
0
−10
Gro
un
d di
spl.
(cm
)(b)
Figure 12: Displacement time histories for stations 1 to 8: (a) highly correlated time-histories (set 1/5 vs/α = 1200 m/s.
Table 2: Integration time step adopted Δt.
Elastic modulus E (MPa) 24821
Density ρ (Kg/m3) 2500
Deck span lenght L (m) 24.75
Impact duration T1 (s) 0.016
Integration time step Δt (s) 0.01
Δt/T1 0.625
presence of the cap beam, but this element has been assumedas transmitting the impact rigidly and not influencing thewave propagation.
3. Results of the Numerical Analyses
A sensitivity analysis of the structure dynamic behaviourdue to different spatially varying ground motion sets hasbeen carried out, evaluating the influence of the seismicinput correlation on the structural response, in terms of thefollowing:
(i) differential displacement between piers and decksegments;
(ii) pounding forces between cap-beams and decks;
(iii) effects on piers: shear forces at the bases and maxi-mum displacements at the tops.
The response analysis focuses on the central span of theFE model, in order to provide results unaffected by theboundary coditions; as previously said, for each prefixedlevel of ground motion correlation (16 in total, each onedetermined by a couple of the parameters vs/α and vapp)5 nonlinear dynamic analyses have been performed, using
compatible time history sets. The mean value of the fiveresults has been adopted.
3.1. Differential Displacements. Differential displacementsbetween piers and decks are represented in Figure 13: itcan be observed that in all cases the calculated values arerelatively small and remain under the threshold of 5 cm;the maximum differential displacement (dd = 4.4 cm) isobtained, as expected, for the extreme case of maximumcoherency loss (vs/α = 300 m/s, vapp = 300 m/s).
The limited amplitude of differential displacements pre-vents pull-off-and-drop collapse of deck segments and can beexplained considering that joint gaps at span ends are small(2 cm) and do not allow the development of high inertiaforces at the deck level; consequently the displacementscannot be considerably amplified. These results are inaccordance with the observations reported in [20].
3.2. Pounding Forces. Impact forces between cap beamsand decks are highly influenced by the correlation level ofground motions at the structural supports: as Figure 14(a)shows, there is a trend in pounding forces, which rapidlyincrease with the loss of coherency of seismic inputs: themagnitude of impact force FI , obtained in the extreme caseof weakly correlated time histories (vs/α = 300 m/s, vapp =300 m/s), assumes a value 3 times larger (FI = 1293 kN)than that derived by analysis with uniform inputs, FI =428 kN (represented by the case vs/α = 1200 m/s, vapp =1200 m/s). Consequently, even though in the case of uniformseismic excitation no damage should occur to the cap beamsand decks, with weakly correlated input time histories, thepounding effects could determine considerable damage tothe local area of bridge decks.

8 Advances in Civil Engineering
300600
9001200
300
600
900
1200
0
0.01
0.02
0.03
0.04
0.05
0.06
0.07
0.08
0.09
0.1
Dis
plac
emen
t (m
)
(m/s)
v app
(m/s
)vs /α
(a)
0
0.01
0.02
0.03
0.04
0.05
0.06
0.07
Dis
plac
emen
t (m
)
vapp = 300 (m/s)
vapp = 600 (m/s)
vapp = 900 (m/s)vapp = 1200 (m/s)
300 600 900 1200
(m/s)vs/α
(b)
Figure 13: Pier-deck differential displacement varying with seismic input correlation level (represented by parameters vs/α and vapp): (a) 3Dview and (b) 2D view.
300600
9001200
300
600
900
1200
0
200
400
600
800
1000
1200
1400
Impa
ct fo
rce
(kN
)
(m/s)
v app
(m/s
)
vs /α
(a)
300600
900
1200
300
600
900
1200
0
1
2
3
4
5
6
Nu
mbe
r of
impa
cts
(m/s)
v app
(m/s
)
vs /α
(b)
Figure 14: (a) Pounding forces varying with correlation level of input ground motions; (b) Total number of registered impacts (mean value).
Registered impacts follow a similar tendency (seeFigure 14(b)): the numerical results show that collisionsoccur more frequently as the correlation level of time historyinputs decreases. However in all cases, the total number ofimpacts (mean value of the 5 non linear dynamic analysisperformed) is found to be relatively small (less than 5).
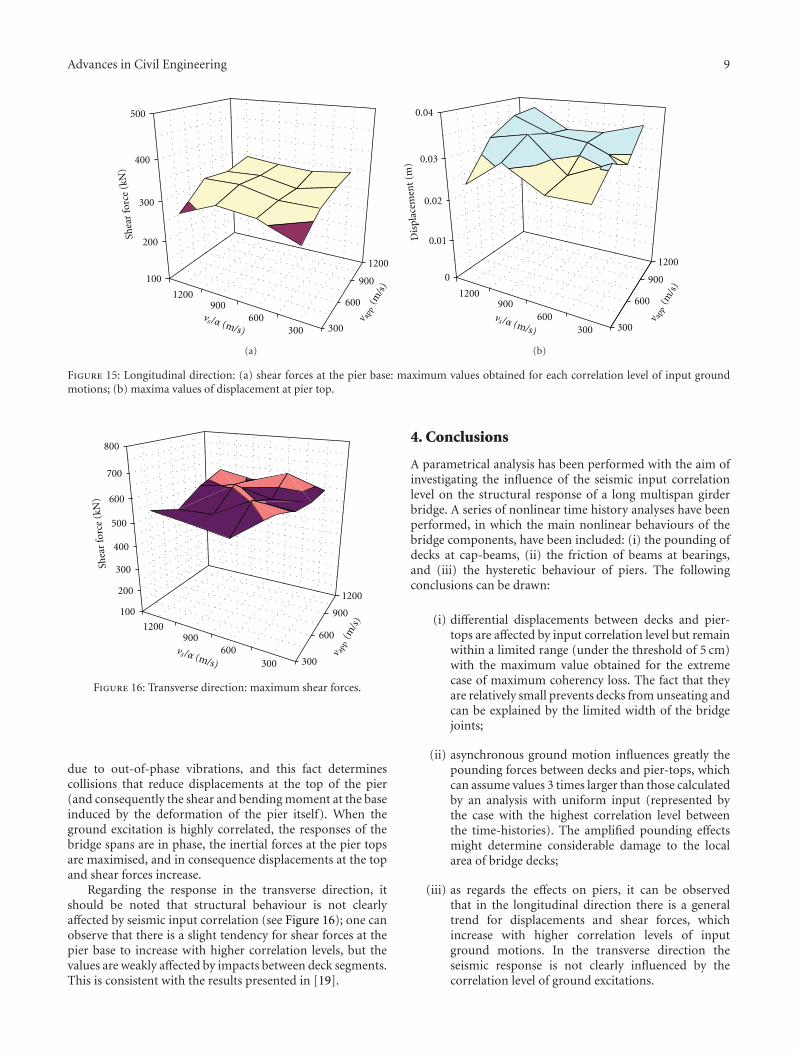
3.3. Effects on Piers. As regards the effects on piers in thelongitudinal direction, they are represented in Figure 15 interms of shear forces and displacements (maximum values atthe top of the pier) obtained as functions of the correlation
level between the time histories. It can be observed that themaximum value of shear force V = 346 kN is obtained in thecase of highly correlated time histories, and the minimum V= 274 kN is derived using inputs with the weakest correlation(vs/α = 300 m/s, vapp = 300 m/s). Similarly it can be said thatthere is a general trend for displacements at the pier top (seeFigure 15(b)) that become larger as the correlation increases,with the maximum value D = 3,7 cm calculated in the case ofthe highest correlation level of input ground motions.
These effects can be explained considering that whenground excitations are weakly correlated or uncorrelated, themovement of deck segments can be in opposite direction
Advances in Civil Engineering 9
300600
9001200
300
600
900
1200
100
200
300
400
500
Shea
r fo
rce
(kN
)
(m/s)
v app
(m/s
)
vs /α
(a)
(m/s)
v app
(m/s
)
300600
9001200
300
600
900
1200
0
0.01
0.02
0.03
0.04
Dis
plac
emen
t (m
)
vs /α
(b)
Figure 15: Longitudinal direction: (a) shear forces at the pier base: maximum values obtained for each correlation level of input groundmotions; (b) maxima values of displacement at pier top.
300600
9001200
300
600
900
1200
100
200
300
400
500
600
700
800
Shea
r fo
rce
(kN
)
(m/s)
v app
(m/s
)
vs /α
Figure 16: Transverse direction: maximum shear forces.
due to out-of-phase vibrations, and this fact determinescollisions that reduce displacements at the top of the pier(and consequently the shear and bending moment at the baseinduced by the deformation of the pier itself). When theground excitation is highly correlated, the responses of thebridge spans are in phase, the inertial forces at the pier topsare maximised, and in consequence displacements at the topand shear forces increase.
Regarding the response in the transverse direction, itshould be noted that structural behaviour is not clearlyaffected by seismic input correlation (see Figure 16); one canobserve that there is a slight tendency for shear forces at thepier base to increase with higher correlation levels, but thevalues are weakly affected by impacts between deck segments.This is consistent with the results presented in [19].
4. Conclusions
A parametrical analysis has been performed with the aim ofinvestigating the influence of the seismic input correlationlevel on the structural response of a long multispan girderbridge. A series of nonlinear time history analyses have beenperformed, in which the main nonlinear behaviours of thebridge components, have been included: (i) the pounding ofdecks at cap-beams, (ii) the friction of beams at bearings,and (iii) the hysteretic behaviour of piers. The followingconclusions can be drawn:
(i) differential displacements between decks and pier-tops are affected by input correlation level but remainwithin a limited range (under the threshold of 5 cm)with the maximum value obtained for the extremecase of maximum coherency loss. The fact that theyare relatively small prevents decks from unseating andcan be explained by the limited width of the bridgejoints;
(ii) asynchronous ground motion influences greatly thepounding forces between decks and pier-tops, whichcan assume values 3 times larger than those calculatedby an analysis with uniform input (represented bythe case with the highest correlation level betweenthe time-histories). The amplified pounding effectsmight determine considerable damage to the localarea of bridge decks;
(iii) as regards the effects on piers, it can be observedthat in the longitudinal direction there is a generaltrend for displacements and shear forces, whichincrease with higher correlation levels of inputground motions. In the transverse direction theseismic response is not clearly influenced by thecorrelation level of ground excitations.
10 Advances in Civil Engineering
The results highlight that the spatial variation propertiesof the earthquake ground motion can significantly changethe structural response especially in terms of pounding forcesand deck unseating, and consequently these effects have tobe taken into account for the design or the vulnerabilityassessment of long multispan simply supported bridges.
References
[1] A. Lupoi, P. Franchin, P. E. Pinto, and G. Monti, “Seismic de-sign of bridges accounting for spatial variability of ground mo-tion,” Earthquake Engineering and Structural Dynamics, vol.34, no. 4-5, pp. 327–348, 2005.
[2] G. Deodatis, “Non-stationary stochastic vector processes: seis-mic ground motion applications,” Probabilistic EngineeringMechanics, vol. 11, no. 3, pp. 149–167, 1996.
[3] M. Shinozuka and G. I. Schueller, “Stocastic fields and theirdigital simulation,” in Stochastic Methods in Structural Dynam-ics, G. I. Schueller and M. Shinozuka, Eds., pp. 93–133, Marti-nus Nijhoff, Dordrecht, The Netherdands, 1987.
[4] M. Shinozuka and G. Deodatis, “Simulation of multi-dimen-sional Gaussian stochastic fields by spectral representation,”Applied Mechanics Reviews, vol. 44, no. 4, pp. 191–204, 1991.
[5] R. W. Clough and J. Penzien, Dynamics of Structures, McGrawHill, New York, NY, USA, 1993, International Edition.
[6] UNI ENV 1998-2, “Eurocode 8—design provisions for earth-quake resistance of structures—part 2,” Bridges, 1998.
[7] A. Der Kiureghian, “A coherency model for spatially varyingground motions,” Earthquake Engineering and Structural Dy-namics, vol. 25, no. 1, pp. 99–111, 1996.
[8] H. Hao, C. S. Oliveira, and J. Penzien, “Multiple-stationground motion processing and simulation based on smart-1array data,” Nuclear Engineering and Design, vol. 111, no. 3,pp. 293–310, 1989.
[9] R. S. Harichandran and E. H. Vanmarcke, “Stochastic varia-tion of earthquake ground motion in space and time,” ASCEJournal of Engineering Mechanics, vol. 112, no. 2, pp. 154–174,1986.
[10] J. E. Luco and H. L. Wong, “Response of a rigid foundationto a spatially random round motion,” Earthquake Engineeringand Structural Dynamics, vol. 14, no. 6, pp. 891–908, 1986.
[11] S. A. Anagnostopoulos, “Pounding of buildings in series dur-ing earthquakes,” Earthquake Engineering and Structural Dy-namics, vol. 16, no. 3, pp. 443–456, 1988.
[12] B. F. Maison and K. Kasai, “Dynamics of pounding when twobuildings collide,” Earthquake Engineering and Structural Dy-namics, vol. 21, no. 9, pp. 771–786, 1992.
[13] R. Jankowski, K. Wilde, and Y. Fujino, “Pounding of super-structure segments in isolated elevated bridge during earth-quakes,” Earthquake Engineering and Structural Dynamics, vol.27, no. 5, pp. 487–502, 1998.
[14] K. Kawashima and Watanabe G., “Numerical simulation ofpounding of bridge decks,” in Proceedings of the 13th WorldConference on Earthquake Engineering Vancouver, British Co-lumbia, Canada, August 2004, Paper no.884.
[15] G. Zanardo, H. Hao, and C. Modena, “Seismic response ofmulti-span simply supported bridges to a spatially varyingearthquake ground motion,” Earthquake Engineering andStructural Dynamics, vol. 31, no. 6, pp. 1325–1345, 2002.
[16] Ordinance of the Presidency of the Council of Ministers 3431,“Initial elements on the general criteria for classifying nationalseismic zones and technical standards for construction,” Offi-cial Gazette of the Italian Republic, 2003.
[17] T. Takeda, A. M. Sozen, and N. N. Nielsen, “Reinforced con-crete response to simulate earthquakes,” ASCE Journal ofStructural Engineering Division, vol. 96, no. 12, pp. 2257–2273,1970.
[18] Computers & Structures Inc., “CSI SAP2000 release 9,” Berke-ley Calif, USA, 2004.
[19] E. L. Wilson, M. W. Yuan, and J. M. Dickens, “Dynamic Anal-ysis by direct superposition of Ritz vectors,” Earthquake Engi-neering and Structural Dynamics, vol. 10, no. 6, pp. 813–821,1982.
[20] R. Jankowski, K. Wilde, and Y. Fujino, “Reduction of effects inelevated bridges during earthquakes,” Earthquake Engineering& Strucutral Dynamics, vol. 29, pp. 195–212, 2000.

International Journal of
AerospaceEngineeringHindawi Publishing Corporationhttp://www.hindawi.com Volume 2010
RoboticsJournal of
Hindawi Publishing Corporationhttp://www.hindawi.com Volume 2014
Hindawi Publishing Corporationhttp://www.hindawi.com Volume 2014
Active and Passive Electronic Components
Control Scienceand Engineering
Journal of
Hindawi Publishing Corporationhttp://www.hindawi.com Volume 2014
International Journal of
RotatingMachinery
Hindawi Publishing Corporationhttp://www.hindawi.com Volume 2014
Hindawi Publishing Corporation http://www.hindawi.com
Journal ofEngineeringVolume 2014
Submit your manuscripts athttp://www.hindawi.com
VLSI Design
Hindawi Publishing Corporationhttp://www.hindawi.com Volume 2014
Hindawi Publishing Corporationhttp://www.hindawi.com Volume 2014
Shock and Vibration
Hindawi Publishing Corporationhttp://www.hindawi.com Volume 2014
Civil EngineeringAdvances in
Acoustics and VibrationAdvances in
Hindawi Publishing Corporationhttp://www.hindawi.com Volume 2014
Hindawi Publishing Corporationhttp://www.hindawi.com Volume 2014
Electrical and Computer Engineering
Journal of
Advances inOptoElectronics
Hindawi Publishing Corporation http://www.hindawi.com
Volume 2014
The Scientific World JournalHindawi Publishing Corporation http://www.hindawi.com Volume 2014
SensorsJournal of
Hindawi Publishing Corporationhttp://www.hindawi.com Volume 2014
Modelling & Simulation in EngineeringHindawi Publishing Corporation http://www.hindawi.com Volume 2014
Hindawi Publishing Corporationhttp://www.hindawi.com Volume 2014
Chemical EngineeringInternational Journal of Antennas and
Propagation
International Journal of
Hindawi Publishing Corporationhttp://www.hindawi.com Volume 2014
Hindawi Publishing Corporationhttp://www.hindawi.com Volume 2014
Navigation and Observation
International Journal of
Hindawi Publishing Corporationhttp://www.hindawi.com Volume 2014
DistributedSensor Networks
International Journal of