Embed Size (px)
Citation preview

P O T L A T C H 2 0 0 2 A N N U A L R E P O R T

F I N A N C I A L R E V I E WF I N A N C I A L H I G H L I G H T S
(Dollars in thousands – except per-share amounts) 2002 2001 2000
Net sales $1,286,217 $1,274,585 $1,293,193
Loss from continuing operations (50,933) (56,566) (33,393)
Net loss (234,381) (79,445) (33,214)
Net cash provided by (used for) operations (69,144) 34,474 72,384
Per common share:
Basic net loss $ (8.23) $ (2.81) $ (1.16)
Diluted net loss (8.23) (2.81) (1.16)
Cash dividends paid .60 1.17 1.74
Stockholders’ equity 15.07 24.98 28.69
Working capital $ 102,693 $ 612,384 $ 745,052
Depreciation, amortization and cost of fee timber harvested 115,469 115,033 108,722
Capital expenditures 51,614 42,679 142,812
Total assets 1,616,326 2,487,146 2,542,445
Long-term debt (noncurrent portion) 622,645 820,522 801,549
Stockholders’ equity 430,791 707,304 813,236
Average common shares outstanding (in thousands) 28,462 28,282 28,523
Certain amounts for 2000 and 2001 have been conformed to the 2002 presentation.
Potlatch Corporation, founded in 1903 in Potlatch, Idaho, is a
diversified forest products company with 1.5 million acres of timber-
lands in Arkansas, Idaho and Minnesota. Our manufacturing facilities
convert wood fiber into two main product lines: bleached fiber
products (bleached kraft pulp, paperboard and consumer tissue) and
wood products (oriented strand board, lumber, plywood and particle-
board).Potlatch’s business philosophy is committed to increased earnings
and a superior rate of return, achieved by talented, well-trained and
highly motivated people who are properly supported by a sound
financial structure and a keen sense of responsibility for the environ-
ment and to all of the publics with whom the company has contact.
O N T H E C O V E R :
An important commercial species that Potlatch manufacturesinto premium decking and siding, Western Red Cedar is alsopermanently protected in Potlatch’s privately maintainedWalker Park in North Central Idaho.
T A B L E O F C O N T E N T S
Letter to Shareholders 2
Principal Facilities 7
2002 Capacities, Production and Fiber Flow 8
Management’s Report 10
Financial Review 11
Consolidated Financial Statements 22
Eleven-Year Record 40
Directors and Officers 44
Corporate Information 45

T O O U R S H A R E H O L D E R S
otlatch, along with much of the forest
products industry, endured another
difficult and challenging year in 2002.
While Potlatch’s overall financial
performance during the year was disap-
pointing, our Board of Directors and
management team continued to advance
the company-wide strategy of refocusing
our resources on those businesses with the greatest
potential for growing earnings and adding shareholder
value over time. This past year we pursued that strategy
by making significant changes in the company’s structure
through the sale of assets and the exit from some product
lines and businesses. We also built on the strategy
through investments in new proprietary products and
expansion of existing businesses.
Asset sales and related activities, coupled with a
salaried workforce restructuring in the fourth quarter,
resulted in significant non-recurring charges during the
year – most of them non-cash – which in combination
with challenging market conditions for our business
segments contributed to a substantial loss for the year.
Despite the reported loss, the company maintained a
positive cash flow that allowed us to continue strengthening
our balance sheet through retirement of debt as well as
investing in potential high-return projects.
In summary, all business segment performance was
influenced by general economic sluggishness and the
unusual strength of the U.S. dollar, which peaked against
foreign currencies early in 2002 and then began a modest
decline in the first half that continued through the year
and into 2003. Although the dollar presently remains
overvalued on an historic basis, the declines over the past
12 months are beginning to exert positive influences on
many of our markets.
Our Resource Division experienced stronger
earnings in 2002 due to improved external sales volumes
and realizations as well as the sale of surplus property in
Oregon, Minnesota and Arkansas.
Oversupplied international markets for most lumber
and panel products challenged our Wood Products
Division throughout the year despite a robust domestic
housing industry. This pattern first emerged in mid-2000
and has prevailed each year since, negatively influencing
prices for all wood products. Lumber prices fell to historic
lows as imports accelerated in spite of U.S.-imposed
duties for Canadian softwood lumber. At this writing, we
are hopeful that a long-term negotiated solution will
finally resolve our long-standing concern over Canada’s
subsidized resource allocation practices. In the interim,
however, the Canadians continue to push wood products
across our border and thus contribute to lower pricing
for all North American producers.
A 23-day strike at the company’s Southern Unit in
Warren, Arkansas, contributed to the wood product
segment’s losses, but ultimately concluded with agree-
ment on a competitive contract. The Bradley hardwood
lumber mill in Warren was permanently closed in the
third quarter and Potlatch exited the hardwood lumber
business. Although recent capital improvements had
enhanced this mill’s productivity, ongoing raw material
limitations prevented attainment of optimum efficiency.
We subsequently sold the Bradley property to an
independent Arkansas entrepreneur.
Our pulp-based businesses experienced a net loss
for the year, despite the beginning of demand and price
improvements for paperboard and a relatively stable
tissue market. In January of 2003, unions representing
employees at our pulp-based operations in Lewiston,
Idaho, approved a new four-year contract. The new
contract brings our Idaho pulp and paperboard labor
costs more in line with our competitors and was a direct
result of positive and constructive attitudes on the part
2
P“Potlatch has long understood that our financial success is tied to maintaining publictrust and acceptance of our resource managementpractices.”L. Pendleton Siegel (left), Chairman and Chief Executive Officer, and Richard L. Paulson, President and Chief Operating Officer
T O O U R S H A R E H O L D E R S
of the union leadership in Lewiston. To assure our
customers of adequate product supply during negotiations,
we substantially increased inventories of paperboard
and tissue, which had a short-term adverse impact on
earnings during the year.
In the first quarter of 2003, our printing paper
mill in Brainerd, Minnesota, was sold to Missota Paper
Company LLC for $4.44 million in cash. Efforts to
sell Brainerd had been underway since the mill was
permanently closed in mid-May 2002 in conjunction with
the sale of most of our printing papers segment’s assets
in Cloquet, Minnesota, to a domestic subsidiary of
Sappi Limited.
Proceeds from sale of our printing papers assets
were used to retire over $470 million in debt in 2002,
which significantly strengthened our balance sheet by
reducing interest charges and also freed capital for
investment in our resource, wood products and consumer
tissue business segments.
Each of our business segments implemented activi-
ties during the year that collectively moved us toward
realization of our company-wide strategy.
For example, the Resource Division continued to
build on its strategy of expanding revenue opportunities
by systematically evaluating all lands and resources
under its management for their highest and best uses,
including recreation leases and conservation easements.
In the second half of 2002, independent third-party
forest management audits were conducted on all
1.5 million acres of our forestland in Idaho, Minnesota
and Arkansas. Potlatch’s management practices were
subsequently certified as meeting both the International
Organization for Standardization (ISO) Environmental
Management System and the Sustainable Forestry
Initiative (SFI®) requirements for 2002-2004. As we
reported last year, the Forest Stewardship Council (FSC)
certified management practices at our Boardman,
Oregon, hybrid poplar plantation in 2001 as part of our
plan to capitalize on growing markets for certified
hardwood lumber.
Potlatch has long understood that our financial
success is tied to maintaining public trust and acceptance
of our resource management practices. Certification is
simply an extension of our commitment to responsible
land stewardship. However, the endorsement of these
respected organizations provides an extra measure of
assurance for our customers, the public and government
policy leaders.
While certification facilitates Potlatch’s exploration
of high-return niche markets for certified wood products,
it also lays necessary groundwork for developing
non-timber revenue opportunities such as conservation
easements. A major step toward the latter objective was
made late in the year when Potlatch signed an option
agreement with the internationally recognized Trust for
Public Land (TPL) to pursue a working forest conservation
easement on a substantial portion of our Idaho timber-
lands. The agreement calls for a phased evaluation of
3

demonstrate consistent quality, we are concentrating on
upgrading Lewiston’s product mix. We continue to believe
our paperboard business has the scale to be competitive,
and progress achieved in the past year appears to confirm
that belief.
Throughout the year we continued our efforts to
reduce costs company-wide and late in 2002 restructured
our salaried workforce through job consolidation and
phasing out of non-essential activities on an operation-
by-operation basis. We expect the restructuring will result
in combined annual savings of approximately $7 million.
Potlatch has been fortunate to have outstanding
leadership on our Board of Directors through the very
challenging decade of the 1990s. We note with sadness
the passing of Richard A. Clarke. A Potlatch director for
17 years, Dick was just short of his mandatory retirement.
Vivian W. Piasecki reached mandatory retirement age in
2002, after 10 years on our Board. We will all miss their
wisdom and guidance.
We are pleased to have obtained the services of
two new Board members, both with extensive consumer
products experience. Michael T. Riordan, 52, joined
Potlatch’s Board of Directors effective December 31, 2002.
He was most recently Chairman, Chief Executive
Officer and President of Paragon Trade Brands, following
several years of service as Chairman, Chief Executive
Officer and President of Fort Howard Corporation.
Lawrence S. Peiros, 47, Group Vice President of The
Clorox Company, was elected to the Board, effective
2004, will produce an additional 30,000 tons (3.6 million
cases) of premium towel for retail store customers in the
West and to service expanding markets in the Midwest
and East.
In January of 2003 we separated our paperboard
and consumer tissue businesses into two separate
divisions. This change reflects the increasing require-
ments of our private label consumer tissue operations in
response to our plans for growth.
Our paperboard business enjoyed improved demand
for most of its products during the year, with extended
order backlogs at both Cypress Bend, Arkansas, and
Lewiston. Mid-year price improvements began to take hold
gradually during the latter half of 2002, and we expect
those improvements to continue into the current year.
Our pulp and paperboard operation in Cypress
Bend remains one of the industry’s low-cost producers
and continues to enhance its reputation for quality as a
result of capital improvements completed two years ago.
In recognition of the mill’s emphasis on quality, Cypress
Bend last year earned the Arkansas Governor’s Quality
Achievement Award. As we noted in last year’s annual
report, this relentless pursuit of quality has allowed
Potlatch to capture an increasing share of the market for
high-end packaging, particularly for cosmetics.
Due in large part to the continued dedication and
commitment of its workforce, our Lewiston pulp and
paperboard operation began achieving quality and
productivity targets late in 2002 and into 2003. As we
T O O U R S H A R E H O L D E R S
4
easement candidate properties, starting in 2003. If
approved by our Board of Directors, properties selected
during the evaluation process will be permanently
protected from commercial and residential development,
which are inconsistent with sustainable timber produc-
tion and recreational and scenic uses. In exchange for
foregoing development opportunities, Potlatch will
receive compensation – raised from public and private
sources – that TPL believes can exceed $40 million.
Our Resource Division has also accepted an
invitation from the highly respected Pinchot Institute for
Conservation to participate in an independent evaluation
of our Idaho forest management practices against SFI and
FSC, the two primary North American environmental
performance standards. We are the first publicly traded
forest products company to participate in such an open
comparison of these standards and, as such, we are
demonstrating our stewardship commitment and enhancing
the credibility of our certification efforts. Results of the
comparison, which will be made public, should provide
useful information for improving management practices
and certification approaches.
In mid-year, our Wood Products Division completed
development of new, proprietary panel products that
offer great values for both builders and homeowners.
Three new oriented strand board (OSB) products include
OXTerminatorTM, a new panel that resists rot and insects
and has superior mold inhibiting qualities, and LuminOX®,
which has a radiant barrier to reduce heating and cooling
costs. Both of these products have patent protection. In
addition, we have added OXTremeTM, a sub-flooring panel
that resists edge swelling due to moisture, to our OSB
Sturd-I-Floor line. Each of these new products has met
with market acceptance, and we will aggressively expand
their market presence in 2003. The division is also
exploring other proprietary wood products, which we
expect to announce later in the year.
Late last year we began a 30 percent expansion
of softwood lumber production at our Arkansas sawmills
in Warren and Prescott through the addition of a third
shift. That expansion, coupled with productivity improve-
ments throughout the division, should reduce unit costs
and increase Potlatch’s overall lumber production by
roughly 15 percent in 2003.
As previously reported, we believe our private label
consumer tissue business will be the company’s growth
engine through the remainder of this decade as Potlatch
continues to meet the expanding needs of our existing
customers and broadens our customer base through an
aggressive sales effort. Accordingly, the Board of
Directors in September approved a $66 million capital
project to add a new tissue machine and related converting
facilities adjacent to our operations in Las Vegas,
Nevada. The new machine employs licensed proprietary
through-air-dried (TAD) technology that will enable
us to manufacture premium towel products equal to the
best quality currently available in the U.S. The new
102-inch-wide machine, scheduled for startup early in
rivate label consumer tissue will
be Potlatch’s growth engine in the
current decade as we meet existing
customers’ growing needs and
expand our customer base. A new
$66 million tissue machine at Las
Vegas, Nevada, will add premium
quality towels to the product line by
early 2004.
uality improvements at our
Cypress Bend, Arkansas, paper-
board mill permitted Potlatch to
capture an increasing share of the
high-end packaging market in 2002.
The Lewiston, Idaho, operation
started achieving new quality and
productivity targets late in the year,
allowing the mill to begin upgrading
its product mix.
ne of Potlatch’s new
patent-protected wood products,
LuminOX® is an oriented strand
board panel with a foil-radiant barrier
that reduces heating and cooling
costs in residential and commercial
buildings. Other proprietary wood
products are under development.
T O O U R S H A R E H O L D E R S
5
P O Q
P O T L A T C H C O R P O R A T I O N A N D C O N S O L I D A T E D S U B S I D I A R I E S
P R I N C I P A L F A C I L I T I E S
7
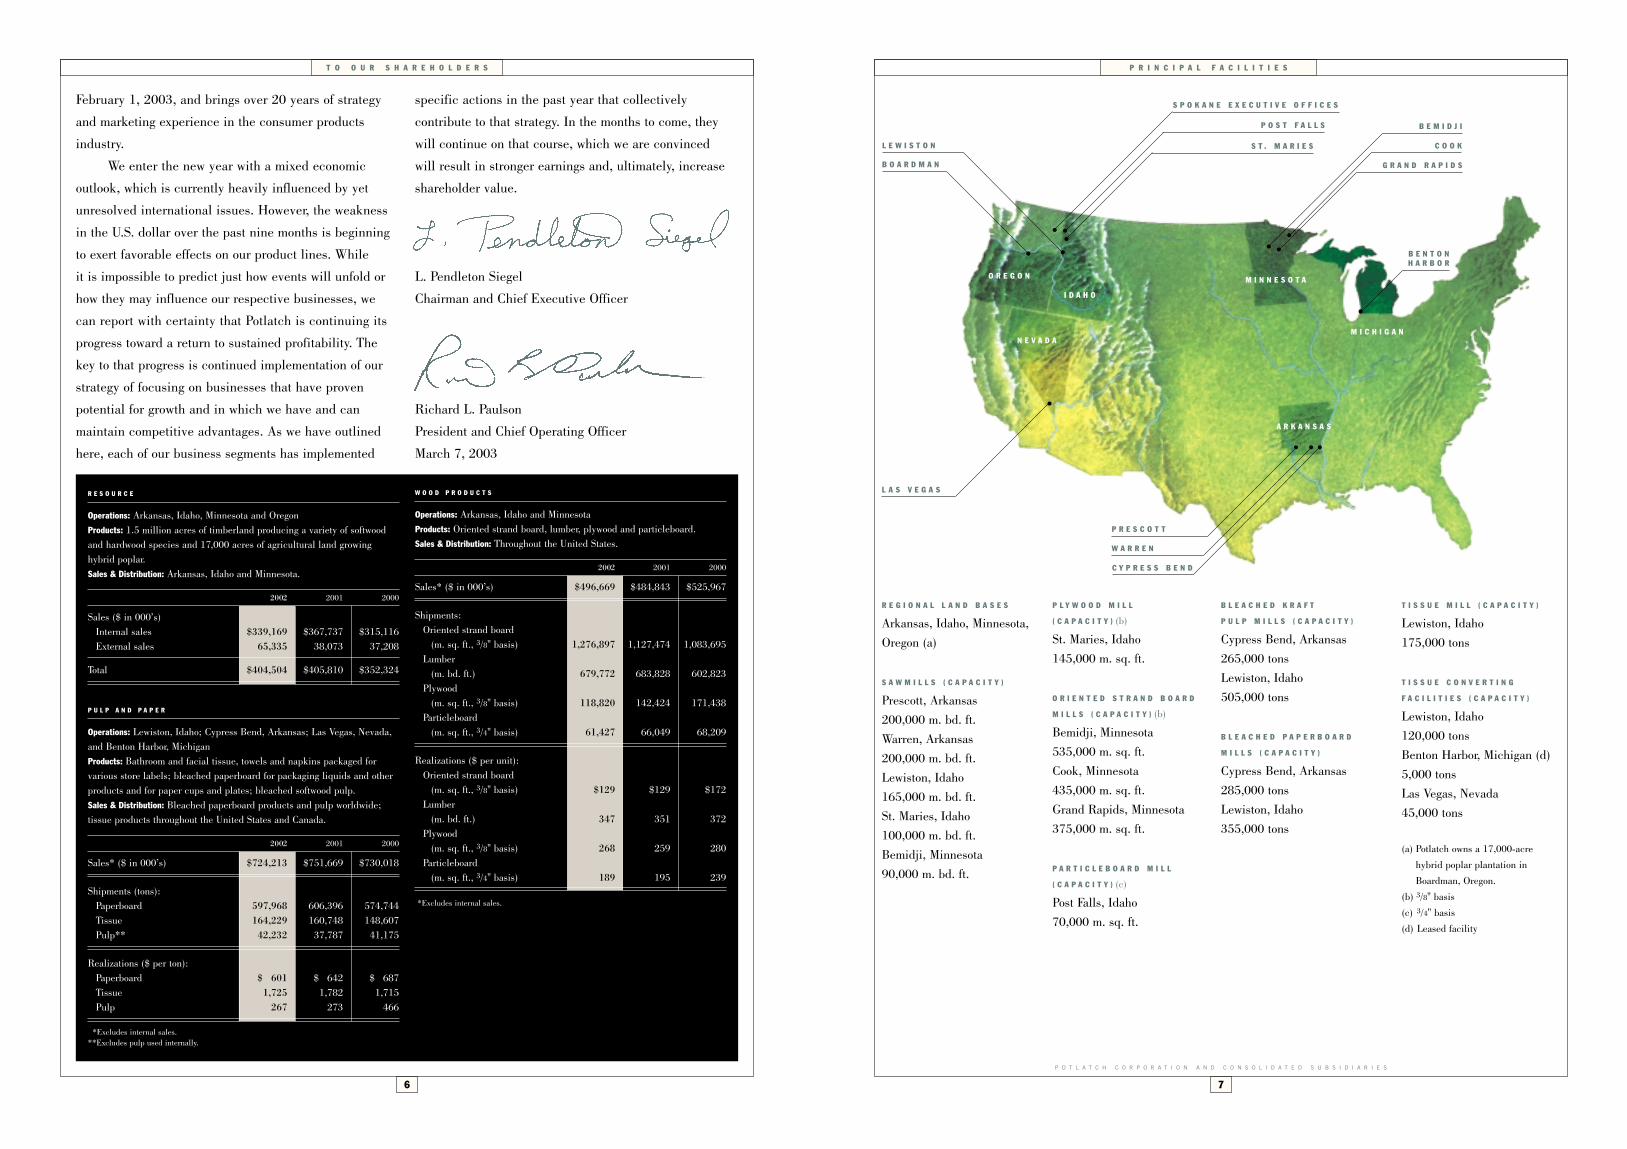
R E G I O N A L L A N D B A S E S
Arkansas, Idaho, Minnesota, Oregon (a)
S A W M I L L S ( C A P A C I T Y )
Prescott, Arkansas200,000 m. bd. ft.Warren, Arkansas200,000 m. bd. ft.Lewiston, Idaho165,000 m. bd. ft.St. Maries, Idaho100,000 m. bd. ft.Bemidji, Minnesota90,000 m. bd. ft.
P L Y W O O D M I L L
( C A P A C I T Y ) (b)
St. Maries, Idaho145,000 m. sq. ft.
O R I E N T E D S T R A N D B O A R D
M I L L S ( C A P A C I T Y ) (b)
Bemidji, Minnesota535,000 m. sq. ft.Cook, Minnesota435,000 m. sq. ft.Grand Rapids, Minnesota375,000 m. sq. ft.
P A R T I C L E B O A R D M I L L
( C A P A C I T Y ) (c)
Post Falls, Idaho70,000 m. sq. ft.
B L E A C H E D K R A F T
P U L P M I L L S ( C A P A C I T Y )
Cypress Bend, Arkansas265,000 tonsLewiston, Idaho505,000 tons
B L E A C H E D P A P E R B O A R D
M I L L S ( C A P A C I T Y )
Cypress Bend, Arkansas285,000 tonsLewiston, Idaho355,000 tons
T I S S U E M I L L ( C A P A C I T Y )
Lewiston, Idaho175,000 tons
T I S S U E C O N V E R T I N G
F A C I L I T I E S ( C A P A C I T Y )
Lewiston, Idaho120,000 tonsBenton Harbor, Michigan (d)5,000 tonsLas Vegas, Nevada45,000 tons
(a) Potlatch owns a 17,000-acre
hybrid poplar plantation in
Boardman, Oregon.
(b) 3/8" basis
(c) 3/4" basis
(d) Leased facility
A R K A N S A S
M I N N E S O T A
N E V A D A
I D A H O
O R E G O N
C Y P R E S S B E N D
W A R R E N
P R E S C O T T
G R A N D R A P I D S
C O O K
B E M I D J I
B O A R D M A N
S T . M A R I E S
P O S T F A L L S
L E W I S T O N
S P O K A N E E X E C U T I V E O F F I C E S
L A S V E G A S
M I C H I G A N
B E N T O N H A R B O R
T O O U R S H A R E H O L D E R S
February 1, 2003, and brings over 20 years of strategy
and marketing experience in the consumer products
industry.
We enter the new year with a mixed economic
outlook, which is currently heavily influenced by yet
unresolved international issues. However, the weakness
in the U.S. dollar over the past nine months is beginning
to exert favorable effects on our product lines. While
it is impossible to predict just how events will unfold or
how they may influence our respective businesses, we
can report with certainty that Potlatch is continuing its
progress toward a return to sustained profitability. The
key to that progress is continued implementation of our
strategy of focusing on businesses that have proven
potential for growth and in which we have and can
maintain competitive advantages. As we have outlined
here, each of our business segments has implemented
specific actions in the past year that collectively
contribute to that strategy. In the months to come, they
will continue on that course, which we are convinced
will result in stronger earnings and, ultimately, increase
shareholder value.
L. Pendleton Siegel
Chairman and Chief Executive Officer
Richard L. Paulson
President and Chief Operating Officer
March 7, 2003
6
R E S O U R C E
Operations: Arkansas, Idaho, Minnesota and OregonProducts: 1.5 million acres of timberland producing a variety of softwoodand hardwood species and 17,000 acres of agricultural land growinghybrid poplar.Sales & Distribution: Arkansas, Idaho and Minnesota.
2002 2001 2000
Sales ($ in 000’s) Internal sales $339,169 $367,737 $315,116External sales 65,335 38,073 37,208
Total $404,504 $405,810 $352,324
W O O D P R O D U C T S
Operations: Arkansas, Idaho and MinnesotaProducts: Oriented strand board, lumber, plywood and particleboard.Sales & Distribution: Throughout the United States.
2002 2001 2000
Sales* ($ in 000’s) $496,669 $484,843 $525,967
Shipments:Oriented strand board
(m. sq. ft., 3/8" basis) 1,276,897 1,127,474 1,083,695Lumber
(m. bd. ft.) 679,772 683,828 602,823Plywood
(m. sq. ft., 3/8" basis) 118,820 142,424 171,438Particleboard
(m. sq. ft., 3/4" basis) 61,427 66,049 68,209
Realizations ($ per unit):Oriented strand board
(m. sq. ft., 3/8" basis) $129 $129 $172Lumber
(m. bd. ft.) 347 351 372Plywood
(m. sq. ft., 3/8" basis) 268 259 280Particleboard
(m. sq. ft., 3/4" basis) 189 195 239
*Excludes internal sales.
P U L P A N D P A P E R
Operations: Lewiston, Idaho; Cypress Bend, Arkansas; Las Vegas, Nevada,and Benton Harbor, MichiganProducts: Bathroom and facial tissue, towels and napkins packaged for various store labels; bleached paperboard for packaging liquids and otherproducts and for paper cups and plates; bleached softwood pulp. Sales & Distribution: Bleached paperboard products and pulp worldwide; tissue products throughout the United States and Canada.
2002 2001 2000
Sales* ($ in 000’s) $724,213 $751,669 $730,018
Shipments (tons):Paperboard 597,968 606,396 574,744Tissue 164,229 160,748 148,607Pulp** 42,232 37,787 41,175
Realizations ($ per ton):Paperboard $ 601 $ 642 $ 687Tissue 1,725 1,782 1,715Pulp 267 273 466
*Excludes internal sales.**Excludes pulp used internally.

2 0 0 2 C A P A C I T I E S , P R O D U C T I O N A N D F I B E R F L O W
S O L I D W O O D C O N V E R T I N GL A N D B A S E S
1 S A W M I L L
Capacity: 90,000 m. bd. ft.Production: 88,000 m. bd. ft.3 O R I E N T E D S T R A N D
B O A R D M I L L S ( a )
Capacity: 1,345,000 m. sq. ft.Production: 1,282,000 m. sq. ft.C H I P S A L E S
24,000 tons
P U L P W O O D ( d )
Own: 112,000 tonsPurchased: 881,000 tonsP U L P W O O D S A L E S
246,000 tonsS A W T I M B E R / O S B L O G S
Own: 212,000 tonsPurchased: 2,226,000 tonsL O G S A L E S
5,000 tons
P U L P W O O D
Own: 170,000 tonsPurchased: 105,000 tonsP U L P W O O D S A L E S
61,000 tonsS A W T I M B E R
Own: 1,178,000 tonsPurchased: 287,000 tonsL O G S A L E S
306,000 tons
2 S A W M I L L S
Capacity: 265,000 m. bd. ft.Production: 246,000 m. bd. ft.1 P L Y W O O D
M I L L ( a )
Capacity: 145,000 m. sq. ft.Production: 123,000 m. sq. ft.1 P A R T I C L E B O A R D
M I L L ( b )
Capacity: 70,000 m. sq. ft.Production: 63,000 m. sq. ft.
P U L P W O O D F I B E R
Own: 51,000 cunits (c)Purchased: 32,000 cunits (c)
F I B E R F R O M M I L L S
Own: 84,000 cunits (c)Purchased: 21,000 cunits (c)P U R C H A S E D F I B E R
526,000 cunits (c)
P U L P W O O D F I B E R
Own: 50,000 cunits (c)Purchased: 253,000 cunits (c)
F I B E R F R O M M I L L S
Own: 11,000 cunits (c)Purchased: 23,000 cunits (c)P U R C H A S E D F I B E R
21,000 cunits (c)
2 S A W M I L L S
Capacity: 400,000 m. bd. ft.Production: 354,000 m. bd. ft.C H I P S A L E S
294,000 tons
P U L P W O O D
Own: 587,000 tonsPurchased: 821,000 tonsP U L P W O O D S A L E S
478,000 tonsS A W T I M B E R
Own: 722,000 tonsPurchased: 1,040,000 tonsL O G S A L E S
238,000 tons
M I N N E S O T A
330,000 acresAspen, jack pine, red pine, balsam fir
I D A H O
670,000 acresWestern white pine, white fir, red cedar, Douglas-fir, larch
A R K A N S A S
496,000 acresSouthern yellow pine, various fine hardwoods
8
P O T L A T C H C O R P O R A T I O N A N D C O N S O L I D A T E D S U B S I D I A R I E S
(a) 3/8" basis(b) 3/4" basis(c) One cunit equals
100 cubic feet ofsolid wood.
(d) Harvest amountsinclude tons usedby our Cloquet pulpmill, which was soldin May 2002.
Note: Fiber transfersrepresent quantities provided without con-sideration for changes in inventories.
P A P E R A N D P A P E R B O A R D M A N U F A C T U R I N G T I S S U E C O N V E R T I N GP U L P M A N U F A C T U R I N G
C Y P R E S S B E N D P U L P M I L L
Bleached kraft pulpCapacity: 265,000 tonsProduction: 263,000 tons
O W N P U L P
263,000 tons
C Y P R E S S B E N D P A P E R B O A R D
Bleached paperboardCapacity: 285,000 tonsProduction: 283,000 tons
L E W I S T O N P A P E R B O A R D
Bleached paperboardCapacity: 355,000 tonsProduction: 346,000 tonsL E W I S T O N T I S S U E
TissueCapacity: 175,000 tonsProduction: 174,000 tons
O W N T I S S U E
116,000 tonsP U R C H A S E D T I S S U E
14,000 tons
O W N T I S S U E
44,000 tonsP U R C H A S E D T I S S U E
2,000 tons
O W N T I S S U E
1,000 tonsP U R C H A S E D T I S S U E
2,000 tons
L E W I S T O N
Capacity: 120,000 tonsProduction: 119,000 tonsL A S V E G A S
Capacity: 45,000 tonsProduction: 42,000 tonsB E N T O N H A R B O R
Capacity: 5,000 tonsProduction: 3,000 tons
O W N P U L P
348,000 tons
O W N P U L P
99,000 tons
O W N W A S T E P A P E R
19,000 tonsP U R C H A S E D P U L P
62,000 tons
L E W I S T O N P U L P M I L L
Bleached kraft pulpCapacity: 505,000 tonsProduction: 505,000 tonsP U L P S A L E S
42,000 tons
P O T L A T C H C O R P O R A T I O N A N D C O N S O L I D A T E D S U B S I D I A R I E S
9
S E L E C T E D F I N A N C I A L D A T A
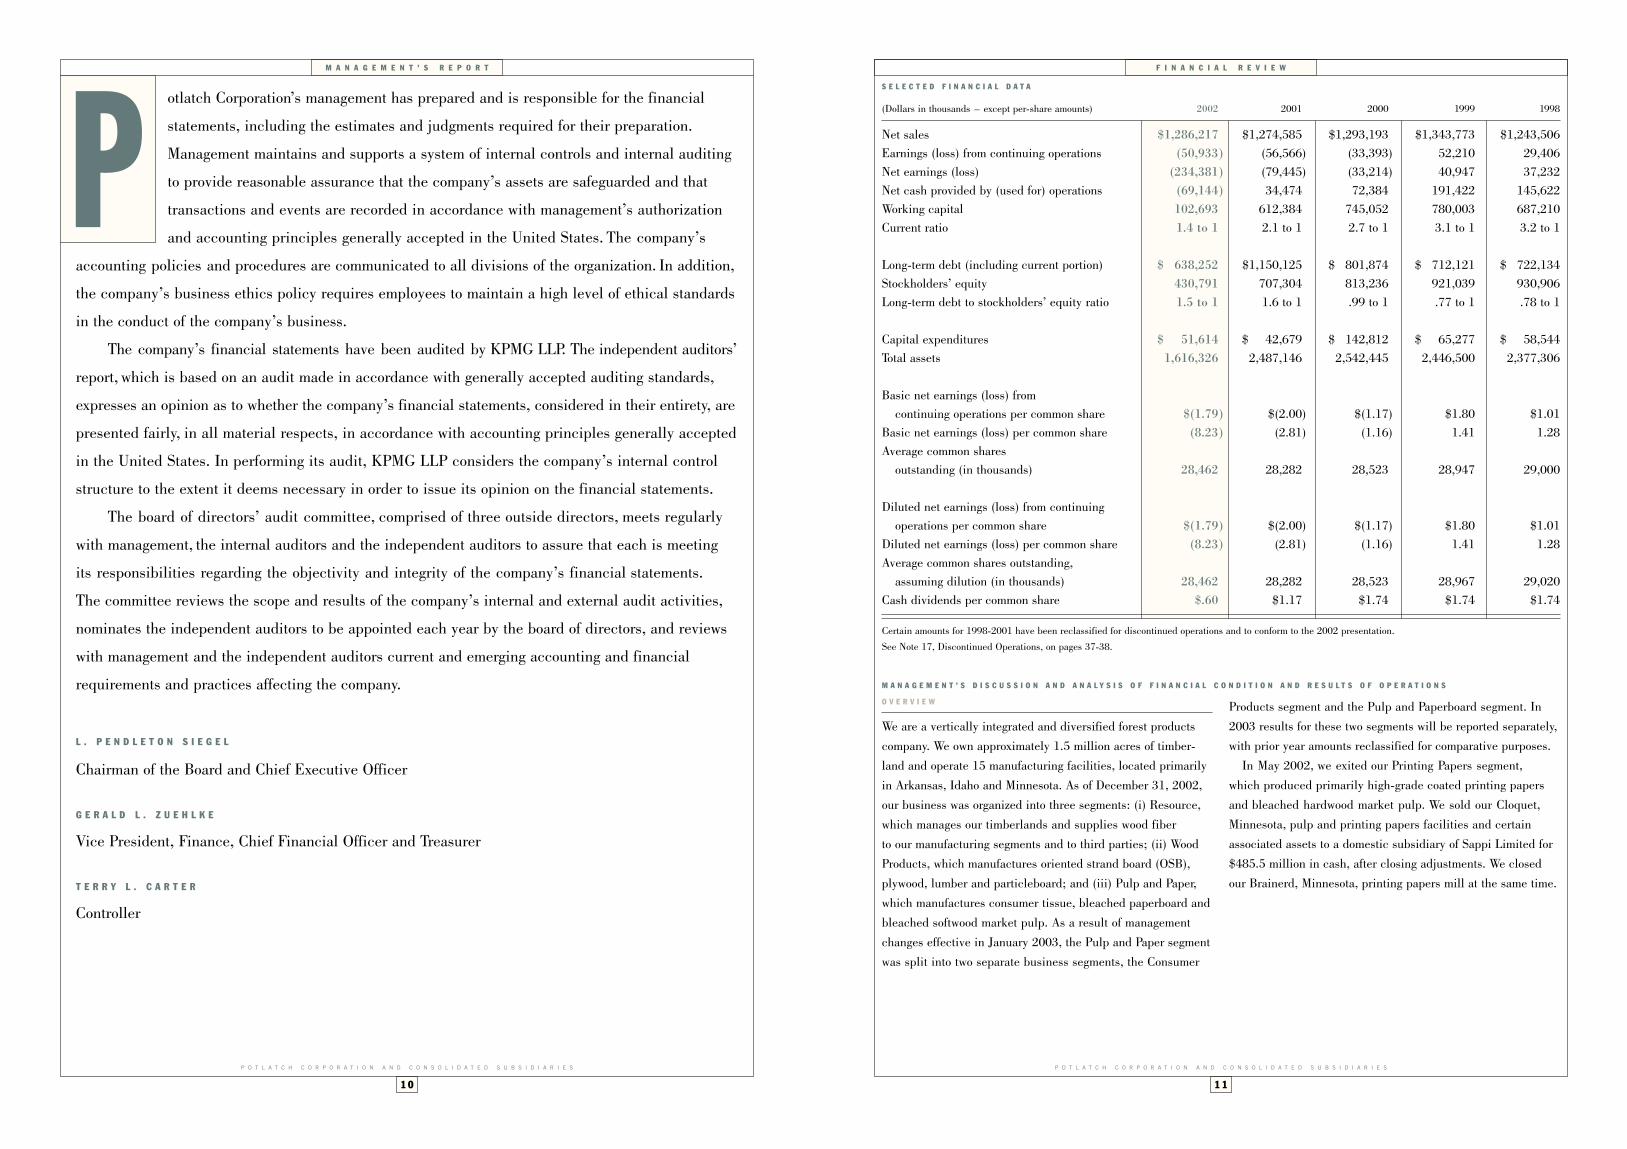
(Dollars in thousands – except per-share amounts) 2002 2001 2000 1999 1998
Net sales $1,286,217 $1,274,585 $1,293,193 $1,343,773 $1,243,506Earnings (loss) from continuing operations (50,933) (56,566) (33,393) 52,210 29,406Net earnings (loss) (234,381) (79,445) (33,214) 40,947 37,232Net cash provided by (used for) operations (69,144) 34,474 72,384 191,422 145,622Working capital 102,693 612,384 745,052 780,003 687,210Current ratio 1.4 to 1 2.1 to 1 2.7 to 1 3.1 to 1 3.2 to 1
Long-term debt (including current portion) $ 638,252 $1,150,125 $ 801,874 $ 712,121 $ 722,134Stockholders’ equity 430,791 707,304 813,236 921,039 930,906Long-term debt to stockholders’ equity ratio 1.5 to 1 1.6 to 1 .99 to 1 .77 to 1 .78 to 1
Capital expenditures $ 51,614 $ 42,679 $ 142,812 $ 65,277 $ 58,544Total assets 1,616,326 2,487,146 2,542,445 2,446,500 2,377,306
Basic net earnings (loss) from continuing operations per common share $(1.79) $(2.00) $(1.17) $1.80 $1.01
Basic net earnings (loss) per common share (8.23) (2.81) (1.16) 1.41 1.28Average common shares
outstanding (in thousands) 28,462 28,282 28,523 28,947 29,000
Diluted net earnings (loss) from continuing operations per common share $(1.79) $(2.00) $(1.17) $1.80 $1.01
Diluted net earnings (loss) per common share (8.23) (2.81) (1.16) 1.41 1.28Average common shares outstanding,
assuming dilution (in thousands) 28,462 28,282 28,523 28,967 29,020Cash dividends per common share $.60 $1.17 $1.74 $1.74 $1.74
Certain amounts for 1998-2001 have been reclassified for discontinued operations and to conform to the 2002 presentation.
See Note 17, Discontinued Operations, on pages 37-38.
M A N A G E M E N T ’ S R E P O R T
1 0
P O T L A T C H C O R P O R A T I O N A N D C O N S O L I D A T E D S U B S I D I A R I E S
otlatch Corporation’s management has prepared and is responsible for the financial
statements, including the estimates and judgments required for their preparation.
Management maintains and supports a system of internal controls and internal auditing
to provide reasonable assurance that the company’s assets are safeguarded and that
transactions and events are recorded in accordance with management’s authorization
and accounting principles generally accepted in the United States. The company’s
accounting policies and procedures are communicated to all divisions of the organization. In addition,
the company’s business ethics policy requires employees to maintain a high level of ethical standards
in the conduct of the company’s business.
The company’s financial statements have been audited by KPMG LLP. The independent auditors’
report, which is based on an audit made in accordance with generally accepted auditing standards,
expresses an opinion as to whether the company’s financial statements, considered in their entirety, are
presented fairly, in all material respects, in accordance with accounting principles generally accepted
in the United States. In performing its audit, KPMG LLP considers the company’s internal control
structure to the extent it deems necessary in order to issue its opinion on the financial statements.
The board of directors’ audit committee, comprised of three outside directors, meets regularly
with management, the internal auditors and the independent auditors to assure that each is meeting
its responsibilities regarding the objectivity and integrity of the company’s financial statements.
The committee reviews the scope and results of the company’s internal and external audit activities,
nominates the independent auditors to be appointed each year by the board of directors, and reviews
with management and the independent auditors current and emerging accounting and financial
requirements and practices affecting the company.
L . P E N D L E T O N S I E G E L
Chairman of the Board and Chief Executive Officer
G E R A L D L . Z U E H L K E
Vice President, Finance, Chief Financial Officer and Treasurer
T E R R Y L . C A R T E R
Controller
P
1 1
F I N A N C I A L R E V I E W
P O T L A T C H C O R P O R A T I O N A N D C O N S O L I D A T E D S U B S I D I A R I E S
M A N A G E M E N T ’ S D I S C U S S I O N A N D A N A L Y S I S O F F I N A N C I A L C O N D I T I O N A N D R E S U L T S O F O P E R A T I O N S
Products segment and the Pulp and Paperboard segment. In2003 results for these two segments will be reported separately,with prior year amounts reclassified for comparative purposes.
In May 2002, we exited our Printing Papers segment, which produced primarily high-grade coated printing papersand bleached hardwood market pulp. We sold our Cloquet,Minnesota, pulp and printing papers facilities and certain associated assets to a domestic subsidiary of Sappi Limited for$485.5 million in cash, after closing adjustments. We closedour Brainerd, Minnesota, printing papers mill at the same time.
O V E R V I E W
We are a vertically integrated and diversified forest productscompany. We own approximately 1.5 million acres of timber-land and operate 15 manufacturing facilities, located primarilyin Arkansas, Idaho and Minnesota. As of December 31, 2002,our business was organized into three segments: (i) Resource,which manages our timberlands and supplies wood fiber to our manufacturing segments and to third parties; (ii) WoodProducts, which manufactures oriented strand board (OSB),plywood, lumber and particleboard; and (iii) Pulp and Paper,which manufactures consumer tissue, bleached paperboard andbleached softwood market pulp. As a result of managementchanges effective in January 2003, the Pulp and Paper segmentwas split into two separate business segments, the Consumer

1 3
F I N A N C I A L R E V I E W
P O T L A T C H C O R P O R A T I O N A N D C O N S O L I D A T E D S U B S I D I A R I E S
1 2
P O T L A T C H C O R P O R A T I O N A N D C O N S O L I D A T E D S U B S I D I A R I E S
F I N A N C I A L R E V I E W
Our operating results generally reflect the cyclical pattern of the forest products industry. Historical prices for our productshave been volatile, and we, like other manufacturers in the forest products industry, have limited direct influence over thetiming and extent of price changes for our products. Productpricing is significantly affected by the relationship betweensupply and demand in the forest products industry. Productsupply is influenced primarily by fluctuations in available manufacturing capacity. Demand is affected by the state of theeconomy in general and a variety of other factors. The demandfor our timber resources and wood products is affected by thelevel of new residential construction activity and, to a lesserextent, home repair and remodeling activity, which are subjectto fluctuations due to changes in economic conditions, interestrates, population growth, weather conditions and other factors.The demand for most of our pulp and paper products is pri-marily affected by the general state of the global economy, andthe economies in North America and east Asia in particular.
The markets for our products are highly competitive andcompanies that have substantially greater financial resourcesthan we do compete with us in each of our markets. Our woodproducts are subject to competition from manufacturers inNorth and South America. In addition, our pulp-based products,other than tissue products, are globally traded commodity products. Because our competitors are located throughout theworld, variations in exchange rates between the U.S. dollar andother currencies significantly affect our competitive positioncompared to our international competitors. In addition, ourindustry is capital intensive, which leads to high fixed costsand generally results in continued production as long as pricesare sufficient to cover variable costs. These conditions havecontributed to substantial price competition, particularly during periods of reduced demand. Some of our competitors are currently lower-cost producers in some of the businesses in which we operate, and accordingly these competitors may be less adversely affected than we are by price decreases.
Energy has become one of our most volatile operating expenses over the past several years. Substantial price increases commenced in late 2000 and continued in the first half of 2001,before moderating in the second half of 2001. These priceincreases were substantial and contributed to the net losses weincurred during these periods. Energy prices returned to morenormal historical levels in 2002, which had a favorable effecton our results compared to 2001. In periods of high energy prices,market conditions may prevent us from passing higher energycosts on to our customers through price increases and therefore
could adversely affect our operating results. We have takensteps through conservation and electrical production to reduceour exposure to the volatile spot market for energy. Our energycosts in future periods will depend principally on our ability tocontinue to produce internally a substantial portion of our elec-tricity needs and on changes in market prices for natural gas.
Another significant expense is the cost of wood fiber neededto supply our manufacturing facilities. Our timberlands providedapproximately 52% of log requirements for our sawmill and plywood manufacturing facilities in 2002 and an average ofapproximately 63% over the past five calendar years, afteradjustment for our exit from the hardwood lumber business.Including logs used for pulp and OSB, the percentages of ourfiber requirements supplied by our timberlands were approxi-mately 30% in 2002 and an average of approximately 38% over the past five calendar years, adjusted for our exit from theprinting papers and hardwood lumber businesses. The percent-age of our wood fiber requirements supplied by our timberlandswill fluctuate based on a variety of factors, including changes in our timber harvest levels, changes in our manufacturingcapacity and changes in the amount of timber sales to third parties. The cost of various types of wood fiber that we purchasein the market has at times fluctuated greatly because of eco-nomic or industry conditions. Selling prices of our products have not always increased in response to wood fiber price increasesnor have wood fiber prices always decreased in conjunction withdeclining product prices. On occasion, our results of operationshave been and may in the future be adversely affected if we are unable to pass cost increases through to our customers.
Finally, changes in our manufacturing capacity, primarily as a result of capital spending programs or asset dispositions, havesignificantly affected our results of operations in recent periods.In September 2000, we closed our plywood mill in Jaype, Idaho,as a result of poor plywood markets, lack of adequate raw materials and long-term transportation concerns. In January2001, we completed a modernization and expansion of our OSB mill in Cook, Minnesota, which resulted in an increase in annual production capacity from 250.0 million square feet to 435.0 million square feet. In May 2002, we sold a majority of our Printing Papers segment assets to a domestic subsidiary of Sappi Limited and exited the printing papers business. InAugust 2002, we sold a hardwood sawmill in Arkansas and exited
M A N A G E M E N T ’ S D I S C U S S I O N A N D A N A L Y S I S O F F I N A N C I A L
C O N D I T I O N A N D R E S U L T S O F O P E R A T I O N S ( C O N T I N U E D )
In late October 2002 we entered into a memorandum of under-standing with a buyer for the sale of the Brainerd facility. Thefacility was sold on February 28, 2003, for $4.44 million in cash.The sale of the printing papers business reflects a strategicrealignment to focus on our natural resources, wood productsand consumer tissue businesses, which we believe have thegreatest potential for growth.
In June 2002, we announced that we would close ourBradley hardwood mill in Warren, Arkansas, and exit the hard-wood lumber business. We sold the facility in August 2002.
For the year 2002, the Printing Papers segment and theBradley hardwood mill have been accounted for and reported as discontinued operations. Our consolidated financial state-ments and this discussion reflect the reclassification of theseoperations as discontinued operations for all periods presented.
C R I T I C A L A C C O U N T I N G P O L I C I E S
Our principal accounting policies are discussed on pages 26-28of this Annual Report. The preparation of financial statementsin accordance with accounting principles generally accepted in the United States of America requires management to makeestimates and assumptions that affect the reported financialposition and operating results of the company. Managementbelieves the accounting policies discussed below represent the most complex, difficult and subjective judgments it makesin this regard.L O N G - L I V E D A S S E T S . We account for long-lived assets inaccordance with Financial Accounting Standards Board (FASB)Statement No. 144. The Statement requires that long-livedassets be reviewed for impairment whenever events or changesin circumstances indicate that the carrying amount of an asset may not be recoverable. The test for impairment requiresmanagement to estimate future cash flows, which can differmaterially from actual future results based upon many factors,including but not limited to changes in economic conditions,environmental requirements, and capital spending.
R E S T R U C T U R I N G A N D O T H E R C H A R G E S . In 2000, 2001 and2002 we recorded charges for the restructuring of our salariedworkforce, the closure of a plywood manufacturing plant and thereduction of the hourly workforce at another site. In May 2002we also completed the sale of a majority of the assets of ourPrinting Papers segment and closed a printing papers facility in Brainerd, Minnesota. In July 2002 we closed a hardwoodlumber mill in Warren, Arkansas. The mill was sold in August2002. These events required us to record estimates of liabilitiesfor employee benefits, demolition, environmental clean-up and other costs at the time of the event, and these estimated liabilities could differ materially from actual costs incurred. E N V I R O N M E N T A L L I A B I L I T I E S . We record accruals for estimated environmental liabilities in accordance with FASBStatement No. 5. These estimates reflect assumptions and judgments as to the probable nature, magnitude and timing ofrequired investigation, remediation and monitoring activities.Due to the numerous uncertainties and variables associatedwith these assumptions and judgments, and changes in govern-mental regulations and environmental technologies, our accrualsare subject to substantial uncertainties and our actual costscould be materially more or less than the estimated amounts.P E N S I O N A N D P O S T R E T I R E M E N T B E N E F I T S . Substantiallyall of our employees are covered by noncontributory definedbenefit pension plans, and certain salaried and hourly employeesare covered by company-sponsored defined benefit retireehealth care and life insurance plans. The cost of these plans isaccounted for in accordance with FASB Statement Numbers 87,106 and 132. These Statements require assumptions regardingdiscount rates and asset returns and, with respect to the post-retirement benefits plans, assumptions regarding medical costtrends. Actual asset returns and medical costs which are morefavorable than our assumptions can have the effect of loweringour expense and cash contributions, and conversely, actualresults which are less favorable than our assumptions couldincrease our expense and cash contributions.
F A C T O R S I N F L U E N C I N G O U R R E S U L T S O F O P E R A T I O N S
Our operating results have been and will continue to be influenced by a variety of factors, including the cyclical natureof the forest products industry, competition, the efficiency andlevel of capacity utilization of our manufacturing operations,changes in our principal expenses, such as wood fiber andenergy costs, changes in the production capacity of our manu-facturing operations as a result of major capital spending projects, asset dispositions or acquisitions and other factors.
1 5
F I N A N C I A L R E V I E W
P O T L A T C H C O R P O R A T I O N A N D C O N S O L I D A T E D S U B S I D I A R I E S
1 4
P O T L A T C H C O R P O R A T I O N A N D C O N S O L I D A T E D S U B S I D I A R I E S
F I N A N C I A L R E V I E W
• In December 2001, we reversed $1.8 million of an $18.5million pre-tax charge, taken in September 2000, for costsassociated with the closure of our Jaype, Idaho, plywoodmill. Our initial estimate of the cost to close the mill included expected costs for some aspects of maintenance and demolition that were not incurred.Interest expense was $59.9 million for the year ended
December 31, 2002, substantially less than the $77.9 millioncharged against income in 2001. The decrease reflected our net reduction of over $470 million of debt during 2002.
We incurred one-time, pre-tax costs of $15.4 million during 2002 related to our early retirement of over $380 million of outstanding debt. These costs included cash fees and premiums of $10.6 million and the non-cash write-off of related debt financing costs totaling $4.8 million.
For the year ended December 31, 2002, “Other income,net” totaled $15.2 million, compared to expense of $2.2 million in 2001. The 2002 amount was largely due to gainsfrom the sale of nonstrategic timberland and other surplus land sales, interest income and recreational fee income. The2001 amount included an $11.1 million charge for the cost of equipment removed from service and deferred litigationcosts associated with our lawsuit against Beloit Corporation.Interest income of $2.6 million and gains from asset sales of $3.9 million partially offset the charge.
For the year ended December 31, 2002, we recorded anincome tax benefit of $32.6 million, reflecting our net loss from continuing operations before taxes, based on an estimatedtax rate of 39%. For the year ended December 31, 2001, werecorded an income tax benefit of $36.2 million, also reflectinga tax rate of 39%.
We recorded a net loss from continuing operations of $50.9million for the year ended December 31, 2002, compared to a net loss from continuing operations of $56.6 million for theyear ended December 31, 2001.
We incurred a pre-tax loss on our discontinued operations of$300.7 million in 2002. The discontinued operations includedour former Printing Papers segment and a hardwood sawmill.Included in the amount was $276.2 million for loss on the disposition of the properties and $24.5 million in operationallosses. In 2001 these operations incurred pre-tax losses of$37.5 million.
Our net loss for 2002 was $234.4 million, compared to $79.4million in 2001. The unfavorable comparison was due to recog-nition of the substantial charge for our discontinued operations.
In December, as a result of market declines in our pensionassets in the second half of 2002 and a reduction in the discount rate from 7.25% to 6.75%, we recorded in “Othercomprehensive loss” an adjustment for a minimum pension liability totaling $33.2 million, after tax. The charge is reflectedin the Balance Sheets as an adjustment to Stockholders’ equity.We do not expect pension contributions or expense in 2003 tobe materially affected by the charge or discount rate change.D I S C U S S I O N O F B U S I N E S S S E G M E N T S
The Resource segment reported operating income of $62.6 million for the year ended December 31, 2002, up from$55.3 million reported in 2001. Segment net sales were $404.5 million, compared to $405.8 million in 2001. A decreasein internal net sales was largely offset by increased net salesrealizations and higher sales volumes to third parties in Idaho,Minnesota and Arkansas. Resource segment expenses decreased2% to $342.0 million in 2002, compared to $350.5 million in2001. Decreased purchases of residual fiber reduced costs butwere partially offset by increased logging costs.
The Wood Products segment incurred an operating loss of$27.0 million for the year ended December 31, 2002, comparedto an operating loss of $26.6 million incurred in 2001. Marketconditions were difficult for our wood products due to theindustry’s oversupply position, which persisted throughout theyear, despite a positive new home construction environment.Foreign imports continued to affect pricing during all of 2002,even after imposition of a U.S. duty on Canadian productsbeginning in May. Net sales for the segment were $509.2 million, slightly higher compared to $502.3 million reported in 2001. Net sales of oriented strand board increased 12% in2002, to $187.3 million, due to a 13% increase in shipments.A small decrease in lumber shipments, combined with slightlylower net sales realizations, resulted in a net sales decrease to $249.8 million from $251.9 million in 2001. Net sales ofplywood decreased 14% to $34.9 million. Plywood shipmentswere down 17%, due in large part to lower production in 2002compared to 2001. Production was higher in 2001 due to extrashifts above the normal operating schedule at our St. Maries,Idaho, mill. Net sales of particleboard were $14.1 million, com-pared to $15.8 million in 2001. Expenses were $536.2 millionfor the segment in 2002, compared to $528.9 million in 2001.Higher wood fiber costs were partially offset by small declines
M A N A G E M E N T ’ S D I S C U S S I O N A N D A N A L Y S I S O F F I N A N C I A L
C O N D I T I O N A N D R E S U L T S O F O P E R A T I O N S ( C O N T I N U E D )
the hardwood lumber business. We are currently in the processof constructing a tissue machine in Las Vegas, Nevada, whichwe anticipate will increase our tissue-making capacity by 30,000tons a year when completed in early 2004. Each of these changeshas affected or will affect our levels of net sales and expenses,as well as the comparability of our operating results from periodto period. Additionally, the profitability of our manufacturingsegments depends largely on our ability to operate our manu-facturing facilities efficiently and at or near full capacity. Our operating results would be adversely affected if market demanddoes not justify operating at these levels or if our operations are inefficient or suffer significant interruption for any reason.
R E S U L T S O F O P E R A T I O N S
At December 31, 2002, our business was organized into threereporting segments: Resource, Wood Products, and Pulp andPaper. Sales or transfers between segments are recorded asintersegment sales based on prevailing market prices. Becauseof the role of the Resource segment in supplying our manufac-turing segments with wood fiber, intersegment sales represent a significant portion of the Resource segment’s total net sales.Intersegment sales represent a substantially lower percentage of net sales for our other segments.
In the period-to-period discussion of our results of operationsbelow, when we discuss our consolidated net sales, contributionsby each of the segments to our net sales are reported after elimi-nation of intersegment sales. In the “Discussion of BusinessSegments” sections below, each segment’s net sales are set forthbefore elimination of intersegment sales. Additionally, in discuss-ing our operating results we refer to net sales realizations, whichfor each product line are calculated by subtracting freight fromnet sales and then dividing the result by relevant quantities ofthe product shipped for the period. We believe net sales realiza-tions are helpful in showing trends in the pricing of our products.
Y E A R E N D E D D E C E M B E R 3 1 , 2 0 0 2
C O M P A R E D T O Y E A R E N D E D D E C E M B E R 3 1 , 2 0 0 1
Net sales of $1,286.2 million for the year ended December 31,2002, were slightly higher compared to net sales of $1,274.6million recorded for the year ended December 31, 2001.Increases in Resource and Wood Product segment net sales of $27.3 million and $11.8 million, respectively, were partially
offset by a decrease in net sales for the Pulp and Paper segment of $27.5 million. Resource sales were greater due to increased sales to external customers, while Wood Productsnet sales increased as a result of an increase in OSB net sales.The decrease in net sales for Pulp and Paper was primarily due to lower net sales for paperboard.
Expenses for depreciation, amortization and cost of fee timber harvested were $115.5 million for the year endedDecember 31, 2002, an increase of $.5 million from the prioryear amount of $115.0 million.
For the year ended December 31, 2002, materials, labor and other operating expenses increased $18.9 million or 2% to $1,102.1 million from $1,083.1 million in 2001. Repair and maintenance expense and wood fiber costs were higher in 2002, but were partially offset by lower energy costs.
Selling, general and administrative expenses totaled $83.2million for the year ended December 31, 2002, compared to 2001’s expense of $86.3 million. The change was primarilydue to bad debt expense incurred in 2001 as a result of a $2.2 million charge related to the insolvency of a pulp broker.In 2002, we expensed the remaining balance due from the pulp broker, totaling $.8 million, after it was determined thatcollection was not reasonably likely to occur. In addition, bank fees were lower in 2002 versus 2001.
The following three charges were included in the “Restruc-turing and other charges” line in the Statements of Operations:• In 2002 we recorded a $9.0 million pre-tax charge for costs
associated with the elimination of 106 salaried productionand administrative positions. We expect to record an addi-tional $.4 million during the first half of 2003 for costs related to terminated employees whose services have beenretained beyond the initial 60-day period following theannounced job elimination, as required by Statement ofFinancial Accounting Standards (SFAS) No. 146. As ofDecember 31, 2002, 82 employees had been terminated,three had assumed other positions within the company as aresult of job openings, and 21 were scheduled for terminationin the first half of 2003. We expect to pay all material costsrelated to the reduction by the end of the first half of 2003.
• In March 2001, we recorded a $4.2 million pre-tax chargeassociated with a workforce reduction plan at our pulp,paperboard and consumer products operations in Idaho. In September 2001, an additional $.4 million pre-tax charge was recorded as a result of final cost determinationsfor pension and medical benefits. The plan permanentlyreduced the workforce by 124 hourly production and maintenance positions. As of December 31, 2001, all material costs associated with the plan had been incurred.

1 7
F I N A N C I A L R E V I E W
P O T L A T C H C O R P O R A T I O N A N D C O N S O L I D A T E D S U B S I D I A R I E S
1 6
P O T L A T C H C O R P O R A T I O N A N D C O N S O L I D A T E D S U B S I D I A R I E S
F I N A N C I A L R E V I E W
December 31, 2001, $27.0 million had been recordedagainst the accrued liability associated with the charge. All remaining costs associated with the workforce reductionprogram were paid in the first half of 2002.
• In September 2000, we recorded an $18.5 million pre-taxcharge for costs associated with the closure of our Jaype,Idaho, plywood mill. As of December 31, 2000, five salariedand 200 hourly production and maintenance employees hadbeen terminated due to the closure. As of December 31, 2001,a total of five salaried and 207 hourly production and mainte-nance employees had been terminated due to the closure. As of December 31, 2001, $16.5 million had been recordedagainst the accrued liability associated with the charge, whichrepresented all material costs we expect to incur. Our initialestimate of the cost to close the mill included expected costsfor some aspects of maintenance and demolition that were not incurred. As a result, in December 2001 we reversed $1.8 million of the liability and recorded it as income.Interest expense was $77.9 million for the year ended
December 31, 2001, a substantial increase compared to the$59.4 million charged against income in 2000. The increasereflected greater indebtedness in 2001 as well as a higher overall weighted average interest rate on our outstanding debt.
For the year ended December 31, 2001, “Other expense, net” totaled $2.2 million, compared to expense of $3.0 millionin 2000. The 2001 amount included an $11.1 million charge for the cost of equipment removed from service and deferred litigation costs associated with our lawsuit against BeloitCorporation, which were determined to be uncollectable due to a reduction in the value of assets available for distribution to unsecured creditors. Interest income of $2.6 million andgains from asset sales of $3.9 million partially offset the charge.
For the year ended December 31, 2001, we recorded anincome tax benefit of $36.2 million, reflecting our net loss fromcontinuing operations before taxes, based on an estimated taxrate of 39%. For the year ended December 31, 2000, we record-ed a benefit of $21.3 million, also reflecting a tax rate of 39%.
We recorded a net loss from continuing operations of $56.6million for the year ended December 31, 2001, compared to a net loss from continuing operations of $33.4 million for theyear ended December 31, 2000.
We incurred a pre-tax loss on our discontinued operations of $37.5 million in 2001, compared to income of $.3 million in 2000. Discontinued operations included our former PrintingPapers segment and a hardwood sawmill.
Our net loss, including discontinued operations, for 2001was $79.4 million, compared to $33.2 million in 2000.
D I S C U S S I O N O F B U S I N E S S S E G M E N T S
The Resource segment reported operating income of $55.3 million for the year ended December 31, 2001, lowerthan the $61.4 million reported in 2000. Segment net salesincreased to $405.8 million, compared to $352.3 million in2000. The increase in net sales was due to increased wood fibersales to our other operating segments in Arkansas, Idaho andMinnesota. Most of the increased volume was procured from outside sources and resold internally. Expenses for the Resourcesegment were $350.5 million in 2001, greater than the $290.9 million recorded in 2000 due to increased outside woodpurchases and higher production costs.
The Wood Products segment’s operating loss of $26.6 millionfor the year ended December 31, 2001, was greater than theoperating loss of $17.0 million incurred in 2000, which includ-ed an $18.5 million pre-tax charge related to the closure of our Jaype, Idaho, plywood mill. Difficult market conditions prevailed throughout 2001 and worsened in the fourth quarter,necessitating extended shutdowns during the holiday period atmost of the segment’s mills, adversely affecting earnings. Netsales for the segment were $502.3 million, compared to $538.9million reported in 2000. A decline in net sales realizations for all of the segment’s product lines was largely responsible for the sales decrease. Net sales of oriented strand boarddecreased 20% in 2001 to $167.2 million, net sales of plywooddecreased 21% to $40.5 million, and net sales of particleboarddecreased 19% to $15.8 million. An increased volume of shipments offset lower net sales realizations for lumber, as net sales increased to $251.9 million from $232.1 million in2000. Expenses were $528.9 million for the segment in 2001,compared to $555.9 million in 2000. Wood fiber and energycosts increased in 2001, but overall expenses were lower due to the absence of operating costs related to the Jaype, Idaho,plywood mill, which we closed in September 2000.
The Pulp and Paper segment incurred an operating loss of$14.5 million in 2001, versus operating income of $12.9 millionin 2000. Segment net sales increased to $751.7 million for2001, compared to $730.1 million in 2000. The increase wasdue to a $35.1 million increase in tissue product net sales.Tissue product shipments were 8% higher, and net sales realiza-tions increased 4% compared to the 2000 period. A $7.5 milliondecline in pulp net sales, due to an 8% decrease in shipmentsand a 41% decrease in net sales realizations, partially offset theincrease in tissue product net sales. Market-related downtime
M A N A G E M E N T ’ S D I S C U S S I O N A N D A N A L Y S I S O F F I N A N C I A L
C O N D I T I O N A N D R E S U L T S O F O P E R A T I O N S ( C O N T I N U E D )
in energy and labor costs. Wood fiber costs were higher due in large part to the full year’s operation of the Cook, Minnesota,oriented strand board mill. The mill was shut down for a portionof the first quarter of 2001 to complete a modernization andexpansion project.
The Pulp and Paper segment reported a slight loss of lessthan $.1 million in 2002, versus an operating loss of $14.5 million in 2001. Segment net sales decreased to $725.4 millionfor 2002, compared to $751.7 million in 2001. The decreasewas due to lower net sales realizations for paperboard and tissue, combined with a decrease in paperboard shipments.Paperboard net sales declined 6% to $395.1 million from$420.6 million in 2001 due to a 6% decline in net sales realizations. The markets for paperboard reflected the difficultgeneral economic conditions in 2002, as well as increasedcompetition from international producers of paperboard.Consumer tissue product net sales realizations were down 3%,resulting in a decline in 2002 net sales to $315.7 million from$317.7 million in 2001. A $1.2 million increase in pulp netsales, due to a 12% increase in shipments, partially offset thedecrease in paperboard and tissue net sales. Segment expenseswere $725.4 million in 2002, compared to $766.2 million in2001. Energy expense was significantly lower in 2002 butwas partially offset by higher repair and maintenance expenseand wood fiber costs. Repair and maintenance expense washigher due to a scheduled major maintenance shutdown at theCypress Bend, Arkansas, pulp and paperboard mill and some equipment improvements at the Lewiston, Idaho, pulpand paperboard mill. Included in expenses for 2001 was an $11.1 million charge related to our Beloit Corporation lawsuitand bad debt expense of $2.2 million related to the pulp broker insolvency.
Y E A R E N D E D D E C E M B E R 3 1 , 2 0 0 1
C O M P A R E D T O Y E A R E N D E D D E C E M B E R 3 1 , 2 0 0 0
Net sales of $1,274.6 million for the year ended December 31,2001, were slightly less than net sales of $1,293.2 millionrecorded for the year ended December 31, 2000. The decreasewas largely due to a decrease in net sales for the WoodProducts segment. Net sales for Wood Products fell by $41.1million, as a result of net sales decreases in OSB, plywood and
particleboard. The decrease in net sales for the segment waspartially offset by an increase in net sales for the Pulp andPaper segment, which benefited from increased net sales of tissue products. Pulp and Paper segment net sales increased by $21.7 million in 2001. Resource segment net sales were$38.1 million, comparable to 2000’s $37.2 million.
Expenses for depreciation, amortization and cost of fee timber harvested were $115.0 million for the year endedDecember 31, 2001, an increase of $6.3 million from the prioryear amount of $108.7 million. The increase was primarily due to increased amortization expense as a result of our debtrefinancing activities during the second quarter of 2001 andincreased depreciation in the Wood Products segment related to the Cook OSB mill.
For the year ended December 31, 2001, materials, labor andother operating expenses rose by 4% to $1,083.1 million from$1,044.9 million in 2000. An increase in the overall volume of product shipments in 2001 and higher energy costs werelargely responsible for the increase. Energy costs were $14.6million higher in 2001, and included a $1.2 million net chargefor fair value adjustments to natural gas derivative hedging contracts used during the year.
Selling, general and administrative expenses totaled $86.3million for the year ended December 31, 2001, a slight increasefrom 2000’s expense of $85.5 million. The increase was pri-marily due to increased bad debt expense incurred in 2001 as a result of a $2.2 million charge related to the insolvency of apulp broker, and was partially offset by cost savings from thereduction in our salaried workforce in June 2000 and a declinein selling expenses related to our consumer tissue products.
The following three charges were included in the “Restruc-turing and other charges” line in the Statements of Operations:• In March 2001, we recorded a $4.2 million pre-tax charge
associated with a workforce reduction plan at our pulp,paperboard and consumer products operations in Idaho. In September 2001, an additional $.4 million pre-tax chargewas recorded as a result of final cost determinations for pension and medical benefits. The plan permanently reducedthe workforce by 124 hourly production and maintenancepositions. As of December 31, 2001, all material costs associated with the plan had been incurred.
• In 2000, we recorded a $27.9 million pre-tax charge to covercosts associated with a company-wide reduction and reorgan-ization of our salaried production and administrative work-force. In establishing the initial liability, we estimated 261employees would be terminated. As of December 31, 2001and 2000, a total of 273 employees had been terminatedunder the reduction and reorganization plan. As of

1 9
F I N A N C I A L R E V I E W
P O T L A T C H C O R P O R A T I O N A N D C O N S O L I D A T E D S U B S I D I A R I E S
1 8
P O T L A T C H C O R P O R A T I O N A N D C O N S O L I D A T E D S U B S I D I A R I E S
F I N A N C I A L R E V I E W
due to the acquisition of environmental permits, acquisition ofequipment, engineering, weather and other factors.
Net cash used for financing totaled $484.0 million in 2002,compared to cash provided by financing of $84.2 million in2001 and $73.8 million in 2000. The majority of cash used in 2002 was for the retirement of $511.9 million of long-termdebt. As discussed above, we used restricted cash to repay our $100 million 6.25% Debentures, and we retired other debtusing proceeds from asset sales. Notes payable increased $40.0million, partially offsetting cash used for debt payments. Theincrease in cash provided by financing in 2001 compared to2000 was due primarily to our debt restructuring completed inJune 2001 in which we issued $450.0 million of debt, partiallyoffset by debt repayments of $101.7 million and repayment of $188.9 million of notes payable. We also purchased lesstreasury stock in 2001, spending $10.5 million versus $25.9million in 2000. In addition, our dividend payments declinedsubstantially in 2001, to $33.1 million from $49.7 million paid in 2000, largely as a result of a dividend rate reductionannounced in August 2001.
Cash from discontinued operations in 2002 totaled $488.9million, most of which was cash received from the sale of ourPrinting Papers segment assets and the sale of our hardwoodsawmill in Arkansas. In connection with the sale of our PrintingPapers segment assets in May 2002, we were required underthe terms of our bank credit facility to use the proceeds to repay$198.5 million under the term loan portion of our bank creditfacility, and all outstanding debt under our revolving credit lineat the date of sale, totaling $33.2 million. We also used a portionof the proceeds to retire approximately $164.9 million of addi-tional debt. The discontinued operations generated cash of$42.9 million in 2001 and used cash of $4.2 million in 2000.These amounts were generally the result of the normal operatingactivities of the discontinued operations during 2001 and 2000.
Our current bank credit facility is comprised of a three-yearrevolving line of credit of up to $150.0 million that expiresJune 28, 2004, including a $70.0 million subfacility for lettersof credit, usage of which reduces availability under the revolv-ing line of credit. Our obligations under the bank credit facilityare secured by our accounts receivable and inventory. As ofDecember 31, 2002, $40.0 million was outstanding under therevolving line of credit and approximately $36.1 million of therevolving line of credit was used to support outstanding lettersof credit. In December 2002 we converted $36.1 million of ourfloating rate municipal bonds to fixed-rate bonds, and retiredthe remaining $17.8 million of our floating rate municipalbonds. As a result, we cancelled the related letters of creditunder the bank credit facility. During the third and fourth
M A N A G E M E N T ’ S D I S C U S S I O N A N D A N A L Y S I S O F F I N A N C I A L
C O N D I T I O N A N D R E S U L T S O F O P E R A T I O N S ( C O N T I N U E D )
quarters of 2002, we negotiated amendments to our bank credit facility, which, among other changes, included reductionof commitments from $200 million to $150 million, approval of the conversion of our floating rate municipal bonds to fixed-rate bonds and revisions to certain financial covenants.
Both the agreement governing our credit facility and theindenture governing our $250 million 10% senior subordinatednotes contain certain covenants that, among other things,restrict our ability and our subsidiaries’ ability to create liens,merge or consolidate, dispose of assets, incur indebtedness andguarantees, pay dividends, repurchase or redeem capital stockand indebtedness, make certain investments or acquisitions,enter into certain transactions with affiliates, make capitalexpenditures, or change the nature of our business. The creditfacility also contains financial maintenance covenants estab-lishing a maximum funded indebtedness to capitalization ratio,a minimum consolidated net worth requirement, and a mini-mum interest coverage ratio. Events of default under the creditfacility and the indenture include, but are not limited to, pay-ment defaults, covenant defaults, breaches of representationsand warranties, cross defaults to certain other material agree-ments and indebtedness, bankruptcy and other insolvencyevents, material adverse judgments, actual or asserted invalidityof security interests or loan documentation, and certain changeof control events involving our company. We have obtained anamendment to our credit facility modifying the interest coverageratio calculation, and as a result of this modification, we were in compliance with the covenants of our credit facility as ofDecember 31, 2002.
We believe that our cash, cash flows from operations andavailable borrowings under our revolving credit facility will besufficient to fund our operations, capital expenditures and debtservice obligations for the next twelve months. When our creditfacility expires in June 2004, we will either need to extend the facility or enter into a new credit facility. We cannot assure,however, that our business will generate sufficient cash flowfrom operations or that we will be in compliance with the finan-cial covenants in our credit facility so that future borrowingsthereunder will be available to us. This will be dependent upon our future financial performance, which will be affectedby general economic, competitive and other factors, includingthose discussed under “Factors Influencing Our Results ofOperations,” many of which are beyond our control.
at the segment’s Lewiston pulp and paperboard mill contributedto the unfavorable results for 2001. Higher energy and woodfiber costs, combined with increases in the volume of paper-board and tissue product shipments, were largely responsiblefor the $49.0 million increase in segment expenses. Also included in expenses for 2001 were the $11.1 million chargerelated to our Beloit Corporation lawsuit and bad debt expenseof $2.2 million related to the pulp broker insolvency.
L I Q U I D I T Y A N D C A P I T A L R E S O U R C E S
At December 31, 2002, our financial position included long-termdebt of $638.3 million, including current installments on long-term debt of $15.6 million. Long-term debt (including currentinstallments and early maturing long-term debt) to stockholders’equity was 1.48 to 1 at December 31, 2002, compared to 1.63to 1 at December 31, 2001. Long-term debt at December 31,2002 (including current installments and early maturing long-term debt) declined $511.9 million from the December 2001balance due to normal payments on maturing debt of $132.6million and the early retirement of $379.3 million of long-termdebt, using a portion of the proceeds from the sale of thePrinting Papers segment assets. Stockholders’ equity declined$276.5 million, largely due to a net loss of $234.4 million for2002, the recording of a minimum pension liability adjustmentof $33.2 million and dividend payments of $17.1 million.
Scheduled payments due on long-term debt during each ofthe five years subsequent to December 31, 2002 are as follows:(Dollars in thousands)
2003 $15,6072004 6072005 1,6082006 2,9582007 6,759
In September 2002, we placed $15.0 million into an interest-bearing escrow account under the terms of an amendment toour credit agreement. The escrow account’s use is restricted tothe repayment of $15 million of our medium-term notes, bear-ing an interest rate of 9.42%, which mature on April 4, 2003.
We had working capital of $102.7 million at December 31,2002, a decrease of $509.7 million from December 31, 2001.Items decreasing working capital included reductions in assetsheld for sale of $767.0 million, restricted cash of $83.1 million,
short-term investments of $28.5 million and an increase innotes payable of $40.0 million. The decrease in working capitalcaused by these changes was partially offset by an increase in inventory of $52.1 million and decreases in current install-ments on long-term debt of $117.0 million, early maturing debt of $197.0 million and liabilities related to assets held for sale of $33.9 million.
Net cash used for operations in 2002 totaled $69.1 million,compared with cash provided by operations of $34.5 million in 2001 and $72.4 million in 2000. An increase in cash usedfor working capital items in 2002 accounts for a majority of the unfavorable comparison to 2001. The net decrease in cashgenerated in 2001 compared to 2000 resulted primarily fromthe following items: a 2001 net loss from continuing operationsof $56.6 million versus a 2000 net loss of $33.4 million; adecrease in deferred taxes of $83.4 million in 2001 versus anincrease of $18.3 million in 2000; and working capital changescontributing cash of $54.2 million in 2001 compared to usingcash of $19.1 million in 2000.
Net cash provided by investing was $65.8 million in 2002,while net cash used for investing was $164.7 million in 2001and $142.7 million in 2000. Cash was provided in 2002 largelyfrom the use of restricted cash and short-term investments torepay long-term debt. Capital spending of $51.6 million in 2002was modestly higher than the $42.7 million spent in 2001. InSeptember 2002, we announced plans to spend $66 million toconstruct a new tissue machine in Las Vegas, Nevada. Spendingon this project in 2002 totaled $19.2 million. The balance ofcapital spending in 2002 focused on routine general replace-ment, safety, forest resource and environmental projects. Theincrease in cash used in 2001 compared to 2000 was primarilyattributable to the establishment of a restricted cash accounttotaling $98.2 million at December 31, 2001, and an increase in short-term investments of $30.5 million. These amounts were partially offset by lower capital expenditures, totaling$42.7 million in 2001 compared to $142.8 million in 2000.Capital spending in 2001 focused on routine general replace-ment, safety, forest resource and environmental projects.Approximately $4.0 million was spent for the completion of the modernization and expansion project at our Cook,Minnesota, OSB mill and another $6.5 million on developmentof our hybrid poplar plantation in Boardman, Oregon.
Authorized but unexpended capital appropriations totaled$93.3 million at December 31, 2002, all of which is budgetedfor expenditure in 2003. As in 2002, spending in 2003 will beconcentrated on the new tissue machine in Las Vegas as well asvarious routine general replacement, safety, forest resource andenvironmental projects. Spending on projects may be delayed
E N V I R O N M E N T
We are subject to extensive federal and state environmentalregulations at our operating facilities and timberlands, particu-larly with respect to air emissions, wastewater discharges, solidand hazardous waste management, site remediation, forestryoperations and endangered species. We endeavor to complywith all environmental regulations and regularly monitor ouractivities for such compliance. Compliance with environmentalregulations is a significant factor in our business and requirescapital expenditures as well as additional operating costs.Capital expenditures specifically designated for environmentalcompliance totaled approximately $1 million during 2002 and are budgeted to be approximately $1 million in 2003.
In early 1998 the Environmental Protection Agency (EPA)published the “Cluster Rule” regulations specifically applica-ble to the pulp and paper industry. These extensive regulationsgovern both air and water emissions. During 2001, we com-pleted modifications to process equipment and operating procedures to comply with Phase I of the regulations. Phase II of the regulations relates to control of high volume, low con-centration emissions at kraft pulp mills, and our complianceefforts are scheduled to be completed in 2006 at an expectedcost of approximately $5 million. We do not expect that suchcompliance costs will have a material adverse effect on ourcompetitive position.
Our pulp mill at Lewiston, Idaho, discharges treated milleffluent into the nearby Snake River. Federal law requires thatwe comply with provisions of a National Pollution DischargeElimination System (NPDES) permit. As allowed by federalregulations, we are operating under an NPDES permit whichexpired in 1997, but which continues to be in force until theeffective date of a new NPDES permit. Negotiations for a new permit have been ongoing since its expiration. The EPApublished a draft NPDES permit in December 1999, whichincludes an end-of-the-pipe discharge temperature requirementof 68 degrees Fahrenheit to be achieved within five years of the date a new permit becomes effective. Meeting this require-ment would necessitate installation of refrigeration equipmentat a total capital cost between $25 million and $30 million.Discussions are ongoing with the EPA and other agenciesinvolved in the reissuance of the NPDES permit. There areregional precedents for a higher temperature limit. Compliancewith a higher temperature limit, should it be allowed, could beachieved with process modifications and less costly equipmentconfigurations than refrigeration. If we are required to installand operate the refrigeration equipment, we believe the pulpmill will be substantially less competitive than similar mills,none of which face such requirements.
2 1
The EPA is currently developing its Total Maximum DailyLoad (TMDL) regulations for temperature. This process is notexpected to be completed until late 2003, and may clarify therequirements to be placed on the Lewiston mill discharge.Thecurrently proposed temperature TMDL, in conjunction withrecently promulgated Idaho Water Quality Standards, wouldrequire considerably less significant temperature reduction to our discharge, consistent with other pulp mill discharges in the region. If approved as drafted, the new TMDL and waterquality standards would likely result in a modification to ourdraft NPDES permit, allowing for a mixing zone for temperature,rather than an end-of-the-pipe temperature limit.
The EPA is currently developing environmental regulations,collectively known as Maximum Achievable Control Technology(MACT) rules, which could affect our wood products operationsas well as our power boiler generating facilities. The MACT rulesfor power boiler facilities were proposed in November 2002, and those for wood products operations are not expected to be proposed until early 2003. Compliance is not expected to berequired before 2006. We are currently studying the proposedMACT rules for power boiler operations, and after the proposedrules for wood products operations are published, we will be ableto reasonably estimate the capital expenditures necessary forcompliance, although we do not expect such compliance costs to have a material adverse effect on our competitive position.
We believe that our facilities are currently in substantialcompliance with applicable environmental laws and regulations.We cannot assure, however, that situations which will give rise to material environmental liabilities will not be discovered orthat the enactment of new environmental laws or regulations or changes in existing laws or regulations will not require significant expenditures by us.
I N C O M E T A X E S
Our effective tax rate for 2002, 2001 and 2000 was 39.0 percent.
Q U A N T I T A T I V E A N D Q U A L I T A T I V E D I S C L O S U R E S
A B O U T M A R K E T R I S K S
Our exposure to market risks on our financial instrumentsincludes interest rate risk on our bank credit facility. InDecember 2002 all of our other variable rate debt was con-verted to fixed-rate debt or was retired. As of December 31,2002, we had $40.0 million of credit facility debt outstanding.The interest rates applied to borrowings under the credit facility are adjusted often and therefore react quickly to anymovement in the general trend of market interest rates.
All of our long-term debt is fixed-rate, and therefore changesin market interest rates do not expose us to risk for these finan-cial instruments. However, in December 2001 we entered into
F I N A N C I A L R E V I E W
P O T L A T C H C O R P O R A T I O N A N D C O N S O L I D A T E D S U B S I D I A R I E S
2 0
At December 31, 2001, Standard & Poor’s Ratings Services, a division of The McGraw-Hill Companies, Inc., Moody’sInvestors Service Inc. and Fitch, Inc. rated our senior unsecuredlong-term debt BBB-, Baa3 and BBB-, respectively, all with anegative outlook. In addition, all three organizations listed us on CreditWatch with negative implications. On July 12, 2002,Standard & Poor’s announced that it had affirmed its ratings on our debt, including our BBB- corporate rating, and removedus from CreditWatch. On September 23, 2002, it announced that its ratings and outlook would remain unchanged at BBB-with a negative outlook following the announcement that ourBoard of Directors had approved $66 million to construct a new tissue machine in Las Vegas, Nevada. During the secondquarter of 2002 Fitch affirmed our BBB- rating, classified us as stable, and removed us from CreditWatch. Moody’s rating of our debt has remained unchanged at Baa3 with a negativeoutlook. On January 30, 2003, Standard & Poor’s announcedthat it had lowered our senior unsecured debt rating to BB+and affirmed our senior secured bank loan rating at BBB-. The ratings downgrade by Standard & Poor’s caused the interest rate on our $100 million Credit Sensitive Debentures to increase from 9.425% to 12.5%, effective January 30, 2003.
Since December 1999, we have been authorized under a stockrepurchase program to repurchase up to two million shares of our common stock. Under the plan, purchases of common stockmay be made from time to time through open market and pri-vately negotiated transactions at prices deemed appropriate by management. Through December 31, 2001, a total of 910,900 shares had been acquired under the stock repurchase program. No shares were acquired in 2002, and we do not expect to repurchase additional common stock in the foreseeable future.
It is our practice to periodically review strategic and opera-tional alternatives to improve our operating results and financialposition. In this regard, we consider and plan to continue to consider, among other things, adjustments to our capital expen-ditures and overall spending, the restructuring of our operations to achieve greater efficiencies, and the disposition of assets thatmay have greater value to others. There can be no assurancethat we will be successful in implementing any new strategic oroperational initiatives or, if implemented, that they will have theeffect of improving our operating results and financial position.
P O T L A T C H C O R P O R A T I O N A N D C O N S O L I D A T E D S U B S I D I A R I E S
F I N A N C I A L R E V I E W
M A N A G E M E N T ’ S D I S C U S S I O N A N D A N A L Y S I S O F F I N A N C I A L
C O N D I T I O N A N D R E S U L T S O F O P E R A T I O N S ( C O N T I N U E D )
a fixed-to-variable interest rate swap to hedge a portion of our10% senior subordinated debentures. The swap has been desig-nated as a fair value hedge and calls for the company to pay a variable interest amount, based on London Interbank OfferedRate (LIBOR) rates, and receive a fixed-rate payment from afinancial institution, calculated on $165.0 million of our 10%senior subordinated debentures. We assume there is no ineffec-tiveness in the hedge and, accordingly, a fair value increase or decrease in the swap is offset by a corresponding decrease or increase in the value of the underlying debt instrument.
At December 31, 2002, we were not a party to any derivativefinancial instruments other than the interest rate swap.
C O M M O N S T O C K :
M A R K E T S , P R I C E S , V O T I N G R I G H T S A N D D I V I D E N D S
The company’s common stock is traded on the NewYork, Chicagoand Pacific Stock Exchanges. The quarterly and yearly highand low sales price per share of our common stock, as reportedin the New York Stock Exchange Composite Transactions in the Wall Street Journal for 2002 and 2001, were as follows:
2002 2001
Quarter High Low High Low
1st $34.44 $27.85 $34.88 $29.262nd 36.13 32.32 36.22 31.033rd 33.69 28.35 34.34 26.554th 29.88 23.88 29.80 24.90Year 36.13 23.88 36.22 24.90
In general, all holders of Potlatch common stock who own shares48 consecutive calendar months or longer (“long-term holders”)are entitled to exercise four votes per share of stock so held,while stockholders who are not long-term holders are entitled to one vote per share. All stockholders are entitled to only onevote per share on matters arising under certain provisions of thecompany’s charter. There were approximately 1,900 commonstockholders of record at December 31, 2002.
See the discussion under the caption “Liquidity and CapitalResources” in Management’s Discussion and Analysis ofFinancial Condition and Results of Operations on page 19for information regarding restrictions on our ability to pay dividends. Quarterly dividend payments per common share for 2002 and 2001 were:Quarter 2002 2001
1st $.15 $.4352nd .15 .4353rd .15 .1554th .15 .155
$.60 $1.17

F I N A N C I A L R E V I E W
2 3
P O T L A T C H C O R P O R A T I O N A N D C O N S O L I D A T E D S U B S I D I A R I E S
F I N A N C I A L R E V I E W
2 2
P O T L A T C H C O R P O R A T I O N A N D C O N S O L I D A T E D S U B S I D I A R I E S
B A L A N C E S H E E T S
At December 31(Dollars in thousands – except per-share amounts) 2002 2001
A S S E T S
Current assets:Cash (Note 11) $ 8,973 $ 7,475Restricted cash (Notes 1 and 8) 15,069 98,200Short-term investments (Note 11) 2,000 30,509Receivables, net of allowance for doubtful accounts of $1,624
($1,589 in 2001) (Notes 2 and 8) 117,919 118,632Inventories (Notes 3 and 8) 159,798 107,713Prepaid expenses (Note 7) 39,005 31,274Assets held for sale (Note 17) 5,000 772,033
Total current assets 347,764 1,165,836
Land, other than timberlands 8,750 8,668Plant and equipment, at cost less accumulated depreciation of $1,260,487
($1,180,412 in 2001) (Note 4) 758,168 808,763Timber, timberlands and related logging facilities, net (Note 5) 396,426 395,668Other assets (Note 6) 105,218 108,211
$1,616,326 $2,487,146
L I A B I L I T I E S A N D S T O C K H O L D E R S ’ E Q U I T Y
Current liabilities:Notes payable (Notes 8 and 11) $ 40,000 $ –Current installments on long-term debt (Notes 8 and 11) 15,607 132,603Accounts payable and accrued liabilities (Note 9) 189,452 189,916Early maturing long-term debt (Note 8) – 197,000Liabilities related to assets held for sale (Note 17) 12 33,933
Total current liabilities 245,071 553,452
Long-term debt (Notes 8 and 11) 622,645 820,522Other long-term obligations (Note 10) 261,165 195,258Deferred taxes (Note 7) 56,654 210,610
Stockholders’ equity:Preferred stock, Authorized 4,000,000 shares – –Common stock, $1 par value
Authorized 40,000,000 shares, issued 32,721,980 shares 32,722 32,722Additional paid-in capital 131,065 129,978Retained earnings 409,692 661,144Accumulated other comprehensive loss:
Minimum pension liability adjustment (33,207) –Common shares in treasury 4,143,329 (4,410,528 in 2001) (109,481) (116,540)
Total stockholders’ equity 430,791 707,304
$1,616,326 $2,487,146
Certain amounts for 2001 have been conformed to the 2002 presentation.
The accompanying notes and summary of principal accounting policies are an integral part of these financial statements.
For the years ended December 31(Dollars in thousands – except per-share amounts) 2002 2001 2000
Net sales $1,286,217 $1,274,585 $1,293,193
Costs and expenses:Depreciation, amortization and cost of fee timber harvested 115,469 115,033 108,722Materials, labor and other operating expenses 1,102,065 1,083,141 1,044,894Selling, general and administrative expenses 83,177 86,318 85,469Restructuring and other charges (Note 15) 8,963 2,750 46,411
1,309,674 1,287,242 1,285,496
Earnings (loss) from operations (23,457) (12,657) 7,697Interest expense, net of capitalized interest of $300
($1,032 in 2001 and $3,964 in 2000) (59,882) (77,853) (59,438)Debt extinguishment costs (15,360) – –Other income (expense), net (Note 16) 15,202 (2,221) (3,001)
Loss before taxes on income (83,497) (92,731) (54,742)Provision (benefit) for taxes on income (Note 7) (32,564) (36,165) (21,349)
Loss from continuing operations (50,933) (56,566) (33,393)Discontinued operations (Note 17):
Earnings (loss) from discontinued operations (including loss on disposal of $276,218, $0 and $0) (300,734) (37,507) 293
Income tax provision (benefit) (117,286) (14,628) 114
Net loss $ (234,381) $ (79,445) $ (33,214)
Other comprehensive loss:Minimum pension liability adjustment,
net of income tax benefit of $21,231 (33,207) – –
Comprehensive loss $ (267,588) $ (79,445) $ (33,214)
Net loss per common share:Basic $(8.23) $(2.81) $(1.16)Diluted (8.23) (2.81) (1.16)
Certain amounts for 2000 and 2001 have been conformed to the 2002 presentation.
The accompanying notes and summary of principal accounting policies are an integral part of these financial statements.
S T A T E M E N T S O F O P E R A T I O N S A N D C O M P R E H E N S I V E L O S S
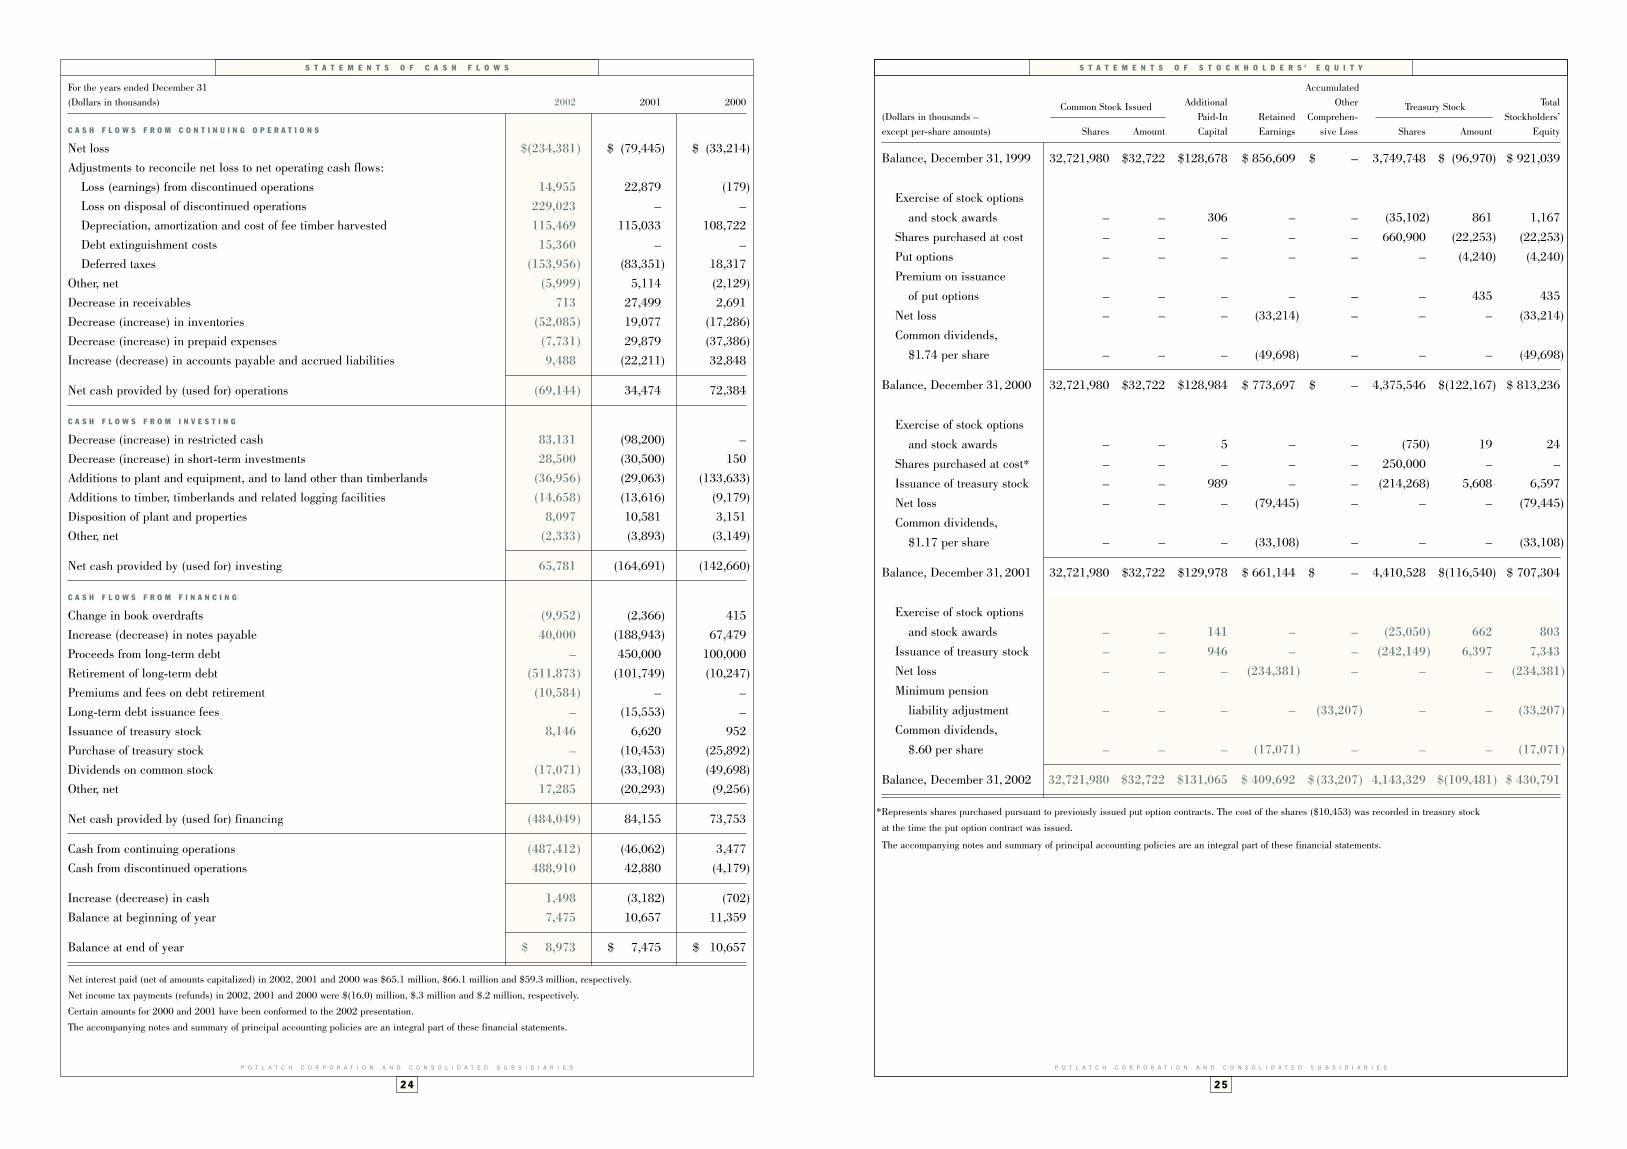
F I N A N C I A L R E V I E W
2 5
P O T L A T C H C O R P O R A T I O N A N D C O N S O L I D A T E D S U B S I D I A R I E S
F I N A N C I A L R E V I E W
2 4
P O T L A T C H C O R P O R A T I O N A N D C O N S O L I D A T E D S U B S I D I A R I E S
AccumulatedAdditional Other Total
(Dollars in thousands – Common Stock Issued
Paid-In Retained Comprehen-Treasury Stock
Stockholders’except per-share amounts) Shares Amount Capital Earnings sive Loss Shares Amount Equity
Balance, December 31, 1999 32,721,980 $32,722 $128,678 $ 856,609 $ – 3,749,748 $ (96,970) $ 921,039
Exercise of stock options and stock awards – – 306 – – (35,102) 861 1,167
Shares purchased at cost – – – – – 660,900 (22,253) (22,253)Put options – – – – – – (4,240) (4,240)Premium on issuance
of put options – – – – – – 435 435Net loss – – – (33,214) – – – (33,214)Common dividends,
$1.74 per share – – – (49,698) – – – (49,698)
Balance, December 31, 2000 32,721,980 $32,722 $128,984 $ 773,697 $ – 4,375,546 $(122,167) $ 813,236
Exercise of stock options and stock awards – – 5 – – (750) 19 24
Shares purchased at cost* – – – – – 250,000 – –Issuance of treasury stock – – 989 – – (214,268) 5,608 6,597Net loss – – – (79,445) – – – (79,445)Common dividends,
$1.17 per share – – – (33,108) – – – (33,108)
Balance, December 31, 2001 32,721,980 $32,722 $129,978 $ 661,144 $ – 4,410,528 $(116,540) $ 707,304
Exercise of stock options and stock awards – – 141 – – (25,050) 662 803
Issuance of treasury stock – – 946 – – (242,149) 6,397 7,343Net loss – – – (234,381) – – – (234,381)Minimum pension
liability adjustment – – – – (33,207) – – (33,207)Common dividends,
$.60 per share – – – (17,071) – – – (17,071)
Balance, December 31, 2002 32,721,980 $32,722 $131,065 $ 409,692 $ (33,207) 4,143,329 $(109,481) $ 430,791
*Represents shares purchased pursuant to previously issued put option contracts. The cost of the shares ($10,453) was recorded in treasury stock
at the time the put option contract was issued.
The accompanying notes and summary of principal accounting policies are an integral part of these financial statements.
S T A T E M E N T S O F S T O C K H O L D E R S ’ E Q U I T Y
For the years ended December 31(Dollars in thousands) 2002 2001 2000
C A S H F L O W S F R O M C O N T I N U I N G O P E R A T I O N S
Net loss $(234,381) $ (79,445) $ (33,214)Adjustments to reconcile net loss to net operating cash flows:
Loss (earnings) from discontinued operations 14,955 22,879 (179)Loss on disposal of discontinued operations 229,023 – –Depreciation, amortization and cost of fee timber harvested 115,469 115,033 108,722Debt extinguishment costs 15,360 – –Deferred taxes (153,956) (83,351) 18,317
Other, net (5,999) 5,114 (2,129)Decrease in receivables 713 27,499 2,691Decrease (increase) in inventories (52,085) 19,077 (17,286)Decrease (increase) in prepaid expenses (7,731) 29,879 (37,386)Increase (decrease) in accounts payable and accrued liabilities 9,488 (22,211) 32,848
Net cash provided by (used for) operations (69,144) 34,474 72,384
C A S H F L O W S F R O M I N V E S T I N G
Decrease (increase) in restricted cash 83,131 (98,200) –Decrease (increase) in short-term investments 28,500 (30,500) 150Additions to plant and equipment, and to land other than timberlands (36,956) (29,063) (133,633)Additions to timber, timberlands and related logging facilities (14,658) (13,616) (9,179)Disposition of plant and properties 8,097 10,581 3,151Other, net (2,333) (3,893) (3,149)
Net cash provided by (used for) investing 65,781 (164,691) (142,660)
C A S H F L O W S F R O M F I N A N C I N G
Change in book overdrafts (9,952) (2,366) 415Increase (decrease) in notes payable 40,000 (188,943) 67,479Proceeds from long-term debt – 450,000 100,000Retirement of long-term debt (511,873) (101,749) (10,247)Premiums and fees on debt retirement (10,584) – –Long-term debt issuance fees – (15,553) –Issuance of treasury stock 8,146 6,620 952Purchase of treasury stock – (10,453) (25,892)Dividends on common stock (17,071) (33,108) (49,698)Other, net 17,285 (20,293) (9,256)
Net cash provided by (used for) financing (484,049) 84,155 73,753
Cash from continuing operations (487,412) (46,062) 3,477Cash from discontinued operations 488,910 42,880 (4,179)
Increase (decrease) in cash 1,498 (3,182) (702)Balance at beginning of year 7,475 10,657 11,359
Balance at end of year $ 8,973 $ 7,475 $ 10,657
Net interest paid (net of amounts capitalized) in 2002, 2001 and 2000 was $65.1 million, $66.1 million and $59.3 million, respectively.
Net income tax payments (refunds) in 2002, 2001 and 2000 were $(16.0) million, $.3 million and $.2 million, respectively.
Certain amounts for 2000 and 2001 have been conformed to the 2002 presentation.
The accompanying notes and summary of principal accounting policies are an integral part of these financial statements.
S T A T E M E N T S O F C A S H F L O W S
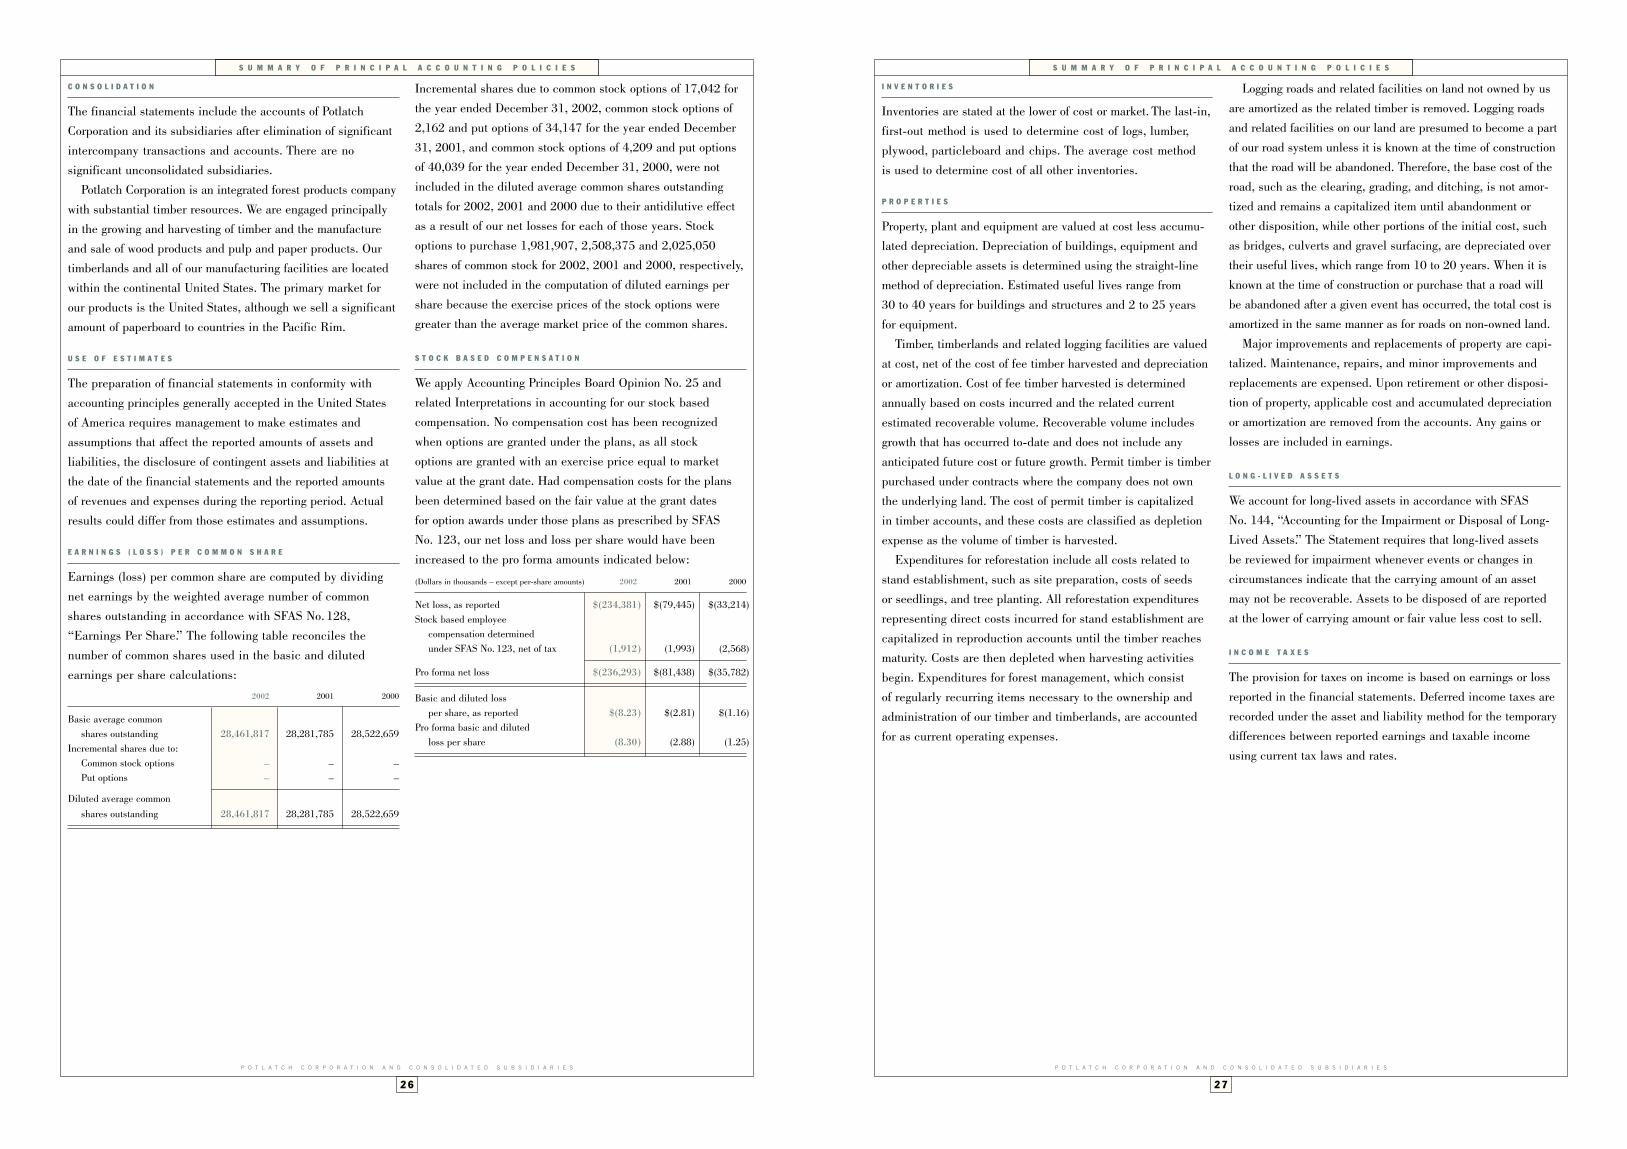
N O T E S T O C O N S O L I D A T E D F I N A N C I A L S T A T E M E N T S
2 7
P O T L A T C H C O R P O R A T I O N A N D C O N S O L I D A T E D S U B S I D I A R I E S
N O T E S T O C O N S O L I D A T E D F I N A N C I A L S T A T E M E N T S
2 6
P O T L A T C H C O R P O R A T I O N A N D C O N S O L I D A T E D S U B S I D I A R I E S
I N V E N T O R I E S
Inventories are stated at the lower of cost or market. The last-in,first-out method is used to determine cost of logs, lumber, plywood, particleboard and chips. The average cost method is used to determine cost of all other inventories.
P R O P E R T I E S
Property, plant and equipment are valued at cost less accumu-lated depreciation. Depreciation of buildings, equipment andother depreciable assets is determined using the straight-linemethod of depreciation. Estimated useful lives range from 30 to 40 years for buildings and structures and 2 to 25 yearsfor equipment.
Timber, timberlands and related logging facilities are valuedat cost, net of the cost of fee timber harvested and depreciationor amortization. Cost of fee timber harvested is determinedannually based on costs incurred and the related current estimated recoverable volume. Recoverable volume includesgrowth that has occurred to-date and does not include anyanticipated future cost or future growth. Permit timber is timberpurchased under contracts where the company does not own the underlying land. The cost of permit timber is capitalized in timber accounts, and these costs are classified as depletionexpense as the volume of timber is harvested.
Expenditures for reforestation include all costs related tostand establishment, such as site preparation, costs of seeds or seedlings, and tree planting. All reforestation expendituresrepresenting direct costs incurred for stand establishment arecapitalized in reproduction accounts until the timber reachesmaturity. Costs are then depleted when harvesting activitiesbegin. Expenditures for forest management, which consist of regularly recurring items necessary to the ownership andadministration of our timber and timberlands, are accounted for as current operating expenses.
Logging roads and related facilities on land not owned by usare amortized as the related timber is removed. Logging roadsand related facilities on our land are presumed to become a partof our road system unless it is known at the time of constructionthat the road will be abandoned. Therefore, the base cost of theroad, such as the clearing, grading, and ditching, is not amor-tized and remains a capitalized item until abandonment or other disposition, while other portions of the initial cost, such as bridges, culverts and gravel surfacing, are depreciated over their useful lives, which range from 10 to 20 years. When it is known at the time of construction or purchase that a road will be abandoned after a given event has occurred, the total cost is amortized in the same manner as for roads on non-owned land.
Major improvements and replacements of property are capi-talized. Maintenance, repairs, and minor improvements andreplacements are expensed. Upon retirement or other disposi-tion of property, applicable cost and accumulated depreciationor amortization are removed from the accounts. Any gains orlosses are included in earnings.
L O N G - L I V E D A S S E T S
We account for long-lived assets in accordance with SFAS No. 144, “Accounting for the Impairment or Disposal of Long-Lived Assets.” The Statement requires that long-lived assets be reviewed for impairment whenever events or changes in circumstances indicate that the carrying amount of an assetmay not be recoverable. Assets to be disposed of are reported at the lower of carrying amount or fair value less cost to sell.
I N C O M E T A X E S
The provision for taxes on income is based on earnings or lossreported in the financial statements. Deferred income taxes arerecorded under the asset and liability method for the temporarydifferences between reported earnings and taxable incomeusing current tax laws and rates.
S U M M A R Y O F P R I N C I P A L A C C O U N T I N G P O L I C I E S
C O N S O L I D A T I O N
The financial statements include the accounts of PotlatchCorporation and its subsidiaries after elimination of significantintercompany transactions and accounts. There are no significant unconsolidated subsidiaries.
Potlatch Corporation is an integrated forest products companywith substantial timber resources. We are engaged principallyin the growing and harvesting of timber and the manufactureand sale of wood products and pulp and paper products. Ourtimberlands and all of our manufacturing facilities are locatedwithin the continental United States. The primary market forour products is the United States, although we sell a significantamount of paperboard to countries in the Pacific Rim.
U S E O F E S T I M A T E S
The preparation of financial statements in conformity withaccounting principles generally accepted in the United Statesof America requires management to make estimates andassumptions that affect the reported amounts of assets and liabilities, the disclosure of contingent assets and liabilities atthe date of the financial statements and the reported amounts of revenues and expenses during the reporting period. Actualresults could differ from those estimates and assumptions.
E A R N I N G S ( L O S S ) P E R C O M M O N S H A R E
Earnings (loss) per common share are computed by dividingnet earnings by the weighted average number of commonshares outstanding in accordance with SFAS No. 128,“Earnings Per Share.” The following table reconciles the number of common shares used in the basic and diluted earnings per share calculations:
2002 2001 2000
Basic average common shares outstanding 28,461,817 28,281,785 28,522,659
Incremental shares due to:Common stock options – – –Put options – – –
Diluted average common shares outstanding 28,461,817 28,281,785 28,522,659
Incremental shares due to common stock options of 17,042 forthe year ended December 31, 2002, common stock options of2,162 and put options of 34,147 for the year ended December31, 2001, and common stock options of 4,209 and put optionsof 40,039 for the year ended December 31, 2000, were notincluded in the diluted average common shares outstandingtotals for 2002, 2001 and 2000 due to their antidilutive effectas a result of our net losses for each of those years. Stockoptions to purchase 1,981,907, 2,508,375 and 2,025,050shares of common stock for 2002, 2001 and 2000, respectively,were not included in the computation of diluted earnings pershare because the exercise prices of the stock options weregreater than the average market price of the common shares.
S T O C K B A S E D C O M P E N S A T I O N
We apply Accounting Principles Board Opinion No. 25 andrelated Interpretations in accounting for our stock based compensation. No compensation cost has been recognizedwhen options are granted under the plans, as all stock options are granted with an exercise price equal to marketvalue at the grant date. Had compensation costs for the plansbeen determined based on the fair value at the grant dates for option awards under those plans as prescribed by SFAS No. 123, our net loss and loss per share would have beenincreased to the pro forma amounts indicated below:
(Dollars in thousands – except per-share amounts) 2002 2001 2000
Net loss, as reported $(234,381) $(79,445) $(33,214)Stock based employee
compensation determined under SFAS No. 123, net of tax (1,912) (1,993) (2,568)
Pro forma net loss $(236,293) $(81,438) $(35,782)
Basic and diluted loss per share, as reported $(8.23) $(2.81) $(1.16)
Pro forma basic and dilutedloss per share (8.30) (2.88) (1.25)
S U M M A R Y O F P R I N C I P A L A C C O U N T I N G P O L I C I E S

N O T E S T O C O N S O L I D A T E D F I N A N C I A L S T A T E M E N T S
2 9
P O T L A T C H C O R P O R A T I O N A N D C O N S O L I D A T E D S U B S I D I A R I E S
reductions in quantities of LIFO inventories (primarily due tooperations sold in 2002) valued at lower costs prevailing inprior years had the effect of increasing earnings, net of incometaxes, by approximately $3.2 million ($.11 per common share).
4 P L A N T A N D E Q U I P M E N T
(Dollars in thousands) 2002 2001
Land improvements $ 58,724 $ 59,433Buildings and structures 283,585 282,701Machinery and equipment 1,590,695 1,561,960Other 56,890 56,890Construction in progress 28,761 28,191
$2,018,655 $1,989,175
Depreciation charged against income amounted to $84.5 millionin 2002 ($85.1 million in 2001 and $83.4 million in 2000).
Authorized but unexpended appropriations for capital projectstotaled $93.3 million at December 31, 2002, all of which isbudgeted to be expended in 2003. We have capital commitmentstotaling approximately $45.0 million in 2003 related to our construction of a new tissue machine in Las Vegas, Nevada.
T I M B E R , T I M B E R L A N D S A N D 5 R E L A T E D L O G G I N G F A C I L I T I E S
(Dollars in thousands) 2002 2001
Timber and timberlands $347,853 $348,287Related logging facilities 48,573 47,381
$396,426 $395,668
The cost of timber harvested from company-owned landsamounted to $10.6 million in 2002 ($8.9 million in 2001 and$8.3 million in 2000). The cost of permit timber harvested from non-company owned lands amounted to $15.8 million in 2002 ($14.8 million in 2001 and $14.3 million in 2000).Amortization of logging roads and related facilities amounted to $2.0 million in 2002 ($2.4 million in 2001 and $2.1 million in 2000).
1 R E S T R I C T E D C A S H
In June 2001, under the terms of our bank credit facility, weplaced $96.6 million of the proceeds from borrowings under thecredit facility into an interest-bearing escrow account. Theescrow account’s use was restricted to the repayment of our $100million 6.25% Debentures, which occurred on March 15, 2002.
In September 2002, we placed $15.0 million into an interest-bearing escrow account under the terms of an amend-ment to our credit agreement. The escrow account’s use isrestricted to the repayment of $15 million of our medium-termnotes, which mature on April 4, 2003.
2 R E C E I V A B L E S , N E T
The receivables balance at December 31, 2002 and 2001includes approximately $22.3 million due to settlementsreached with the Internal Revenue Service for the years 1989through 1994. The settlements exceed the threshold amountthat requires review by the congressional Joint Committee on Taxation. The review is currently in process.
3 I N V E N T O R I E S
(Dollars in thousands) 2002 2001
Logs, pulpwood, chips and sawdust $ 25,212 $ 12,260Lumber and other manufactured wood products 14,954 8,809Pulp, paper and converted paper products 79,690 48,348Materials and supplies 39,942 38,296
$159,798 $107,713
Valued at lower of cost or market:Last-in, first-out basis $ 36,125 $ 18,505Average cost basis 123,673 89,208
$159,798 $107,713
If the last-in, first-out inventory had been priced at lower of current average cost or market, the values would have beenapproximately $22.4 million higher at December 31, 2002,and $19.3 million higher at December 31, 2001. In 2002,
S U M M A R Y O F P R I N C I P A L A C C O U N T I N G P O L I C I E S
2 8
E N V I R O N M E N T
As part of our corporate policy, we have an ongoing process to monitor, report on and comply with environmental require-ments. Based on this ongoing process, accruals for environ-mental liabilities are established in accordance with SFAS No. 5. We estimate our environmental liabilities based on various assumptions and judgments, the specific nature ofwhich varies in light of the particular facts and circumstancessurrounding each environmental liability. These estimates typically reflect assumptions and judgments as to the probablenature, magnitude and timing of required investigation, remedi-ation and monitoring activities and the probable cost of theseactivities, and in some cases reflect assumptions and judgmentsas to the obligation or willingness and ability of third parties to bear a proportionate or allocated share of the cost of theseactivities. Due to the numerous uncertainties and variablesassociated with these assumptions and judgments, and theeffects of changes in governmental regulation and environ-mental technologies, both the precision and reliability of theresulting estimates of the related liabilities are subject to substantial uncertainties. We regularly monitor our estimatedexposure to environmental liabilities and, as additional infor-mation becomes known, our estimates may change significantly.Our estimates of our environmental liabilities do not reflectpotential future recoveries from insurance carriers except to theextent that recovery may from time to time be deemed probableas a result of a carrier’s agreement to payment terms. In thoseinstances in which our estimated exposure reflects actual oranticipated cost-sharing arrangements with third parties, we do not believe that we will be exposed to additional materialliability as a result of non-performance by such third parties.Currently, we are not aware of any material environmental liabilities and have accrued for only specific minor environ-mental remediation costs we believe are likely to be incurred.
R E V E N U E R E C O G N I T I O N
We recognize revenue from product sales to our customerswhen title and risk of loss pass to the customer, which generallyoccurs upon shipment. In the case of export sales, title may not pass until the product reaches a foreign port.
R E C E N T A C C O U N T I N G P R O N O U N C E M E N T S
In June 2001, the Financial Accounting Standards Board (FASB)issued SFAS No. 143, “Accounting for Asset RetirementObligations,” which is effective January 1, 2003. The Statementrequires that the fair value of a liability for an asset retirementobligation be recognized in the period in which it is incurred,with the associated asset retirement costs capitalized as part of the carrying amount of the long-lived asset. We believeadoption of this Statement will not have a material adverseeffect on our financial condition or results of operations.
In June 2002, the FASB issued SFAS No.146,“Accountingfor Costs Associated with Exit or Disposal Activities.” The Statement requires that a liability for a cost associatedwith an exit or disposal activity be recognized when the liability is incurred, rather than at the commitment date of a plan. We adopted SFAS No. 146 in November 2002 and applied its provisions to our announced elimination of 106 salaried positions.
In December 2002, the FASB issued SFAS No. 148,“Accounting for Stock Based Compensation - Transition andDisclosure,” which amends SFAS No. 123, “Accounting forStock Based Compensation.” The Statement provides additionalguidance in accounting and reporting for stock based com-pensation and was effective upon issuance. We have adoptedthe applicable provisions of SFAS No. 148 in this report.
P O T L A T C H C O R P O R A T I O N A N D C O N S O L I D A T E D S U B S I D I A R I E S

N O T E S T O C O N S O L I D A T E D F I N A N C I A L S T A T E M E N T S
3 1
P O T L A T C H C O R P O R A T I O N A N D C O N S O L I D A T E D S U B S I D I A R I E S
N O T E S T O C O N S O L I D A T E D F I N A N C I A L S T A T E M E N T S
3 0
P O T L A T C H C O R P O R A T I O N A N D C O N S O L I D A T E D S U B S I D I A R I E S
the four-year term loan at December 31, 2001, of which $2.0million was due within one year and $197.0 million was due in 2003 and later years, were classified as current liabilities.After repayment of the four-year term loan, that portion of thecredit facility was no longer available to us. The revolving lineof credit portion of the credit facility was reduced to $150.0million on December 18, 2002, and at December 31, 2002, we had borrowed $40.0 million. As a result of an amendment to the credit facility negotiated after the repayment of the four-year term loan, borrowings under the credit facility are no longer secured by our Arkansas timberlands.
Our 10% senior subordinated notes due 2011 are unsecuredand are subordinated to our senior notes and our credit facility.
Both the agreement covering our credit facility and theindenture governing our senior subordinated notes contain certain covenants that, among other things, restrict our abilityand our subsidiaries’ ability to create liens, merge or consoli-date, dispose of assets, incur indebtedness, pay dividends,repurchase or redeem capital stock and indebtedness, makecertain investments or acquisitions, make capital expenditures,or change the nature of our business. Our credit facility alsocontains financial maintenance covenants. We have obtained an amendment to our credit facility modifying the interest coverage ratio calculation, and as a result of this modification,we were in compliance with the covenants of our credit facilityas of December 31, 2002.
In December 2001, we entered into a fixed-to-variable inter-est rate swap to hedge a portion of our 10% senior subordinateddebentures. The swap has been designated as a fair value hedgeand calls for the company to pay a variable interest amount,based on LIBOR rates, and receive a fixed-rate payment from a financial institution, calculated on $165.0 million of our 10%senior subordinated debentures. We assume there is no ineffec-tiveness in the hedge and, accordingly, a fair value increase
In 2002, we retired $63.7 million of our variable rate revenuebonds, using proceeds from asset sales. In December 2002, we converted the remaining floating rate municipal bonds tofixed-rate bonds. The interest rates received on the convertedbonds ranged from 6.125% to 7.75%. All other terms of theconverted bonds remained identical to the variable rate version.
We repaid our 6.25% debentures due March 15, 2002, usingthe funds contained in an interest-bearing escrow account,which were restricted to that use.
The interest rate payable on the 9.125% credit sensitivedebentures is subject to adjustment in accordance with thetable below if certain changes in the debt rating of the deben-tures occur. In March 2001, Moody’s adjusted its rating on our senior debt to Baa3 and in June 2001, Standard & Poor’s(S&P) adjusted its rating to BBB-. Accordingly, the interest rate applied to the credit sensitive debentures increased from9.125% to 9.425%. On January 30, 2003, S&P lowered its rating on our senior debt to BB+, causing the interest rate toincrease from 9.425% to 12.5% effective that date.
Ratings
Moody’s S&P Applicable Rate(%)
Aaa AAA 8.825Aa1 – Aa3 AA+ – AA- 8.925A1– Baa2 A+ – BBB 9.125Baa3 BBB- 9.425Ba1 BB+ 12.500Ba2 BB 13.000Ba3 BB- 13.500B1 or lower B+ or lower 14.000
In June 2001, we obtained a new credit facility, which providedfor aggregate borrowings up to $400.0 million in the form of a four-year term loan in the amount of $200.0 million and athree-year revolving line of credit of up to $200.0 million. Ourobligations under the credit facility were secured by approxi-mately 130,000 acres of our timberlands in Arkansas and ouraccounts receivable and inventory. On December 31, 2001,$199.0 million was outstanding under the four-year term loanand no borrowings were outstanding under the revolving line ofcredit. Upon consummation of the sale of the Printing Paperssegment assets in May 2002, all outstanding amounts under our bank credit facility became due and payable, including thefour-year term loan. Accordingly, amounts outstanding under
As of December 31, 2002 and 2001, we had $183.5 millionand $236.8 million, respectively, of net operating loss carry-forwards that will expire in 18 to 19 years. We expect that sufficient taxable income will be generated in the future to utilize these carryforwards and therefore have not providedany valuation allowance with respect to them.
Our federal income tax returns have been examined, and we have reached final settlement for all tax years through1988. Settlements have been reached with the InternalRevenue Service for the years 1989 through 1994. The settlements exceed the threshold amount that requires reviewby the congressional Joint Committee on Taxation. The reviewis currently in process. The years 1995 through 2001 are currently under examination. In the opinion of management,adequate provision had been made at December 31, 2002,for income taxes that might be due as a result of these audits, and any resulting assessments will have no materialeffect on our consolidated earnings.
8 D E B T
(Dollars in thousands) 2002 2001
Revenue bonds fixed-rate 5.9% to 7.75% due 2002 through 2026 $171,628 $ 136,774
Revenue bonds variable rate due 2007 through 2030 – 99,892
Debentures 6.25% due 2002 – 99,996Debentures 6.95% due 2015 22,469 99,851Credit sensitive debentures 9.125% due 2009 100,000 100,000Medium-term notes fixed-rate 8.27% to 9.46%
due 2002 through 2022 94,050 164,500Term loan variable rate due 2002 through 2005 – 199,000Senior subordinated notes 10% due 2011 250,000 250,000Other notes 105 112
638,252 1,150,125Less current installments on long-term debt 15,607 132,603Less early maturing long-term debt – 197,000
Long-term debt $622,645 $ 820,522
6 O T H E R A S S E T S
(Dollars in thousands) 2002 2001
Pension assets $ 81,582 $ 81,092Other 23,636 27,119
$105,218 $108,211
7T A X E S O N I N C O M E
The provision (benefit) for taxes on income is comprised of the following:(Dollars in thousands) 2002 2001 2000
Current $ 535 $ 438 $ 1,517Deferred (150,385) (51,231) (22,752)
Provision (benefit) for taxes on income $(149,850) $(50,793) $(21,235)
The provision (benefit) for taxes on income differs from the amount computed by applying the statutory federal income tax rate of 35% to earnings before taxes on income due to the following:(Dollars in thousands) 2002 2001 2000
Computed “expected” tax expense (benefit) $(134,481) $(45,583) $(19,057)
State and local taxes, net of federalincome tax benefits (14,985) (5,079) (2,123)
All other items (384) (131) (55)
Provision (benefit) for taxes on income $(149,850) $(50,793) $(21,235)
Effective tax rate 39.0% 39.0% 39.0%
The tax effects of significant temporary differences creatingdeferred tax assets and liabilities at December 31 were:(Dollars in thousands) 2002 2001
Plant and equipment $(214,677) $(358,766)Timber, timberlands and related logging facilities (53,341) (50,154)Postretirement benefits 68,794 63,522Alternative minimum tax 43,867 58,235Net operating loss carryforward 71,565 92,346Employee benefits 19,108 19,250Pensions (3,709) (21,601)Discontinued operations 26,663 –Other, net 10,300 12,805
Net deferred tax liability (31,430) (184,363)Current deferred tax assets1 (25,224) (26,247)
Net noncurrent deferred tax liabilities $ (56,654) $(210,610)
1 Included in “Prepaid expenses” in the Balance Sheets.

N O T E S T O C O N S O L I D A T E D F I N A N C I A L S T A T E M E N T S
3 3
P O T L A T C H C O R P O R A T I O N A N D C O N S O L I D A T E D S U B S I D I A R I E S
Net periodic costs (benefit) were:Pension Benefit Plans Other Postretirement Benefit Plans
(Dollars in thousands) 2002 2001 2000 2002 2001 2000
Service cost $ 10,605 $ 13,178 $ 13,944 $ 3,723 $ 3,243 $ 3,360Interest cost 36,979 35,754 34,181 16,205 12,942 11,641Expected return on plan assets (62,686) (60,453) (55,553) (1,620) (2,847) (3,691)Amortization of prior service cost 2,296 3,356 3,075 (820) (833) (717)Recognized actuarial loss (gain) (5,037) (5,378) (3,586) 2,790 – –Recognized net initial asset (37) (45) (172) – – –Other – – – – – 58
Net periodic cost (benefit) $(17,880) $(13,588) $ (8,111) $20,278 $12,505 $10,651
Pension Benefit Plans Other Postretirement Benefit Plans
(Dollars in thousands) 2002 2001 2002 2001
Benefit obligation at beginning of year $527,039 $510,763 $ 219,129 $ 172,799Service cost 10,605 13,178 3,723 3,243Interest cost 36,979 35,754 16,205 12,942Plan amendments 2,560 829 – (1,045)Actuarial losses (gains) 16,619 (1,475) 37,084 38,018Curtailments – – (18,272) 5,372Special termination benefits – – – 317Mergers, sales and closures (30,603) 2,835 – –Benefits paid (38,092) (34,845) (15,456) (12,517)
Benefit obligation at end of year 525,107 527,039 242,413 219,129
Fair value of plan assets at beginning of year 615,269 666,906 22,198 35,413Actual return on plan assets (67,821) (19,458) (3,909) (3,084)Employer contribution 1,215 2,666 – –Mergers, sales and closures (39,181) – – –Benefits paid (38,092) (34,845) (8,476) (10,131)
Fair value of plan assets at end of year 471,390 615,269 9,813 22,198
Funded status (53,717) 88,230 (232,600) (196,931)Unrecognized prior service cost (benefit) 16,411 29,347 (8,614) (9,254)Unrecognized net loss (gain) 109,399 (53,270) 64,820 43,308Unrecognized net transition asset (37) (75) – –
Prepaid (accrued) benefit cost $ 72,056 $ 64,232 $(176,394) $(162,877)
The projected benefit obligation, accumulated benefit obliga-tion and value of plan assets for the pension plans with accumulated benefit obligations in excess of plan assets were$262.4 million, $259.1 million and $196.5 million, respec-tively, at December 31, 2002, and $36.9 million, $33.2 millionand $18.7 million, respectively, at December 31, 2001.
As of December 31, 2002, $70.6 million of minimum
pension liabilities for underfunded plans was included inother long-term liabilities, with corresponding intangibleassets of $16.2 million and a charge of $33.2 million to stockholders’ equity, which is net of deferred taxes of $21.2 million. As of December 31, 2001, minimum pensionliabilities totaled $2.2 million, with corresponding intangibleassets of the same amount.
3 2
10D I S C L O S U R E S A B O U T F A I R V A L U E 11 O F F I N A N C I A L I N S T R U M E N T S
Estimated fair values of our financial instruments are as follows:2002 2001
Carrying Fair Carrying Fair(Dollars in thousands) Amount Value Amount Value
Cash, restricted cash and short-term investments $ 26,042 $ 26,042 $ 136,184 $ 136,184
Current notes payable 40,000 40,000 – –Long-term debt 638,252 659,818 1,150,125 1,160,243Interest rate swaps 8,491 8,491 1,294 1,294
For short-term investments, current notes payable and interestrate swaps, the carrying amount approximates fair value. The fair value of our long-term debt is estimated based upon the quoted market prices for the same or similar debtissues. The amount of long-term debt for which there is noquoted market price is immaterial and the carrying amountapproximates fair value.
11R E T I R E M E N T , S A V I N G S A N D 12 O T H E R P O S T R E T I R E M E N T B E N E F I T P L A N S
Substantially all of our employees are eligible to participate in 401(k) savings plans and are covered by noncontributorydefined benefit pension plans. These include both company-sponsored and multi-employer plans. In 2002, 2001 and 2000we made matching 401(k) contributions on behalf of employeesof $7.3 million, $8.9 million and $9.8 million, respectively. We also provide benefits under company-sponsored definedbenefit retiree health care and life insurance plans, whichcover certain salaried and hourly employees. Most of the retiree health care plans require retiree contributions and contain other cost sharing features. The retiree life insuranceplans are primarily noncontributory.
The change in benefit obligation, change in plan assets,funded status and related balance sheet amounts for company-sponsored benefit plans are as follows:
P O T L A T C H C O R P O R A T I O N A N D C O N S O L I D A T E D S U B S I D I A R I E S
or decrease in the swap is offset by a corresponding decrease or increase in the value of the underlying debt instrument.
Payments due on long-term debt during each of the five yearssubsequent to December 31, 2002, are as follows:(Dollars in thousands)
2003 $15,6072004 6072005 1,6082006 2,9582007 6,759
9 A C C O U N T S P A Y A B L E A N D A C C R U E D L I A B I L I T I E S
(Dollars in thousands) 2002 2001
Trade accounts payable $ 44,371 $ 37,184Accrued wages, salaries and employee benefits 51,015 45,369Accrued taxes other than taxes on income 11,066 11,977Accrued interest 15,005 19,710Accrued taxes on income 13,059 15,233Book overdrafts 16,030 25,982Accrued restructuring, mill closure
and divestiture charges 8,659 1,203Other 30,247 33,258
$189,452 $189,916
10 O T H E R L O N G - T E R M O B L I G A T I O N S
(Dollars in thousands) 2002 2001
Postretirement benefits $176,394 $162,877Pension and related liabilities 69,747 22,795Other 15,024 9,586
$261,165 $195,258
N O T E S T O C O N S O L I D A T E D F I N A N C I A L S T A T E M E N T S

A summary of the status of our stock options as of December 31, 2002, 2001 and 2000 and changes during those years is presented below:
2002 2001 2000
Weighted Avg. Weighted Avg. Weighted Avg.Options Shares Exercise Price Shares Exercise Price Shares Exercise Price
Outstanding at January 1 2,993,000 $38.63 2,664,025 $40.41 2,529,850 $41.97Granted 378,300 24.87 488,275 28.69 469,575 32.06Shares exercised (25,050) 32.06 (750) 32.63 (18,900) 29.96SARs exercised – – (4,050) 32.63 (16,400) 30.37Canceled or expired (509,893) 39.67 (154,500) 38.08 (300,100) 41.65
Outstanding at December 31 2,836,357 36.67 2,993,000 38.63 2,664,025 40.41
Options exercisable 2,263,594 39.33 2,287,312 41.38 1,984,437 42.29Options outstanding which include a stock appreciation right 78,600 120,350 142,225Shares reserved for future grants 793,963 834,145 1,248,680Fair value of options granted during the year $7.20 $10.02 $5.77
N O T E S T O C O N S O L I D A T E D F I N A N C I A L S T A T E M E N T S
3 5
P O T L A T C H C O R P O R A T I O N A N D C O N S O L I D A T E D S U B S I D I A R I E S
N O T E S T O C O N S O L I D A T E D F I N A N C I A L S T A T E M E N T S
3 4
P O T L A T C H C O R P O R A T I O N A N D C O N S O L I D A T E D S U B S I D I A R I E S
We exited our Printing Papers segment in May 2002 when a majority of the segment’s assets were sold to a domestic sub-sidiary of Sappi Limited. We also closed and sold a hardwoodsawmill during the third quarter of 2002. Prior year amountspresented in the tables below have been adjusted for these discontinued operations.
The reporting segments follow the same accounting policiesused for our consolidated financial statements and described in the summary of significant accounting policies with theexception of the valuation of inventories. All segment inven-tories are reported using the average cost method and the LIFO reserve is recorded at the corporate level. Managementevaluates a segment’s performance based upon profit or lossfrom operations before income taxes. Intersegment sales ortransfers are recorded based on prevailing market prices.
The following table summarizes information about stock options outstanding at December 31, 2002:Options Outstanding Options Exercisable
Number Weighted Avg. Weighted Number WeightedOutstanding Remaining Avg. Exercise Exercisable Avg. Exercise
Range of Exercise Prices at 12/31/02 Contractual Life Price at 12/31/02 Price
$23.88 to $29.32 775,850 9.49 years $26.82 203,087 $28.69$32.06 to $37.75 813,857 6.04 years 34.93 813,857 34.93$41.25 to $48.25 1,246,650 4.44 years 43.93 1,246,650 43.93
$23.88 to $48.25 2,836,357 6.28 years 36.67 2,263,594 39.33
14 S E G M E N T I N F O R M A T I O N
As of December 31, 2002, our operations were divided intothree reporting segments: Resource, Wood Products and Pulpand Paper, based upon similarities in product lines, manufac-turing processes, marketing and management of our businesses.The Resource segment manages our timberland base, provideswood fiber to the manufacturing segments and sells wood fiberto third parties. The Wood Products segment produces orientedstrand board, lumber, plywood and particleboard. The Pulp and Paper segment produces paperboard, consumer tissue andpulp. As a result of management changes effective in January2003, the Pulp and Paper segment was split into two separatebusiness segments, the Consumer Products segment and thePulp and Paperboard segment. In 2003, results for these twosegments will be reported separately, with prior year amountsreclassified for comparative purposes.
dividend yield of 2.41, 2.09 and 5.43 percent; stock volatility of .2538, .275 and .2707; risk free rate of return of 4.17, 5.28 and 5.21 percent; and expected term of 10 years for all grants.
The fair value of each option grant is estimated on the date of grantusing the Black-Scholes option-pricing model with the followingassumptions used for grants in 2002, 2001 and 2000, respectively:
Weighted average assumptions as of December 31 were:Pension Benefit Plans Other Postretirement Benefit Plans
2002 2001 2000 2002 2001 2000
Discount rate 6.75% 7.25% 7.25% 6.75% 7.25% 7.25%Expected return on plan assets 9.50% 9.50% 9.50% 9.00% 9.00% 9.00%Rate of salaried compensation increase 4.00% 5.00% 5.00% –% –% –%
The health care cost trend rate assumption used in determiningthe accumulated postretirement benefit obligation is 9.00%for 2002. The rate is assumed to decrease one percent annuallyto 6.00% in 2005 and remain at that level thereafter. Thisassumption has a significant effect on the amounts reported.A one percentage point change in the health care cost trendrates would have the following effects:(Dollars in thousands) 1% Increase 1% Decrease
Effect on total of service and interestcost components $ 2,650 $ (2,212)
Effect on postretirement benefit obligation 27,393 (23,272)
Hourly employees at two of our manufacturing facilities par-ticipate in a multi-employer defined benefit pension plan, the Paper, Allied-Industrial, Chemical and Energy WorkersInternational Union (PACE) Pension Fund, to which we makecontributions. We also make contributions to a trust fund estab-lished to provide retiree medical benefits for these employees,which is managed by PACE. Company contributions to theseplans in 2002, 2001 and 2000 amounted to $6.2 million, $6.1 million and $5.2 million, respectively.
13 S T O C K C O M P E N S A T I O N P L A N S
We currently have three fixed stock option plans under whichoptions are issued and outstanding. All of these plans havereceived shareholder approval. Options are granted with anexercise price equal to market value at the grant date and prior to 1995 may have included a stock appreciation right.Options may also be issued in the form of restricted stock andother share-based awards, none of which were outstanding atDecember 31, 2002. Options are fully exercisable after twoyears and expire not later than 10 years from the date of grant.We were originally authorized to issue up to 1.5 million shares,1.7 million shares and 1.4 million shares under our 1989 StockIncentive Plan, 1995 Stock Incentive Plan and 2000 StockIncentive Plan, respectively. At December 31, 2002, no shareswere available for future use under the 1989 Stock IncentivePlan, while approximately 5,000 shares and 789,000 shareswere authorized for future use under the 1995 and 2000 StockIncentive Plans, respectively.
The pension benefits presented above exclude an estimatedcost of $.2 million for a salaried workforce reduction in2002, a cost of $2.7 million in 2001 for an hourly workforcereduction program and $1.9 million in 2000 for a salariedworkforce reduction program and a mill closure, which are included in “Restructuring and other charges” in theStatements of Operations. The postretirement costs presentedabove exclude an estimated cost of $2.0 million for a salaried workforce reduction in 2002, $.5 million in 2001 for an hourly workforce reduction program and $3.9 millionin 2000 for a salaried workforce reduction program, which are included in “Restructuring and other charges” in theStatements of Operations.
The pension benefits presented above also do not reflect a cost of $11.0 million related to the sale of Printing Paperssegment assets and subsequent closure of a printing papersfacility, as well as $.2 million for the sale of a lumber mill.Postretirement costs of $.2 million and $.2 million, respec-tively, as a result of these events are also excluded from thecosts presented above. The combined costs of $11.6 millionare included in “Loss from discontinued operations.”
Due to our recent exit from the coated printing papersbusiness and the resulting reduction in the number ofsalaried and hourly employees, we believe that our relativecosts should decline in the future for pension and post-retirement benefits.
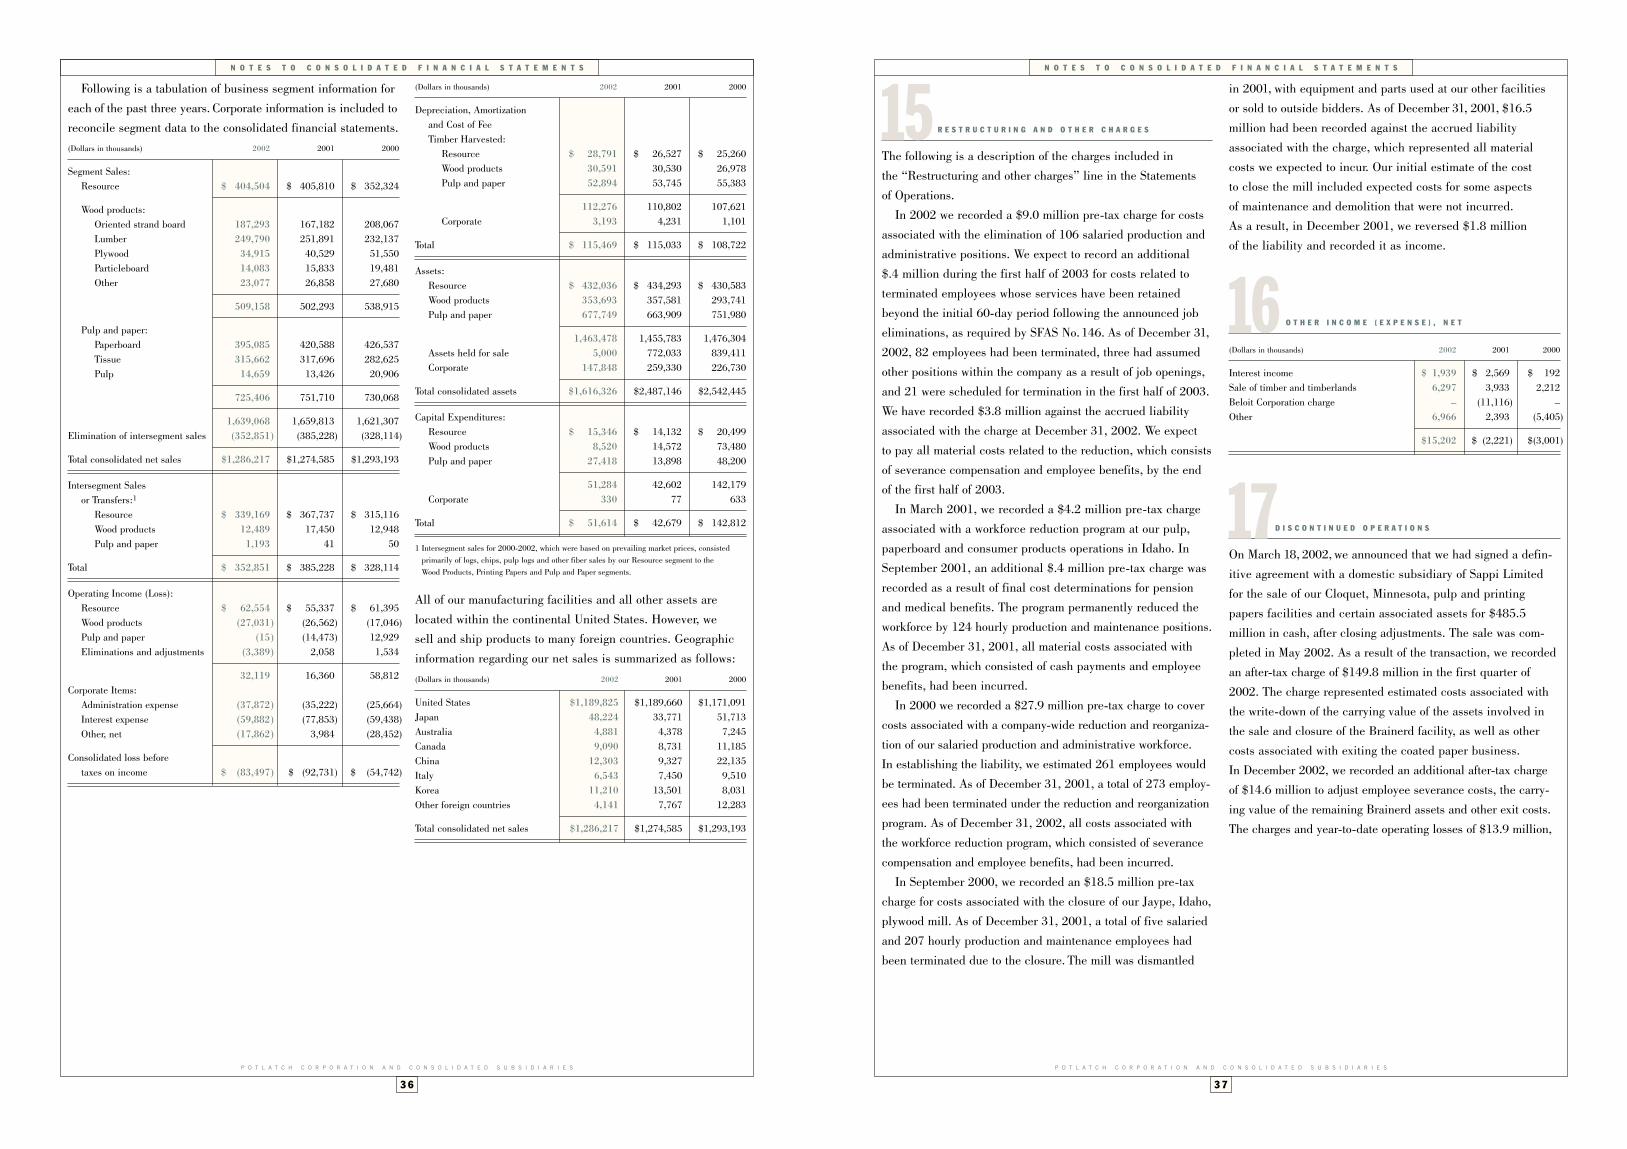
N O T E S T O C O N S O L I D A T E D F I N A N C I A L S T A T E M E N T S
3 7
P O T L A T C H C O R P O R A T I O N A N D C O N S O L I D A T E D S U B S I D I A R I E S
N O T E S T O C O N S O L I D A T E D F I N A N C I A L S T A T E M E N T S
3 6
P O T L A T C H C O R P O R A T I O N A N D C O N S O L I D A T E D S U B S I D I A R I E S
15 R E S T R U C T U R I N G A N D O T H E R C H A R G E S
The following is a description of the charges included in the “Restructuring and other charges” line in the Statements of Operations.
In 2002 we recorded a $9.0 million pre-tax charge for costsassociated with the elimination of 106 salaried production andadministrative positions. We expect to record an additional $.4 million during the first half of 2003 for costs related to terminated employees whose services have been retainedbeyond the initial 60-day period following the announced jobeliminations, as required by SFAS No.146. As of December 31,2002, 82 employees had been terminated, three had assumedother positions within the company as a result of job openings,and 21 were scheduled for termination in the first half of 2003.We have recorded $3.8 million against the accrued liabilityassociated with the charge at December 31, 2002. We expect to pay all material costs related to the reduction, which consistsof severance compensation and employee benefits, by the endof the first half of 2003.
In March 2001, we recorded a $4.2 million pre-tax chargeassociated with a workforce reduction program at our pulp,paperboard and consumer products operations in Idaho. InSeptember 2001, an additional $.4 million pre-tax charge wasrecorded as a result of final cost determinations for pension and medical benefits. The program permanently reduced theworkforce by 124 hourly production and maintenance positions. As of December 31, 2001, all material costs associated with the program, which consisted of cash payments and employeebenefits, had been incurred.
In 2000 we recorded a $27.9 million pre-tax charge to covercosts associated with a company-wide reduction and reorganiza-tion of our salaried production and administrative workforce. In establishing the liability, we estimated 261 employees wouldbe terminated. As of December 31, 2001, a total of 273 employ-ees had been terminated under the reduction and reorganizationprogram. As of December 31, 2002, all costs associated with the workforce reduction program, which consisted of severancecompensation and employee benefits, had been incurred.
In September 2000, we recorded an $18.5 million pre-taxcharge for costs associated with the closure of our Jaype, Idaho,plywood mill. As of December 31, 2001, a total of five salariedand 207 hourly production and maintenance employees hadbeen terminated due to the closure. The mill was dismantled
in 2001, with equipment and parts used at our other facilities or sold to outside bidders. As of December 31, 2001, $16.5 million had been recorded against the accrued liability associated with the charge, which represented all material costs we expected to incur. Our initial estimate of the cost to close the mill included expected costs for some aspects of maintenance and demolition that were not incurred. As a result, in December 2001, we reversed $1.8 million of the liability and recorded it as income.
16 O T H E R I N C O M E ( E X P E N S E ) , N E T
(Dollars in thousands) 2002 2001 2000
Interest income $ 1,939 $ 2,569 $ 192Sale of timber and timberlands 6,297 3,933 2,212Beloit Corporation charge – (11,116) –Other 6,966 2,393 (5,405)
$15,202 $ (2,221) $(3,001)
17D I S C O N T I N U E D O P E R A T I O N S
On March 18, 2002, we announced that we had signed a defin-itive agreement with a domestic subsidiary of Sappi Limited for the sale of our Cloquet, Minnesota, pulp and printing papers facilities and certain associated assets for $485.5 million in cash, after closing adjustments. The sale was com-pleted in May 2002. As a result of the transaction, we recordedan after-tax charge of $149.8 million in the first quarter of2002. The charge represented estimated costs associated withthe write-down of the carrying value of the assets involved inthe sale and closure of the Brainerd facility, as well as othercosts associated with exiting the coated paper business. In December 2002, we recorded an additional after-tax chargeof $14.6 million to adjust employee severance costs, the carry-ing value of the remaining Brainerd assets and other exit costs. The charges and year-to-date operating losses of $13.9 million,
Following is a tabulation of business segment information foreach of the past three years. Corporate information is included toreconcile segment data to the consolidated financial statements.(Dollars in thousands) 2002 2001 2000
Segment Sales:Resource $ 404,504 $ 405,810 $ 352,324
Wood products:Oriented strand board 187,293 167,182 208,067Lumber 249,790 251,891 232,137Plywood 34,915 40,529 51,550Particleboard 14,083 15,833 19,481Other 23,077 26,858 27,680
509,158 502,293 538,915
Pulp and paper:Paperboard 395,085 420,588 426,537Tissue 315,662 317,696 282,625Pulp 14,659 13,426 20,906
725,406 751,710 730,068
1,639,068 1,659,813 1,621,307Elimination of intersegment sales (352,851) (385,228) (328,114)
Total consolidated net sales $1,286,217 $1,274,585 $1,293,193
Intersegment Sales or Transfers:1
Resource $ 339,169 $ 367,737 $ 315,116Wood products 12,489 17,450 12,948Pulp and paper 1,193 41 50
Total $ 352,851 $ 385,228 $ 328,114
Operating Income (Loss):Resource $ 62,554 $ 55,337 $ 61,395Wood products (27,031) (26,562) (17,046)Pulp and paper (15) (14,473) 12,929Eliminations and adjustments (3,389) 2,058 1,534
32,119 16,360 58,812Corporate Items:
Administration expense (37,872) (35,222) (25,664)Interest expense (59,882) (77,853) (59,438)Other, net (17,862) 3,984 (28,452)
Consolidated loss before taxes on income $ (83,497) $ (92,731) $ (54,742)
(Dollars in thousands) 2002 2001 2000
Depreciation, Amortization and Cost of Fee Timber Harvested:
Resource $ 28,791 $ 26,527 $ 25,260Wood products 30,591 30,530 26,978Pulp and paper 52,894 53,745 55,383
112,276 110,802 107,621Corporate 3,193 4,231 1,101
Total $ 115,469 $ 115,033 $ 108,722
Assets:Resource $ 432,036 $ 434,293 $ 430,583Wood products 353,693 357,581 293,741Pulp and paper 677,749 663,909 751,980
1,463,478 1,455,783 1,476,304Assets held for sale 5,000 772,033 839,411Corporate 147,848 259,330 226,730
Total consolidated assets $1,616,326 $2,487,146 $2,542,445
Capital Expenditures:Resource $ 15,346 $ 14,132 $ 20,499Wood products 8,520 14,572 73,480Pulp and paper 27,418 13,898 48,200
51,284 42,602 142,179Corporate 330 77 633
Total $ 51,614 $ 42,679 $ 142,812
1 Intersegment sales for 2000-2002, which were based on prevailing market prices, consisted primarily of logs, chips, pulp logs and other fiber sales by our Resource segment to the Wood Products, Printing Papers and Pulp and Paper segments.
All of our manufacturing facilities and all other assets arelocated within the continental United States. However, we sell and ship products to many foreign countries. Geographicinformation regarding our net sales is summarized as follows:(Dollars in thousands) 2002 2001 2000
United States $1,189,825 $1,189,660 $1,171,091Japan 48,224 33,771 51,713Australia 4,881 4,378 7,245Canada 9,090 8,731 11,185China 12,303 9,327 22,135Italy 6,543 7,450 9,510Korea 11,210 13,501 8,031Other foreign countries 4,141 7,767 12,283
Total consolidated net sales $1,286,217 $1,274,585 $1,293,193

3 9
I N D E P E N D E N T A U D I T O R S ’ R E P O R T
P O T L A T C H C O R P O R A T I O N A N D C O N S O L I D A T E D S U B S I D I A R I E S
N O T E S T O C O N S O L I D A T E D F I N A N C I A L S T A T E M E N T S
3 8
P O T L A T C H C O R P O R A T I O N A N D C O N S O L I D A T E D S U B S I D I A R I E S
T H E B O A R D O F D I R E C T O R S :
We have audited the accompanying balance sheets of PotlatchCorporation and consolidated subsidiaries as of December 31,2002 and 2001 and the related statements of operations andcomprehensive loss, stockholders’ equity, and cash flows foreach of the years in the three-year period ended December 31,2002. These financial statements are the responsibility of thecompany’s management. Our responsibility is to express anopinion on these financial statements based on our audits.
We conducted our audits in accordance with auditing standards generally accepted in the United States of America.Those standards require that we plan and perform the audit to obtain reasonable assurance about whether the financialstatements are free of material misstatement. An audit includesexamining, on a test basis, evidence supporting the amounts and disclosures in the financial statements. An audit alsoincludes assessing the accounting principles used and signi-ficant estimates made by management, as well as evaluating
the overall financial statement presentation. We believe that our audits provide a reasonable basis for our opinion.
In our opinion the financial statements referred to above present fairly, in all material respects, the financialposition of Potlatch Corporation and consolidated subsidiariesas of December 31, 2002 and 2001 and the results of theiroperations and their cash flows for each of the years in thethree-year period ended December 31, 2002, in conformitywith accounting principles generally accepted in the United States of America.
KPMG LLPPortland, OregonJanuary 24, 2003
18 F I N A N C I A L R E S U L T S B Y Q U A R T E R ( U N A U D I T E D )
(Dollars in thousands – except per-share amounts) Three Months Ended
March 31 June 30 September 30 December 31
2002 2001 2002 2001 2002 2001 2002 2001*
Net sales $318,189 $312,872 $333,178 $335,026 $324,060 $337,903 $310,790 $288,784
Costs and expenses:Depreciation, amortization
and cost of fee timber harvested 30,484 27,242 27,244 27,630 29,067 30,270 28,674 29,891Materials, labor and other
operating expenses 273,140 293,821 278,119 276,392 271,910 269,599 278,896 243,329Selling, general and
administrative expenses 22,019 20,194 20,928 20,848 20,814 22,037 19,416 23,239Restructuring and other charges – 4,217 – – – 353 8,963 (1,820)
325,643 345,474 326,291 324,870 321,791 322,259 335,949 294,639
Earnings (loss) from operations $ (7,454) $ (32,602) $ 6,887 $ 10,156 $ 2,269 $ 15,644 $ (25,159) $ (5,855)
Loss from discontinued operations, net of tax $(152,443) $ (1,590) $ (13,532) $ (5,884) $ (2,051) $ (4,262) $ (15,422) $ (11,143)
Net loss $(167,381) $ (31,408) $ (20,089) $ (9,789) $ (12,433) $ (6,551) $ (34,478) $ (31,697)
Net loss per common share:Basic $(5.90) $(1.11) $(.70) $(.35) $(.43) $(.23) $(1.20) $(1.12)Diluted (5.90) (1.11) (.70) (.35) (.43) (.23) (1.20) (1.12)
*Includes an $11.1 million pre-tax charge related to Beloit Corporation and a $2.2 million pre-tax charge related to the insolvency of a pulp broker.
after tax, are presented as discontinued operations in theStatements of Operations, as required by SFAS No. 144.
In conjunction with the sale, we closed our Brainerd printing papers mill. In late October 2002 we entered into amemorandum of understanding with a buyer for the sale of theBrainerd facility. The facility was sold on February 28, 2003 for $4.44 million in cash.
On June 3, 2002, we announced that we would close ourBradley hardwood mill in Warren, Arkansas, and exit the hardwood lumber business. We sold the facility in August2002. An initial after-tax charge of $5.7 million was recordedfor estimated asset write-down and closure costs. In December2002, we reversed $1.6 million of the initial charge, after tax,to reflect actual costs incurred for the closure and sale. The net charge and year-to-date operating losses of $1.0 million, after tax, are also presented as discontinued operations in the Statements of Operations, as required by SFAS No. 144.
The assets and liabilities of the Printing Papers segment andthe Bradley lumber mill are presented in the Balance Sheetsunder the captions “Assets held for sale” and “Liabilities related to assets held for sale.” The carrying amounts of themajor classes of these assets and liabilities at December 31were as follows:
(Dollars in thousands) 2002 2001
Assets:Cash $ – $ 292Receivables, net – 40,715Inventories – 76,858Land, other than timberlands 108 374Plant and equipment, net 4,892 653,785Other assets – 9
Total assets held for sale $5,000 $772,033
Liabilities: Accounts payable and accrued liabilities $ 12 $ 33,933

F I N A N C I A L R E V I E W
4 1
P O T L A T C H C O R P O R A T I O N A N D C O N S O L I D A T E D S U B S I D I A R I E S
F I N A N C I A L R E V I E W
4 0
P O T L A T C H C O R P O R A T I O N A N D C O N S O L I D A T E D S U B S I D I A R I E S
E L E V E N - Y E A R R E C O R D
For the years ended December 31
(Dollars in thousands – except per-share amounts) 2002 2001 2000 1999 1998 1997 1996 1995 1994 1993 1992
E L E V E N - Y E A R S U M M A R Y O F C O N S O L I D A T E D O P E R A T I O N S
Net sales $1,286,217 $1,274,585 $1,293,193 $1,343,773 $1,243,506 $1,693,371 $1,675,756 $1,721,774 $1,546,153 $1,436,236 $1,392,842
Costs and expenses:
Depreciation, amortization and cost of fee timber harvested 115,469 115,033 108,722 107,481 108,101 149,785 141,521 137,031 138,251 123,544 107,165
Materials, labor and other operating expenses 1,102,065 1,083,141 1,044,894 1,007,502 952,394 1,344,166 1,307,434 1,274,570 1,196,386 1,131,642 1,073,117
Selling, general and administrative expenses 83,177 86,318 85,469 98,663 96,311 106,450 104,114 90,569 82,799 83,958 83,409
Restructuring and other charges 8,963 2,750 46,411 – – – – – – – –
1,309,674 1,287,242 1,285,496 1,213,646 1,156,806 1,600,401 1,553,069 1,502,170 1,417,436 1,339,144 1,263,691
Earnings (loss) from operations (23,457) (12,657) 7,697 130,127 86,700 92,970 122,687 219,604 128,717 97,092 129,151
Interest expense (59,882) (77,853) (59,438) (45,442) (49,744) (46,124) (43,869) (47,976) (51,137) (46,230) (34,902)
Other income (expense), net (158) (2,221) (3,001) (475) 8,991 7,789 7,508 (689) (1,619) 14,142 30,365
Earnings (loss) before taxes on income, cumulative effect
of accounting changes and extraordinary item (83,497) (92,731) (54,742) 84,210 45,947 54,635 86,326 170,939 75,961 65,004 124,614
Provision (benefit) for taxes on income (32,564) (36,165) (21,349) 32,000 16,541 18,576 24,792 62,393 26,966 26,665 45,700
Tax rate 39.0% 39.0% 39.0% 38.0% 36.0% 34.0% 28.7% 36.5% 35.5% 41.0% 36.7%
Earnings (loss) from continuing operations before cumulative
effect of accounting changes and extraordinary item (50,933) (56,566) (33,393) 52,210 29,406 36,059 61,534 108,546 48,995 38,339 78,914
Cumulative effect of accounting changes, net of tax – – – – – – – – – (50,292) –
Extraordinary item, net of tax – – – – – – (3,445) – – – –
Discontinued operations, net of tax (183,448) (22,879) 179 (11,263) 7,826 – – – – – –
Net earnings (loss) $ (234,381) $ (79,445) $ (33,214) $ 40,947 $ 37,232 $ 36,059 $ 58,089 $ 108,546 $ 48,995 $ (11,953) $ 78,914
F I N A N C I A L R E T U R N S
Percent return on beginning of the year common stockholders’ equity1 (33.1)% (9.8)% (3.6)% 4.4% 3.9% 3.8% 6.2% 12.0% 5.4% 4.0% 8.6%
Percent return on net sales1 (18.2)% (6.2)% (2.6)% 3.0% 3.0% 2.1% 3.5% 6.3% 3.2% 2.7% 5.7%P E R C O M M O N S H A R E
Basic net earnings (loss)1 $ (8.23) $ (2.81) $ (1.16) $ 1.41 $ 1.28 $ 1.25 $ 2.01 $ 3.72 $ 1.68 $ 1.31 $ 2.71
Net cash provided by operations $ (2.43) $ 1.22 $ 2.54 $ 6.61 $ 5.02 $ 5.35 $ 7.78 $ 8.49 $ 6.26 $ 5.90 $ 5.04
Cash dividends $ .60 $ 1.17 $ 1.74 $ 1.74 $ 1.74 $ 1.71 $ 1.67 $ 1.615 $ 1.57 $ 1.515 $ 1.425
Common stockholders’ equity at year end $ 15.07 $ 24.98 $ 28.69 $ 31.79 $ 32.19 $ 32.82 $ 33.06 $ 32.59 $ 30.85 $ 30.86 $ 32.79C O M M O N S H A R E S ( I N T H O U S A N D S )
Average shares outstanding 28,462 28,282 28,523 28,947 29,000 28,930 28,888 29,157 29,217 29,184 29,110
Outstanding at year end, net of treasury stock 28,579 28,311 28,346 28,972 28,919 28,995 28,866 28,962 29,224 29,199 29,144
A P P R O X I M A T E N U M B E R O F C O M M O N S T O C K H O L D E R S A T Y E A R E N D 1,900 2,900 3,100 3,200 3,400 3,600 3,700 3,300 3,500 3,600 3,600
P R I C E R A N G E O F C O M M O N S T O C K
High $ 36.13 $ 36.22 $ 44.88 $ 45.50 $ 48.38 $ 52.75 $ 44.88 $ 44.13 $ 49.50 $ 51.88 $ 50.00
Low $ 23.88 $ 24.90 $ 28.56 $ 32.50 $ 31.00 $ 39.00 $ 35.13 $ 37.13 $ 35.50 $ 38.25 $ 36.75E M P L O Y M E N T
Approximate number of employees at year end 4,300 6,300 6,500 7,000 6,800 6,700 6,700 6,600 6,700 7,000 7,000
Wages, salaries and cost of employee benefits $ 309,032 $ 308,343 $ 325,417 $ 332,973 $ 312,972 $ 417,422 $ 410,052 $ 405,016 $ 391,160 $ 389,597 $ 376,537S E L E C T E D P R O D U C T I O N S T A T I S T I C S ( I N T H O U S A N D S )
Oriented strand board (square feet, 3⁄8" basis) 1,282,000 1,134,000 1,096,000 1,101,000 1,077,000 977,000 1,017,000 1,063,000 1,080,000 1,078,000 1,066,000
Lumber, domestic (board feet, dry) 688,000 685,000 616,000 590,000 561,000 534,000 491,000 441,000 408,000 420,000 406,000
Plywood, domestic (square feet, 3⁄8" basis) 123,000 141,000 172,000 222,000 191,000 254,000 240,000 289,000 298,000 312,000 331,000
Particleboard (square feet, 3⁄4" basis) 63,000 67,000 69,000 70,000 69,000 67,000 63,000 67,000 67,000 64,000 68,000
Pulp (air-dry tons) 768 716 732 741 747 899 878 873 816 811 845
Paperboard (tons) 629 596 593 596 620 614 575 582 549 545 563
Tissue paper (tons) 174 175 169 162 154 150 143 144 135 131 86
1 The 1993 return on equity, return on sales and loss per share after accounting changes were (1.2)%, (.8)% and $(.41), respectively.
Note: Certain 2001-1998 amounts have been restated to conform to the 2002 presentation.
E L E V E N - Y E A R R E C O R D

F I N A N C I A L R E V I E W
4 3
P O T L A T C H C O R P O R A T I O N A N D C O N S O L I D A T E D S U B S I D I A R I E S
F I N A N C I A L R E V I E W
4 2
P O T L A T C H C O R P O R A T I O N A N D C O N S O L I D A T E D S U B S I D I A R I E S
E L E V E N - Y E A R R E C O R DE L E V E N - Y E A R R E C O R D
For the years ended December 31
(Dollars in thousands) 2002 2001 2000 1999 1998 1997 1996 1995 1994 1993 1992
E L E V E N - Y E A R S U M M A R Y O F C O N S O L I D A T E D F U N D S F L O W
S O U R C E O F F U N D S
Net earnings (loss) $ (234,381) $ (79,445) $ (33,214) $ 40,947 $ 37,232 $ 36,059 $ 58,089 $ 108,546 $ 48,995 $ (11,953) $ 78,914
Depreciation, amortization and cost of fee timber harvested 115,469 115,033 108,722 107,481 108,101 149,785 141,521 137,031 138,251 123,544 107,165
Deferred taxes (153,956) (83,351) 18,317 21,953 16,757 13,493 24,618 29,153 10,628 18,069 7,291
Proceeds from long-term debt – 450,000 100,000 99,935 – 50,000 197,543 124,785 – 79,525 75,124
Issuance of treasury stock 8,146 6,620 952 1,250 550 2,985 722 193 542 1,181 2,366
Decrease (increase) in investments of unexpended revenue bond funds – – – 335 479 1,811 20,920 (23,545) 1,395 (1,340) 2,375
Decrease (increase) in working capital other than cash and short-term investments 596,549 61,186 34,099 (96,721) (39,063) 14,971 (87,738) 69,009 14,983 19,312 (34,354)
Total source of funds 331,827 470,043 228,876 175,180 124,056 269,104 355,675 445,172 214,794 228,338 238,881
A P P L I C A T I O N O F F U N D S
Dividends 17,071 33,108 49,698 50,362 50,472 49,462 48,254 47,096 45,870 44,214 41,476
Additions to plant and properties 51,614 42,679 142,812 65,277 58,544 158,485 239,908 170,654 104,389 201,655 179,539
Reduction of long-term debt 394,877 234,027 249 110,250 9,967 – 141,627 142,126 73,658 6,603 3,929
Purchase of treasury stock – 10,453 25,892 – 3,261 – 5,042 11,285 – – –
Increase (decrease) in investments 2,343 2,428 3,143 (49,174) 25 50,004 48 773 (33,557) (18,828) 9,911
Other, net (23,936) 21,830 7,934 2,393 870 7,927 18,634 18,891 (4,139) (219) 12,575
Total application of funds 441,969 344,525 229,728 179,108 123,139 265,878 453,513 390,825 186,221 233,425 247,430
Increase (decrease) in funds $ (110,142) $ 125,518 $ (852) $ (3,928) $ 917 $ 3,226 $ (97,838) $ 54,347 $ 28,573 $ (5,087) $ (8,549)
Note: Certain 2001-1998 amounts have been restated to conform to the 2002 presentation.
At December 31
(Dollars in thousands) 2002 2001 2000 1999 1998 1997 1996 1995 1994 1993 1992
E L E V E N - Y E A R S U M M A R Y O F C O N S O L I D A T E D F I N A N C I A L P O S I T I O N
Current assets $ 347,764 $1,165,836 $1,184,151 $1,144,749 $ 997,509 $ 403,777 $ 378,111 $ 477,249 $ 371,318 $ 327,153 $ 331,845
Current liabilities 245,071 553,452 439,099 364,746 310,299 297,556 260,145 349,183 228,590 198,015 178,308
Working capital 102,693 612,384 745,052 780,003 687,210 106,221 117,966 128,066 142,728 129,138 153,537
Capital assets, at cost:
Plant and equipment, net 758,168 808,763 937,415 888,190 917,959 1,493,417 1,465,682 1,356,020 1,313,939 1,340,028 1,311,946
Timber, timberlands and logging facilities, net 396,426 395,668 333,249 335,194 338,617 342,503 349,466 352,321 346,199 343,044 279,669
Unexpended revenue bond funds – – – – 335 814 2,625 23,545 – 1,395 55
Other noncurrent assets, net 113,968 116,879 87,630 78,367 122,886 124,625 69,795 56,176 49,773 74,032 92,232
Total net assets $1,371,255 $1,933,694 $2,103,346 $2,081,754 $2,067,007 $2,067,580 $2,005,534 $1,916,128 $1,852,639 $1,887,637 $1,837,439
C A P I T A L I Z A T I O N
Long-term debt (noncurrent portion) $ 622,645 $ 820,522 $ 801,549 $ 701,798 $ 712,113 $ 722,080 $ 672,048 $ 616,132 $ 633,473 $ 707,131 $ 634,209
Other long-term obligations 261,165 195,258 184,147 172,986 163,453 155,336 148,092 145,022 147,877 120,388 22,299
Deferred taxes 56,654 210,610 293,961 275,644 253,691 236,934 223,441 198,823 169,670 159,042 225,350
Put options – – 10,453 10,287 6,844 1,638 7,758 12,247 – – –
Stockholders’ equity 430,791 707,304 813,236 921,039 930,906 951,592 954,195 943,904 901,619 901,076 955,581
Total capitalization $1,371,255 $1,933,694 $2,103,346 $2,081,754 $2,067,007 $2,067,580 $2,005,534 $1,916,128 $1,852,639 $1,887,637 $1,837,439
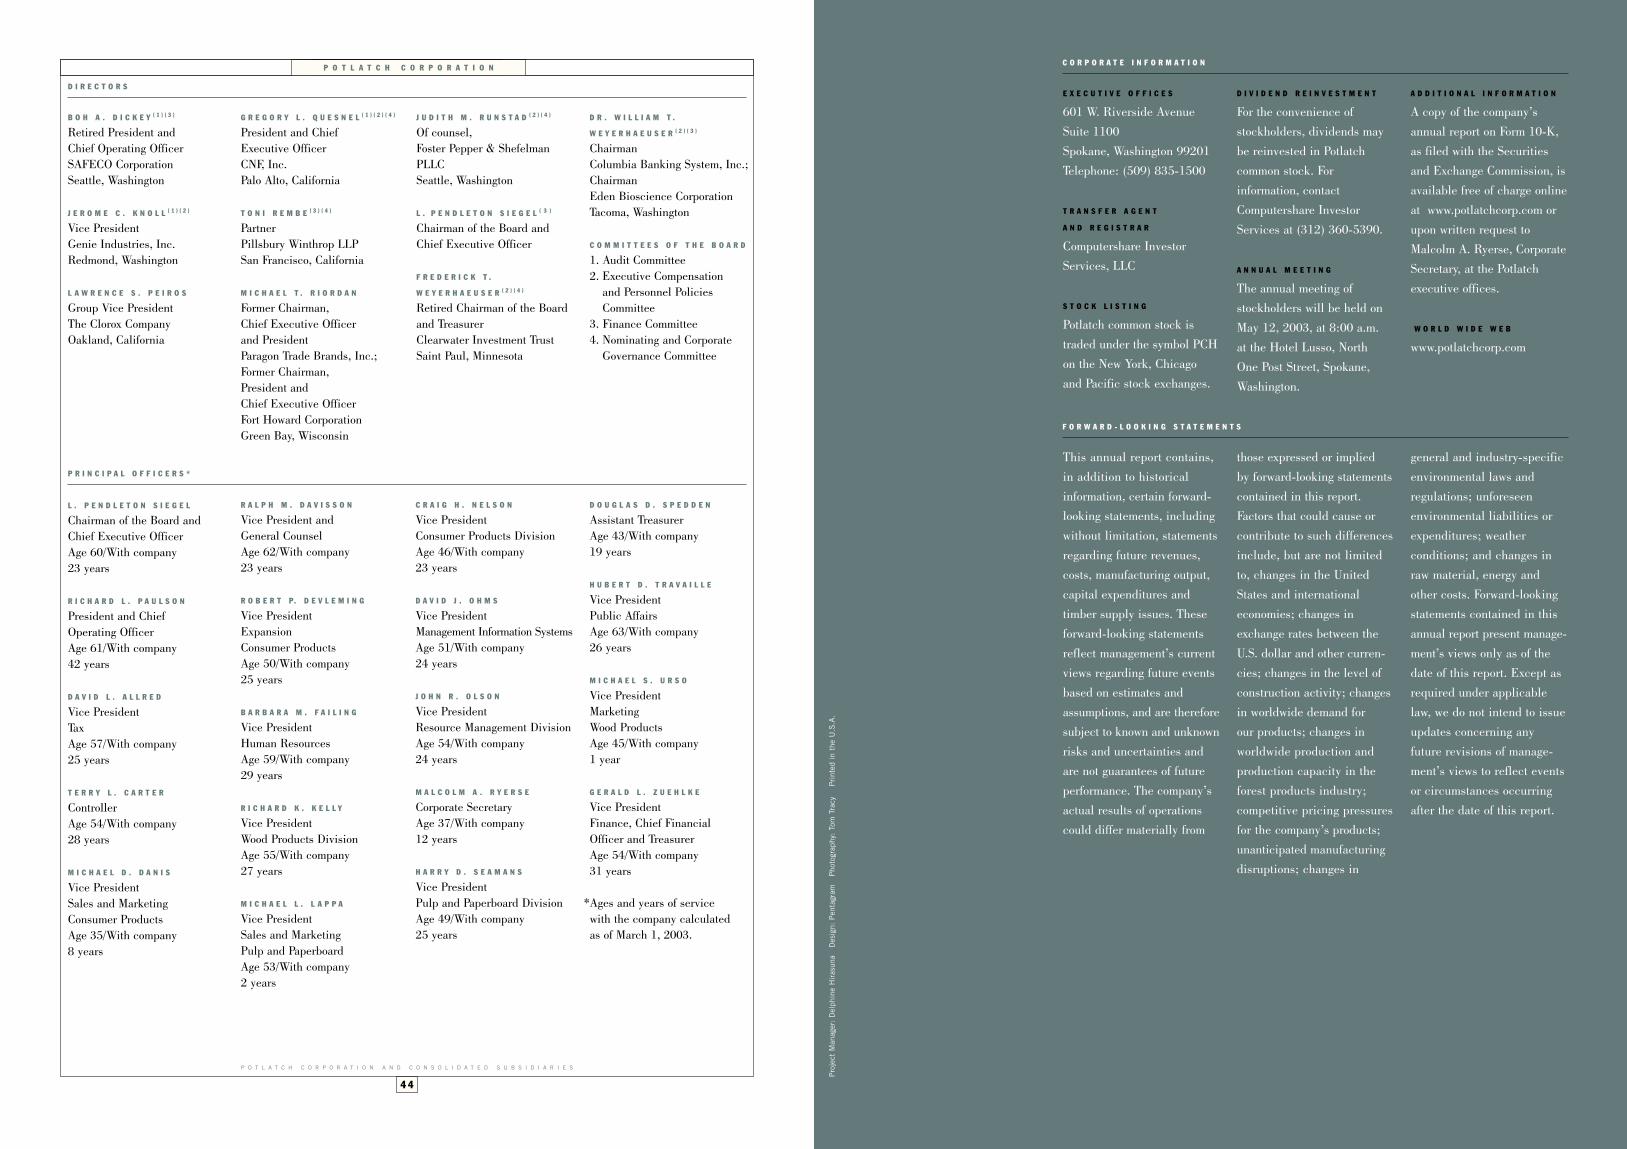
F I N A N C I A L R E V I E W
4 4
P O T L A T C H C O R P O R A T I O N A N D C O N S O L I D A T E D S U B S I D I A R I E S
P O T L A T C H C O R P O R A T I O N
B O H A . D I C K E Y ( 1 ) ( 3 )
Retired President andChief Operating OfficerSAFECO CorporationSeattle, Washington
J E R O M E C . K N O L L ( 1 ) ( 2 )
Vice President Genie Industries, Inc.Redmond, Washington
L A W R E N C E S . P E I R O S
Group Vice President The Clorox CompanyOakland, California
L . P E N D L E T O N S I E G E L
Chairman of the Board and Chief Executive OfficerAge 60/With company 23 years
R I C H A R D L . P A U L S O N
President and Chief Operating OfficerAge 61/With company 42 years
D A V I D L . A L L R E D
Vice PresidentTaxAge 57/With company 25 years
T E R R Y L . C A R T E R
ControllerAge 54/With company 28 years
M I C H A E L D . D A N I S
Vice PresidentSales and MarketingConsumer ProductsAge 35/With company8 years
D I R E C T O R S
P R I N C I P A L O F F I C E R S *
G R E G O R Y L . Q U E S N E L ( 1 ) ( 2 ) ( 4 )
President and Chief Executive OfficerCNF, Inc.Palo Alto, California
T O N I R E M B E ( 3 ) ( 4 )
PartnerPillsbury Winthrop LLPSan Francisco, California
M I C H A E L T . R I O R D A N
Former Chairman, Chief Executive Officer and PresidentParagon Trade Brands, Inc.;Former Chairman, President and Chief Executive OfficerFort Howard CorporationGreen Bay, Wisconsin
J U D I T H M . R U N S T A D ( 2 ) ( 4 )
Of counsel, Foster Pepper & ShefelmanPLLCSeattle, Washington
L . P E N D L E T O N S I E G E L ( 3 )
Chairman of the Board and Chief Executive Officer
F R E D E R I C K T .
W E Y E R H A E U S E R ( 2 ) ( 4 )
Retired Chairman of the Board and TreasurerClearwater Investment TrustSaint Paul, Minnesota
D R . W I L L I A M T .
W E Y E R H A E U S E R ( 2 ) ( 3 )
ChairmanColumbia Banking System, Inc.;ChairmanEden Bioscience CorporationTacoma, Washington
C O M M I T T E E S O F T H E B O A R D
1. Audit Committee2. Executive Compensation
and Personnel Policies Committee
3. Finance Committee4. Nominating and Corporate
Governance Committee
R A L P H M . D A V I S S O N
Vice President and General CounselAge 62/With company 23 years
R O B E R T P. D E V L E M I N G
Vice PresidentExpansionConsumer ProductsAge 50/With company 25 years
B A R B A R A M . F A I L I N G
Vice PresidentHuman ResourcesAge 59/With company 29 years
R I C H A R D K . K E L L Y
Vice PresidentWood Products DivisionAge 55/With company27 years
M I C H A E L L . L A P P A
Vice PresidentSales and MarketingPulp and PaperboardAge 53/With company 2 years
C R A I G H . N E L S O N
Vice PresidentConsumer Products DivisionAge 46/With company 23 years
D A V I D J . O H M S
Vice PresidentManagement Information SystemsAge 51/With company24 years
J O H N R . O L S O N
Vice PresidentResource Management DivisionAge 54/With company 24 years
M A L C O L M A . R Y E R S E
Corporate SecretaryAge 37/With company12 years
H A R R Y D . S E A M A N S
Vice PresidentPulp and Paperboard DivisionAge 49/With company25 years
D O U G L A S D . S P E D D E N
Assistant TreasurerAge 43/With company 19 years
H U B E R T D . T R A V A I L L E
Vice PresidentPublic AffairsAge 63/With company 26 years
M I C H A E L S . U R S O
Vice PresidentMarketingWood ProductsAge 45/With company 1 year
G E R A L D L . Z U E H L K E
Vice PresidentFinance, Chief Financial Officer and TreasurerAge 54/With company 31 years
*Ages and years of service with the company calculated as of March 1, 2003.
D I V I D E N D R E I N V E S T M E N T
For the convenience of stockholders, dividends maybe reinvested in Potlatch common stock. For information, contactComputershare InvestorServices at (312) 360-5390.
A N N U A L M E E T I N G
The annual meeting of stockholders will be held on May 12, 2003, at 8:00 a.m. at the Hotel Lusso, North One Post Street, Spokane,Washington.
E X E C U T I V E O F F I C E S
601 W. Riverside AvenueSuite 1100Spokane, Washington 99201Telephone: (509) 835-1500
T R A N S F E R A G E N T
A N D R E G I S T R A R
Computershare InvestorServices, LLC
S T O C K L I S T I N G
Potlatch common stock is traded under the symbol PCHon the New York, Chicago and Pacific stock exchanges.
This annual report contains,in addition to historical information, certain forward-looking statements, including without limitation, statementsregarding future revenues,costs, manufacturing output,capital expenditures and timber supply issues. Theseforward-looking statementsreflect management’s currentviews regarding future eventsbased on estimates andassumptions, and are thereforesubject to known and unknownrisks and uncertainties andare not guarantees of futureperformance. The company’sactual results of operationscould differ materially from
those expressed or implied by forward-looking statementscontained in this report.Factors that could cause orcontribute to such differencesinclude, but are not limitedto, changes in the UnitedStates and internationaleconomies; changes inexchange rates between theU.S. dollar and other curren-cies; changes in the level ofconstruction activity; changesin worldwide demand for our products; changes inworldwide production andproduction capacity in theforest products industry;competitive pricing pressuresfor the company’s products;unanticipated manufacturingdisruptions; changes in
general and industry-specificenvironmental laws and regulations; unforeseen environmental liabilities orexpenditures; weather conditions; and changes inraw material, energy andother costs. Forward-lookingstatements contained in thisannual report present manage-ment’s views only as of thedate of this report. Except asrequired under applicablelaw, we do not intend to issueupdates concerning anyfuture revisions of manage-ment’s views to reflect eventsor circumstances occurringafter the date of this report.
A D D I T I O N A L I N F O R M A T I O N
A copy of the company’sannual report on Form 10-K,as filed with the Securitiesand Exchange Commission, isavailable free of charge onlineat www.potlatchcorp.com orupon written request toMalcolm A. Ryerse, CorporateSecretary, at the Potlatchexecutive offices.
W O R L D W I D E W E B
www.potlatchcorp.com
C O R P O R A T E I N F O R M A T I O N
F O R W A R D - L O O K I N G S T A T E M E N T S
Pro
ject
Man
ager
: D
elph
ine
Hir
asun
a
Des
ign:
Pen
tagr
am
Pho
togr
aphy
: To
m T
racy
Pri
nted
in
the
U.S
.A.