Embed Size (px)
Citation preview

U.S. Department of the InteriorU.S. Geological Survey
Scientific Investigations Report 2012–5165
Prepared in cooperation with thePower Plant Assessment Program of the Maryland Department of Natural Resourcesand theMaryland Geological Survey
Potentiometric Surface and Water-Level Difference Maps of Selected Confined Aquifers in Southern Maryland and Maryland’s Eastern Shore, 1975–2011

Cover. Aerial view of study area in Southern Maryland and Maryland’s Eastern Shore modified from the National Aeronautics and Space Administration (NASA) Terra satellite MODIS (Moderate Resolution Imaging Spectroradiometer) image of September 2011.

Potentiometric Surface and Water-Level Difference Maps of Selected Confined Aquifers of Southern Maryland and Maryland’s Eastern Shore, 1975–2011
By Stephen E. Curtin, David C. Andreasen, and Andrew W. Staley
Scientific Investigations Report 2012–5165
U.S. Department of the InteriorU.S. Geological Survey
Prepared in cooperation with the Power Plant Research Program of the Maryland Department of Natural Resources and the Maryland Geological Survey

U.S. Department of the InteriorKEN SALAZAR, Secretary
U.S. Geological SurveyMarcia K. McNutt, Director
U.S. Geological Survey, Reston, Virginia: 2012
For more information on the USGS—the Federal source for science about the Earth, its natural and living resources, natural hazards, and the environment, visit http://www.usgs.gov or call 1-888-ASK-USGS
For an overview of USGS information products, including maps, imagery, and publications, visit http://www.usgs.gov/pubprod
To order this and other USGS information products, visit http://store.usgs.gov
Any use of trade, product, or firm names is for descriptive purposes only and does not imply endorsement by the U.S. Government.
Although this information product, for the most part, is in the public domain, it also may contain copyrighted materials as noted in the text. Permission to reproduce copyrighted items must be secured from the copyright owner.
Suggested citation:Curtin, S.E., Andreasen, D.C., and Staley, A.W., 2012, Potentiometric surface and water-level difference maps of selected confined aquifers of Southern Maryland and Maryland’s Eastern Shore, 1975–2011: U.S. Geological Survey Scientific Investigations Report 2012–5165, 36 p.

iii
Contents
Abstract ...........................................................................................................................................................1Introduction.....................................................................................................................................................1
Purpose and Scope ..............................................................................................................................1Description of Study Area ...................................................................................................................2History of Monitoring and Mapping Groundwater Levels .............................................................2
Method of Analysis ........................................................................................................................................3Potentiometric Surface and Water-Level Difference Maps ...................................................................5
Aquia Aquifer .........................................................................................................................................5Magothy Aquifer ...................................................................................................................................5Upper Patapsco Aquifer ....................................................................................................................10Lower Patapsco Aquifer ....................................................................................................................10Patuxent Aquifer .................................................................................................................................10
Summary and Conclusions .........................................................................................................................16Acknowledgments .......................................................................................................................................16References Cited..........................................................................................................................................16Appendixes ...................................................................................................................................................17Appendix 1: Chronology of reports on potentiometric surface and water-level
difference mapping by aquifer for Southern Maryland and Maryland’s Eastern Shore..................................................................................................................................18
Appendix 2a. Water-level data for Southern Maryland and Maryland’s Eastern Shore wells used in this report (Aquia aquifer) ........................................................................26
Appendix 2b. Water-level data for Southern Maryland and Maryland’s Eastern Shore wells used in this report (Magothy aquifer) ...................................................................29
Appendix 2c. Water-level data for Southern Maryland and Maryland’s Eastern Shore wells used in this report (upper Patapsco aquifer) ......................................................31
Appendix 2d. Water-level data for Southern Maryland and Maryland’s Eastern Shore wells used in this report (lower Patapsco aquifer) .......................................................33
Appendix 2e. Water-level data for Southern Maryland and Maryland’s Eastern Shore wells used in this report (Patuxent aquifer) ...................................................................35

iv
Figures 1. Map showing location of study area in the Atlantic Coastal Plain of
Maryland and part of northern Virginia ....................................................................................2 2. Schematic diagram of the Atlantic Coastal Plain aquifer system ........................................3 3–11. Maps showing— 3. Potentiometric surface of the Aquia aquifer in Southern Maryland
and Maryland’s Eastern Shore, September 2011 ...........................................................6 4. The difference between the potentiometric surfaces of the Aquia
aquifer in Southern Maryland and Maryland’s Eastern Shore, September 1982 and September 2011 ..............................................................................7
5. Potentiometric surface of the Magothy aquifer in Southern Maryland and Maryland’s Eastern Shore, September 2011 ...........................................................8
6. The difference between the potentiometric surfaces of the Magothy aquifer in Southern Maryland and Maryland’s Eastern Shore, September 1975 and September 2011 ..............................................................................9
7. Potentiometric surface of the upper Patapsco aquifer in Southern Maryland and Maryland’s Eastern Shore, September 2011 .......................................11
8. The difference between the potentiometric surfaces of the upper Patapsco aquifer in Southern Maryland and Maryland’s Eastern Shore, September 1990 and September 2011 ............................................................................12
9. Potentiometric surface of the lower Patapsco aquifer in Southern Maryland and Maryland’s Eastern Shore, September 2011 .......................................13
10. The difference between the potentiometric surfaces of the lower Patapsco aquifer in Southern Maryland and Maryland’s Eastern Shore, September 1990 and September 2011 ............................................................................14
11. Potentiometric surface of the Patuxent aquifer in Southern Maryland and Maryland’s Eastern Shore, September 2011 .........................................................15
Table 1. Generalized stratigraphy and hydrogeology of Southern Maryland and
Maryland’s Eastern Shore ...........................................................................................................4
v
Conversion Factors and Datums
Multiply By To obtain
Length
foot (ft) 0.3048 meter (m)mile (mi) 1.609 kilometer (km)
Volume
gallon (gal) 3.785 liter (L) gallon (gal) 0.003785 cubic meter (m3)gallon (gal) 3.785 cubic decimeter (dm3) million gallons (Mgal) 3,785 cubic meter (m3)
Flow rate
gallon per day (gal/d) 0.003785 cubic meter per day (m3/d)million gallons per day (Mgal/d) 0.04381 cubic meter per second (m3/s)
Vertical coordinate information is referenced to the North American Vertical Datum of 1988 (NAVD 88).
Horizontal coordinate information is referenced to the North American Datum of 1983 (NAD 83).
Altitude, as used in this report, refers to distance above the vertical datum.


Potentiometric Surface and Water-Level Difference Maps of Selected Confined Aquifers in Southern Maryland and Maryland’s Eastern Shore, 1975–2011
By Stephen E. Curtin1, David C. Andreasen2, and Andrew W. Staley2
AbstractGroundwater is the principal source of freshwater supply
in most of Southern Maryland and Maryland’s Eastern Shore. It is also the source of freshwater supply used in the operation of the Calvert Cliffs, Chalk Point, and Morgantown power plants. Increased groundwater withdrawals over the last several decades have caused groundwater levels to decline. This report presents potentiometric surface maps of the Aquia, Magothy, upper Patapsco, lower Patapsco, and Patuxent aquifers using water levels measured during September 2011. Water-level difference maps also are presented for the first four of these aquifers. The water-level differences in the Aquia aquifer are shown using groundwater-level data from 1982 and 2011, whereas the water-level differences in the Magothy aquifer are presented using data from 1975 and 2011. Water-level difference maps in both the upper Patapsco and lower Patapsco aquifers are presented using data from 1990 and 2011.
These maps show cones of depression ranging from 25 to 198 feet (ft) below sea level centered on areas of major withdrawals. Water levels have declined by as much as 112 ft in the Aquia aquifer since 1982, 85 ft in the Magothy aquifer since 1975, and 47 and 71 ft in the upper Patapsco and lower Patapsco aquifers, respectively, since 1990.
IntroductionThe U.S. Geological Survey (USGS) and the Maryland
Geological Survey (MGS) have maintained a groundwater-level monitoring network since the 1940s to observe changes
in groundwater levels over time. Groundwater-level monitor-ing has been especially critical for Southern Maryland and Maryland’s Eastern Shore where groundwater is the primary source of water supply. Many observation wells were added to the network in the early 1970s following the establishment of the Maryland Department of Natural Resources Power Plant Research Program (PPRP) in order to monitor groundwater levels at Maryland power plants. Water-level data collected from the monitoring network and water-withdrawal data from the confined aquifers that supply water for the operation of Maryland’s power plants are used by the PPRP to evaluate potential impacts of Maryland’s power plants on groundwater resources.
Purpose and Scope
The purpose of this report is to assess the regional effects of groundwater withdrawals on water levels in Southern Maryland and Maryland’s Eastern Shore. This report presents potentiometric surface maps for the Aquia, Magothy, upper Patapsco, lower Patapsco, and Patuxent aquifers for September 2011. The potentiometric surface maps in this report are meant to represent groundwater levels and withdrawal amounts, at an instant in time. The water-level measurements were actually made over a period of about 1 month and may reflect short-term variations in water levels throughout the study area that are related to short-term changes in withdrawal rates. This report also presents water-level difference maps for: (1) the Aquia aquifer (1982–2011); (2) the Magothy aquifer (1975–2011); and (3) the upper and lower Patapsco aquifers (1990–2011). The water-level difference maps represent the change in potentiometric surfaces over time.
1 U.S. Geological Survey2 Maryland Geological Survey
2 Potentiometric Surface and Water-Level Difference Maps of Selected Confined Aquifers in Southern Maryland, 1975–2011
Description of Study Area
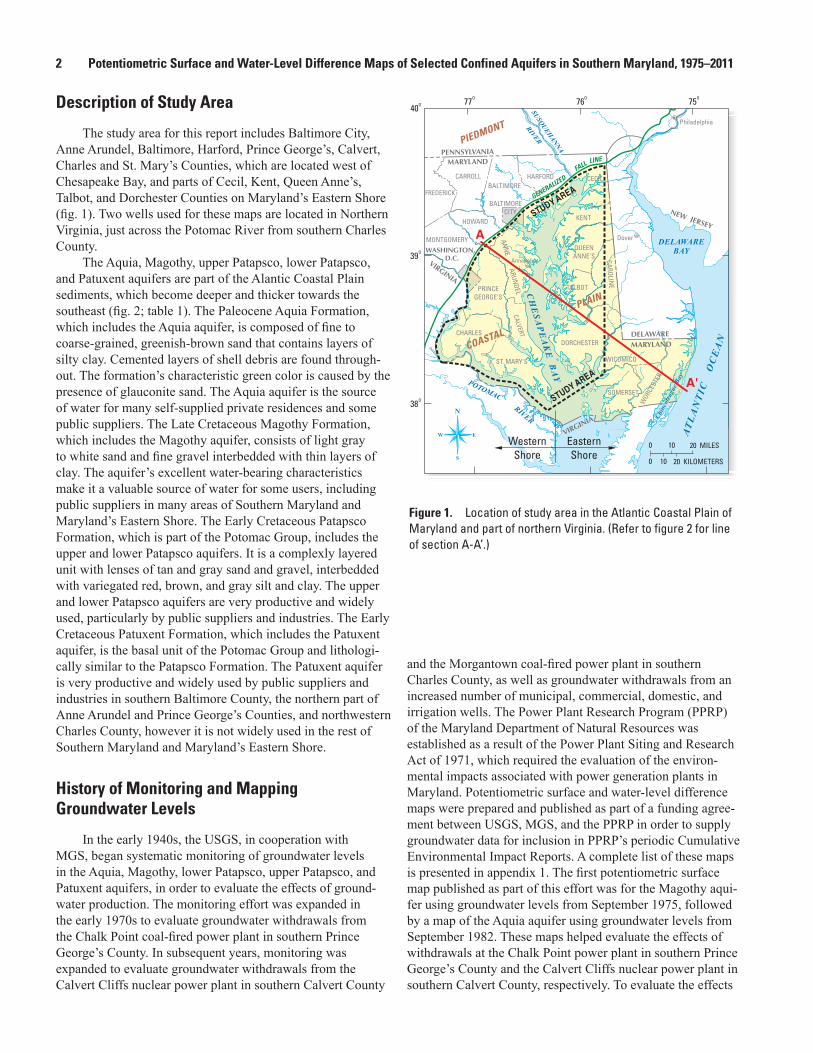
The study area for this report includes Baltimore City, Anne Arundel, Baltimore, Harford, Prince George’s, Calvert, Charles and St. Mary’s Counties, which are located west of Chesapeake Bay, and parts of Cecil, Kent, Queen Anne’s, Talbot, and Dorchester Counties on Maryland’s Eastern Shore (fig. 1). Two wells used for these maps are located in Northern Virginia, just across the Potomac River from southern Charles County.
The Aquia, Magothy, upper Patapsco, lower Patapsco, and Patuxent aquifers are part of the Alantic Coastal Plain sediments, which become deeper and thicker towards the southeast (fig. 2; table 1). The Paleocene Aquia Formation, which includes the Aquia aquifer, is composed of fine to coarse-grained, greenish-brown sand that contains layers of silty clay. Cemented layers of shell debris are found through-out. The formation’s characteristic green color is caused by the presence of glauconite sand. The Aquia aquifer is the source of water for many self-supplied private residences and some public suppliers. The Late Cretaceous Magothy Formation, which includes the Magothy aquifer, consists of light gray to white sand and fine gravel interbedded with thin layers of clay. The aquifer’s excellent water-bearing characteristics make it a valuable source of water for some users, including public suppliers in many areas of Southern Maryland and Maryland’s Eastern Shore. The Early Cretaceous Patapsco Formation, which is part of the Potomac Group, includes the upper and lower Patapsco aquifers. It is a complexly layered unit with lenses of tan and gray sand and gravel, interbedded with variegated red, brown, and gray silt and clay. The upper and lower Patapsco aquifers are very productive and widely used, particularly by public suppliers and industries. The Early Cretaceous Patuxent Formation, which includes the Patuxent aquifer, is the basal unit of the Potomac Group and lithologi-cally similar to the Patapsco Formation. The Patuxent aquifer is very productive and widely used by public suppliers and industries in southern Baltimore County, the northern part of Anne Arundel and Prince George’s Counties, and northwestern Charles County, however it is not widely used in the rest of Southern Maryland and Maryland’s Eastern Shore.
History of Monitoring and Mapping Groundwater Levels
In the early 1940s, the USGS, in cooperation with MGS, began systematic monitoring of groundwater levels in the Aquia, Magothy, lower Patapsco, upper Patapsco, and Patuxent aquifers, in order to evaluate the effects of ground-water production. The monitoring effort was expanded in the early 1970s to evaluate groundwater withdrawals from the Chalk Point coal-fired power plant in southern Prince George’s County. In subsequent years, monitoring was expanded to evaluate groundwater withdrawals from the Calvert Cliffs nuclear power plant in southern Calvert County
Figure 1. Location of study area in the Atlantic Coastal Plain of Maryland and part of northern Virginia. (Refer to figure 2 for line of section A-A’.)
and the Morgantown coal-fired power plant in southern Charles County, as well as groundwater withdrawals from an increased number of municipal, commercial, domestic, and irrigation wells. The Power Plant Research Program (PPRP) of the Maryland Department of Natural Resources was established as a result of the Power Plant Siting and Research Act of 1971, which required the evaluation of the environ-mental impacts associated with power generation plants in Maryland. Potentiometric surface and water-level difference maps were prepared and published as part of a funding agree-ment between USGS, MGS, and the PPRP in order to supply groundwater data for inclusion in PPRP’s periodic Cumulative Environmental Impact Reports. A complete list of these maps is presented in appendix 1. The first potentiometric surface map published as part of this effort was for the Magothy aqui-fer using groundwater levels from September 1975, followed by a map of the Aquia aquifer using groundwater levels from September 1982. These maps helped evaluate the effects of withdrawals at the Chalk Point power plant in southern Prince George’s County and the Calvert Cliffs nuclear power plant in southern Calvert County, respectively. To evaluate the effects

Method of Analysis 3
Figure 2. Schematic diagram of the Atlantic Coastal Plain aquifer system (line of section shown in figure 1; relative thicknesses of aquifers and confining units not to scale).
of withdrawals at the Morgantown power plant in southern Charles County, and withdrawals from additional wells at the Chalk Point power plant, the first potentiometric surface maps were developed for the upper and lower Patapsco aquifers using groundwater levels from September 1990. The first potentiometric surface map using groundwater levels from September 2007 was developed to evaluate the effects of groundwater withdrawals from the Patuxent aquifer at the Chalk Point power plant.
In addition to the maps published for the PPRP reports, Achmad and Hansen (2001) assembled a comprehensive set of potentiometric surface and water-level difference maps for the Piney Point, Aquia, Magothy, upper Patapsco, lower Patapsco, and Patuxent aquifers using groundwater level data from 1970 through 1996. This report also includes a compila-tion of groundwater withdrawals and selected hydrographs. Soeder and others (2007) published a similar report for the same set of aquifers for the period 1980–2005, which included a model evaluation of the relation between withdrawals and water levels.
Method of Analysis
USGS and MGS personnel measured groundwater levels that were used to construct the potentiometric surface and water-level difference maps primarily during the month of September of selected years. The water-level data were reviewed and approved by the USGS and stored in the Groundwater Site Inventory (GWSI) database, which is part of the National Water Information System (NWIS) maintained by USGS. This database is available to the public on the NWIS Web site (http://waterdata.usgs.gov/nwis/). Selected water-level data were retrieved from GWSI and used in the preparation of the maps in this report (appendixes 2a–2e). Water-withdrawal data included on the maps were derived from the Site-Specific Water-Use Data System (SWUDS), also maintained by USGS. Water-use data on the maps are shown using a series of symbols representing the location and rates of groundwater withdrawals greater than 10,000 gallons per day (gal/d). The 2011 potentiometric surface maps show water-withdrawal data for 2010 (the most recent data available). The

4 Potentiometric Surface and Water-Level Difference Maps of Selected Confined Aquifers in Southern Maryland, 1975–2011
Table 1. Generalized stratigraphy and hydrogeology of Southern Maryland and Maryland’s Eastern Shore.
[Modified from Soeder and others, 2007]

Potentiometric Surface and Water-Level Difference Maps 5
withdrawal data originated from the Maryland Department of the Environment (MDE) water-withdrawal database. Permitted water users who withdraw greater than 10,000 gal/d are required to submit monthly withdrawal amounts, which are subsequently entered into the MDE database. USGS periodi-cally retrieves the data, checks for quality assurance, and enters them into SWUDS. All groundwater-withdrawal data included in this report were supplied by Wendy McPherson of USGS, by way of written communication, unless otherwise noted.
In preparing the potentiometric surface maps, the ground-water levels were adjusted to feet relative to sea level using the National Geodetic Vertical Datum of 1929 (NGVD 29) land-surface altitudes, which have different levels of accuracy depending on how they were originally determined. The data were plotted and manually contoured by visually interpolating between data points. The contours are dashed in areas where data are sparse. The maps also include the outcrop area of the aquifer, and the aquifer boundary if its location is within the area shown.
Potentiometric Surface and Water-Level Difference Maps
Maps are presented for the Aquia, Magothy, upper Patapsco, lower Patapsco, and Patuxent aquifers for Southern Maryland and Maryland’s Eastern Shore using water levels measured in September 2011. The location and quantity of major groundwater withdrawal sites in 2010 are included on the maps to help show the relation between pumping centers and aquifer drawdowns. Maps showing the decline in water levels from 1975, 1982, or 1990 to 2011 also are presented. The maps include the outcrop area of the aquifer, and the aqui-fer boundary if its location is within the area shown.
Aquia Aquifer
The potentiometric surface of the Aquia aquifer during September 2011 is shown in figure 3. The map is based on water-level measurements in 83 wells. The highest measured water level was 50 ft above sea level in the outcrop area of the aquifer in the central part of Anne Arundel County. Water levels in the subcrop area of Kent County were as high as 25 ft above sea level. South of those areas, water levels were lower and mostly below sea level. The hydraulic gradient1 increased southeastward toward a cone of depression around well fields at Solomons Island in southern Calvert County and Lexington Park in southern St. Mary’s County. This cone of depression is the result of withdrawals predominantly from
1 Hyraulic gradient of an aquifer—the rate of change of pressure head per unit of distance of flow at a given point in a given direction.
municipal supply wells in this area. The Calvert Cliffs nuclear power plant is located along the northern edge of this cone of depression, where the water level was measured at 99 ft below sea level. The lowest measured water level of 157 ft below sea level occurred at the center of a cone of depression at Lexington Park.
The water-level differences in the Aquia aquifer in Southern Maryland and Maryland’s Eastern Shore between September 1982 and September 2011 are shown in figure 4. The map, based on water- level differences obtained from 52 wells, shows that the potentiometric surface during the 29-year period ranged from an increase of 8 ft in the northernmost part of the study area and in the outcrop of the aquifer, to a decline of 112 ft at Lexington Park. Lexington Park is near the south-easternmost part of the study area and approaches the downdip boundary of the aquifer. At the Calvert Cliffs nuclear power plant, water levels declined by 70 ft. Groundwater withdrawals from the Aquia aquifer in the study area have increased from 5 million gallons per day (Mgal/d) in 1982 to over 15 Mgal/d in 2010.
Magothy Aquifer
The potentiometric surface of the Magothy aquifer in the Magothy Formation in Southern Maryland and Maryland’s Eastern Shore during September 2011 is shown in figure 5. The map is based on water-level measurements in 66 wells. The highest measured water level was 88 ft above sea level in the outcrop area of the aquifer in the northern part of Anne Arundel County.
Water levels are lower towards the south. As a result of withdrawals predominantly from municipal supply wells, shal-low, localized cones of depression formed around well fields in east-central Anne Arundel County. A relatively large cone of depression occurred in the Waldorf area, which resulted in measured groundwater levels as low as 79 ft below sea level in this area. Groundwater withdrawals from the Chalk Point power plant resulted in a water level of 54 ft below sea level in an observation well at this site.
The water-level differences in the Magothy aquifer in Southern Maryland and Maryland’s Eastern Shore between September 1975 and September 2011 are shown in figure 6. The map, based on water-level differences obtained from 48 wells, shows that during the 36-year period, the potentiometric surface changed little near the outcrop area, which is in the northernmost part of the study area, but declined as much as 85 ft at Waldorf. Waldorf is located near the southern extent and downdip boundary of the aquifer. Water withdrawal from the Magothy aquifer in the study area increased from about 7 Mgal/d in 1975 (Wheeler and Wilde, 1989) to nearly 9 Mgal/d in 2010.

6 Potentiometric Surface and Water-Level Difference Maps of Selected Confined Aquifers in Southern Maryland, 1975–2011
Figure 3. Potentiometric surface of the Aquia aquifer in Southern Maryland and Maryland’s Eastern Shore, September 2011.

Potentiometric Surface and Water-Level Difference Maps 7
Figure 4. The difference between the potentiometric surfaces of the Aquia aquifer in Southern Maryland and Maryland’s Eastern Shore, September 1982 and September 2011.

8 Potentiometric Surface and Water-Level Difference Maps of Selected Confined Aquifers in Southern Maryland, 1975–2011
Figure 5. Potentiometric surface of the Magothy aquifer in Southern Maryland and Maryland’s Eastern Shore, September 2011.

Potentiometric Surface and Water-Level Difference Maps 9
Figure 6. The difference between the potentiometric surfaces of the Magothy aquifer in Southern Maryland and Maryland’s Eastern Shore, September 1975 and September 2011.

10 Potentiometric Surface and Water-Level Difference Maps of Selected Confined Aquifers in Southern Maryland, 1975–2011
Upper Patapsco Aquifer
The potentiometric surface of the upper Patapsco aquifer in Southern Maryland and Maryland’s Eastern Shore during September 2011 is shown in figure 7. The map is based on water-level measurements in 61 wells. The highest measured water level was 120 ft above sea level near the outcrop area of the aquifer in northern Anne Arundel County. Water levels are lower to the south toward well fields in the Annapolis-Arnold area. The lowest water level in that area was 35 ft below sea level. Two relatively large cones of depression were located in the Waldorf-LaPlata area in southern Charles County and the Lexington Park-Leonardtown area in southern St. Mary’s County. The lowest measured groundwater levels were 110 ft below sea level south of Waldorf, and 78 ft below sea level near Leonardtown. Smaller cones of depression formed around the Chalk Point power plant and Easton, where the water level was as low as 63 ft below sea level at the Chalk Point power plant and 56 ft below sea level at Easton.
The water-level differences in the upper Patapsco aquifer in Southern Maryland and Maryland’s Eastern Shore between September 1990 and September 2011 are shown in figure 8. The map, based on water-level differences obtained from 37 wells, shows that during the 21-year period, the potentiometric surface changed little at the edge of the outcrop area in northern Anne Arundel County. Water-level declines of 29 ft at Broad Creek, 13 ft near Arnold, 35 ft at Waldorf, 39 ft at the Chalk Point power plant, and 47 ft at Lexington Park were observed during this period.
Lower Patapsco Aquifer
The potentiometric surface of the lower Patapsco aquifer in Southern Maryland and Maryland’s Eastern Shore during September 2011 is shown in figure 9. The map is based on water-level measurements in 70 wells. The highest measured water level was 106 ft above sea level near the outcrop area of the aquifer in northern Prince George’s County. Water levels were lower towards well fields at Severndale, Broad Creek, Arnold and Crofton Meadows. The measured groundwater levels were 107 ft below sea level at Severndale, 32 ft below sea level at Broad Creek, 64 ft below sea level at Arnold, and 39 ft below sea level at Crofton Meadows. There was also a relatively large cone of depression in Charles County that includes Waldorf, La Plata, Indian Head, and the Morgantown power plant. The groundwater levels measured were as low as 198 ft below sea level at Waldorf, 148 ft below sea level at La Plata, 113 ft below sea level at Indian Head, and 101 ft below sea level at the Morgantown power plant.
The water-level differences in the lower Patapsco aquifer in Southern Maryland and Maryland’s Eastern Shore between September 1990 and September 2011 are shown in figure 10. The map, based on water-level differences obtained from 45 wells, shows that the change of the potentiometric surface during the 21-year period ranged from increases of 27 ft at Indian Head and 9 ft near the outcrop area in Glen Burnie, to declines of 63 ft at Arnold, 64 ft at Severndale, 27 ft at Crofton Meadows, 56 ft at Waldorf, 71 ft near La Plata, 40 ft at the Morgantown power plant, 36 ft at the Chalk Point power plant, and 34 ft at Swan Point. There were no groundwater with-drawals from the lower Patapsco aquifer at the Chalk Point power plant, therefore the decline in water level may be due to upward leakage to the upper Patapsco aquifer. Combined with-drawals from the upper and lower Patapsco aquifers increased from 29 Mgal/d in 1990 to over 40 Mgal/d in 2010. Most of the total withdrawal was from the lower Patspsco aquifer.
Patuxent Aquifer
The potentiometric surface of the Patuxent aquifer in Southern Maryland and Maryland’s Eastern Shore during September 2011 is shown in figure 11. The map is based on water-level measurements in 45 wells. The highest measured water level was 168 ft above sea level in the outcrop area of the aquifer in northern Prince George’s County. Water levels were lower south and east towards well fields at Glen Burnie, Bryans Road, the Morgantown power plant, and the Chalk Point power plant. The measured groundwater levels were 76 ft below sea level at Glen Burnie, 71 ft below sea level near Bryans Road, 28 ft below sea level at the Morgantown power plant, and 135 ft below sea level at the Chalk Point power plant. The relatively low water level at the Chalk Point power plant was the result of the use of the Patuxent aquifer begin-ning in 2009. The monitoring well is located immediately adjacent to one of four production wells in this aquifer, and as a result, the water level is affected by pumping of these production wells. The Patuxent aquifer withdrawal rates in the study area have decreased overall from more than 21 Mgal/d in 1990 to 13 Mgal/d in 2010. This is partly due to reduced water use from the Patuxent aquifer at Fort Meade in northern Anne Arundel County following the Persian Gulf War, which ended in 1991, and decreased withdrawals from well fields at Crofton Meadows in Anne Arundel County and the City of Bowie in Prince George’s County after 1992 (Soeder and others, 2007).

Potentiometric Surface and Water-Level Difference Maps 11
Figure 7. Potentiometric surface of the upper Patapsco aquifer in Southern Maryland and Maryland’s Eastern Shore, September 2011.

12 Potentiometric Surface and Water-Level Difference Maps of Selected Confined Aquifers in Southern Maryland, 1975–2011
Figure 8. The difference between the potentiometric surfaces of the upper Patapsco aquifer in Southern Maryland and Maryland’s Eastern Shore, September 1990 and September 2011.

Potentiometric Surface and Water-Level Difference Maps 13
Figure 9. Potentiometric surface of the lower Patapsco aquifer in Southern Maryland and Maryland’s Eastern Shore, September 2011.

14 Potentiometric Surface and Water-Level Difference Maps of Selected Confined Aquifers in Southern Maryland, 1975–2011
Figure 10. The difference between the potentiometric surfaces of the lower Patapsco aquifer in Southern Maryland and Maryland’s Eastern Shore, September 1990 and September 2011.

Potentiometric Surface and Water-Level Difference Maps 15
Figure 11. Potentiometric surface of the Patuxent aquifer in Southern Maryland and Maryland’s Eastern Shore, September 2011.

16 Potentiometric Surface and Water-Level Difference Maps of Selected Confined Aquifers in Southern Maryland, 1975–2011
Summary and ConclusionsGroundwater has been and is expected to continue to be a
major source of freshwater supply for Southern Maryland and Maryland’s Eastern Shore. The principal aquifers in the study area from which groundwater is withdrawn are the Aquia, Magothy, upper Patapsco, lower Patapsco, and Patuxent aquifers. Groundwater withdrawals from those aquifers have increased substantially over the last several decades as a direct result of population increases and increased use of water for irrigation. A groundwater-level monitoring network is maintained by the U.S. Geological Survey (USGS) and the Maryland Geological Survey (MGS) to observe changes in groundwater levels over time. In each aquifer, the water levels tend to be lower in wells farther away from the outcrop area where the aquifers receive recharge. Water levels in the Aquia aquifer ranged from 50 feet (ft) above sea level to 157 ft below sea level in 2011, and declined by as much as 112 ft between 1982 and 2011. Groundwater withdrawals from the Aquia aquifer have increased from about 5 million gallons per day (Mgal/d) in 1982 to over 15 Mgal/d in 2010. Water levels in the Magothy aquifer ranged from 88 ft above sea level to 79 ft below sea level in 2011, and declined by as much as 85 ft between 1975 and 2011. Water withdrawal from the Magothy aquifer increased from about 7 Mgal/d in 1975 to nearly 9 Mgal/d in 2010. Water levels in the upper Patapsco aquifer ranged from 120 ft above sea level to 110 ft below sea level in 2011, and declined by as much as 47 ft between 1990 and 2011. Water levels in the lower Patapsco aquifer ranged from 106 ft above sea level to 198 ft below sea level in 2011, and declined by as much as 71 ft between 1990 and 2011. Groundwater withdrawals from the Patapsco aquifers increased from 29 Mgal/d in 1990 to over 40 Mgal/d in 2010. Most of the total withdrawals were from the lower Patapsco aquifer. Water levels in the Patuxent aquifer ranged from 168 ft above sea level to 135 ft below sea level. Withdrawal rates from the Patuxent aquifer decreased from over 21 Mgal/d in 1990 to 13 Mgal/d in 2010. The groundwater-level and
withdrawal data presented in this report can be used to assist in determining the sustainability of the confined aquifer sys-tem in Southern Maryland and Maryland’s Eastern Shore.
AcknowledgmentsThe authors would like to express thanks to all of the
USGS and MGS personnel that contributed water-level measurements that were used in the development of the maps. Timothy Auer of USGS produced the final maps and figures for this report. Valerie Gaine of USGS provided the editorial review and Andrew LaMotte of USGS provided Geographic Information System (GIS) support. Cheryl Dieter and Matthew Pajerowski, both of USGS, provided useful technical com-ments and advice throughout the report process, and Peter Lapa-Lilly of USGS diligently cross-referenced the data for the maps and tables.
References Cited
Achmad, G., and Hansen, H.J., 2001, Ground-water levels and pumpage trends in the major Coastal Plain aquifers of Southern Maryland between 1970 and 1996: Maryland Geological Survey Open-File Report 2000–02–12, 150 p.
Soeder, D.J., Raffensperger, J.P., and Nardi, M.R., 2007, Effects of withdrawals on groundwater levels in Southern Maryland and the Adjacent Eastern Shore, 1980–2005: U.S. Geological Survey Scientific Investigations Report 2007–5249, 82 p. (also available online at http://pubs.usgs.gov/sir/2007/5249).
Wheeler, J.C., and Wilde, F.D., 1989, Ground-water use in the Coastal Plain of Maryland, 1900–1980: U.S. Geological Survey Open-File Report 87–540, 173 p.

Appendixes 17
Appendixes

18 Potentiometric Surface and Water-Level Difference Maps of Selected Confined Aquifers in Southern Maryland, 1975–2011
Appendix 1: Chronology of reports on potentiometric surface and water-level difference mapping by aquifer for Southern Maryland and Maryland’s Eastern Shore
AQUIA AQUIFER
POTENTIOMETRIC SURFACE MAPS
POTENTIOMETRIC SURFACE OF THE AQUIA AQUIFER IN SOUTHERN MARYLAND, SEPTEMBER 1982, by Mack, F.K., Wheeler, J.C., and Curtin, S.E.: U.S. Geological Survey Open-File Report 83–929, 1983, 1 p. (A revision of this map was done in 1992.)
PRELIMINARY MAP SHOWING THE POTENTIOMETRIC SURFACE OF THE AQUIA AQUIFER IN SOUTHERN MARYLAND, SEPTEMBER 1984, by Mack, F.K., Wheeler, J.C., Curtin, S.E., and Andreasen, D.C.: U.S. Geological Survey Water-Resources Investigations Report 85–4338, 1985, 1 p.
THE POTENTIOMETRIC SURFACE OF THE AQUIA AQUIFER IN SOUTHERN MARYLAND, SEPTEMBER, 1985, by Mack, F.K., Wheeler, J.C., Curtin, S.E., and Andreasen, D.C.: U.S. Geological Survey Water-Resources Investigations Report 87–4029, 1987, 1 p.
POTENTIOMETRIC SURFACE OF THE AQUIA AQUIFER IN SOUTHERN MARYLAND DURING THE FALL OF 1986, by Mack, F.K., Andreasen, D.C., Curtin, S.E., and Wheeler, J.C.: U.S. Geological Survey Water-Resources Investigations Report 87–4214, 1987, 1 p.
POTENTIOMETRIC SURFACE OF THE AQUIA AQUIFER IN SOUTHERN MARYLAND DURING THE FALL OF 1987, by Mack, F.K., Andreasen, D.C., Curtin, S.E., and Wheeler, J.C.: U.S. Geological Survey Water-Resources Investigations Report 89–4012, 1989, 1 p.
POTENTIOMETRIC SURFACE OF THE AQUIA AQUIFER IN SOUTHERN MARYLAND DURING THE FALL OF 1988, by Mack, F.K., Andreasen, D.C., Curtin, S.E., and Wheeler, J.C.: U.S. Geological Survey Water-Resources Investigations Report 90–4037, 1990, 1 p.
POTENTIOMETRIC SURFACE OF THE AQUIA AQUIFER IN SOUTHERN MARYLAND, SEPTEMBER 1989, by Mack, F.K., Curtin, S.E., Andreasen, D.C., and Wheeler, J.C.: U.S. Geological Survey Water-Resources Investigations Report 91–4094, 1991, 1 p.
POTENTIOMETRIC SURFACE OF THE AQUIA AQUIFER IN SOUTHERN MARYLAND, SEPTEMBER 1990, by Mack, F.K., Curtin, S.E., Andreasen, D.C., and Wheeler, J.C.: U.S. Geological Survey Open-File Report 92–459, 1992, 1 p.
POTENTIOMETRIC SURFACE OF THE AQUIA AQUIFER IN SOUTHERN MARYLAND, SEPTEMBER 1991, by Curtin, S.E., Andreasen, D.C., and Mack, F.K.: U.S. Geological Survey Open-File Report 93–652, 1993, 1 p.
POTENTIOMETRIC SURFACE OF THE AQUIA AQUIFER IN SOUTHERN MARYLAND, SEPTEMBER 1993, by Curtin, S.E., Mack, F.K., and Andreasen, D.C.: U.S. Geological Survey Open-File Report 94–390, 1994, 1 p.
POTENTIOMETRIC SURFACE OF THE AQUIA AQUIFER IN SOUTHERN MARYLAND, SEPTEMBER 1994, by Curtin, S.E., Mack, F.K., and Andreasen, D.C.: U.S. Geological Survey Open-File Report 95–743, 1995, 1 p.
POTENTIOMETRIC SURFACE OF THE AQUIA AQUIFER IN SOUTHERN MARYLAND, SEPTEMBER 1995, by Curtin, S.E., Mack, F.K., and Andreasen, D.C.: U.S. Geological Survey Open-File Report 96–620, 1996, 1 p.
POTENTIOMETRIC SURFACE OF THE AQUIA AQUIFER IN SOUTHERN MARYLAND, SEPTEMBER-OCTOBER 1996, by Curtin, S.E., Mack, F.K., and Andreasen, D.C.: U.S. Geological Survey Open-File Report 97–788, 1997, 1 p.
POTENTIOMETRIC SURFACE OF THE AQUIA AQUIFER IN SOUTHERN MARYLAND, SEPTEMBER 1997, by Curtin, S.E., Mack, F.K., and Andreasen, D.C.: U.S. Geological Survey Open-File Report 99–82, 1999, 1 p.
POTENTIOMETRIC SURFACE OF THE AQUIA AQUIFER IN SOUTHERN MARYLAND, SEPTEMBER 1998, by Curtin, S.E., Mack, F.K., and Andreasen, D.C.: U.S. Geological Survey Open-File Report 00–83, 2000, 1 p.
POTENTIOMETRIC SURFACE OF THE AQUIA AQUIFER IN SOUTHERN MARYLAND, SEPTEMBER 1999, by Curtin, S.E., Andreasen, D.C., and Wheeler, J.C.: U.S. Geological Survey Open-File Report 01–204, 2001, 1 p., accessed May 1, 2012 at http://md.water.usgs.gov/publications/ofr-01-204/ofr-01-204.pdf.
POTENTIOMETRIC SURFACE OF THE AQUIA AQUIFER IN SOUTHERN MARYLAND, SEPTEMBER 2000, by Curtin, S.E., Andreasen, D.C., and Wheeler, J.C.: U.S. Geological Survey Open-File Report 02–244, 2002, 1 p. (also available online at http://pubs.usgs.gov/of/2002/0244/report.pdf).

Appendixes 19
POTENTIONMETRIC SURFACE OF THE AQUIA AQUIFER IN SOUTHERN MARYLAND, SEPTEMBER 2001, by Curtin, S.E., Andreasen, D.C., and Wheeler, J.C.: U.S. Geological Survey Open-File Report 02–442, 2002, 1 p., accessed May 1, 2012 at http://md.water.usgs.gov/publications/ofr-02-442/aq2001.pdf.
POTENTIOMETRIC SURFACE OF THE AQUIA AQUIFER IN SOUTHERN MARYLAND, SEPTEMBER 2002, by Curtin, S.E., Andreasen, D.C., and Wheeler, J.C.: U.S. Geological Survey Open-File Report 03–255, 2003, 1 p. (also available online at http://pubs.usgs.gov/of/2003/ofr03-255/pdf/aq2002.pdf).
POTENTIOMETRIC SURFACE MAP OF THE AQUIA AQUIFER IN SOUTHERN MARYLAND, SEPTEMBER 2003, by Curtin, S.E., Andreasen, D.C., and Wheeler, J.C.: U.S. Geological Survey Open-File Report 2005–1004, 2005, 1 p. (also available online at http://pubs.usgs.gov/of/2005/1004/pdf/of20051004.pdf).
POTENTIOMETRIC SURFACE OF THE AQUIA AQUIFER IN SOUTHERN MARYLAND, SEPTEMBER 2007, by Curtin, S.E., Andreasen, D.C., and Staley, A.W.: U.S. Geological Survey Open-File Report 2009–1080, 2009, 1 p., accessed May 1, 2012 at http://md.water.usgs.gov/publications/ofr-2009-1080/Aquia%20OFR%202009-1080.pdf.
POTENTIOMETRIC SURFACE OF THE AQUIA AQUIFER IN SOUTHERN MARYLAND, SEPTEMBER 2009, by Curtin, S.E., Andreasen, D.C., and Staley, A.W.: U.S. Geological Survey Open-File Report No. 2010–1201, 2010, 1 p., accessed May 1, 2012 at http://md.water.usgs.gov/publications/ofr-2010-1201/Aquia%202009.pdf.
WATER-LEVEL-DIFFERENCE MAPS
PRELIMINARY MAP SHOWING THE DIFFERENCE BETWEEN THE POTENTIOMETRIC SURFACES OF THE AQUIA AQUIFER OF APRIL 1979 AND SEPTEMBER 1982 IN SOUTHERN MARYLAND, by Mack, F.K., Wheeler, J.C., and Curtin, S.E.: U.S. Geological Survey Open-File Report 83–930, 1983, 1 p.
PRELIMINARY MAP SHOWING THE DIFFERENCE BETWEEN THE POTENTIOMETRIC SURFACES OF THE AQUIA AQUIFER OF SEPTEMBER 1982 AND SEPTEMBER 1984 IN SOUTHERN MARYLAND, by Mack, F.K., Wheeler, J.C., Curtin, S.E., and Andreasen, D.C.: U.S. Geological Survey Water-Resources Investigations Report 85–4339, 1985, 1 p.
DIFFERENCE BETWEEN THE POTENTIOMETRIC SURFACES OF THE AQUIA AQUIFER IN THE SPRING OF 1979 AND FALL OF 1986 IN SOUTHERN MARYLAND, by Mack, F.K., Andreasen, D.C., Curtin, S.E., and Wheeler, J.C.: U.S. Geological Survey Water-Resources Investigations Report 87–4215, 1987, 1 p.
THE DIFFERENCE BETWEEN THE POTENTIOMETRIC SURFACES OF THE AQUIA AQUIFER OF SEPTEMBER 1986 AND SEPTEMBER 1988 IN SOUTHERN MARYLAND, by Mack, F.K., Andreasen, D.C., Curtin, S.E., and Wheeler, J.C.: U.S. Geological Survey Water-Resources Investigations Report 90–4039, 1990, 1 p.
THE DIFFERENCE BETWEEN THE POTENTIOMETRIC SURFACES OF THE AQUIA AQUIFER OF SEPTEMBER 1982 AND SEPTEMBER 1990 IN SOUTHERN MARYLAND, by Mack, F.K., Curtin, S.E., Andreasen, D.C, and Wheeler, J.C.: U.S. Geological Survey Open-File Report 92–463, 1992, 1 p.
THE DIFFERENCE BETWEEN THE POTENTIOMETRIC SURFACES OF THE AQUIA AQUIFER OF SEPTEMBER 1982 AND SEPTEMBER 1993 IN SOUTHERN MARYLAND, by Curtin, S.E., Mack, F.K., and Andreasen, D.C.: U.S. Geological Survey Open-File Report 94–394, 1994, 1 p.
THE DIFFERENCE BETWEEN THE POTENTIOMETRIC SURFACES OF THE AQUIA AQUIFER OF SEPTEMBER 1982 AND SEPTEMBER 1995 IN SOUTHERN MARYLAND, by Curtin, S.E., Mack, F.K., and Andreasen, D.C.: U.S. Geological Survey Open-File Report 96–624, 1996, 1 p.
THE DIFFERENCE BETWEEN THE POTENTIOMETRIC SURFACES OF THE AQUIA AQUIFER OF SEPTEMBER 1982 AND SEPTEMBER 1997 IN SOUTHERN MARYLAND, by Curtin, S.E., Mack, F.K., and Andreasen, D.C.: U.S. Geological Survey Open-File Report 99–81, 1999, 1 p.
THE DIFFERENCE BETWEEN THE POTENTIOMETRIC SURFACES OF THE AQUIA AQUIFER, SEPTEMBER 1982 AND SEPTEMBER 1999 IN SOUTHERN MARYLAND, by Curtin, S.E., Andreasen, D.C., and Wheeler, J.C.: U.S. Geological Survey Open-File Report 01–205, 2001, 1 p. (also available online at http://pubs.usgs.gov/of/2001/ofr01-205/pdf/ofr-01-205.pdf).
THE DIFFERENCE BETWEEN THE POTENTIOMETRIC SURFACES OF THE AQUIA AQUIFER, SEPTEMBER 1982 AND SEPTEMBER 2001 IN SOUTHERN MARYLAND, by Curtin, S.E., Andreasen, D.C., and Wheeler, J.C.: U.S. Geological Survey Open-File Report 02–443, 2002, 1 p., accessed May 1, 2012 at http://md.water.usgs.gov/publications/ofr-02-443/aq0182.pdf.

20 Potentiometric Surface and Water-Level Difference Maps of Selected Confined Aquifers in Southern Maryland, 1975–2011
THE DIFFERENCE BETWEEN THE POTENTIOMETRIC SURFACES OF THE AQUIA AQUIFER, SEPTEMBER 1982 AND SEPTEMBER 2003 IN SOUTHERN MARYLAND, by Curtin, S.E., Andreasen, D.C., and Wheeler, J.C.: U.S. Geological Survey Open-File Report 2005–005, 2005, 1 p. (also available online at http://pubs.usgs.gov/of/2005/1005/pdf/of-2005-1005.pdf).
THE DIFFERENCE BETWEEN THE POTENTIOMETRIC SURFACES OF THE AQUIA AQUIFER IN SOUTHERN MARYLAND, SEPTEMBER 1982 AND SEPTEMBER 2007, by Curtin, S.E., Andreasen, D.C., and Staley, A.W.: U.S. Geological Survey Open-File Report 2009–1081, 2009, 1 p., accessed May 1, 2012 at http://md.water.usgs.gov/publications/ofr-2009-1081/Aquia%20Difference%20OFR%202009-1081.pdf.
THE DIFFERENCE BETWEEN THE POTENTIOMETRIC SURFACES OF THE AQUIA AQUIFER IN SOUTHERN MARYLAND, SEPTEMBER 1982 AND SEPTEMBER 2009, by Curtin, S.E., Andreasen, D.C., and Staley, A.W.: U.S. Geological Survey Open-File Report 2010–1202, 2010, 1 p., accessed May 1, 2012 at http://md.water.usgs.gov/publications/ofr-2010-1202/Aquia%20Difference%202009.pdf.
MAGOTHY AQUIFER
POTENTIOMETRIC SURFACE MAPS
MAP SHOWING THE POTENTIOMETRIC SURFACE OF THE MAGOTHY AQUIFER IN SOUTHERN MARYLAND, SEPTEMBER 1975, by Mack, F.K., Wheeler, J.C., and Curtin, S.E., [unnumbered], 1 p. (Revised from Maryland Geological Survey Report of Investigations No. 28)
MAP SHOWING THE POTENTIOMETRIC SURFACE OF THE MAGOTHY AQUIFER IN SOUTHERN MARYLAND, SEPTEMBER 1977, by Mack, F.K., Wheeler, J.C., and Curtin, S.E.: U.S. Geological Survey Open-File Report 78–999, 1978, 1 p.
MAP SHOWING THE POTENTIOMETRIC SURFACE OF THE MAGOTHY AQUIFER IN SOUTHERN MARYLAND, SEPTEMBER 1979, by Mack, F.K., Wheeler, J.C., and Curtin, S.E.: U.S. Geological Survey Open-File Report 80–959, 1980, 1 p.
MAP SHOWING THE POTENTIOMETRIC SURFACE OF THE MAGOTHY AQUIFER IN SOUTHERN MARYLAND, AUGUST 1980, by Mack, F.K., Wheeler, J.C., and Curtin, S.E.: U.S. Geological Survey Open-File Report 81–633, 1981, 1 p.
MAP SHOWING THE POTENTIOMETRIC SURFACE OF THE MAGOTHY AQUIFER IN SOUTHERN MARYLAND, SEPTEMBER 1981, by Mack, F.K., Wheeler, J.C., and Curtin, S.E.: U.S. Geological Survey Open-File Report 82–257, 1982, 1 p.
MAP SHOWING THE POTENTIOMETRIC SURFACE OF THE MAGOTHY AQUIFER IN SOUTHERN MARYLAND, SEPTEMBER 1982, by Mack, F.K., Wheeler, J.C., and Curtin, S.E.: U.S. Geological Survey Water-Resources Investigations Report 83–4282, 1983, 1 p.
THE POTENTIOMETRIC SURFACE OF THE MAGOTHY AQUIFER IN SOUTHERN MARYLAND, SEPTEMBER 1983, by Mack, F.K., Wheeler, J.C., and Curtin, S.E.: U.S. Geological Survey Water-Resources Investigations Report 85–4000, 1985, 1 p.
THE POTENTIOMETRIC SURFACE OF THE MAGOTHY AQUIFER IN SOUTHERN MARYLAND, SEPTEMBER 1984, by Mack, F.K., Wheeler, J.C., and Curtin, S.E.: U.S. Geological Survey Water-Resources Investigations Report 85–4203, 1985, 1 p.
THE POTENTIOMETRIC SURFACE OF THE MAGOTHY AQUIFER IN SOUTHERN MARYLAND, SEPTEMBER 1985, by Mack, F.K., Wheeler, J.C., Curtin, S.E., and Andreasen, D.C.: U.S. Geological Survey Water-Resources Investigations Report 87–4025, 1987, 1 p.
POTENTIOMETRIC SURFACE OF THE MAGOTHY AQUIFER IN SOUTHERN MARYLAND DURING THE FALL OF 1986, by Mack, F.K., Andreasen, D.C., Curtin, S.E., and Wheeler, J.C.: U.S. Geological Survey Open-File Report 87–4216, 1987, 1 p.
POTENTIOMETRIC SURFACE OF THE MAGOTHY AQUIFER IN SOUTHERN MARYLAND DURING THE FALL OF 1987, by Mack, F.K., Andreasen, D.C., Curtin, S.E., and Wheeler, J.C.: U.S. Geological Survey Water-Resources Investigations Report 89–4013, 1989, 1 p.
POTENTIOMETRIC SURFACE OF THE MAGOTHY AQUIFER IN SOUTHERN MARYLAND DURING SEPTEMBER 1988, by Mack, F.K., Andreasen, D.C., Curtin, S.E., and Wheeler, J.C.: U.S. Geological Survey Water Resources Investigations Report 90–4040, 1990, 1 p.
POTENTIOMETRIC SURFACE OF THE MAGOTHY AQUIFER IN SOUTHERN MARYLAND, SEPTEMBER 1989, by Mack, F.K., Andreasen, D.C., Curtin, S.E., and Wheeler, J.C.: U.S. Geological Survey Water-Resources Investigations Report 91–4093, 1991, 1 p.
POTENTIOMETRIC SURFACE OF THE MAGOTHY AQUIFER IN SOUTHERN MARYLAND, SEPTEMBER 1990, by Mack, F.K., Curtin, S.E., Andreasen, D.C., and Wheeler, J.C.: U.S. Geological Survey Open-File Report 92–460, 1992, 1 p.

Appendixes 21
POTENTIOMETRIC SURFACE OF THE MAGOTHY AQUIFER IN SOUTHERN MARYLAND, SEPTEMBER 1991, by Curtin, S.E., Andreasen, D.C., and Mack, F.K.: U.S. Geological Survey Open-File Report 93–653, 1993, 1 p.
POTENTIOMETRIC SURFACE OF THE MAGOTHY AQUIFER IN SOUTHERN MARYLAND, SEPTEMBER 1993, by Curtin, S.E., Mack, F.K., and Andreasen, D.C.: U.S. Geological Survey Open-File Report 94–391, 1994, 1 p.
POTENTIOMETRIC SURFACE OF THE MAGOTHY AQUIFER IN SOUTHERN MARYLAND, SEPTEMBER 1994, by Curtin, S.E., Mack, F.K., and Andreasen, D.C.: U.S. Geological Survey Open-File Report 95–744, 1995, 1 p.
POTENTIOMETRIC SURFACE OF THE MAGOTHY AQUIFER IN SOUTHERN MARYLAND, SEPTEMBER 1995, by Curtin, S.E., Mack, F.K., and Andreasen, D.C.: U.S. Geological Survey Open-File Report 96–621, 1996, 1 p.
POTENTIOMETRIC SURFACE OF THE MAGOTHY AQUIFER IN SOUTHERN MARYLAND, SEPTEMBER-OCTOBER 1996, by Curtin, S.E., Mack, F.K., and Andreasen, D.C.: U.S. Geological Survey Open-File Report 97–789, 1997, 1 p.
POTENTIOMETRIC SURFACE OF THE MAGOTHY AQUIFER IN SOUTHERN MARYLAND, SEPTEMBER 1997, by Curtin, S.E., Mack, F.K., and Andreasen, D.C.: U.S. Geological Survey Open-File Report 99–83, 1999, 1 p.
POTENTIOMETRIC SURFACE OF THE MAGOTHY AQUIFER IN SOUTHERN MARYLAND, SEPTEMBER 1998, by Curtin, S.E., Mack, F.K., and Andreasen, D.C.: U.S. Geological Survey Open-File Report 00–84, 2000, 1 p.
POTENTIOMETRIC SURFACE OF THE MAGOTHY AQUIFER IN SOUTHERN MARYLAND, SEPTEMBER 1999, by Curtin, S.E., Andreasen, D.C., and Wheeler, J.C.: U.S. Geological Survey Open-File Report 01–206, 2001, 1 p. (also available online at http://pubs.usgs.gov/of/2001/ofr01-206/pdf/ofr-01-206.pdf).
POTENTIOMETRIC SURFACE OF THE MAGOTHY AQUIFER IN SOUTHERN MARYLAND, SEPTEMBER 2000, by Curtin, S.E., Andreasen, D.C., and Wheeler, J.C.: U.S. Geological Survey Open-File Report No. 02–245, 2002, 1 p. (also available online at http://pubs.usgs.gov/of/2002/0245/report.pdf).
POTENTIOMETRIC SURFACE OF THE MAGOTHY AQUIFER IN SOUTHERN MARYLAND, SEPTEMBER 2001, by Curtin, S.E., Andreasen, D.C., and Wheeler, J.C.: U.S. Geological Survey Open-File Report 02–444, 2002, 1 p., accessed May 1, 2012 at http://md.water.usgs.gov/publications/ofr-02-444/mg2001.pdf.
POTENTIOMETRIC SURFACE OF THE MAGOTHY AQUIFER IN SOUTHERN MARYLAND, SEPTEMBER 2002, by Curtin, S.E., Andreasen, D.C., and Wheeler, J.C.: U.S. Geological Survey Open-File Report 03–256, 2003, 1 p. (also available online at http://pubs.usgs.gov/of/2003/ofr03-256/pdf/mg2002.pdf).
POTENTIOMETRIC SURFACE MAP OF THE MAGOTHY AQUIFER IN SOUTHERN MARYLAND, SEPTEMBER 2003, by Curtin, S.E., Andreasen, D.C., and Wheeler, J.C.: U.S. Geological Survey Open-File Report 2005–1006, 2005, 1 p. (also available online at http://pubs.usgs.gov/of/2005/1006/pdf/of20051006.pdf).
POTENTIOMETRIC SURFACE OF THE MAGOTHY AQUIFER IN SOUTHERN MARYLAND, SEPTEMBER 2007, by Curtin, S.E., Andreasen, D.C., and Staley, A.W.: U.S. Geological Survey Open-File Report 2009–1082, 2009, 1 p., accessed May 1, 2012 at http://md.water.usgs.gov/publications/ofr-2009-1082/Magothy%20OFR%202009-1082.pdf.
POTENTIOMETRIC SURFACE OF THE MAGOTHY AQUIFER IN SOUTHERN MARYLAND, SEPTEMBER 2009, by Curtin, S.E., Andreasen, D.C. and Staley, A.W.: U.S. Geological Survey Open-File Report 2010–1203, 2010, 1 p., accessed May 1, 2012 at http://md.water.usgs.gov/publications/ofr-2010-1203/Magothy%202009.pdf.
WATER LEVEL DIFFERENCE MAPS
MAP SHOWING HOW THE POTENTIOMETRIC SURFACE OF THE MAGOTHY AQUIFER OF SEPTEMBER 1979 DIFFERED FROM THE POTENTIOMETRIC SURFACE OF SEPTEMBER 1977 IN SOUTHERN MARYLAND, by Mack, F.K., Wheeler, J.C., and Curtin, S.E.: U.S. Geological Survey Open-File Report 81–632, 1981, 1 p.
MAP SHOWING HOW THE POTENTIOMETRIC SURFACE OF THE MAGOTHY AQUIFER OF AUGUST 1980 DIFFERED FROM THE POTENTIOMETRIC SURFACE OF SEPTEMBER 1977 IN SOUTHERN MARYLAND, by Mack, F.K., Wheeler, J.C., and Curtin, S.E.: U.S. Geological Survey Open-File Report 81–631, 1981, 1 p.
22 Potentiometric Surface and Water-Level Difference Maps of Selected Confined Aquifers in Southern Maryland, 1975–2011
THE DIFFERENCE BETWEEN THE POTENTIOMETRIC SURFACES OF THE MAGOTHY AQUIFER OF SEPTEMBER 1975 AND SEPTEMBER 1981 IN SOUTHERN MARYLAND, by Mack, F.K., Wheeler, J.C., and Curtin, S.E.: U.S. Geological Survey Open-File Report 82–339, 1982, 1 p.
MAP SHOWING THE DIFFERENCE BETWEEN THE POTENTIOMETRIC SURFACES OF THE MAGOTHY AQUIFER OF SEPTEMBER 1975 AND SEPTEMBER 1982 IN SOUTHERN MARYLAND, by Mack, F.K., Wheeler, J.C., and Curtin, S.E.: U.S. Geological Survey Water- Resources Investigations Report 83–4283, 1983, 1 p.
THE DIFFERENCE BETWEEN THE POTENTIOMETRIC SURFACES OF THE MAGOTHY AQUIFER OF SEPTEMBER 1982 AND SEPTEMBER 1984 IN SOUTHERN MARYLAND, by Mack, F.K., Wheeler, J.C., Curtin, S.E., and Andreasen, D.C.: U.S. Geological Survey Water- Resources Investigations Report 85–4337, 1985, 1 p.
THE DIFFERENCE BETWEEN THE POTENTIOMETRIC SURFACES OF THE MAGOTHY AQUIFER IN THE FALL OF 1975 AND FALL OF 1986 IN SOUTHERN MARYLAND, by Mack, F.K., Andreasen, D.C., Curtin, S.E., and Wheeler, J.C.: U.S. Geological Survey Water-Resources Investigations Report 87–4217, 1987, 1 p.
THE DIFFERENCE BETWEEN THE POTENTIOMETRIC SURFACES OF THE MAGOTHY AQUIFER OF SEPTEMBER 1986 AND SEPTEMBER 1988 IN SOUTHERN MARYLAND, by Mack, F.K., Andreasen, D.C., Curtin, S.E., and Wheeler, J.C.: U.S. Geological Survey Water-Resources Investigations Report 90–4038, 1990, 1 p.
THE DIFFERENCE BETWEEN THE POTENTIOMETRIC SURFACES OF THE MAGOTHY AQUIFER OF SEPTEMBER 1975 AND SEPTEMBER 1990 IN SOUTHERN MARYLAND, by Mack, F.K., Curtin, S.E., Andreasen, D.C., and Wheeler, J.C.: U.S. Geological Survey Open-File Report 92–464, 1992, 1 p.
THE DIFFERENCE BETWEEN THE POTENTIOMETRIC SURFACES OF THE MAGOTHY AQUIFER OF SEPTEMBER 1975 AND SEPTEMBER 1993 IN SOUTHERN MARYLAND, by Curtin, S.E., Mack, F.K., and Andreasen, D.C.: U.S. Geological Survey Open-File Report 94–395, 1994, 1 p.
THE DIFFERENCE BETWEEN THE POTENTIOMETRIC SURFACES OF THE MAGOTHY AQUIFER OF SEPTEMBER 1975 AND SEPTEMBER 1995 IN SOUTHERN MARYLAND, by Curtin, S.E., Mack, F.K., and Andreasen, D.C.: U.S. Geological Survey Open-File Report 96–625, 1996, 1 p.
THE DIFFERENCE BETWEEN THE POTENTIOMETRIC SURFACES OF THE MAGOTHY AQUIFER OF SEPTEMBER 1975 AND SEPTEMBER 1997 IN SOUTHERN MARYLAND, by Curtin, S.E., Mack, F.K., and Andreasen, D.C.: U.S. Geological Survey Open-File Report 99–84, 1999, 1 p.
THE DIFFERENCE BETWEEN THE POTENTIOMETRIC SURFACES OF THE MAGOTHY AQUIFER, SEPTEMBER 1975 AND SEPTEMBER 1999 IN SOUTHERN MARYLAND, by Curtin, S.E., Andreasen, D.C., and Wheeler, J.C.: U.S. Geological Survey Open-File Report 01–207, 2001, 1 p. (also available online at http://pubs.usgs.gov/of/2001/ofr01-207/pdf/ofr-01-207.pdf).
THE DIFFERENCE BETWEEN THE POTENTIOMETRIC SURFACES OF THE MAGOTHY AQUIFER, SEPTEMBER 1975 AND SEPTEMBER 2001 IN SOUTHERN MARYLAND, by Curtin, S.E., Andreasen, D.C., and Wheeler, J.C.: U.S. Geological Survey Open-File Report 02–445, 2002, 1 p., accessed May 1, 2002 at http://md.water.usgs.gov/publications/ofr-02-445/mg0175.pdf.
THE DIFFERENCE BETWEEN THE POTENTIOMETRIC SURFACES OF THE MAGOTHY AQUIFER, SEPTEMBER 1975 AND SEPTEMBER 2003 IN SOUTHERN MARYLAND, by Curtin, S.E., Andreasen, D.C., and Wheeler, J.C.: U.S. Geological Survey Open-File Report No. 2005–1007, 2005, 1 p. (also available online at http://pubs.usgs.gov/of/2005/1007/pdf/of20051007.pdf).
THE DIFFERENCE BETWEEN THE POTENTIOMETRIC SURFACES OF THE MAGOTHY AQUIFER IN SOUTHERN MARYLAND, SEPTEMBER 1975 AND SEPTEMBER 2007, by Curtin, S.E., Andreasen, D.C., and Staley, A.W.: U.S. Geological Survey Open-File Report 2009–1083, 2009, 1 p., accessed May 1, 2012 at http://md.water.usgs.gov/publications/ofr-2009-1083/Magothy%20Difference%20OFR%202009-1083.pdf.
THE DIFFERENCE BETWEEN THE POTENTIOMETRIC SURFACES OF THE MAGOTHY AQUIFER IN SOUTHERN MARYLAND, SEPTEMBER 1975 AND SEPTEMBER 2009, by Curtin, S.E., Andreasen, D.C., and Staley, A.W.: U.S. Geological Survey Open-File Report 2010–1204, 2010, 1 p., accessed May 1, 2012 at http://md.water.usgs.gov/publications/ofr-2010-1204/Magothy%20Difference%202009.pdf.
Appendixes 23
UPPER PATAPSCO AQUIFER
POTENTIOMETRIC SURFACE MAPS
POTENTIOMETRIC SURFACE OF THE UPPER PATAPSCO AQUIFER IN SOUTHERN MARYLAND, SEPTEMBER 1990, by Mack, F.K., Curtin, S.E., Andreasen, D.C., and Wheeler, J.C.: U.S. Geological Survey Open-File Report 92–461, 1992, 1 p.
POTENTIOMETRIC SURFACE OF THE UPPER PATAPSCO AQUIFER IN SOUTHERN MARYLAND, SEPTEMBER 1991, by Curtin, S.E., Andreasen, D.C., and Mack, F.K.: U.S. Geological Survey Open-File Report 93–654, 1993, 1 p.
POTENTIOMETRIC SURFACE OF THE UPPER PATAPSCO AQUIFER IN SOUTHERN MARYLAND, SEPTEMBER 1993, by Curtin, S.E., Mack, F.K., and Andreasen, D.C.: U.S. Geological Survey Open-File Report 94–392, 1994, 1 p.
POTENTIOMETRIC SURFACE OF THE UPPER PATAPSCO AQUIFER IN SOUTHERN MARYLAND, SEPTEMBER 1994, by Curtin, S.E., Mack, F.K., and Andreasen, D.C.: U.S. Geological Survey Open-File Report 95–745, 1995, 1 p.
POTENTIOMETRIC SURFACE OF THE UPPER PATAPSCO AQUIFER IN SOUTHERN MARYLAND, SEPTEMBER 1995, by Curtin, S.E., Mack, F.K., and Andreasen, D.C.: U.S. Geological Survey Open-File Report 96–622, 1996, 1 p.
POTENTIOMETRIC SURFACE OF THE UPPER PATAPSCO AQUIFER IN SOUTHERN MARYLAND, SEPTEMBER–OCTOBER 1996, by Curtin, S.E., Mack, F.K., and Andreasen, D.C.: U.S. Geological Survey Open-File Report 97–790, 1997, 1 p.
POTENTIOMETRIC SURFACE OF THE UPPER PATAPSCO AQUIFER IN SOUTHERN MARYLAND, SEPTEMBER 1997, by Curtin, S.E., Mack, F.K., and Andreasen, D.C.: U.S. Geological Survey Open-File Report 99–85, 1999, 1 p.
POTENTIOMETRIC SURFACE OF THE UPPER PATAPSCO AQUIFER IN SOUTHERN MARYLAND, SEPTEMBER 1998, by Curtin, S.E., Mack, F.K., and Andreasen, D.C.: U.S. Geological Survey Open-File Report 00–85, 2000, 1 p.
POTENTIOMETRIC SURFACE OF THE UPPER PATAPSCO AQUIFER IN SOUTHERN MARYLAND, SEPTEMBER 1999, by Curtin, S.E., Andreasen, D.C., and Wheeler, J.C.: U.S. Geological Survey Open-File Report 01–208, 2001, 1 p. (also available online at http://pubs.usgs.gov/of/2001/ofr01-208/pdf/ofr01-208.pdf).
POTENTIOMETRIC SURFACE OF THE UPPER PATAPSCO AQUIFER IN SOUTHERN MARYLAND, SEPTEMBER 2000, by Curtin, S.E., Andreasen, D.C., and Wheeler, J.C.: U.S. Geological Survey Open-File Report 02–246, 2002, 1 p. (also available online at http://pubs.usgs.gov/of/2002/0246/report.pdf).
POTENTIOMETRIC SURFACE OF THE UPPER PATAPSCO AQUIFER IN SOUTHERN MARYLAND, SEPTEMBER 2001, by Curtin, S.E., Andreasen, D.C. and Wheeler, J.C.: U.S. Geological Survey Open-File Report 02–446, 2002, 1 p., accessed May 1, 2012 at http://md.water.usgs.gov/publications/ofr-02-446/up2001.pdf.
POTENTIOMETRIC SURFACE OF THE UPPER PATAPSCO AQUIFER IN SOUTHERN MARYLAND, SEPTEMBER 2002, by Curtin, S.E., Andreasen, D.C., and Wheeler, J.C.: U.S. Geological Survey Open-File Report 03–257, 2003, 1 p. (also available online at http://pubs.usgs.gov/of/2003/ofr03-257/pdf/up2002.pdf).
POTENTIOMETRIC SURFACE OF THE UPPER PATAPSCO AQUIFER IN SOUTHERN MARYLAND, SEPTEMBER 2003, by Curtin, S.E., Andreasen, D.C., and Wheeler, J.C.: U.S. Geological Survey Open-File Report 2005–1008, 2005, 1 p. (also available online at http://pubs.usgs.gov/of/2005/1008/pdf/of20051008.pdf).
POTENTIOMETRIC SURFACE OF THE UPPER PATAPSCO AQUIFER IN SOUTHERN MARYLAND, SEPTEMBER 2007, by Curtin, S.E., Andreasen, D.C., and Staley, A.W.: U.S. Geological Survey Open-File Report 2009–1084, 2009, 1 p., accessed May 1, 2012 at http://md.water.usgs.gov/publications/ofr-2009-1084/Upper%20Patapsco%20OFR%202009-1084.pdf.
POTENTIOMETRIC SURFACE OF THE UPPER PATAPSCO AQUIFER IN SOUTHERN MARYLAND, SEPTEMBER 2009, by Curtin, S.E., Andreasen, D.C., and Staley, A.W.: U.S. Geological Survey Open-File Report 2010–1205, 2010, 1 p., accessed May 1, 2012 at http://md.water.usgs.gov/publications/ofr-2010-1205/Upper%20Patapsco%202009.pdf.

24 Potentiometric Surface and Water-Level Difference Maps of Selected Confined Aquifers in Southern Maryland, 1975–2011
WATER-LEVEL DIFFERENCE MAPS
THE DIFFERENCE BETWEEN THE POTENTIOMETRIC SURFACES OF THE UPPER PATAPSCO AQUIFER OF SEPTEMBER 1990 AND SEPTEMBER 1997 IN SOUTHERN MARYLAND, by Curtin, S.E., Mack, F.K., and Andreasen, D.C.: U.S. Geological Survey Open-File Report 99–86, 1999, 1 p.
THE DIFFERENCE BETWEEN THE POTENTIOMETRIC SURFACES OF THE UPPER PATAPSCO AQUIFER, SEPTEMBER 1990 AND SEPTEMBER 1999 IN SOUTHERN MARYLAND, by Curtin, S.E., Andreasen, D.C., and Wheeler, J.C.: U.S. Geological Survey Open-File Report No. 01–209, 2001, 1 p. (also available online at http://pubs.usgs.gov/of/2001/ofr01-209/pdf/ofr-01-209.pdf).
THE DIFFERENCE BETWEEN THE POTENTIOMETRIC SURFACES OF THE UPPER PATAPSCO AQUIFER, SEPTEMBER 1990 AND SEPTEMBER 2001 IN SOUTHERN MARYLAND, by Curtin, S.E., Andreasen, D.C., and Wheeler, J.C.: U.S. Geological Survey Open-File Report No. 02–447, 2002, 1 p., accessed May 1, 2012 at http://md.water.usgs.gov/publications/ofr-02-447/up0190.pdf.
THE DIFFERENCE BETWEEN THE POTENTIOMETRIC SURFACES OF THE UPPER PATAPSCO AQUIFER, SEPTEMBER 1990 AND SEPTEMBER 2003 IN SOUTHERN MARYLAND, by Curtin, S.E., Andreasen, D.C., and Wheeler, J.C.: U.S. Geological Survey Open-File Report No. 2005–1009, 2005, 1 p. (also available online at http://pubs.usgs.gov/of/2005/1009/pdf/of20051009.pdf).
THE DIFFERENCE BETWEEN THE POTENTIOMETRIC SURFACES OF THE UPPER PATAPSCO AQUIFER IN SOUTHERN MARYLAND, SEPTEMBER 1990 AND SEPTEMBER 2007, by Curtin, S.E., Andreasen, D.C., and Staley, A.W.: U.S. Geological Survey Open-File Report 2009–1085, 2009, 1 p., accessed May 1, 2012 at http://md.water.usgs.gov/publications/ofr-2009-1085/Upper%20Patapsco%20Difference%20OFR%202009-1085.pdf.
THE DIFFERENCE BETWEEN THE POTENTIOMETRIC SURFACES OF THE UPPER PATAPSCO AQUIFER IN SOUTHERN MARYLAND, SEPTEMBER 1990 AND SEPTEMBER 2009, by Curtin, S.E., Andreasen, D.C., and Staley, A.W.: U.S. Geological Survey Open-File Report No. 2010–1206, 2010, 1 p., accessed May 1, 2012 at http://md.water.usgs.gov/publications/ofr-2010-1206/Upper%20Patapsco%20Difference%202009.pdf.
LOWER PATAPSCO AQUIFER
POTENTIOMETRIC SURFACE MAPS
POTENTIOMETRIC SURFACE OF THE LOWER PATAPSCO AQUIFER IN SOUTHERN MARYLAND, SEPTEMBER 1990, by Mack, F.K., Curtin, S.E., Andreasen, D.C., and Wheeler, J.C.: U.S. Geological Survey Open-File Report 92–462, 1992, 1 p.
POTENTIOMETRIC SURFACE OF THE LOWER PATAPSCO AQUIFER IN SOUTHERN MARYLAND, SEPTEMBER 1991, by Curtin, S.E., Andreasen, D.C., and Mack, F.K.: U.S. Geological Survey Open-File Report 93–655, 1993, 1 p.
POTENTIOMETRIC SURFACE OF THE LOWER PATAPSCO AQUIFER IN SOUTHERN MARYLAND, SEPTEMBER 1993, by Curtin, S.E., Mack, F.K., and Andreasen, D.C.: U.S. Geological Survey Open-File Report 94–393, 1993, 1 p.
POTENTIOMETRIC SURFACE OF THE LOWER PATAPSCO AQUIFER IN SOUTHERN MARYLAND, SEPTEMBER 1994, by Curtin, S.E. and Andreasen, D.C.: U.S. Geological Survey Open-File Report 95–746, 1995, 1 p.
POTENTIOMETRIC SURFACE OF THE LOWER PATAPSCO AQUIFER IN SOUTHERN MARYLAND, SEPTEMBER 1995, by Curtin, S.E., Andreasen, D.C., and Mack, F.K.: U.S. Geological Survey Open-File Report 96–623, 1996, 1 p.
POTENTIOMETRIC SURFACE OF THE LOWER PATAPSCO AQUIFER IN SOUTHERN MARYLAND, SEPTEMBER-OCTOBER 1996, by Curtin, S.E., Andreasen, D.C., and Mack, F.K.: U.S. Geological Survey Open-File Report 97–791, 1997, 1 p.
POTENTIOMETRIC SURFACE OF THE LOWER PATAPSCO AQUIFER IN SOUTHERN MARYLAND, SEPTEMBER 1997, by Curtin, S.E., Andreasen, D.C., and Mack, F.K.: U.S. Geological Survey Open-File Report 99–87, 1999, 1 p.
POTENTIOMETRIC SURFACE OF THE LOWER PATAPSCO AQUIFER IN SOUTHERN MARYLAND, SEPTEMBER 1998, by Curtin, S.E., Andreasen, D.C., and Mack, F.K.: U.S. Geological Survey Open-File Report 00–86, 2000, 1 p.

Appendixes 25
POTENTIOMETRIC SURFACE OF THE LOWER PATAPSCO AQUIFER IN SOUTHERN MARYLAND, SEPTEMBER 1999, by Curtin, S.E., Andreasen, D.C., and Wheeler, J.C.: U.S. Geological Survey Open-File Report 01–210, 2001, 1 p. (also available online at http://pubs.usgs.gov/of/2001/ofr01-210/pdf/ofr-01-210.pdf).
POTENTIOMETRIC SURFACE OF THE LOWER PATAPSCO AQUIFER IN SOUTHERN MARYLAND, SEPTEMBER 2000, by Curtin, S.E., Andreasen, D.C., and Wheeler, J.C.: U.S. Geological Survey Open-File Report 02–247, 2002, 1 p. (also available online at http://pubs.usgs.gov/of/2002/0247/report.pdf).
POTENTIOMETRIC SURFACE OF THE LOWER PATAPSCO AQUIFER IN SOUTHERN MARYLAND, SEPTEMBER 2001, by Curtin, S.E., Andreasen D.C., and Wheeler, J.C.: U.S. Geological Survey Open-File Report 02–448, 2002, 1 p. (also available online at http://pubs.usgs.gov/of/2002/ofr02-448/pdf/lp2001.pdf).
POTENTIOMETRIC SURFACE OF THE LOWER PATAPSCO AQUIFER IN SOUTHERN MARYLAND, SEPTEMBER 2002, by Curtin, S.E., Andreasen, D.C., and Wheeler, J.C.: U.S. Geological Survey Open-File Report 03–258, 2003, 1 p. (also available online at http://pubs.usgs.gov/of/2003/ofr03-258/pdf/lp2002.pdf).
POTENTIOMETRIC SURFACE MAP OF THE LOWER PATAPSCO AQUIFER IN SOUTHERN MARYLAND, SEPTEMBER 2003, by Curtin, S.E., Andreasen, D.C., and Wheeler, J.C.: U.S. Geological Survey Open-File Report 2005–1010, 2005, 1 p. (also available online at http://pubs.usgs.gov/of/2005/1010/pdf/of20051010.pdf).
POTENTIOMETRIC SURFACE OF THE LOWER PATAPSCO AQUIFER IN SOUTHERN MARYLAND, SEPTEMBER 2007, by Curtin, S.E., Andreasen, D.C., and Staley, A.W.: U.S. Geological Survey Open-File Report 2009–1086, 2009, 1 p., accessed May 1, 2012 at http://md.water.usgs.gov/publications/ofr-2009-1086/Lower%20Patapsco%20OFR%202009-1086.pdf.
POTENTIOMETRIC SURFACE OF THE LOWER PATAPSCO AQUIFER IN SOUTHERN MARYLAND, SEPTEMBER 2009, by Curtin, S.E., Andreasen, D.C., and Staley, A.W.: U.S. Geological Survey Open-File Report 2010–1207, 2010, 1 p., accessed May 1, 2012 at http://md.water.usgs.gov/publications/ofr-2010-1207/Lower%20Patapsco%202009.pdf.
WATER-LEVEL DIFFERENCE MAPS
THE DIFFERENCE BETWEEN THE POTENTIOMETRIC SURFACES OF THE LOWER PATAPSCO AQUIFER OF SEPTEMBER 1990 AND SEPTEMBER 1997 IN SOUTHERN MARYLAND, by Curtin, S.E., Mack, F.K., and Andreasen, D.C.: U.S. Geological Survey Open-File Report 99–88, 1999, 1 p.
THE DIFFERENCE BETWEEN THE POTENTIOMETRIC SURFACES OF THE LOWER PATAPSCO AQUIFER, SEPTEMBER 1990 AND SEPTEMBER 1999 IN SOUTHERN MARYLAND, by Curtin, S.E., Andreasen, D.C., and Wheeler, J.C.: U.S. Geological Survey Open-File Report 01–211, 2001, 1 p. (also available online at http://pubs.usgs.gov/of/2001/ofr01-211/pdf/ofr-01-211.pdf).
THE DIFFERENCE BETWEEN THE POTENTIOMETRIC SURFACES OF THE LOWER PATAPSCO AQUIFER, SEPTEMBER 1990 AND SEPTEMBER 2001 IN SOUTHERN MARYLAND, by Curtin, S.E., Andreasen, D.C., and Wheeler, J.C.: U.S. Geological Survey Open-File Report 02–449, 2002, 1 p. (also available online at http://pubs.usgs.gov/of/2002/ofr02-449/pdf/lp0190.pdf).
THE DIFFERENCE BETWEEN THE POTENTIOMETRIC SURFACES OF THE LOWER PATAPSCO AQUIFER SEPTEMBER 1990 AND SEPTEMBER 2003 IN SOUTHERN MARYLAND, by Curtin, S.E., Andreasen, D.C., and Wheeler, J.C.: U.S. Geological Survey Open-File Report No. 2005–1011, 2005, 1 p. (also available online at http://pubs.usgs.gov/of/2005/1011/pdf/of20031011.pdf).
THE DIFFERENCE BETWEEN THE POTENTIOMETRIC SURFACES OF THE LOWER PATAPSCO AQUIFER IN SOUTHERN MARYLAND, SEPTEMBER 1990 AND SEPTEMBER 2007, by Curtin, S.E., Andreasen, D.C., and Staley, A.W.: U.S. Geological Survey Open-File Report 2009–1087, 2009, 1 p., accessed May 1, 2012 at http://md.water.usgs.gov/publications/ofr-2009-1087/Lower%20Patapsco%20Difference%20OFR%202009-1087.pdf.
THE DIFFERENCE BETWEEN THE POTENTIOMETRIC SURFACES OF THE LOWER PATAPSCO AQUIFER IN SOUTHERN MARYLAND, SEPTEMBER 1990 AND SEPTEMBER 2009, by Curtin, S.E., Andreasen, D.C., and Staley, A.W.: U.S. Geological Survey Open-File Report No. 2010–1208, 2010, 1 p., accessed May 1, 2012 at http://md.water.usgs.gov/publications/ofr-2010-1208/Lower%20Patapsco%20Difference%202009.pdf.

26 Potentiometric Surface and Water-Level Difference Maps of Selected Confined Aquifers in Southern Maryland, 1975–2011
PATUXENT AQUIFER
POTENTIOMETRIC SURFACE MAPS
POTENTIOMETRIC SURFACE OF THE PATUXENT AQUIFER IN SOUTHERN MARYLAND, SEPTEMBER 2007, by Curtin, S.E., Andreasen, D.C., and Staley, A.W.: U.S. Geological Survey Open-File Report 2009–1088, 2009, 1 p., accessed May 1, 2012 at http://md.water.usgs.gov/publications/ofr-2009-1088/Patuxent%20OFR%202009-1088.pdf.
POTENTIOMETRIC SURFACE OF THE PATUXENT AQUIFER IN SOUTHERN MARYLAND, SEPTEMBER 2009, by Curtin, S.E., Andreasen, D.C., and Staley, A.W.: U.S. Geological Survey Open-File Report 2010–1209, 2010, 1 p., accessed May 1, 2012 at http://md.water.usgs.gov/publications/ofr-2010-1209/Patuxent%202009.pdf.
Appendix 2a. Water-level data for Southern Maryland and Maryland’s Eastern Shore wells used in this report (Aquia aquifer). —Continued
[All depth and altitude measurements are in feet. Land and water altitudes are measured from the National Geodetic Vertical Datum of 1929 (NGVD 29). Digital latitude and longitude measured relative to North American Datum 1983 (NAD 83); --, no data; USGS, U.S. Geological Survey]
Well numberUSGS site
identification number
LatitudeNAD 83
(decimal degrees)
LongitudeNAD 83
(decimal degrees)
Surface altitude(NGVD 29)
(feet)
Water-levelaltitude
2011
Water-leveldifference1982–2011
AA Cf 122 390149076261702 39.03061111 -76.43738889 20 2.13 -0.38AA Cg 25 390127076240301 39.02427797 -76.40051418 17.33 1.64 0.40AA De 102 385512076331602 38.92002778 -76.55419444 49.57 9.26 -0.51AA De 137 385930076342102 38.99177795 -76.57218569 133.6 49.66 8.06AA De 195 385628076323603 38.94122379 -76.54301693 37 2.51 --AA Df 98 385550076292101 38.93066879 -76.48884808 11.31 3.21 1.82AA Df 103 385623076274401 38.93983528 -76.46190312 26.51 4.73 --AA Ed 45 385406076383901 38.90205556 -76.64366667 110 39.40 -4.16AA Ed 49 385249076382101 38.88808333 -76.63933333 60 20.41 -5.68AA Ee 67 385124076322001 38.85661111 -76.53805556 11.2 -6.65 -4.57AA Fc 35 384833076415602 38.80928124 -76.69857717 51.3 -1.55 --AA Fd 46 384727076382501 38.79575000 -76.63686111 140.25 -21.47 -24.65AA Fe 46 384840076312801 38.81147222 -76.52425000 8.48 -21.97 -16.93AA Fe 48 384508076334101 38.75244444 -76.56119444 85 -35.55 -26.48AA Fe 60 384917076305802 38.82150473 -76.51579051 8.5 -17.66 --AA Fe 92 384644076331201 38.77900546 -76.55301359 9 -33.46 --CA Ba 11 384357076401601 38.73261660 -76.67079721 115.31 -37.68 -34.25CA Ba 13 384231076412501 38.70872819 -76.68996469 56 -40.15 -41.50CA Bb 27 384333076394701 38.72595018 -76.66274113 137.87 -42.02 -39.81CA Bb 33 384222076380101 38.70622871 -76.63329482 110.6 -49.80 -45.84CA Bc 44 384243076320201 38.71206271 -76.53356707 7.57 -50.49 --CA Cb 26 383837076381001 38.64373027 -76.63579433 115.29 -57.58 -55.38CA Cb 32 383632076392701 38.60900883 -76.65718402 95.2 -62.26 -54.94CA Cc 18 383940076314801 38.66141667 -76.52972222 111.31 -54.69 -47.41CA Cc 57 383605076344601 38.60119444 -76.57969444 138.6 -62.93 -55.28

Appendixes 27
Appendix 2a. Water-level data for Southern Maryland and Maryland’s Eastern Shore wells used in this report (Aquia aquifer). —Continued
[All depth and altitude measurements are in feet. Land and water altitudes are measured from the National Geodetic Vertical Datum of 1929 (NGVD 29). Digital latitude and longitude measured relative to North American Datum 1983 (NAD 83); --, no data; USGS, U.S. Geological Survey]
Well numberUSGS site
identification number
LatitudeNAD 83
(decimal degrees)
LongitudeNAD 83
(decimal degrees)
Surface altitude(NGVD 29)
(feet)
Water-levelaltitude
2011
Water-leveldifference1982–2011
CA Cc 58 383924076341201 38.65678589 -76.56967972 122.5 -54.90 -51.00CA Db 40 383053076382101 38.51484463 -76.63884873 23.38 -73.06 --CA Db 47 383239076354201 38.54428840 -76.59468004 140.4 -75.93 -60.56CA Dc 29 383025076304701 38.50706708 -76.51273101 123.1 -70.23 -56.09CA Ed 42 382528076280701 38.43123443 -76.46300729 121.72 -86.34 -57.49CA Ed 52 382549076260101 38.43040093 -76.43328409 10 -99.10 -70.30CA Fd 54 382407076260301 38.40206788 -76.43383978 129.4 -106.63 -76.78CA Fe 30 382134076233301 38.35956803 -76.39217179 118.82 -118.28 --CA Gd 6 381952076270901 38.33123539 -76.45217406 12.58 -142.41 -96.81CA Gd 61 381956076275301 38.33222222 -76.46472222 18.1 -136.96 --CH Bg 11 383536076473601 38.59345318 -76.79302354 196.78 -46.94 -51.18CH Ce 41 382225076591002 38.54039844 -76.98580733 194.23 -28.75 --CH Ce 62 383348076595401 38.56333333 -76.99833333 195 -15.03 --CH Ch 15 383043076404501 38.51206691 -76.67885078 9.78 -72.05 -62.06CH Df 17 382800076530301 38.46678988 -76.88385908 160.97 -67.37 -68.00CH Ff 59 381639076523201 38.27762869 -76.87524772 8 -47.87 -41.10DO Db 19 382847076190901 38.48019444 -76.31938889 1.5 -70.04 --KE Cb 100 391124076101004 39.18986111 -76.16861111 65.69 25.45 --KE Db 42 390909076122302 39.15294444 -76.20630556 25 11.98 --KE Dc 91 390626076083302 39.10733302 -76.14217115 4.64 0.16 --PG Hf 35 383228076410601 38.54123278 -76.68468474 11.22 -70.21 -63.97PG Hf 42 383348076411303 38.56338889 -76.68530556 27.76 -67.67 -62.31QA Be 17 391203076024303 39.20094315 -76.04494493 25 18.00 4.87QA Cf 78 390845075582302 39.14583333 -75.97305556 61 -3.09 --QA Db 32 390201076182703 39.03372248 -76.30717813 18 1.80 --QA Db 35 390119076191001 39.02205595 -76.31912290 7.5 1.85 --QA Db 37 390023076174302 39.00650065 -76.29495549 7.1 -0.79 --QA De 27 390251076034401 39.04761175 -76.06188876 10.19 -21.29 --QA Ea 78 385718076211502 38.95511290 -76.35384487 11.8 -1.10 --QA Ea 80 385757076200102 38.96594599 -76.33328901 8.5 -2.18 --QA Eb 113 385748076172001 38.96344615 -76.28856542 11.34 -8.61 -3.47QA Eb 155 385843076155302 38.97872357 -76.26439846 3.9 -7.11 --QA Eb 156 385852076195201 38.98122338 -76.33078935 12.01 -1.77 --QA Fc 7 385429076120201 38.90816973 -76.20022712 10 -26.63 -15.54SM Bb 15 382838076470101 38.47755556 -76.78322222 165.3 -73.85 -71.08SM Cc 8 382235076435801 38.37722222 -76.73247222 128.85 -69.87 --SM Cc 22 382055076404601 38.34873729 -76.67912944 133 -65.37 -54.67
28 Potentiometric Surface and Water-Level Difference Maps of Selected Confined Aquifers in Southern Maryland, 1975–2011
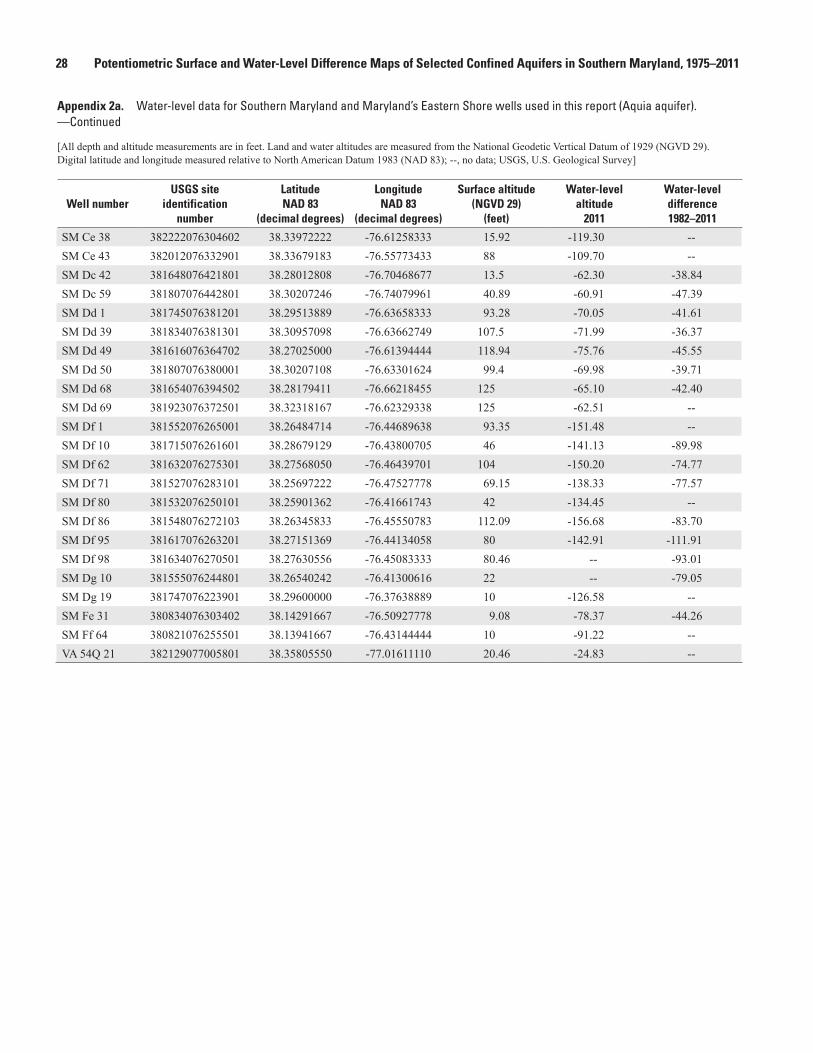
Appendix 2a. Water-level data for Southern Maryland and Maryland’s Eastern Shore wells used in this report (Aquia aquifer). —Continued
[All depth and altitude measurements are in feet. Land and water altitudes are measured from the National Geodetic Vertical Datum of 1929 (NGVD 29). Digital latitude and longitude measured relative to North American Datum 1983 (NAD 83); --, no data; USGS, U.S. Geological Survey]
Well numberUSGS site
identification number
LatitudeNAD 83
(decimal degrees)
LongitudeNAD 83
(decimal degrees)
Surface altitude(NGVD 29)
(feet)
Water-levelaltitude
2011
Water-leveldifference1982–2011
SM Ce 38 382222076304602 38.33972222 -76.61258333 15.92 -119.30 --SM Ce 43 382012076332901 38.33679183 -76.55773433 88 -109.70 --SM Dc 42 381648076421801 38.28012808 -76.70468677 13.5 -62.30 -38.84SM Dc 59 381807076442801 38.30207246 -76.74079961 40.89 -60.91 -47.39SM Dd 1 381745076381201 38.29513889 -76.63658333 93.28 -70.05 -41.61SM Dd 39 381834076381301 38.30957098 -76.63662749 107.5 -71.99 -36.37SM Dd 49 381616076364702 38.27025000 -76.61394444 118.94 -75.76 -45.55SM Dd 50 381807076380001 38.30207108 -76.63301624 99.4 -69.98 -39.71SM Dd 68 381654076394502 38.28179411 -76.66218455 125 -65.10 -42.40SM Dd 69 381923076372501 38.32318167 -76.62329338 125 -62.51 --SM Df 1 381552076265001 38.26484714 -76.44689638 93.35 -151.48 --SM Df 10 381715076261601 38.28679129 -76.43800705 46 -141.13 -89.98SM Df 62 381632076275301 38.27568050 -76.46439701 104 -150.20 -74.77SM Df 71 381527076283101 38.25697222 -76.47527778 69.15 -138.33 -77.57SM Df 80 381532076250101 38.25901362 -76.41661743 42 -134.45 --SM Df 86 381548076272103 38.26345833 -76.45550783 112.09 -156.68 -83.70SM Df 95 381617076263201 38.27151369 -76.44134058 80 -142.91 -111.91SM Df 98 381634076270501 38.27630556 -76.45083333 80.46 -- -93.01SM Dg 10 381555076244801 38.26540242 -76.41300616 22 -- -79.05SM Dg 19 381747076223901 38.29600000 -76.37638889 10 -126.58 --SM Fe 31 380834076303402 38.14291667 -76.50927778 9.08 -78.37 -44.26SM Ff 64 380821076255501 38.13941667 -76.43144444 10 -91.22 --VA 54Q 21 382129077005801 38.35805550 -77.01611110 20.46 -24.83 --

Appendixes 29
Appendix 2b. Water-level data for Southern Maryland and Maryland’s Eastern Shore wells used in this report (Magothy aquifer). —Continued
[All depth and altitude measurements are in feet. Land and water altitudes are measured from the National Geodetic Vertical Datum of 1929 (NGVD 29). Digital latitude and longitude measured relative to North American Datum 1983 (NAD 83); --, no data; USGS, U.S. Geological Survey]
Well numberUSGS site
identification number
LatitudeNAD 83
(decimal degrees)
LongitudeNAD 83
(decimal degrees)
Surface altitude(NGVD 29)
(feet)
Water-levelaltitude
2011
Water-leveldifference1975–2011
AA Cc 95 390247076403501 39.04649876 -76.67607829 131.09 87.78 -1.84AA Cc 117 390103076402603 39.01761031 -76.67357794 134.14 47.20 --AA Cd 12 390124076361202 39.02344392 -76.60302027 98.82 12.59 -9.99AA Cd 48 390001076364301 39.00038866 -76.61163149 102.8 9.02 -13.84AA Cd 78 390238076373301 39.04399906 -76.62552112 128.82 39.46 -8.81AA Ce 103 390214076342201 39.03733276 -76.57246385 59.2 2.70 0.16AA Ce 128 390404076300703 39.06788823 -76.50162836 7.13 -8.37 --AA Ce 130 390148076325202 39.03011077 -76.54746303 2.68 -9.54 --AA Ce 133 390410076302401 39.06955484 -76.50635074 15.14 -4.02 --AA Ce 138 390049076322702 39.01372216 -76.54051831 69 -15.98 -16.49AA Ce 151 390132076311401 39.02561111 -76.52061111 84 -17.07 -18.63AA Cf 99 390150076283002 39.03066661 -76.47468304 93.7 -28.13 -28.59AA Cf 104 390242076274501 39.04522222 -76.46233333 26.77 -24.33 -25.16AA Cf 152 390121076253301 39.02258333 -76.42630556 22 -24.83 --AA Cg 7 390123076241102 39.02316687 -76.40273647 17 -16.19 -18.75AA Dc 15 385928076414601 38.99122176 -76.69580059 109.99 31.63 -6.15AA Dc 20 385637076400802 38.94372222 -76.66819444 92.19 14.49 -15.50AA Dd 37 385807076351901 38.96872286 -76.58829686 132.93 -8.99 -19.79AA Dd 40 385511076373101 38.91986111 -76.62488889 135.79 -4.16 -25.55AA Dd 42 385808076373502 38.96900041 -76.62607589 105.48 5.10 -18.29AA De 1 385915076340401 38.98761141 -76.56718545 13.72 -24.06 -25.31AA De 103 385512076331603 38.92002778 -76.55413889 49.67 -13.93 -25.55AA De 124 385528076334601 38.92455556 -76.56219444 27.84 -13.70 -26.22AA De 135 385932076344401 38.99233346 -76.57857479 48.8 -5.52 --AA Df 20 385916076270702 38.98788963 -76.45162640 21.87 -21.29 -23.07AA Df 79 385905076293601 38.98483408 -76.49301641 5.17 -20.46 -24.73AA Df 82 385953076280201 38.99816712 -76.46690492 87.77 -23.12 -23.14AA Df 84 385518076282701 38.92178016 -76.47384740 7.32 -22.64 -30.25AA Df 87 385934076274301 38.99288949 -76.46162684 19.86 -21.27 --AA Ed 39 385210076371002 38.86955831 -76.61912966 176.47 -5.98 -24.75AA Ed 65 385406076383902 38.90219444 -76.64361111 110 0.87 --AA Fc 34 384833076415601 38.80928124 -76.69857717 51 -3.64 --AA Fe 47 384843076312601 38.81236111 -76.52386111 6.36 -15.98 -30.28

30 Potentiometric Surface and Water-Level Difference Maps of Selected Confined Aquifers in Southern Maryland, 1975–2011
Appendix 2b. Water-level data for Southern Maryland and Maryland’s Eastern Shore wells used in this report (Magothy aquifer). —Continued
[All depth and altitude measurements are in feet. Land and water altitudes are measured from the National Geodetic Vertical Datum of 1929 (NGVD 29). Digital latitude and longitude measured relative to North American Datum 1983 (NAD 83); --, no data; USGS, U.S. Geological Survey]
Well numberUSGS site
identification number
LatitudeNAD 83
(decimal degrees)
LongitudeNAD 83
(decimal degrees)
Surface altitude(NGVD 29)
(feet)
Water-levelaltitude
2011
Water-leveldifference1975–2011
AA Fe 51AA Fe 93CA Bb 10CA Bb 23CA Bb 25CA Cc 56CA Dc 35CH Be 17CH Be 43CH Bf 98CH Bf 124CH Bf 133CH Bf 134CH Bf 135CH Bf 143CH Cf 29CH Cf 39DO Ce 15KE Be 43KE Cb 97PG Cf 33PG De 21PG De 32PG Ed 50PG Ef 34PG Ef 40PG Fd 32PG Fd 39PG Fe 30PG Ge 15PG Gf 35PG Hf 41QA Ea 27
384917076305801384644076331202384028076354201384458076375501384109076391101383934076320001383050076305501383502076565101383819076555501383739076543001383750076540801383640076545901383728076531701383814076500301383918076522201383219076503502383259076531001383408076042402391823075594701391124076101001385806076435303385130076465501385323076471801384715076522001384623076424001384847076440401384148076510901384410076502501384453076482101383940076461301383832076414701383348076411302385718076205501
38.8215047338.7790054638.6745631038.7495609738.6859513038.6595638338.5140113838.5840084238.6387290938.6276183938.6306738838.6112299638.6245630138.6373406138.6551177238.5387323838.5496777838.5690555639.3067222239.1900000038.9684442738.8588333338.8898346138.7877777838.7731666738.8131666738.6967832338.7354444438.7480555638.6612290438.6421388938.5633888938.95400183
-76.51579051-76.55301359-76.59468126-76.63162850-76.65274014-76.53301106-76.51495340-76.94719515-76.93163942-76.90830529-76.90191623-76.91608320-76.88774907-76.83385862-76.87247107-76.84274687-76.88629444-76.07288889-75.99505556-76.16872222-76.73107937-76.78161111-76.78802541-76.87166667-76.71113889-76.73380556-76.85219305-76.83980556-76.80569444-76.76996804-76.69686111-76.68538889-76.34801133
8.511.38
186.9146.86119.7896.1191.6
204.23216.79216.39207.78223.5202.09207.82206.59178.02139.59
66565.84
115.495.76
131.85240.8839.1879.85
226233.42237.59210.5134.9628.318.27
-16.62-15.85-37.75-22.51-33.34-39.08-41.99-65.09-60.72-75.10-75.58-79.39-75.41-52.68-73.56-63.95-68.80-10.7732.174.68
49.5833.1450.6316.56-8.941.18
-33.50-9.53-8.13
-33.62-34.92-54.33-19.63
----
-45.55-36.31-44.43-47.77-51.29-71.09-70.25-79.05-85.14-35.98-81.84-67.24
---75.52
---2.77
------
-16.62-11.62
---29.45
---56.63-35.40-36.24-51.16-48.86-42.33-26.35

Appendixes 31
Appendix 2c. Water-level data for Southern Maryland and Maryland’s Eastern Shore wells used in this report (upper Patapsco aquifer).—Continued
[All depth and altitude measurements are in feet. Land and water altitudes are measured from the National Geodetic Vertical Datum of 1929 (NGVD 29). Digital latitude and longitude measured relative to North American Datum 1983 (NAD 83); --, no data; USGS, U.S. Geological Survey]
Well numberUSGS site
identification number
LatitudeNAD 83
(decimal degrees)
LongitudeNAD 83
(decimal degrees)
Surface altitude(NGVD 29)
(feet)
Water-levelaltitude
2011
Water-leveldifference1990–2011
AA Bd 159 390737076374402 39.12708333 -76.62908333 75.48 38.24 1.69AA Be 102 390559076312602 39.10005556 -76.52425000 36.36 10.31 0.69AA Bf 100 390629076273601 39.10838889 -76.45955556 52 24.57 --AA Cc 43 390422076414501 39.07288717 -76.69552364 180 119.67 -0.85AA Ce 120 390303076344301 39.05094364 -76.57829744 161.8 6.34 -3.18AA Ce 137 390043076345402 39.01205531 -76.58135287 57.5 -1.86 --AA Cf 128 390149076261703 39.03038892 -76.43773751 14 -24.66 -9.46AA Cf 134 390121076270501 39.02261122 -76.45107122 24 -26.68 -13.14AA Cg 24 390123076241603 39.02316687 -76.40412540 12.68 -19.06 -12.70AA De 95 385853076333001 38.98150050 -76.55801837 73.2 -34.55 -28.99AA De 128 385530076334701 38.92488889 -76.56261111 28.31 -12.44 -14.76AA De 199 385753076310801 38.96433333 -76.51944444 35 -22.36 -13.60AA De 230 385627076322901 38.94080556 -76.54144444 33 -19.09 --AA Df 19 385921076270701 38.98955626 -76.45079309 15.84 -21.56 -12.95AA Df 89 385934076274302 38.99288949 -76.46162684 20.58 -22.57 -8.52AA Df 99 385905076293604 38.98483408 -76.49301641 5.17 -27.27 -6.01AA Ec 12 385125076404801 38.85694444 -76.67947222 55 -1.70 --CA Cc 55 383934076320201 38.66000000 -76.53388889 105 -13.41 -10.74CA Db 96 383244076354201 38.54567726 -76.59468006 152.42 -44.07 --CE Ce 56 393026075523101 39.50761111 -75.87491667 38 8.42 -0.22CE Ee 29 392403075521801 39.40147222 -75.87152778 75 -13.93 -16.08CH Be 60 383706076575604 38.61845178 -76.96525147 212.8 -57.31 -35.18CH Bf 151 383508076540703 38.58567521 -76.90163812 192.8 -69.56 -30.62CH Bf 157 383637076545803 38.61122996 -76.9160832 225 -72.70 -28.00CH Bf 158 383732076531902 38.62484077 -76.88830465 193 -57.10 -27.12CH Cd 31 383222077004401 38.53956505 -77.01191924 130 -91.98 --CH Cd 54 383346077000901 38.56277778 -77.00250000 180 -96.01 --CH Ce 16 383217076590201 38.53764167 -76.98323056 187.45 -110.10 -31.16CH Ce 50 383420076592501 38.57232222 -76.98957778 202.18 -65.72 -14.87CH Cg 24 383254076481401 38.54877778 -76.80338889 171.88 -57.64 -54.43CH Da 21 382659077152401 38.44984513 -77.25636926 90 -14.76 -11.07

32 Potentiometric Surface and Water-Level Difference Maps of Selected Confined Aquifers in Southern Maryland, 1975–2011
Appendix 2c. Water-level data for Southern Maryland and Maryland’s Eastern Shore wells used in this report (upper Patapsco aquifer).—Continued
[All depth and altitude measurements are in feet. Land and water altitudes are measured from the National Geodetic Vertical Datum of 1929 (NGVD 29). Digital latitude and longitude measured relative to North American Datum 1983 (NAD 83); --, no data; USGS, U.S. Geological Survey]
Well numberUSGS site
identification number
LatitudeNAD 83
(decimal degrees)
LongitudeNAD 83
(decimal degrees)
Surface altitude(NGVD 29)
(feet)
Water-levelaltitude
2011
Water-leveldifference1990–2011
CH Dd 33CH Dd 38CH Fe 5KE Ac 20KE Cb 36KE Cb 103KE Db 40PG De 33PG Fb 36PG Hf 40PG Hf 44QA Be 16QA Eb 111QA Ef 29SM Bc 41SM Dc 64SM Dd 78SM Dd 79SM Dd 80SM Dd 81SM Dd 83SM De 52SM De 59SM Df 84SM Df 88SM Df 100SM Ef 94SM Ff 36SM Ff 65TA Cd 57
382607077002601382925077010101381803076550801392007076075501391400076101401391124076101005390837076140401385323076471802384423077004501383348076411301383250076405304391203076024302385751076171601385534075573601382621076445301381559076400201381827076350402381834076381303381616076384503381509076351401381621076364701381753076310001381914076331002381548076272102381955076293901381721076264801381440076271701380724076251901380823076255501384709076050301
38.4911666738.4992027838.3009613139.3349166739.2331666739.1898611139.1437777838.8894444438.7397777838.5635000038.5473437339.2009431538.9642794638.9273356038.4391111138.2665167338.3076259238.3086111138.2712385338.2561111138.2725000038.2981807538.3200000038.2634583338.3320690138.2891666738.2444444438.1226111138.1398611138.78594908
-76.92347222-77.01667778-76.91858214-76.13150000-76.17061111-76.16836111-76.23416667-76.79786111-77.01216667-76.68533333-76.68107351-76.04494493-76.28745430-75.96077192-76.74788889-76.66690712-76.58412478-76.63472222-76.64551709-76.58472222-76.61305556-76.51634354-76.55277778-76.45550783-76.49384225-76.44652778-76.45472222-76.42166667-76.43208333-76.08383090
99.877.19127
4065.615
103.687827.9810.452514.0361.69
16033
13011327
114120110151108.392021807.51
1012
-43.27-73.81-55.24-0.94-6.00-8.30-8.6652.60
-26.75-47.54-62.80-17.20-19.58-20.55-58.02-62.01-71.30-77.93-65.19-62.94-56.98-73.07-71.92-64.54-63.81-60.70-70.23-43.30-45.20-56.17
-33.81----
-5.42-8.57
---9.45-6.20
-22.60-24.86-39.26-20.95-17.04-14.89
------------------
-46.52------
-29.28----
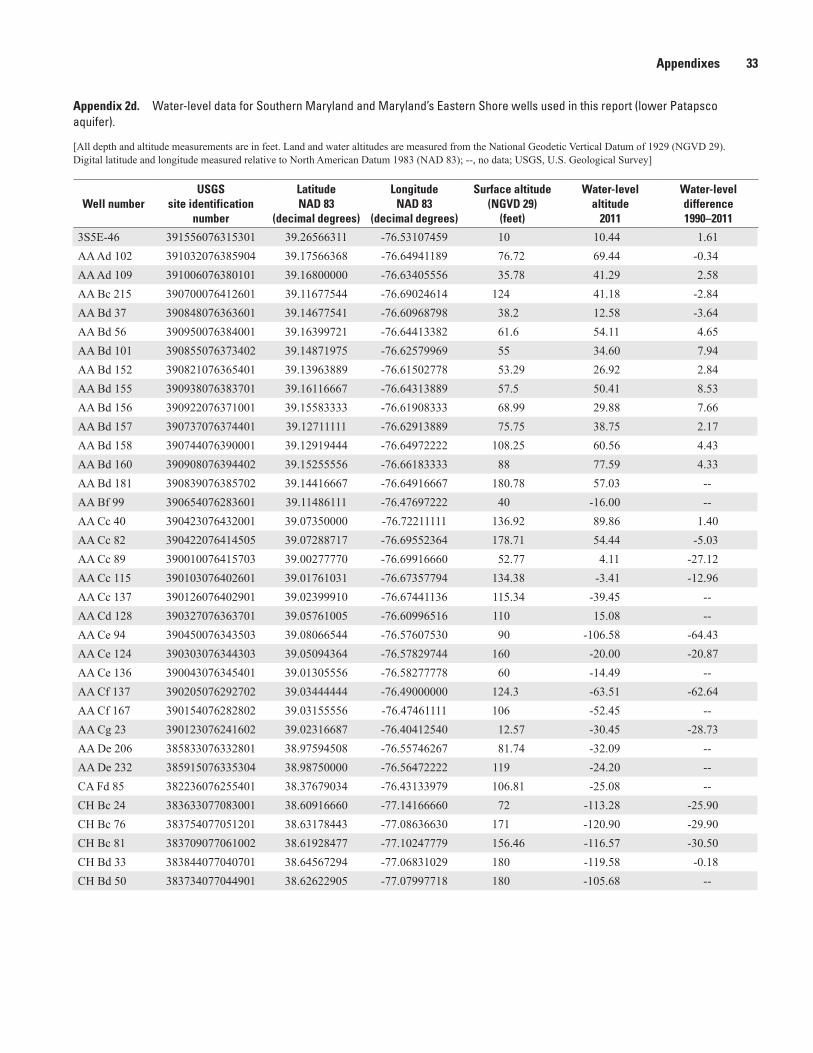
Appendixes 33
Appendix 2d. Water-level data for Southern Maryland and Maryland’s Eastern Shore wells used in this report (lower Patapsco aquifer).—Continued
[All depth and altitude measurements are in feet. Land and water altitudes are measured from the National Geodetic Vertical Datum of 1929 (NGVD 29). Digital latitude and longitude measured relative to North American Datum 1983 (NAD 83); --, no data; USGS, U.S. Geological Survey]
Well numberUSGS
site identification number
LatitudeNAD 83
(decimal degrees)
LongitudeNAD 83
(decimal degrees)
Surface altitude(NGVD 29)
(feet)
Water-levelaltitude
2011
Water-leveldifference1990–2011
3S5E-46 391556076315301 39.26566311 -76.53107459 10 10.44 1.61AA Ad 102 391032076385904 39.17566368 -76.64941189 76.72 69.44 -0.34AA Ad 109 391006076380101 39.16800000 -76.63405556 35.78 41.29 2.58AA Bc 215 390700076412601 39.11677544 -76.69024614 124 41.18 -2.84AA Bd 37 390848076363601 39.14677541 -76.60968798 38.2 12.58 -3.64AA Bd 56 390950076384001 39.16399721 -76.64413382 61.6 54.11 4.65AA Bd 101 390855076373402 39.14871975 -76.62579969 55 34.60 7.94AA Bd 152 390821076365401 39.13963889 -76.61502778 53.29 26.92 2.84AA Bd 155 390938076383701 39.16116667 -76.64313889 57.5 50.41 8.53AA Bd 156 390922076371001 39.15583333 -76.61908333 68.99 29.88 7.66AA Bd 157 390737076374401 39.12711111 -76.62913889 75.75 38.75 2.17AA Bd 158 390744076390001 39.12919444 -76.64972222 108.25 60.56 4.43AA Bd 160 390908076394402 39.15255556 -76.66183333 88 77.59 4.33AA Bd 181 390839076385702 39.14416667 -76.64916667 180.78 57.03 --AA Bf 99 390654076283601 39.11486111 -76.47697222 40 -16.00 --AA Cc 40 390423076432001 39.07350000 -76.72211111 136.92 89.86 1.40AA Cc 82 390422076414505 39.07288717 -76.69552364 178.71 54.44 -5.03AA Cc 89 390010076415703 39.00277770 -76.69916660 52.77 4.11 -27.12AA Cc 115 390103076402601 39.01761031 -76.67357794 134.38 -3.41 -12.96AA Cc 137 390126076402901 39.02399910 -76.67441136 115.34 -39.45 --AA Cd 128 390327076363701 39.05761005 -76.60996516 110 15.08 --AA Ce 94 390450076343503 39.08066544 -76.57607530 90 -106.58 -64.43AA Ce 124 390303076344303 39.05094364 -76.57829744 160 -20.00 -20.87AA Ce 136 390043076345401 39.01305556 -76.58277778 60 -14.49 --AA Cf 137 390205076292702 39.03444444 -76.49000000 124.3 -63.51 -62.64AA Cf 167 390154076282802 39.03155556 -76.47461111 106 -52.45 --AA Cg 23 390123076241602 39.02316687 -76.40412540 12.57 -30.45 -28.73AA De 206 385833076332801 38.97594508 -76.55746267 81.74 -32.09 --AA De 232 385915076335304 38.98750000 -76.56472222 119 -24.20 --CA Fd 85 382236076255401 38.37679034 -76.43133979 106.81 -25.08 --CH Bc 24 383633077083001 38.60916660 -77.14166660 72 -113.28 -25.90CH Bc 76 383754077051201 38.63178443 -77.08636630 171 -120.90 -29.90CH Bc 81 383709077061002 38.61928477 -77.10247779 156.46 -116.57 -30.50CH Bd 33 383844077040701 38.64567294 -77.06831029 180 -119.58 -0.18CH Bd 50 383734077044901 38.62622905 -77.07997718 180 -105.68 --

34 Potentiometric Surface and Water-Level Difference Maps of Selected Confined Aquifers in Southern Maryland, 1975–2011
Appendix 2d. Water-level data for Southern Maryland and Maryland’s Eastern Shore wells used in this report (lower Patapsco aquifer).—Continued
[All depth and altitude measurements are in feet. Land and water altitudes are measured from the National Geodetic Vertical Datum of 1929 (NGVD 29). Digital latitude and longitude measured relative to North American Datum 1983 (NAD 83); --, no data; USGS, U.S. Geological Survey]
Well numberUSGS
site identification number
LatitudeNAD 83
(decimal degrees)
LongitudeNAD 83
(decimal degrees)
Surface altitude(NGVD 29)
(feet)
Water-levelaltitude
2011
Water-leveldifference1990–2011
CH Bd 51CH Be 58CH Be 64CH Be 72CH Bf 146CH Bf 150CH Bg 17CH Cb 7CH Cb 28CH Cb 38CH Cb 42CH Cc 31CH Cd 42CH Ce 35CH Ce 37CH Ce 53CH Ce 56CH Da 20CH De 52CH Ee 70CH Ee 78CH Ff 60PG Be 14PG Cf 76PG Cf 77PG Cf 80PG Ed 34PG Fb 57PG Gd 6PG Hf 32QA Be 15QA Eb 112SM Bc 39SM Dd 72VA 54R-2
383715077014901383706076575602383553076562002383903076594301383508076540701383901076524301383706076475401383422077114601383315077131401383328077114201383328077111702383455077074401383256077015301383111076584801383236076563901383420076592504383251076583901382654077152701382752076593601382154076574801382240076582801381806076545401390226076481001385757076440402385757076442002385816076434502384933076530001384056077015501383958076520601383250076405303391203076024301385751076171602382605076430201381626076393401382341077032401
38.6209515238.6184517838.5981747038.6509507138.5856752138.6503956138.6184524238.5728971238.5548420738.5578975738.5578975838.5820636238.5489416738.5201888938.5434540738.5723419338.5476204838.4484562938.4647222238.3656815338.3779033638.3017946239.0409694438.9659443138.9659442838.9626110738.8258055638.6823385938.6662285238.5495333339.2009431538.9642794638.4347500038.2740000038.39472220
-77.02997567-76.96525147-76.93858384-76.99497476-76.90163812-76.87830454-76.79802398-77.19581333-77.22025822-77.19470201-77.18775738-77.12858934-77.03612222-76.97973611-76.94386147-76.98997428-76.97719596-77.25720260-76.99527778-76.96386135-76.97413948-76.91469316-76.80231111-76.73413502-76.73857961-76.72913484-76.88447222-77.03164270-76.86802658-76.68140556-76.04494493-76.28745430-76.71677778-76.65961111-77.05666660
185212.5209110192.8215199.9936545
35188.43173.16184.95202.36196.4890
16622.837512
150.44127.6114715027017021710.452513.92
162.41110.9270
-125.73-175.01-197.85-124.03-138.81-102.60-62.81-21.92-36.84-52.16-68.69-84.93
-100.92-118.74-136.53-110.74-147.52-16.41-80.16
-101.36-93.87-56.01106.35
3.5410.0728.85-7.48
-110.24-92.63-48.13-5.82
-26.44-41.10-32.16-78.70
----
-55.78--
-44.28----
26.756.26
21.09------
-36.50-70.68
----
-11.52--
-40.32-27.04-33.59-5.48
-36.35-27.99-23.75-27.67
----
-35.99-11.17-27.77
----
-29.90

Appendixes 35
Appendix 2e. Water-level data for Southern Maryland and Maryland’s Eastern Shore wells used in this report (Patuxent aquifer). —Continued
[All depth and altitude measurements are in feet. Land and water altitudes are measured from the National Geodetic Vertical Datum of 1929 (NGVD 29). Digital latitude and longitude measured relative to North American Datum 1983 (NAD 83); --, no data; USGS, U.S. Geological Survey]
Well numberUSGS
site identification number
LatitudeNAD 83
(decimal degrees)
LongitudeNAD 83
(decimal degrees)
Surface altitude(NGVD 29)
(feet)
Water-levelaltitude
2011
2S5E-1 391617076322001 39.27158333 -76.53847222 28.2 0.05AA Ac 11 391101076404001 39.18383333 -76.67738889 136.9 -3.67AA Ad 29 391015076373501 39.17108333 -76.62583333 37 -54.55AA Ad 90 391032076385902 39.17566368 -76.64941189 77.85 -62.85AA Bb 88 390756076464201 39.13222222 -76.77833333 174.85 138.89AA Bb 90 390657076462601 39.11583333 -76.77388889 163.5 105.64AA Bc 163 390524076442501 39.09010891 -76.73996976 135.11 4.57AA Bc 240 390752076441001 39.13121945 -76.73580346 260 30.94AA Bd 57 390952076384102 39.16455276 -76.64441161 70 -76.47AA Bd 182 390839076385703 39.14433333 -76.64933333 180.78 -20.54AA Cb 1 390303076463201 39.05011111 -76.77575000 129.1 34.95AA Cc 102 390004076420001 39.00122153 -76.69968967 53.96 -6.99AA Cc 113 390256076413101 39.04899865 -76.69163437 151.89 -2.59AA Cc 119 390437076432302 39.07705364 -76.72274680 139 5.09AA Cc 124 390419076432301 39.07205371 -76.72274674 130 6.33AA Cc 135 390126076403001 39.02399910 -76.67468914 114.81 -13.35AA Ce 117 390450076343402 39.08055556 -76.57583333 86 -5.52AA Cf 166 390154076282801 39.03155556 -76.47461111 106 -8.15AA Cg 22 390123076241601 39.02316687 -76.40412540 12.61 -7.44AA De 203 385854076333202 38.98177826 -76.55857394 94.39 -6.46BA Fe 19 391607076312901 39.26859444 -76.52430000 12.51 -23.97BA Gf 11 391356076293501 39.23216667 -76.49255556 13.57 -16.70CH Bc 75 383645077062401 38.61261830 -77.10636674 124.59 -65.24

36 Potentiometric Surface and Water-Level Difference Maps of Selected Confined Aquifers in Southern Maryland, 1975–2011
Appendix 2e. Water-level data for Southern Maryland and Maryland’s Eastern Shore wells used in this report (Patuxent aquifer). —Continued
[All depth and altitude measurements are in feet. Land and water altitudes are measured from the National Geodetic Vertical Datum of 1929 (NGVD 29). Digital latitude and longitude measured relative to North American Datum 1983 (NAD 83); --, no data; USGS, U.S. Geological Survey]
Well numberUSGS
site identification number
LatitudeNAD 83
(decimal degrees)
LongitudeNAD 83
(decimal degrees)
Surface altitude(NGVD 29)
(feet)
Water-levelaltitude
2011
CH Bc 77CH Bc 78CH Bd 52CH Be 57CH Bg 18CH Cc 34CH Ce 57CH Da 18CH Ee 96HA De 181HA Ec 11HA Ec 46HA Ed 47HO Df 60PG Bc 16PG Cf 66PG Cf 81PG Fd 62PG Hf 43QA Eb 110WE Ca 35WE Ca 36
383644077055501383809077053401383553077032401383706076575601383621076462801383441077063901383250076584001382654077152501382151076580901392606076145801392435076203301392408076210101392455076192101390830076473902390151076561501385745076445201385745076445202384309076511401383300076411601385751076171603385429076583601385460076574801
38.6123405438.6359509638.5981743738.6184517838.6058611138.5781748738.5473427138.4484562938.3643416739.4351085639.4098302339.4023302039.4153859039.1416666739.0310750038.9626109738.9626109738.7192825638.5500333338.9642794638.9081111138.91663889
-77.09831095-77.09247762-77.05636520-76.96525147-76.77436111-77.11053325-76.97747375-77.25664704-76.96745278-76.24912239-76.34218097-76.34995895-76.32218033-76.79416667-76.93720556-76.74746879-76.74746879-76.85358218-76.68738611-76.28745430-76.97666667-76.96319444
96.6420.9647.5
212.2619041.82
193.4789.922.9912.2211.723.1690.5
211.41189.02150.07117.35228.645.0413.98
150.8243.48
-65.47-71.37-60.15-30.58-19.62-63.86-19.99-10.15-28.10
5.3710.378.40
20.48165.46167.61
-3.370.09
-10.81-134.76
1.4431.2937.28

Prepared by USGS West Trenton Publishing Service Center.Edited by Valerie M. Gaine.Graphics and layout by Timothy W. Auer.
For additional information, contact:Director, MD-DE-DC Water Science CenterU.S. Geological Survey5522 Research Park DriveBaltimore, MD 21228
or visit our Web site at:http://md.water.usgs.gov

Curtin, S.E., and others—Potentiom
etric Surface and Water-Level D
ifference Maps of Selected Confined A
quifers in Southern Maryland and M
aryland’s Eastern Shore, 1975–2011—Scientific Investigations Report 2012–5165Printed on recycled paper