Embed Size (px)
Citation preview

Int. J. Electrochem. Sci., 8 (2013) 1520 - 1533
International Journal of
ELECTROCHEMICAL SCIENCE
www.electrochemsci.org
Potentiometric Study and Biological Activity of Some Metal Ion
Complexes of Polyvinyl Alcohol (PVA).
Wafaa M. Hosny*, Perihan. A. Khalaf-Alaa
Chemistry Department, Faculty of Science, Cairo University, Giza, Egypt *E-mail: [email protected]
Received: 13 October 2012 / Accepted: 26 November 2012 / Published: 1 January 2013
The acid-base equilibrium of polyvinyl alcohol (PVA) is investigated. The stability constant values of
the binary complexes between PVA and metal ions Cu(II), Co(II), Ni(II) and Zn(II) formed in solution
were investigated potentiometrically. The relationships between the properties of the studied central
metal ions as ionic radius, electronegativity, atomic number, and ionization potential of the formed
complexes were investigated and give information about the nature of chemical bonding in complexes
and make possible the calculation of unknown stability constants. CuII
and NiII complexes with PVA
are isolated as solid complexes and characterized by chemical and physical methods, and their general
formula [ML.nH2O]2H2O, where M = CuII
and NiII , L = PVA, and n = 2 and 4 for Cu
II and Ni
II
respectively. The ligand and their metal chelates have been screened for their antimicrobial activities
using the disc diffusion method against the selected bacteria and fungi.
Keywords: Polyvinyl alcohol(PVA); Metal complexes; Potentiometry; IR spectra; Antimicrobial
activities
1. INTRODUCTION
Polymer complexes have been given a great deal of attention in recent years [1-3]. Polyvinyl
alcohol (ethanol homopolymer) which considered as moderate adhesive is a water – soluble resin.
PVA is a polymer with exceptional properties such as water solubility, biodegradability,
biocompatibility, non-toxicity and non-carcinogenity that possesses the capability to form hydrogels
by chemical or physical methods[4–6]. Its fields of applicability were widely broadened during the
later years due to the development of medicine.
In this paper we used the hydrolyzed [7] (98.9%) PVA with weight averaged molecular weight
Mw= 27,000 ( the number averaged molecular weight Mn=14, 000) was purchased from Aldrich
Chemical Company; it is clear that the use of transition action of our previous studies of the metal

Int. J. Electrochem. Sci., Vol. 8, 2013
1521
complexes of polymer[8-11], it seems interesting to study the coordination properties of PVA and its
metal complexes. In this investigation, we report a quantitative study of the acid base equilibrium of
PVA, as well as the binary complex formation equilibria with Cu(II), Co(II), Ni(II) and Zn(II), the
concentration distributions of the complexes are evaluated. We have also studied the effect of metal
ion properties on the log K1 values of the binary metal complexes. The solid complexes with the metal
ions Cu(II), and Ni(II) are synthesized and characterized by the physicochemical method and
biological activity. This work is also extended to present some correlations between the
thermodynamic functions and some of well-known properties of the metal ions. Such work may help
to explain the nature and driving forces for the interactions occurring in biological systems, such as
metal-protein and metal-nucleic acid interactions.
2. EXPERIMANTAL
2.1. Materials and reagents
PVA (average MW: 27000, Aldrich makes). The metal salts used are CuCl2•2H2O,
NiCl2•6H2O, CoCl2•6H2O, ZnCl2•2H2O, obtained from Sigma Chem. Co, UK. Metal salt solutions
were prepared and standardized as described previously[12].
2.2. Synthesis of the binary metal complexes
Cu(II) and Ni(II) complexes of PVA were prepared in the ratio 1:1 (metal: ligand), by direct
mixing of 0.5 mmol of metal salt, 0.5 mmol of ligand in the smallest quantity of bi-distilled water. The
mixture was refluxed for 1-3 h, then they form solid complexes. The latter were separated by filtration,
washed with ethanol and finally with diethyl ether. The analytical data are given in Table 1.
Table 1. Analytical and physical data for prepared metal salts.
Compound empirical
formula
M. Wt. Color µ
(B. M.)
ΔM
(Ω-1
cm2 mol
-1)
M.P.
0C
Yield
%
Found(Calcd.) %
C H
(C) (H)
[Cu(C3H4O2)2H2O]2H2O 207.5 Dark
green
1.95 21.0 >210 85% 17.00
(17.30)
5.66
(5.70)
[Ni(C3H4O2)4H2O]2H2O 238.7
Deep
green
3.75 22.8 >200 90% 14.99
(15.08)
6.68
(6.70)
2.3. Biological activity
Antimicrobial activity of the tested samples was determined using a modified Kirby–Bauer disc
diffusion method[13]. The antibacterial activities were done by using gram +ve organisms
(Staphylococcus aureus and Bacillus subtillis) and gram _ve organisms(Escherichia coli and

Int. J. Electrochem. Sci., Vol. 8, 2013
1522
Pseudomonas aeruginosa). These bacterial strains were chosen as they are known human pathogens.
Briefly,100 µl of the test bacteria were grown in 10 ml of fresh media until they reached a count of
approximately 108 cells/ml or 105 cells/ml for fungi[14]. Hundred microliters of microbial suspension
was spread onto agar plates corresponding to the broth in which they were maintained. Isolated
colonies of each organism that might be playing a pathogenic role should be selected from primary
agar plates and tested for susceptibility by disc diffusion method of the National Committee for
Clinical Laboratory Standards (NCCLS)[15]. Among the available media available, NCCLS
recommends Muller-Hinton agar due to: it results in good batch-to-batch reproducibility. Plates
inoculated with Gram (+) bacteria as S. aureus, B. subtilis; Gram (-) bacteria as E. coli, P. aeuroginosa,
they were incubated at 35–37 0C for 24–48 h and fungi as Aspergillus flavus and Candida albicans
incubated at 300
C for 24–48 h and then the diameters of inhibition zones were measured in
millimeters[13-14]. Standard discs of Ampicillin (Antibacterial agent), Amphotericin B(Antifungal
agent) served as positive controls for antimicrobial activity but filter discs impregnated with 10 µl of
solvent were used as a negative control. The solution in different concentrations (mg/ml) of each
compound (free ligand, metal complexes and standard drug) in DMSO was prepared for testing against
spore germination. The agar used is Muller-Hinton agar that is rigorously tested for composition and
pH. Further the depth of the agar in the plate is a factor to be considered in the disc diffusion method.
This method is well documented and standard zones of inhibition have been determined for susceptible
and resistant values. When a filter paper disc impregnated with a tested chemical is placed on agar, the
chemical will diffuse from the disc into the agar. This diffusion will place the chemical in the agar only
around the disc. The solubility of the chemical and its molecular size will determine the size of the area
of chemical infiltration around the disc. If an organism is placed on the agar, it will not grow in the
area around the disc if it is susceptible to the chemical. This area of no growth around the disc is
known as a ‘‘Zone of inhibition’’ or ‘‘Clear Zone’’. For the disc diffusion, the zone diameters were
measured with slipping calipers of the (NCCLS)[15]
. Agar-based methods such as E-test and disk
diffusion can be good alternatives because they are simpler and faster the broth-based methods[16-17].
2.4. Apparatus and measuring techniques
2.4.1. Instruments, apparatus and measuring techniques
Potentiometric measurements were made using a Metrohm 751 Titrino. The titroprosessor and
electrode were calibrated with standard buffer solutions, prepared according to NBS specifications[12]
at 25 ± 0.1°C and I = 0.1 mol dm-3
, potassium hydrogen phthalate (pH 4.008) and a mixture of
KH2PO4 and Na2HPO4 (pH 6.865). A (0.10 mol dm-3
) standard acid solution was titrated with a
standard base (0.10 mol dm-3
) to convert the pH meter reading into hydrogen ion concentration. The
pH values was plotted against p[H], where the relation pH- p[H] =0.5 was observed for all the titration
data. A pKw value of 13.997[18] was used to calculate the [OH-]. The titrations were performed in a
thermostated titration vessel equipped with a magnetic stirring system, under purified N2 atmosphere
using 0.05 M NaOH as titrant. The titrations were performed at a constant ionic strength of 0.1 mol.
dm-3
(NaNO3). The micro chemical analysis of the separated solid complexes for C, H and N was

Int. J. Electrochem. Sci., Vol. 8, 2013
1523
performed in the micro analytical center, Cairo University. The analyses were performed twice to
check the accuracy of the analytical data. IR spectra were measured on an 80486-pc FTIR Shimadzu
spectrophotometer using KBr pellets. The magnetic susceptibility measurements for the complexes
were determined by the Gouy balance using Hg[Co(NCS)4] as a calibrant at room temperature [19] .
The acid dissociation constants of the ligand were determined by titrating a 40 ml of ligand solution
(1.25×10⁻³
mol dm-3
). The formation constants of the complexes were determined by titrating 40 mL of
the solution containing metal ion (1.25×10⁻⁴
mol dm-3
) and ligand (1.25×10⁻³
mol dm-3
). The stability
constant values were calculated by using the computer program MINIQUAD-75[20]
. Various possible
composition models were tried to calculate the stoichiometry and stability constants of the system
studied. The model selected was that which gave the best statistical fit as described before [20]. The
experimental titration data points were compared with the theoretical curve calculated from the acid
dissociation constant values of the ligand and the formation constants of their complexes, in order to
check the validity of the selected model. Table 3 lists the stability constants together with their
standard deviations and the sum of the squares of the residuals derived from the MINIQUAD output.
The speciation diagrams were obtained using the program SPECIES [21].
2.4.2. Spectrophotometric measurements
A spectrophotometric investigation of the binary and ternary Cu(II) complexes with PVA was
performed by scanning the visible spectra of solution mixtures (A and B). Under the prevailing
experimental conditions and after neutralization of the released hydrogen ions, associated with
complex formation, it is assumed that the complexes have been completely formed. The samples
utilized for spectrophotometric measurements were prepared as follows:
A- 1 cm3 (0.01 Mol dm
-3) Cu(II) ion
B- 1cm3 (0.01 Mol dm
-3) Cu(II) ion + 2 cm
3 (0.01 Mol dm
-3) PVA + amount of base
required to neutralize the H+ liberated from complex formation. In each case the final volume was
brought to 10 cm3 by the addition of deionized water, the ionic strength is kept constant at 0.1 mol dm
-
3 NaNO3.
3. RESULTS AND DISCUSSION
3.1. Acid base equilibrium of polyvinyl alcohol
PVA is prepared in one equivalent of HNO3 solution to allow pronation of the hydroxyl group
and formation of HL species, which acts as a monoprotic acid according to the following equilibrium
HL L-
+ H+ (1)
Generally, the following equilibrium could be used to describe the cumulative (overall)
formation constant βpqr of the species.
pM + pL + rH MpLqHr (2)

Int. J. Electrochem. Sci., Vol. 8, 2013
1524
[MPp Lq Hr ]
[ M ] p
[ L ] q [ H ]
are
(Charges on individual species are omitted for simplicity).
Here, we have no metal complex formation (p=0), then only protonation of PVA according to
Eq. 1 will occur.
Figure. 1. Potentiometric titration curves for PVA (HL) and CuL2 systems
Figure 2. Concentration distribution diagram of the various forms of HL.
βpqr = (3)

Int. J. Electrochem. Sci., Vol. 8, 2013
1525
Fig. 1, shows the potentiometric titration of PVA with a base. From the Fig, it is clear that
there is a first deprotonation stage of the hydroxyl group with a peak value of 10.67 (pKa = logβ011).
Fig. 2, shows the concentration distribution diagram of PVA. At pH 8, the protonated species of the
ligand, HL, appears, and on increasing pH the concentration of HL decreases and the deprotonated
species L- starts to form and reaches a maximum concentration of 60 % at pH 11. The L
- species is
predominating in the physiological pH range.
3.2. Binary complexes involving PVA with the metal ions Cu(II), Ni(II), Co(II) and Zn(II)
Table 2 lists the stoichiometry and stability constants of the binary complexes formed with
PVA together with the proton association constants of PVA. The metal ions with the ligand are titrated
potentiometrically with NaOH. A displacement was observed in the metal-ligand titration curves
compared to the ligand titration curve. This indicated the release of protons upon complex formation.
The potentiometric titration data of the binary complex formation equilibria were fitted to various
models. The titration data fit satisfactory with the formation of the deprotonated species 110 (Metal:
ligand 1:1), and the deprotonated species 120 ( Metal: ligand 1:2).
Table 2. Stability constants of PVA complexes where ap, q and r are the stoichiometric coefficients
corresponding to metal(II), PVA and H+
respectively. b
standard deviation are given in
parentheses. c sum of square of residuals
System p q r logβb
Sc
PVA 0 1 1 10.67(0.01) 5.10x10⁻⁷
Cu-PVA 1
1
1
2
0
0
8.07(0.02)
15.93(0.03)
5.70x10⁻⁸
Co-PVA 1
1
1
2
0
0
5.67(0.02)
11.06(0.05)
3.90x10⁻⁸
Ni-PVA 1
1
1
2
0
0
6.21(0.01)
11.82(0.03)
4.80x10⁻⁷
Zn-PVA 1
1
1
2
0
0
6.97(0.02)
13.57(0.04)
6.70x10⁻⁹
Comparison of the potentiometric titration data with the theoretically simulated curve of the
protonation constant of HL and the formation constants of the formed binary complexes in solution
was carried out in order to test the validity of the complex formation model selected. The concentration
distribution of the various species formed in solution was estimated in order to provide a useful picture
of metal ion binding. Fig. 3 represents the speciation diagram of the binary Cu(II) complex with PVA.
In the acidic pH range the deprotonated complex 110 is formed and its concentration reaches the
Int. J. Electrochem. Sci., Vol. 8, 2013
1526
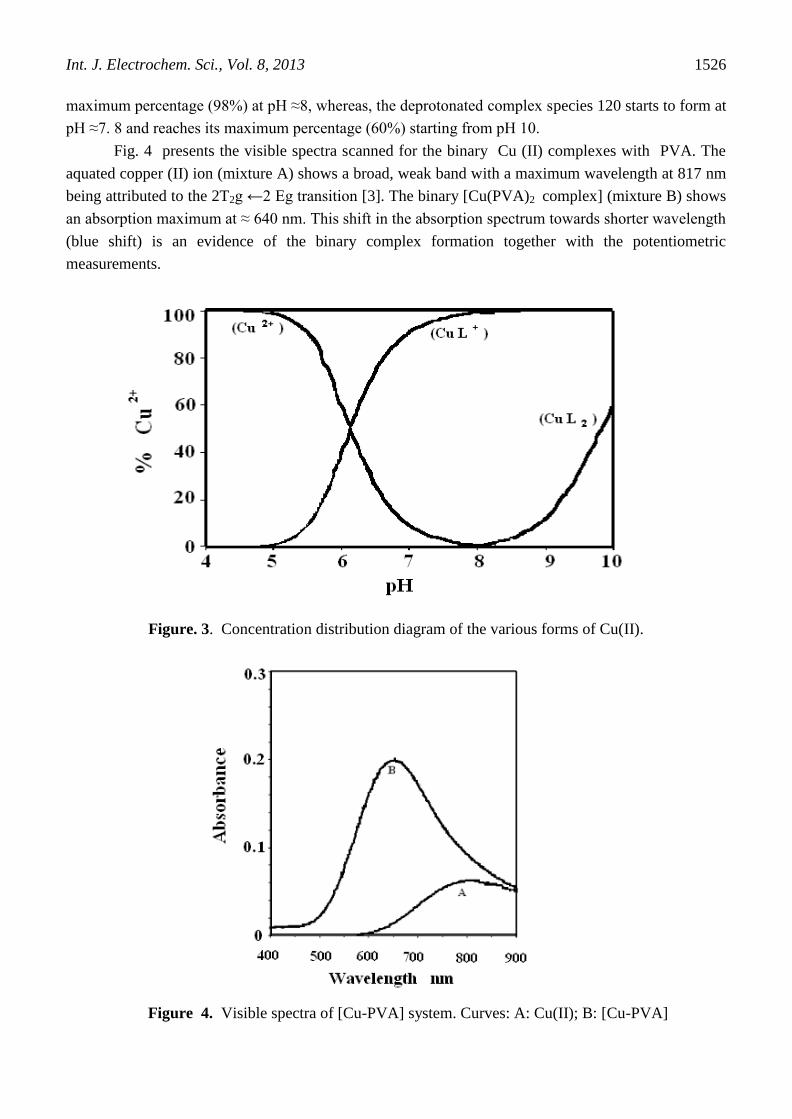
maximum percentage (98%) at pH ≈8, whereas, the deprotonated complex species 120 starts to form at
pH ≈7. 8 and reaches its maximum percentage (60%) starting from pH 10.
Fig. 4 presents the visible spectra scanned for the binary Cu (II) complexes with PVA. The
aquated copper (II) ion (mixture A) shows a broad, weak band with a maximum wavelength at 817 nm
being attributed to the 2T2g ←2 Eg transition [3]. The binary [Cu(PVA)2 complex] (mixture B) shows
an absorption maximum at ≈ 640 nm. This shift in the absorption spectrum towards shorter wavelength
(blue shift) is an evidence of the binary complex formation together with the potentiometric
measurements.
Figure. 3. Concentration distribution diagram of the various forms of Cu(II).
Figure 4. Visible spectra of [Cu-PVA] system. Curves: A: Cu(II); B: [Cu-PVA]
Int. J. Electrochem. Sci., Vol. 8, 2013
1527
3.3. Relationships between the properties of central metal ions and stability constants of complexes
The relationships between the properties of the studied central metal ions and the stability
constants of their complexes were discussed in an effort to give information about the nature of
chemical bonding in complexes and make possible the calculation of unknown stability constants. Fig
5. Displays graphically the stability order of the complex forming ability of the transition metal ions.
From Fig. 5 it could be seen that log K1 values are arranged in the order Co< Ni< Cu >Zn. This
stability order is in accordance with Irving- William’s order [22,23] for divalent metals of 3d series.
The extra stability of Cu(II) complex could be attributed to the Jahn - Teller effect. It was reported that
the stability constants for complexes of metal ions of the same charge is inversely proportional to
metal ion radii[24-25]
, based on the electrostatic interaction between the metal ion and the ligand. This
relationship may be approximately valued for ions of similar electronic configuration. Fig. 5a shows a
linear plot of log K1 of the
metal chelates of the ligand against the reciprocal ionic radii R. The corresponding data are
presented in Table 3. Plotting log K1 values against electronegativity of metal atoms give more or less
straight line as shown in Fig. 5b. This may be explained on the basis that when the electronegativity
difference between a metal atom and a ligand decreases, as a result of increasing the electronegativity
of the metals, the covalent character of the metal-ligand bond would increase which in turn result into
higher stability of the metal chelates. Fig. 5c shows the relationship between log K1 values and the
second ionization potential of the studied bivalent metal ions. A more or less straight line is obtained
which is in accordance with the Van Panthaleon- Van Ech Eq. 5[24].
Log k1 = P (I-q) (5)
Where, I represent the ionization potential for the reaction (M → Mm+
+ me) in the gaseous
phase, P, q are constants independent of the metal ion but depends on the experimental conditions and
the nature of ligand. P depends on the number of the donor groups of the ligand and q is the number of
electrons involved in complex formation.
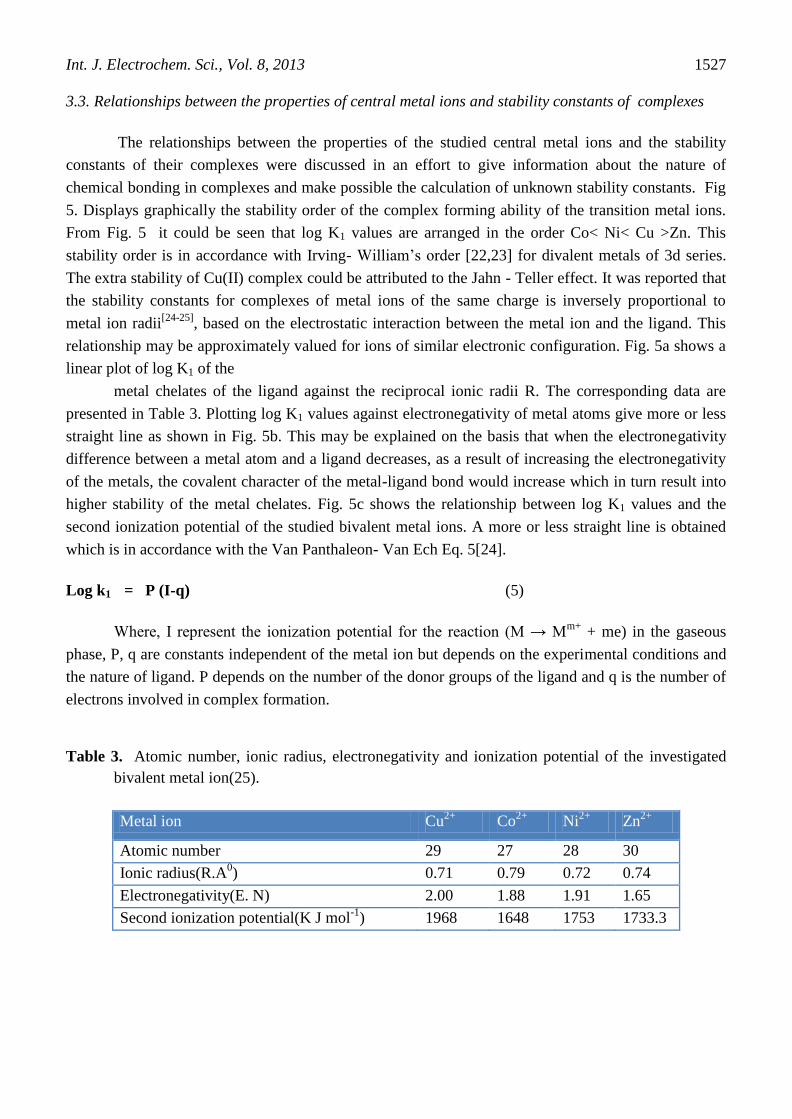
Table 3. Atomic number, ionic radius, electronegativity and ionization potential of the investigated
bivalent metal ion(25).
Metal ion Cu2+
Co2+
Ni2+
Zn2+
Atomic number 29 27 28 30
Ionic radius(R.A0) 0.71 0.79 0.72 0.74
Electronegativity(E. N) 2.00 1.88 1.91 1.65
Second ionization potential(K J mol-1
) 1968 1648 1753 1733.3

Int. J. Electrochem. Sci., Vol. 8, 2013
1528
Figure 5. Effect of metal ion properties on the stability constant of PVA-complexes.
4. ANTIMICROBIAL ACTIVITY
The PVA ligand is biologically active and its activity may arise from the hydroxyl groups
which may play an important role in the antibacterial activity [26]
. To assess the biological potential of
the synthesized compounds, the PVA ligand and its metal complexes were tested against the selected
bacteria and fungi (Fig. 6). The antimicrobial data were collected in Tables 4 and 5. The synthesized
compounds were found to be more toxic compared with their parent PVA ligand against the same
micro-organism and under the identical experimental conditions.

Int. J. Electrochem. Sci., Vol. 8, 2013
1529
The increase in biological activity of the metal chelates may be due to the effect of the metal
ion on the normal cell process. A possible mode of toxicity increase may be considered in the light of
Tweedy’s chelation theory [27]. Chelation considerably reduce the polarity of the metal ion because of
partial sharing of its positive charge with the donor group and possible p-electron delocalization within
the whole chelate ring system that is formed during coordination. Such chelation could enhance the
lipophilic character of the central metal atom and hence increasing the hydrophobic character and lipo
solubility of the complex favoring its permeation through the lipid layers of the cell membrane. This
enhances the rate of uptake/entrance and thus the antimicrobial activity of the testing compounds.
Accordingly, the antimicrobial activity of the three complexes can be referred to the increase of their
lipophilic character which in turn deactivates enzymes responsible for respiration processes and
probably other cellular enzymes, which play a vital role in various metabolic pathways of the tested
microorganisms. The antibacterial activity can be ordered as [Cu(PVA)] > [Ni(PVA)], suggesting that
the lipophilic behavior increases in the same order. The results indicate that, the two complexes
exhibited moderate activity against the fungal strains when compared with standard Amphotericin. The
tested complexes were more active against Gram-positive than Gram-negative bacteria, it may be
concluded that the antimicrobial activity of the compounds is related to cell wall structure of the
bacteria. It is possible because the cell wall is essential to the survival of bacteria and some antibiotics
are able to kill bacteria by inhibiting a step in the synthesis of peptidoglycan.
Figure 6 . Biological activity of metal complexes towards different types of bacterial strains where a:
L, b: [CuL.2H2O]2H2O, c:[NiL.4H2O]2H2O, d: Ampicilin

Int. J. Electrochem. Sci., Vol. 8, 2013
1530
Table 4 Antibacterial activity of the isolated complexes
Complex Gram Postitive Gram Negative
Staphylococus
aureus
Bacillus
subtillis
Pseudomonas
aereuguinosa
Escherichia
coli
C (mg ml-1
) 1 2.5 5 1 2.5 5 1 2.5 5 1 2.5 5
PVA - 9 8 - 9 8 - 9 7 - 9 8
CuL.2H2O 9 13 18 - 10 13 10 15 18 10 14 18
NiL.4H2O - 12 15 - 10 11 - 10 11 10 12 15
Ampicillin
(standard)
- 12 12 - 11 13 - 0 12 - 13 15
Table 5. Antifungal activity of the PVA ligand and its metal complexes
Ligand/Complex Fungi
Aspergillus flavus Candida albicans
PVA 12 12
CuL.2H2O 15 16
NiL.4H2O 14 15
Amphotericin (standard) 17 17
Gram-positive bacteria possess a thick cell wall containing many layers of peptidoglycan and
teichoic acids, but in contrast, Gram negative bacteria have a relatively thin cell wall consisting of a
few layers of peptidoglycan surrounded by a second lipid membrane containing lipopolysaccharides
and lipoproteins. These differences in cell wall structure can produce differences in antibacterial
susceptibility and some antibiotics can kill only Gram-positive bacteria and is infective against Gram-
negative pathogens [28]
. Structure activity relationships evidence that the complexation with copper
enhances the antimicrobial activity of the ligands against some of the tested organisms. Since copper
chelates have an enhanced antimicrobial activity, in comparison to their analogous containing
nickel(II) ions, the metal seems to play a relevant role in the activity of these compounds. These
results may be due to higher stability constant of the Cu(II) complexes than the Ni(II) complexes
(Table 2).
5. INFRA RED, ELECTRONIC SPECTRA AND MAGNETIC MEASUREMENTS
The study of the spectral and magnetic properties of the solid complexes provides information
that can throw considerable light on their geometry. The analytical data show that the ligand forms 1:1

Int. J. Electrochem. Sci., Vol. 8, 2013
1531
complex with Cu(II) and Ni(II) . Generally, it is difficult to use infrared spectroscopy to fully elucidate
the structure of complexes. However, it can provide some useful information on the functional groups
of the ligand chelated with metal ions, especially with metal complexes of hydroxyl groups [29, 30].
The IR spectrum of the ligand and its complexes show bands in the region 4000-3000 cm-1
in addition
to band occurring at 2922 cm-1
and 1124 cm-1
, characteristic of hydrogen bonded O-H stretching [31-
33] and antisymmetric stretching vibrations of both CH2 and COC respectively. On the other hand, for
PVA cross-linked by CuII and Ni
II the band maximum corresponding to bonded OH group (3430 cm
-1),
was shifted to lower frequencies; 3377 cm-1
and 3384 cm-1
, respectively. This indicates that hydroxyl
groups were involved in chelation [34]. The antisymmetric stretching vibration (υ) CH2 (2922 cm-1
), of
cross -linked PVA became narrow compared with the non-cross-linked PVA and its complex with NiII
and CuII. This is also supported by the appearance of new bands at 520-530 cm
-1 in the spectra of
complexes, which were not found in the spectrum of the free ligand, possibly assignable to ν M-O
stretching vibration. The structures of the isolated solid complexes are proposed on the basis of the
spectral and magnetic studies. The electronic spectrum of the Cu (II) complex gives a broad band with
a maximum at 14211 cm-1
, in consistence with that reported for square planner geometry [35]. The
square planner geometry for the Cu(II) complex is also supported by calculating the room temperature
magnetic moment. The electronic spectra of Cu(II)-PVA complex consists of a broad band in the
13500-16000 cm-1
range is thought to originate from L→ M charge transfer [36]. The Cu (PVA)
complex has magnetic moment value of 1.95, Table 1, provide additional evidence for the
approximate square configuration [37-39]. The electronic spectra of the Ni(II)-PVA complex show
two main absorption bands at the quite similar position in the visible region, as generally observed for
high spin octahedral nickel(II) complex, and are assigned to 3A2g→
3T1g(F) and
3A2g→
3T2g transitions,
respectively. The 3A2g→
3T1g(P) transition in the polymer complex is also observed, furthermore, the
magnetic moments lie in the range reported for this geometry [40,41]
.
From all results discussed above, the structural of the isolated complexes may be given as the
following in scheme 1.
Further investigation to provide more convincing evidence for the structure of these complexes
requires further studies including, e.g., X-ray diffraction studies and other structural investigation.
Scheme.1. Structure of PVA ligand and its metal complexes M (II)

Int. J. Electrochem. Sci., Vol. 8, 2013
1532
6. CONCLUSION
The present work describes the acid-base equilibria of polyvinyl alcohol abbreviated as (PVA),
and the complex formation equilibria with the metal ions Cu(II)
, Ni(II)
, Co(II)
, and Zn(II)
, to ascertain the
composition and stability constants of the complexes. The results showed that the stability of the
complexes can be ordered as Co (PVA) <Ni (PVA) <Cu (PVA) >Zn (PVA). The effect of metal ion
properties on the stability of the complexes was investigated. Some solid complexes were synthesized
and characterized. Their structures and formation are determined using microanalysis, magnetic, and
different spectral tools. The Stoichiometry and stability constants of the complexes formed are
reported at 25°C and 0.1 M ionic strength. The results show the formation of 1:1 and 1:2 complexes.
The concentration distribution diagrams of the complexes were evaluated. It would be possible to
calculate the equilibrium distribution of the metal species in biological fluids where all types of ligands
are present simultaneously. The antibacterial activity results indicated that tested complexes were more
active against the selected types of bacteria than the free PVA ligand. The antibacterial activity of the
isolated metal chelates obeyed this order [Cu(PVA)] > [Ni (PVA)] which is in accordance with the
stability constants order log KCu–PVA = 8.07 > log KNi–PVA = 6.21
Refrences
1. S.M. Burkinshaw, N.A. Kumar, Dyes and Pigments 77 (2008) 86-91.
2. N. Hojo, H. Shirai, S. Hayashi, J. Polym. Sci. Polym. Symp. 47 (1974) 299-307.
3. A.A. Shoukry, W.M. Hosny, Cen. Eur. J. Chem. 10 (2012) 59-70.
4. C. Vasile, A.K. Kulshreshtha, Handbook of Polymer Blends and Composites, Rapra Technology.
Ltd.: Shawbury, UK, 2003, pp. 288–365.
5. B. Ratner, A.S. Hoffman, F.J. Schoen, J.E. Lemons, Biomaterials science: An introduction to
materials in medicine, Elsevier Academic Press, San Diego, 2004.
6. C.M. Hassan, N.A. Peppas, Adv. Polym. Sci. 153 (2000) 37–65.
7. J.H. Chen, L. Hwang, J. Chin. Chem. Soc. 35 (1988) 273-281.
8. W.M. Hosny, A.K. Abdel Hadi, H. El-Said, A.H. Basta, Polym. Int. (1995) 37, 93.
9. A.H. Basta, W.M. Hosny, Polym. Deg. and Stab. , 60 (1998) 239-245.
10. W.M. Hosny, A.H. Basta, H. El-Said, Polym. Int. 42 (1997) 157-162.
11. W.M.Hosny, S. M. El-Medani, M.M. Shoukry, Talanta 48 (1999) 913-921.
12. Vogel’s Text Book of Quantitative chemical analysis, fifth ed., Longman, UK, 1989, Ch. 10, pp.
326.
13. A.W. Bauer, W.M. Kirby, C. Sherris, M. Truck, J. Am. Clin. Path. 45 (1966) 493–496.
14. M.A. Pfaller, L. Burmeister, M.A. Bartlett, M.C. Rinaldi, J. Clin. Microbiol. 26 (1988) 1437-1441.
15. National Committee for Clinical Laboratory Standards (1993), Methods for dilution antimicrobial
susceptibility tests for bacteria that grow aerobically, third ed., Approved standard M7- A3.
NCCLS, Villanova, Pa.
16. L. D. Liebowitz, H. R. Ashbee, E. G. V. Evans, Y. Chong, N. Mallatova, M. Zaidi, D. Gibbs,
Elsevier 27 (2001) 24.
17. Matar, M.J; Ostrosky-Zeichner,L; Paetznick, V. L; Rodriguez, E. Chen; Rex, J.H, Antimicrob.
Agents Chemother. 47 (2003) 1647-1651.
18. J. Stark, H.G. Wallace, Chemistry Data Book, Murray, London, 1975, pp. 75.
19. R.J. Angelici, Synthesis and Technique in Inorganic Chemistry, second ed., W.B. Saunders
Company, Philadelphia, 1977, pp. 198.

Int. J. Electrochem. Sci., Vol. 8, 2013
1533
20. P. Gans, A. Sabatini, A. Vacca, J. Inorg. Chim. Acta 18 (1976) 237-239.
21. M.M. Shoukry, A.A. Shoukry, P.A. Khalf Allas, S. S. Hassan, Int. J. Chem. Kinet. 42 (2010) 608-
618.
22. (a) H. Irving, R. J. P. Williams, Nature 162 (1984) 746,
(b) H. Irving, R. J. P. Williams, J. Chem. Soc., 1953, 3192-3210.
23. F.A. Cotton, G. Wilkinson, Advanced Inorganic Chemistry, Wiley & Sons, New York, 1962.
24. M.T. Beck, Chemistry of Complex Equilibria, Van Nostrand Reinhold Co., London, 1962.
25. J. E. Huheey, Inorganic chemistry-Principles of Structure and Reactivity, Harper and Row, New
York, 1983.
26. N. Sari, S. Arslan, E. Logoglu, I. Sakiyan, G.U. J. Sci. 16 (2003) 283-288.
27. B.G. Tweedy, Phytopathology 55 (1964) 910-914.
28. A.L. Koch, Clin. Microbiol. Rev. 16 (2003) 673-687.
29. L.G. Tang, D.N.S. Hon, J. App. Polym. Sci. 29 (2000) 1476-1485.
30. M.Melnik, Coord. Chem. Rev. 36 (1981) 1-44
31. Z.M. Zaki, G.G. Mohamed, Spectrochimica Acta- Part A 26 (2000) 1245-1250.
32. J.B. Gandhi, N.D. Kulkarni, Polyhedron 18 (1999) 1735-1742.
33. A. Soliman, W. Linert, Thermochimica.Acta 338 (1999) 67-75
34. A.A. Shoukry, M.M. Shoukry, Spectrochimica Acta 70 (2008) 686-691.
35. A.A. Soliman, G.G. Mohamed, W.M. Hosny, M.M. El-Mawgood, J. Synth. React. Inorg. Met-org.
and Nano-Metal Chem. 35 (2005) 483-490.
36. R.G. Bates, Determination of pH Theory and Practice, second ed., Wiley interscience, New York,
1975.
37. M.F. Iskander, T.E. Khalil, R. Waase, W. Haase, I. Savoboda, H. Fuess, Polyhedron 19 (2000)
949-958.
38. M. Palaniandavar, C. Natarajan, Aust. J. Chem. 33 (1980) 737-745.
39. J. Vanco, J. Marek, Z. Travnicek, E. Racanska, J. Muselik, O. Svajlenova, J. Inorg. Biochem. 102
(2008) 595-605.
40. B.P. Lever, Inorganic Electronic spectroscopy; Elsevier, Amsterdam, 1968.
41. Jorgensen, C.K, Absorption Spectra and Chemical Bonding Complexes, Pergemon Press. Oxford,
1964, pp. 206.
© 2013 by ESG (www.electrochemsci.org)