Embed Size (px)
Citation preview

June 2013 NFM RAF Report
i
Potential Use of Runoff Attenuation Features in Small
Rural Catchments for Flood Mitigation
BY
Paul Quinn, Greg O’Donnell, Alex Nicholson, Mark Wilkinson, Gareth Owen, Jennine Jonczyk, Nick
Barber, Matt Hardwick and Granville Davies

i
Executive Summary
Following a number of recent severe flood events across the North East of England, the Environment Agency
(EA) have been working with Newcastle University (NU) to develop a number of small scale, low cost soft
engineered flood reduction schemes. These schemes are designed to store/attenuate rapid runoff in small
rural catchments (<10km2) during flood events.
Newcastle worked in partnership with the EA to deliver a catchment based flood solution for the village of
Belford. This has involved the design and implementation of a network of soft engineered Runoff
Attenuation Features (RAFs) upstream of Belford, intensive field monitoring and detailed hydrological
analyses.
Royal Haskoning (RH) were independently commissioned by the EA to perform hydraulic modelling studies of
Powburn and Hepscott to establish whether sites at risk of flooding have benefitted from recent works.
Newcastle also instrumented these catchments for 2 years, but unfortunately no significant events were
recorded at these sites during this study period.
Together Newcastle and Royal Haskoning have assessed the impact of the Belford approach to managing
flood hazard in small rapidly responding catchments. To summarize:-
Over the last 4 years Newcastle and the EA have developed a novel method for flood mitigation at
Belford.
A network of 30 RAFs has been implemented, with a total construction cost of £70-100K.
Newcastle used innovative data analyses and models to create the evidence base to underpin this
and future work.
It has been demonstrated that reductions in peak flows can be achieved through
storage/attenuation management.
For a hypothetical pond network providing 19,250 m3 of storage, the peak flow reduction is
estimated to be between 15-30% for both observed events and FEH design storm events.
As a result of the Belford study, we are confident that it is possible to implement a catchment based
solution for reducing flood hazard using a network of soft engineered features.
The approach may also prove to be an effective way to manage catchments to achieve multiple
environmental objectives.
Acknowledgements
We wish to thank Peter Kerr and Phil Welton of the Environment Agency and the Northumbrian Regional
Flood Defence Committee. Many people have contributed to the project but a special note of thanks must
go to the farmers and residents of Belford. Funding from the EPRSC FRMRC project has also supported a PhD
studentship that has contributed greatly to this report.

June 2013 NFM RAF Report
ii
Table of Contents
1 Introduction ..................................................................................................................................................3
1.1 Background ...........................................................................................................................................3
1.2 Report Objectives .................................................................................................................................4
1.3 Scope and Limitations...........................................................................................................................5
2 Rationale for the Runoff Attenuation Feature Approach .............................................................................6
3 Runoff Attenuation Features ........................................................................................................................8
3.1 Runoff Attenuation Features: Definition and design philosophy .........................................................8
3.2 Runoff Attenuation Features: Types of Interventions ..........................................................................8
3.3 Design of a RAF Network ................................................................................................................... 15
4 The Belford Study ...................................................................................................................................... 18
4.1 Catchment Description ...................................................................................................................... 18
4.2 Belford RAF Network ......................................................................................................................... 19
4.3 Hydrological Analyses: Storm Selection ............................................................................................ 20
4.4 FEH Design Storms ............................................................................................................................. 20
4.5 Functioning of a RAF .......................................................................................................................... 21
4.6 Local Scale Impact of Features .......................................................................................................... 22
4.7 Catchment Scale Analyses of Network of Features ........................................................................... 23
5 The Powburn and Hepscott Studies .......................................................................................................... 27
6 Ongoing Research and Future Research Needs ........................................................................................ 29
6.1 A Catchment Scale Model of Runoff Attenuation Feature Impact.................................................... 29
6.2 Resources........................................................................................................................................... 30
7 Conclusions ................................................................................................................................................ 31
7.1 A strategic future for RAFs at the catchment scale ........................................................................... 32
8 References ................................................................................................................................................. 34
Annex

June 2013 NFM RAF Report
3
1 Introduction
“Sandbags and sympathy are not enough”
“Belford finds itself under water and not for the first time”.
The above quotes from residents of Belford were reported in the local newspaper, the
Northumbrian Gazette, in 2007. In response to the local community’s demand for action, Newcastle
University and the EA implemented a catchment scale flood management scheme using a Natural
Flood Management (NFM) approach. The response of the local community to this project has been
positive.
“Pioneering ponds save Belford from flooding” 2008 Berwick Advertiser
Phil Welton (Regional Flood Defence Manager for the EA) stated in an official EA video (http://research.ncl.ac.uk/proactive/belford/videos/): “For communities such as Belford that cannot receive traditional defences, this sort
of approach gives real solutions, real benefits and at a fraction of the cost”
Whilst this perception is welcomed, empirical evidence is needed to demonstrate that these
statements are valid.
During the life of the Belford project the uptake of the NFM approach in Northumberland has been
quite rapid.
“Successful Belford 'leaky ponds' scheme extended to Powburn” 2010 Berwick advertiser
An NFM approach has been used in the catchments upstream of the flood prone villages of Powburn
and Hepscott, which are assessed in this study. Similar approaches have also been implemented in
Great Ayton, Netherton, Dyke Head and the Bowmont Glen.
The purpose of this report is to evaluate the performance of the interventions deployed in Belford,
to quantify how well the scheme has worked and provide guidance regarding the circumstances in
which a similar approach could be used. Given that many organisations are advocating a NFM
approach, and schemes are currently being rolled-out, this report is timely in providing support to
policy makers, catchment planners and practitioners.
1.1 Background Following a number of recent severe flood events across the North East of England , the
Environment Agency (EA) have been working with the School of Civil Engineering and Geosciences,
Newcastle University (NU), to develop a number of small scale, low cost soft engineered flood
mitigation schemes. These schemes are designed to attenuate/store runoff within small rural
catchments (<10km2) during flood events. Rural settlements typically fail to receive grant-in-aid
funding for structural flood defences due to the low benefit-cost ratios resulting from the low
number of properties at risk. For example, Halcrow Group Consultants (Halcrow, 2007)
recommended the construction of a flood storage reservoir to capture a 1:50 year flood event in
Belford at an estimated cost of £2.59 million, providing protection to approximately 35 properties.
June 2013 NFM RAF Report
4
The EA are exploring potentially more cost effective catchment based approaches to solve rural
flooding issues, including the use of the Natural Flood Management (NFM) approach.
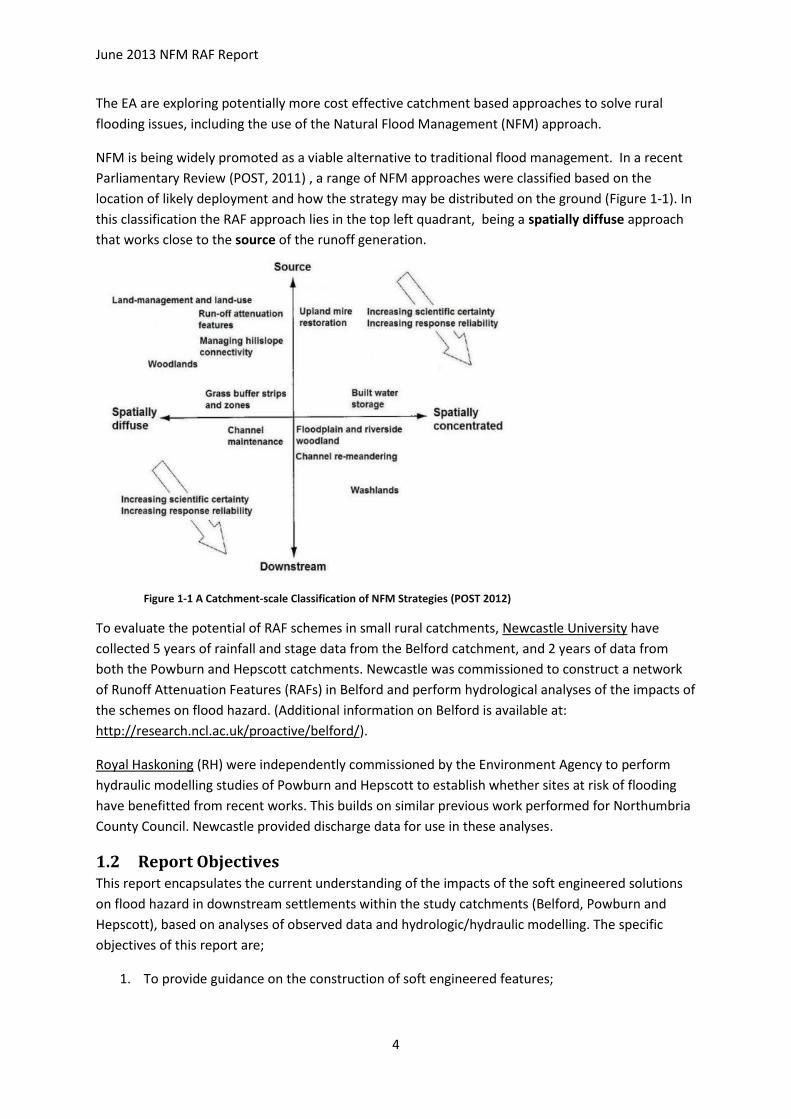
NFM is being widely promoted as a viable alternative to traditional flood management. In a recent
Parliamentary Review (POST, 2011) , a range of NFM approaches were classified based on the
location of likely deployment and how the strategy may be distributed on the ground (Figure 1-1). In
this classification the RAF approach lies in the top left quadrant, being a spatially diffuse approach
that works close to the source of the runoff generation.
Figure 1-1 A Catchment-scale Classification of NFM Strategies (POST 2012)
To evaluate the potential of RAF schemes in small rural catchments, Newcastle University have
collected 5 years of rainfall and stage data from the Belford catchment, and 2 years of data from
both the Powburn and Hepscott catchments. Newcastle was commissioned to construct a network
of Runoff Attenuation Features (RAFs) in Belford and perform hydrological analyses of the impacts of
the schemes on flood hazard. (Additional information on Belford is available at:
http://research.ncl.ac.uk/proactive/belford/).
Royal Haskoning (RH) were independently commissioned by the Environment Agency to perform
hydraulic modelling studies of Powburn and Hepscott to establish whether sites at risk of flooding
have benefitted from recent works. This builds on similar previous work performed for Northumbria
County Council. Newcastle provided discharge data for use in these analyses.
1.2 Report Objectives This report encapsulates the current understanding of the impacts of the soft engineered solutions
on flood hazard in downstream settlements within the study catchments (Belford, Powburn and
Hepscott), based on analyses of observed data and hydrologic/hydraulic modelling. The specific
objectives of this report are;
1. To provide guidance on the construction of soft engineered features;

June 2013 NFM RAF Report
5
2. To provide an assessment of the local functioning of the installed features during recent
flood events;
3. To upscale findings using hydrologic and hydraulic modelling for the assessment of the
downstream impacts of interventions in the three study catchments.
The approach taken to aid understanding of how features impact on downstream flood hazard has
been to combine hydrologic analyses of the functioning of individual features and
hydrologic/hydraulic modelling studies. The hydrologic analyses are classified as local scale
interpretations, as they aim to establish how a given feature functioned with regard to capturing
local river flow and local runoff. Additionally, these analyses are classified as providing direct
evidence as they are based on observational records. The outcomes of these assessments contribute
to objectives (1) and (2).
To contribute to objective (3), two modelling approaches have been taken to upscale the data and
local scale interpretations for the assessment of catchment scale impacts. Firstly, hydrologic models
have been created to both reproduce the observed responses of the features and then to
extrapolate the findings to assess impacts of hypothetical networks of features. These analyses
provide some guidance on the amount of storage/attenuation that is required to reduce flood risk,
using data from a number of recent storms and design storms. This work has focused on the Belford
catchment as several flood level events were observed. Secondly, hydraulic modelling has been used
to assess the impact of the recent flood mitigation networks that have been installed in the Powburn
and the Hepscott catchments.
The analyses detailed in this report reflect the evolution of the projects. Belford has a more intensive
and longer running instrumentation programme and hence many of the hydrologic analyses were
performed for this catchment. Based on preliminary findings and interpretations at Belford and
other Natural Flood Management schemes, features were installed in the Powburn and Hepscott
catchments by the EA. Hydraulic studies were commissioned to assess impacts at these sites.
1.3 Scope and Limitations Interesting findings have been produced in the course of this project. However, it is necessary to
state the limitations of the study.
1. Detection: It would be expected that the interventions would alter the observed
downstream hydrograph shape. As the pre- and post-change records are short, it is not
appropriate to use statistical analyses for the detection of changes in stream response. Also,
the problem of detection is confounded by strong natural variability in climate (O'Connell et
al., 2005).
2. Change in flood hazard: This issue is related to (1). Communities often wish to know the
level of protection that a flood alleviation scheme provides. Ideally, this information would
be derived from the change to the flood frequency curve (FFC). Despite the number of flood
events that have occurred within the monitoring period (specifically at Belford), it is not
possible to quantify the impacts of features on the FFC.
3. Extreme events: No major flood events were recorded at Hepscott and Powburn during the
study period. A lack of observational evidence of how the hydrological-hydraulic system,
June 2013 NFM RAF Report
6
including the installed features, operates in extreme conditions limits the conclusions that
can be drawn for these two catchments.
4. Spatial scale: The findings presented herein cannot be extrapolated to the large catchment
scale (approx. >10 km2). This is because the role of the river network, including expansive
floodplain storage, in propagating impacts downstream has not been considered in detail.
Such shortcomings are not unique to this project; engineering assessments typically experience such
difficulties.
2 Rationale for the Runoff Attenuation Feature Approach
“Why does Belford flood?”
Before commencing to describe the catchments and programmes of interventions in detail, it is
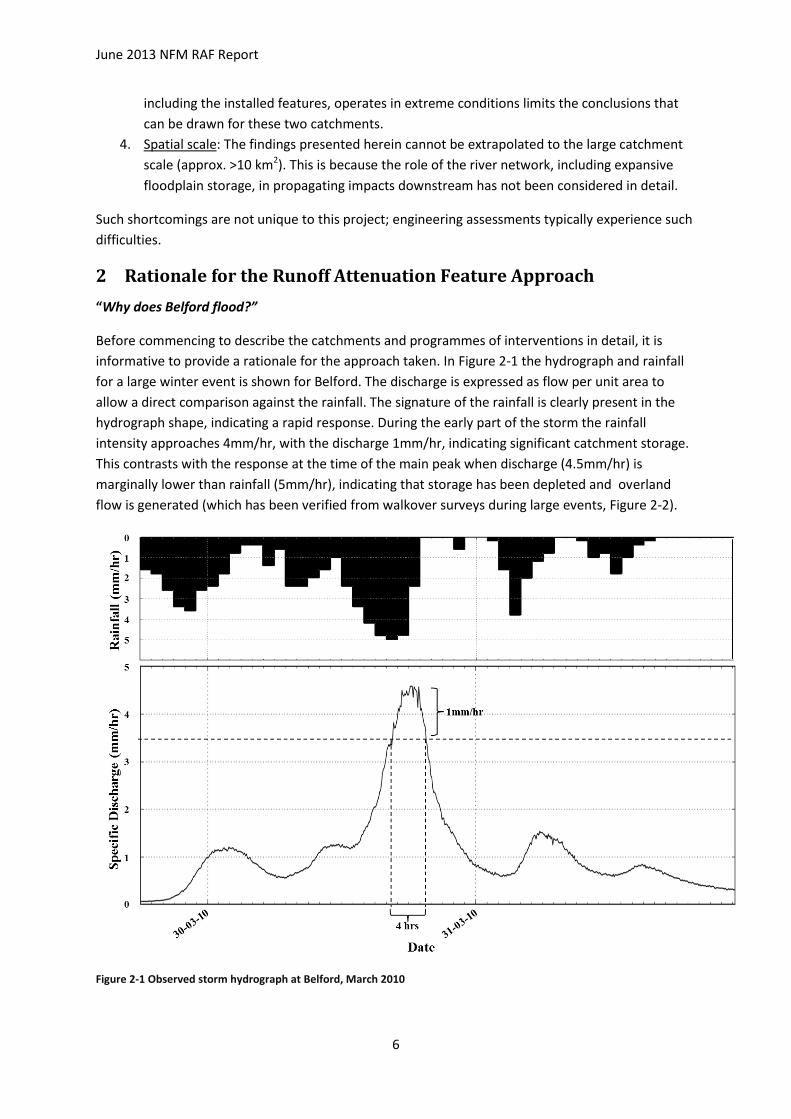
informative to provide a rationale for the approach taken. In Figure 2-1 the hydrograph and rainfall
for a large winter event is shown for Belford. The discharge is expressed as flow per unit area to
allow a direct comparison against the rainfall. The signature of the rainfall is clearly present in the
hydrograph shape, indicating a rapid response. During the early part of the storm the rainfall
intensity approaches 4mm/hr, with the discharge 1mm/hr, indicating significant catchment storage.
This contrasts with the response at the time of the main peak when discharge (4.5mm/hr) is
marginally lower than rainfall (5mm/hr), indicating that storage has been depleted and overland
flow is generated (which has been verified from walkover surveys during large events, Figure 2-2).
Figure 2-1 Observed storm hydrograph at Belford, March 2010
June 2013 NFM RAF Report
7
The horizontal dashed line in Figure 2-1 corresponds to the rate of discharge at which historic
flooding has occurred in Belford. The volume of runoff above this line is 20,000 m3 over the duration
of 4 hours. This simple analysis has been performed to provide a rough estimate to the volume of
flow that would need to be managed to reduce flood hazard in the downstream settlement of
Belford for this event. In interpreting such an analysis, a number of cautionary notes are required,
The amount of flood management required will depend on the magnitude of the flood peak
and the duration above the desired level of protection.
The flood management interventions need to be active (storing and attenuating) at the time
of the arrival of the flood peak.
Attenuation effects (e.g. due to large woody debris) need to be carefully considered;
attenuation and storage processes work together.
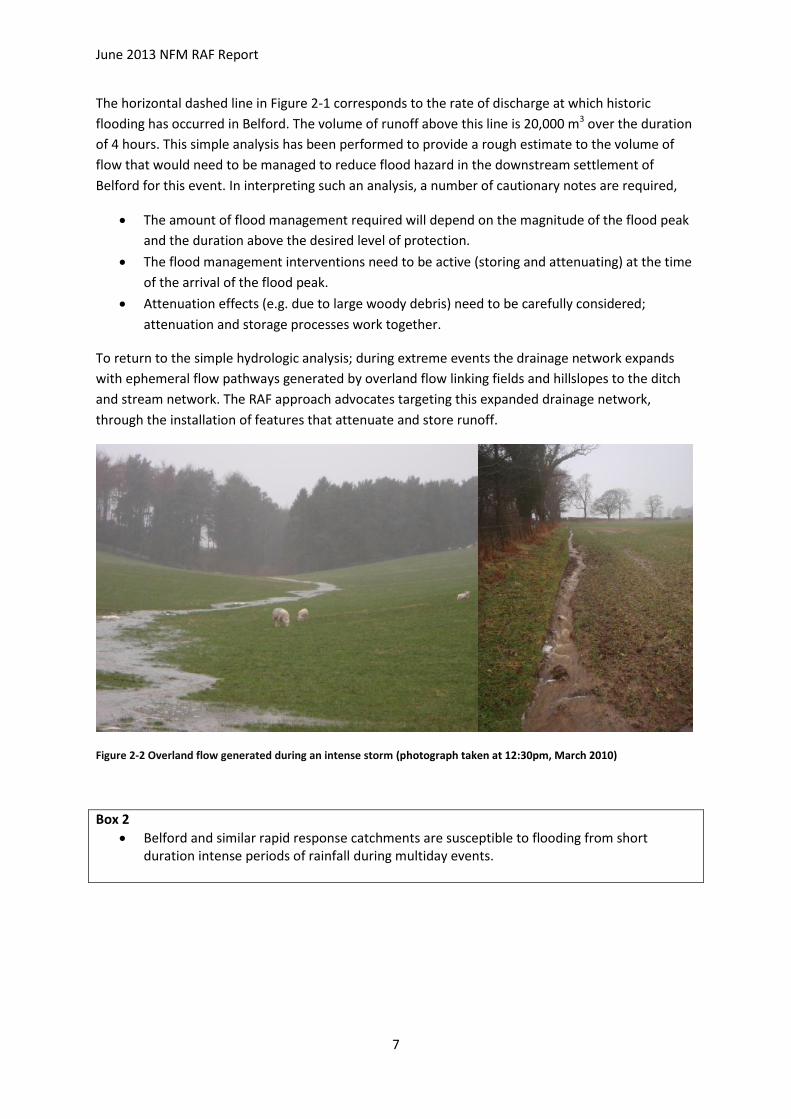
To return to the simple hydrologic analysis; during extreme events the drainage network expands
with ephemeral flow pathways generated by overland flow linking fields and hillslopes to the ditch
and stream network. The RAF approach advocates targeting this expanded drainage network,
through the installation of features that attenuate and store runoff.
Figure 2-2 Overland flow generated during an intense storm (photograph taken at 12:30pm, March 2010)
Box 2
Belford and similar rapid response catchments are susceptible to flooding from short duration intense periods of rainfall during multiday events.

June 2013 NFM RAF Report
8
3 Runoff Attenuation Features
“What is a Runoff Attenuation Feature?”
3.1 Runoff Attenuation Features: Definition and design philosophy A Runoff Attenuation Feature is defined as a man-made landscape intervention that intercepts and
attenuates a hydrological flow pathway to provide multiple benefits, including flood management
and improving water quality. Simply, the design philosophy is to create features that ‘slow, store and
filter’ runoff in the rural landscape. Key design attributes of RAFs are:
they are easily accommodated in the landscape;
they do not significantly impact on farming;
they are typically small in size or located within a ditch or small stream channel;
they are designed to be an extension of the farming and land drainage scheme drainage
regime (i.e. they must not be viewed solely as flood engineering projects);
The RAF approach advocates the use of many features located throughout the landscape, with the
benefits accrued by the network of features rather than one large scale / dominant intervention.
Also, the approach does not seek to replace more traditional flood management options, but rather
to add to the number of potential options available to flood managers.
3.2 Runoff Attenuation Features: Types of Interventions
“How do you build a RAF?”
Annex A provides summary details of the types of features that may be considered in delivering a
RAF-based flood mitigation scheme, including advice on construction, maintenance and impact
potential at the local scale. This information is summarised here.
The RAFs installed in Belford can be broadly classified in five types:
1. Overland flow interception: Involves creation of a bund (soil, wood or stone barrier) across
a flow path to create storage (Figure 3-1). These features are designed to drain slowly; the
barrier may be ‘leaky’, have an outlet drainage pipe installed, or often incorporate both of
these options.
2. Online ditch barriers: Barriers constructed from natural materials are located in drainage
ditches and streams to cause backwater effects (Figure 3-2). Often widening drainage
ditches is inexpensive and additionally creates an effective sediment trap and new ecological
habitats.
3. Large wood debris: Logs and branches are situated across the stream, or interlaced in
ditches, to increase hydraulic roughness (Figure 3-3).
4. Offline ponds: Water is diverted from the stream network into a pond structure creating
temporary storage (Figure 3-4). The pond is typically drained by an outflow structure in the
form of a plastic pipe which is constructed to allow the feature to drain in 4-24 hours.
5. Other features (e.g. riparian zone management): Rather than strictly adhering to the design
criterion specified for each type of feature, a more opportunistic and ambitious structure
may be proposed based on local knowledge.

June 2013 NFM RAF Report
9
The above features are further classified as ‘online’ if they are located in the drainage network or
intercept overflow (types 1, 2 and 3), else ‘offline’ (type 4). An online feature should not be used
where the upstream contributing area to the feature exceeds ~1 km2; at larger scales stream energy
may result in scour and failure. Processes below this scale are broadly classified as the hillslope scale
with drainage ditches classified as non-main river. However, consultation for land drainage consent
should always be advised when working in channels.
In terms of performance, no one feature type has been demonstrated to dominate and hence a
mixture of types should be incorporated into a RAF-based flood mitigation solution. Often a
combination of RAFs works well together, for example, an online structure can backup flow and
divert peak flow to an offline feature.

June 2013 NFM RAF Report
10
Figure 3-1 Overland flow interception
Overland flow interception
Target: Temporary overland flow
Positioning Gullies and ephemeral watercourses, including tracks and pathways, and low points in larger fields. Potential sites can be identified using GIS based terrain analysis e.g. FARM PLOT (Wilkinson and Quinn, 2010).
Construction Usually soil is used to form a bund, preferably sourced on-farm to avoid importing soil. However, wood and stones can also be used. A controlled spillway must be designed into the feature, with non-erosive material used as armouring to reduce the risk of scour. A bund also requires an outlet pipe. A diameter of approx. 30cm is suggested for a pond capacity of around 500m
3, but this should be checked with the construction contractor.
Typical storage capacity ~200-2000m3
(Note that the Reservoirs Act, amended by the Flood and Water Management Act 2010, covers man-made water bodies in excess of 10,000m
3.)
Maintenance May be prone to siltation, particularly in arable areas where sediment removal may be required on an annual basis. However, sedimentation may have positive impacts on water quality and can be considered a benefit.
Cost per feature Wood barriers can be expensive (depending on wood source and labour costs/skills), e.g. 150m for ~£5000, while soil bunds are inexpensive around £750 for a ~50m long bund, 1 metre high (if soil is sourced on site).
Side effects Care should be taken to prevent seasonal waterlogging on productive land, this requires that the feature should be designed to drain down quickly (typically 4-24 hours).
Comments Left panel: feature optimised with the removal one plank to increase speed of outflow, thus reducing water logging. Right panel: the feature was constructed using soil and stone to create an access track.
Lifespan The soil and stone features should last many years if properly maintained, but will need to be replaced at some stage. Visual inspection is needed particularly after large events. Hardwood wood barriers should last many years whilst those constructed of locally sourced pine may only last a few years. Frequent inspection is required.
Design guidelines Do not be too ambitious with height. A maximum height of 1m is suggested to prevent the need for high levels of engineering.

June 2013 NFM RAF Report
11
Figure 3-2 Online ditch barriers
Online ditch barriers
Target: Peak flow in small ditches and channels
Positioning Any incised ditch or small channel, where the banks afford good support for a barrier.
Construction Left panel: wood beams. Right panel: living willow barrier planted into the banks.
Typical storage capacity
10-1000m3, if used in series.
Maintenance Left panel: Flow goes under the feature and therefore it may be prone to scour. Right panel: The barrier is designed to be leaky, but accumulation of trash during storms may result in sedimentation; this design feature may be deliberate to deliver water quality benefits.
Cost per feature Wood can cost up to £1K per feature, willow is inexpensive but requires management.
Side effects Scouring or deposition is possible.
Comments Always check with EA/SEPA regarding land drainage consent.
Lifespan The feature should last many years but will need to be replaced at some stage, regular post-flood inspection needed. Willow barriers require coppicing every 2 years.
Design guidelines It is important that the features are securely keyed into the bank and can withstand being overtopped. Flow should stay in the ditch and should not flood the surrounding area.

June 2013 NFM RAF Report
12
Figure 3-3 Large woody debris features
Large Woody Debris
Target: Peak flow in small ditches and channels
Positioning Large tree trunks spanning the width of the ditch, 30-40 cm above the typical pre-storm flow depth. Choose location where there is potential for out of bank storage.
Construction Tree trunks are usually securely pinned in position on the bank and are orientated to cross over each other to aid stability. Roughen the riparian zone/ floodplain with trees and spare brash. See Wilkinson (2010a) for more details on woody debris management.
Storage capacity Difficult to quantify owing to leaky design. Features attenuate rather than store and are often constructed in series.
Maintenance Some small scour is allowed after construction resulting in settlement of the trunks. Small amount of movement expected in flood conditions, must downstream movement must be prevented. Inspection is recommended after large events.
Cost per feature Felling and positioning costs are £100-1000 per feature.
Side effects Scouring is possible but should be localised. Can be blocked by trash, however it may be preferable to leave the feature as a ‘beaver dam’ for ecological reasons as it still works as a RAF.
Comments Right panel: brash from felling is placed on the floodplain. Also trees (holly and hazel) are planted on the floodplain to increase roughness.
Lifespan Limited lifespan of a few years to 10 years, however. However, frequent inspection and vegetation management may be needed.
Design guidelines It is important that the features are securely held in position and can withstand being overtopped. Permission to fell trees (sycamore in this case) must be granted, with the trees replaced with indigenous species (e.g. oak). Low growing species are preferable to increase riparian zone roughness (e.g. holly and hazel).

June 2013 NFM RAF Report
13
Figure 3-4 Offline pond
Offline ponds Target: Peak flow in small channels, plus local overland flow pathways
Positioning Riparian zones, in a buffer strip or sited in the corner of fields
Construction Draw off channel (left panel) with an inlet armoured with coarse material to prevent scour, soil bund at front of feature (right panel) with a suitable drainage pipe. Wood can also be used (see overland flow interception).
Storage capacity 300-800m3. Some opportunistic sites may allow for more storage (200-4000m
3, but the
volume should not exceed the 10000m3 capacity limit covered by the Reservoir Act )
Maintenance Left panel: check for scouring of inlet feature. The soil barrier may erode but should stabilise after grass has established. Sediment may accumulate to the level of the pipe and may need removal.
Cost per feature £5K each but cost can be greatly reduced if several are constructed in close proximity.
Side effects May be some local water logging and loss of crop production
Comments It is recommended that the maximum bund height should not exceed 1m and that grass cover is established as quickly as possible. There are additional habitat benefits associated with the feature.
Lifespan Lifespan is estimated at 10-20 years, but inspection is needed. Grass/weeds should be cut at least once a year.
Design guidelines Choose an optimum location with the farmer. Permission for draw off channel construction is needed. A skilled digger driver will compact the bund and thus it should not erode. Drainage pipe is usual quite large (roughly 30 cm for a 500m
3 pond) to allow the feature to
empty in 8-10 hours. Make sure to design a spillway, this can be engineered with rocks or may use the natural field landscape towards the edge of the bund.
Bund
Drainage pipe in the bund
Bund
June 2013 NFM RAF Report
14
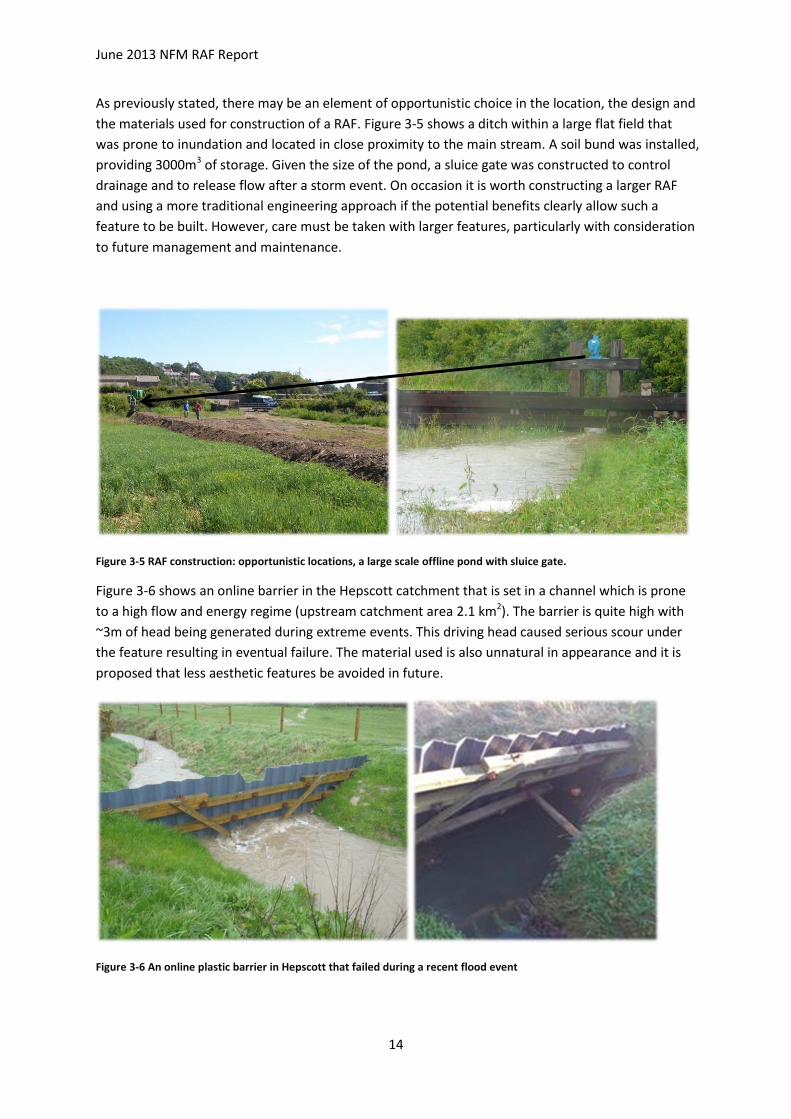
As previously stated, there may be an element of opportunistic choice in the location, the design and
the materials used for construction of a RAF. Figure 3-5 shows a ditch within a large flat field that
was prone to inundation and located in close proximity to the main stream. A soil bund was installed,
providing 3000m3 of storage. Given the size of the pond, a sluice gate was constructed to control
drainage and to release flow after a storm event. On occasion it is worth constructing a larger RAF
and using a more traditional engineering approach if the potential benefits clearly allow such a
feature to be built. However, care must be taken with larger features, particularly with consideration
to future management and maintenance.
Figure 3-5 RAF construction: opportunistic locations, a large scale offline pond with sluice gate.
Figure 3-6 shows an online barrier in the Hepscott catchment that is set in a channel which is prone
to a high flow and energy regime (upstream catchment area 2.1 km2). The barrier is quite high with
~3m of head being generated during extreme events. This driving head caused serious scour under
the feature resulting in eventual failure. The material used is also unnatural in appearance and it is
proposed that less aesthetic features be avoided in future.
Figure 3-6 An online plastic barrier in Hepscott that failed during a recent flood event

June 2013 NFM RAF Report
15
The EA Development and Control team prefers channels not to be blocked as this may result in
detrimental impacts on habitat. Where a 2 km2 upstream catchment area threshold is crossed, it is
recommended that a draw off channel and swale is constructed upstream of any offline mitigation
feature. In a recent project a stone armoured draw off feature was constructed at Dyke Head on the
Upper River Wansbeck, Figure 3-7.
Figure 3-7 Armoured draw off channel at Dyke Head on the River Wansbeck.
3.3 Design of a RAF Network
“Where should a RAF be located?”
There is no fixed design for locating a RAF other than identifying fast flow pathways and choosing an
appropriate site to target the peak flow of a storm. Farmers often possess this knowledge, which can
be augmented with topographic digital data and simple flow accumulation rules to identify suitable
locations (Heathwaite et al., 2005; Wilkinson and Quinn, 2010). Walk over surveys are also beneficial;
often evidence of overland flow can be observed in swales and valley bottoms. The schematic shown
in Figure 3-8 illustrates an idealised network, and also provides design rules regarding the
appropriate scale at which features should be installed.
It is appropriate to raise a number of salient points that should be considered in the planning stages.
It is imperative that the construction of a RAF network involves a partnership between regulatory
bodies, farmers and land owners, the local community and other relevant stakeholders. Experience
has shown that a transparent and inclusive process avoids later complications and quickens the
regulatory process. Keeping as many people informed as possible, for example through Town Hall
meetings, often encourages additional uptake of the approach by farmers, land owners and land
managers. The approach taken at Belford has evolved to fit within the current regulatory framework
and has been readily accepted by the local community.
There may be a need to refine individual features to improve their functioning during flood events;
often visual observation during an extreme event can be used to determine whether an inlet feature
or drainage rate needs modification. Any indication of feature scouring or collapsing can also be
reported. It is beneficial to engage those in close proximity to the sites, including farmers or local
farming advisors, to conduct visual surveys.

June 2013 NFM RAF Report
16
There is anecdotal evidence that land owners and those living within the catchment prefer the use
of natural materials in the construction of RAFS, purely from an aesthetic standpoint. Many different
materials were used in Belford, which can be broadly grouped into 4 categories:
1. In a more upland area with livestock and thin soils, a farmer preferred the use wood or
stone as soil bunds require more space and use up valuable soil. Some cattle farmers are
concerned that exposed bare soil increases the risk of diseases that can kill cattle, hence
wood is preferred.
2. In a lowland area with arable crops the use of bunds was preferred by the farmer as the soil
was deeper and readily available. In the case of one farm, the farmer had spare soil on farm
owing to the creation of new hard standings that would reduce poaching from his tractor
around the farm steadings.
3. Online ponds can use treated wood or willow spilings (only use native species of willow).
Experience of using recycled plastic has proven to be less desirable for aesthetic reasons
(Letts, 2012). The widening of ditches yields material that can be used to construct bunds
either within the ditch or to raise the ditch bank height.
4. Clearly large wood debris requires tree trucks. Experience, has shown that the EA team
would prefer the removal of non-native species (sycamore in Belford) with replacement with
native species (such as oak, if outside the riparian zone). The brash created by the tree
felling can be used to roughen the local floodplain. Brash must be secured in a ‘natural fence’
type feature. On the riparian zones of woodlands it is recommended to plant low growing
species of tree such as hazel and holly as these provide more roughness to complement the
brash on the floodplain.
June 2013 NFM RAF Report
17
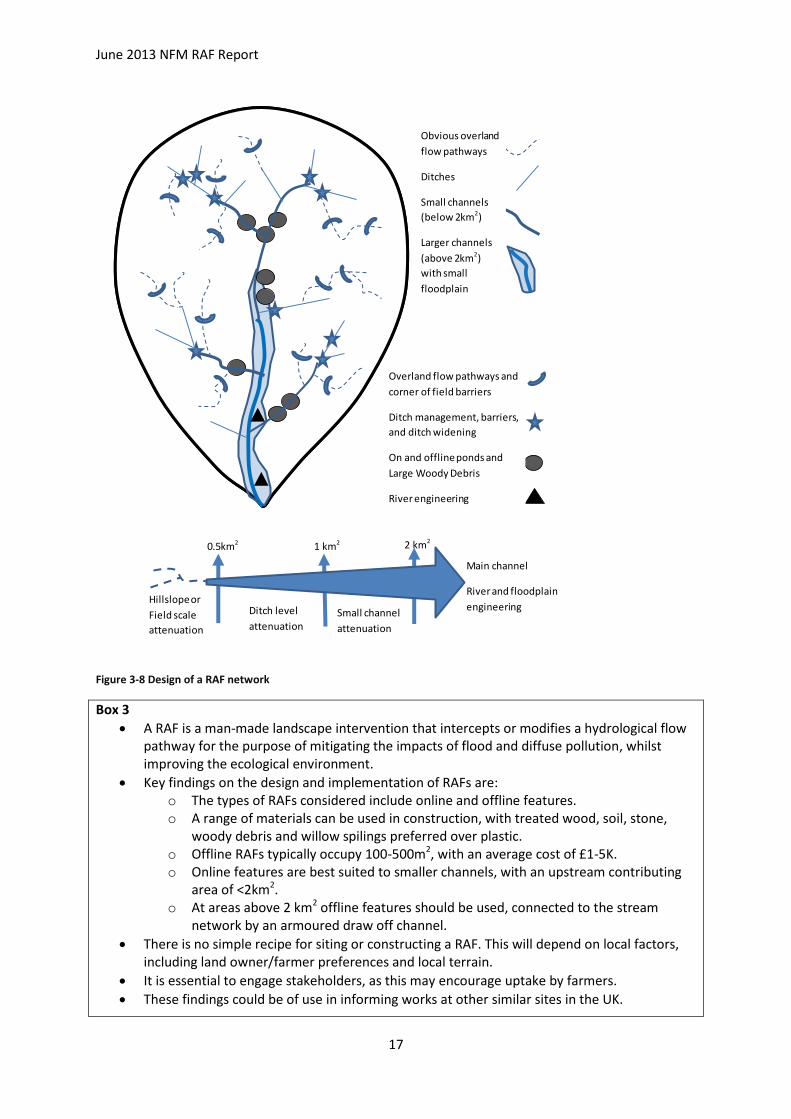
Figure 3-8 Design of a RAF network
Box 3
A RAF is a man-made landscape intervention that intercepts or modifies a hydrological flow pathway for the purpose of mitigating the impacts of flood and diffuse pollution, whilst improving the ecological environment.
Key findings on the design and implementation of RAFs are: o The types of RAFs considered include online and offline features. o A range of materials can be used in construction, with treated wood, soil, stone,
woody debris and willow spilings preferred over plastic. o Offline RAFs typically occupy 100-500m2, with an average cost of £1-5K. o Online features are best suited to smaller channels, with an upstream contributing
area of <2km2. o At areas above 2 km2 offline features should be used, connected to the stream
network by an armoured draw off channel.
There is no simple recipe for siting or constructing a RAF. This will depend on local factors, including land owner/farmer preferences and local terrain.
It is essential to engage stakeholders, as this may encourage uptake by farmers.
These findings could be of use in informing works at other similar sites in the UK.
Overland flow pathways and
corner of field barriers
Ditch management, barriers,
and ditch widening
On and offline ponds and
Large Woody Debris
River engineering
Obvious overland
flow pathways
Ditches
Small channels
(below 2km2)
Larger channels
(above 2km2)
with small
floodplain
Hillslope or
Field scale
attenuation
Main channel
River and floodplain
engineering Ditch level
attenuation Small channel
attenuation
0.5km2 2 km2 1 km2

June 2013 NFM RAF Report
18
4 The Belford Study
4.1 Catchment Description The upper Belford Burn catchment (5.7km2), Northumberland, is predominantly rural with grazing in
the western uplands and arable land in the east, Figure 4-1 (Nicholson et al., 2012; Wilkinson et al.,
2010b). The predominate soil series is Dunkeswick, a stagnogley soil with fine loamy topsoil and
clayey subsurface horizons prone to waterlogging (Jarvis, 1994). The source of the Belford Burn is
the Bowden Crags in the west of the catchment (185m AOD) from which it flows approximately 4.5
km before reaching the village of Belford. Within Belford the river channel is constricted by gardens,
walls and residential structures. There has been a long history of flooding in Belford, with 35
properties identified as at risk in the EA Indicative Floodplain maps.
FEH catchment descriptors for Belford are provided in Table 4-1. The Standard Percentage Runoff
(SPRHOST), defined as the percentage of rainfall that causes a short term increase in flow, is 40%,
and the Baseflow Index (BFIHOST), the ratio of long term baseflow to total streamflow, is 0.313 (IH,
1999). The time to peak (TP), a measure of the time between the flood-producing rainfall and the
resulting flood response, is 2 hours. These attributes are typical of rapid response catchments that
are prone to flooding (EA, 2011). Long term mean annual rainfall is 695 mm, but this value can vary
significantly from year to year.
Figure 4-1 Upper Belford Burn catchment with locations of RAFs

June 2013 NFM RAF Report
19
Attribute Value
Physical attributes
Area, km2 5.7
Mean catchment altitude, m (*ALTBAR) 118
Mean slope, m/km (*DPSBAR) 62.5
Floodplain extent, fraction 0:1 (*FPEXT) 0.0427
Fraction of urban extent, 0:1 (*URBEXT) 0.0
Hydrological attributes
Baseflow Index, fraction 0:1 (*BFIHOST) 0.313
Average annual rainfall 1961-90, mm (*SAAR) 695
Standard percentage runoff, % (*SPRHOST) 40.76
Time to peak (*TP(0)) 2.03
Table 4-1 Attributes of the Belford Burn Catchment to Belford (* = FEH descriptor; IH, 1999).
4.2 Belford RAF Network Summary details of the 35 RAF features installed in Belford prior to January 2012 are provided in
table 4-2 and their locations are shown in Figure 4-1. It should be noted that the value specified for
total storage in Table 4-2 (9-10K m3) is less than the 20K m3 depicted in Figure 2-1. This value does
not however include the attenuation effects created by wood debris and within channel barriers,
which is more difficult to quantify. (Specifically, the backwater storage and attenuation effects of
these features are a function of stage, which is event specific.) In terms of contribution to total
storage, the main type of RAF employed in Belford is the offline pond. The hydrological analyses
detailed below have therefore primarily focused on this type of intervention. (The wider
environmental benefits of the features have not been analysed as this falls outside the scope of this
report.) More features have recently been added by Newcastle University and the EA, but as the
project has now ended the new features have not been included in this study.
The estimated cost of the features in Belford £70K-100K relates only to construction costs, Table 4-2.
(The actual cost of implementing the features in Belford was higher due to the research,
management, engagement and scoping expenditure). The range of estimated construction cost
values associated with the feature types indicates that a similar amount of storage could have been
created at a lower cost. However, actual costs depend on the availability of locations and their site
specific characteristics.
Table 4-2 Features built in Belford and estimates of typical capacity and cost. Note, some Large woody debris sites contain more than 1 feature. (Consultancy and research costs are not included).
Feature type Number built Typical min, max storage m3 / feature Estimated cost
Overland flow interception 5 300-1000 1K-5K
Online ditch features 10 50-150 1K-3K
Offline ponds 5 200-3000 2K-6K
Large woody debris 12 50-150 1K-3K
Opportunistic RAF sites 3 1000-3000 1K-10K
TOTAL 35 Estimate for Belford 9000-10000m3 £70K-100K

June 2013 NFM RAF Report
20
4.3 Hydrological Analyses: Storm Selection Two flood events have been chosen for the hydrological analyses; a summer and a winter event.
Both events, which caused flooding in Belford Village to a small degree, are the largest events
recorded since the project began in late 2007 (Figure 4-2).
The winter March 2010 event was the result of a two day storm, with 59 mm and 77 mm of rainfall
recorded over the 24 and 48 hour periods preceding the flood peak, respectively. Using the FEH
Depth Duration Frequency rainfall model, the return period for the 24 and 48 hour totals are
estimated at 5 and 12.5 years. The summer July 2009 flood event was also a result of a 2 day event,
with rainfall totals of 46 mm and 70 mm in 24 and 48 hour periods, respectively, with return periods
of 10 and 17.5 years.
Figure 4-2 Historic events used in analyses (left panel - July, 2009; right panel March 2010)
4.4 FEH Design Storms In this section, guidance in using the FEH rainfall-runoff methodology for flood analyses is provided
through the comparison of design storms against observed storms. In Figure 4-3 the March 2010
storm is compared against the 1 in 100 year event derived using 12 hour and 24 hour FEH design
storm events. These design storms were selected as they have a peak flow and a hydrograph width
broadly corresponding to the observed hydrograph. It is known that the March 2010 event had a
return period of less than 100 years; for example the 24 hour rainfall return period was 12.5 years
and several flood events of this magnitude have been recorded in Belford in the last 10 years. (Note,
there are insufficient data to reliably estimate the actual return period of the observed storm.) It is
concluded that analyses based on design storms may be unreliable in terms of interpretation of
return periods.

June 2013 NFM RAF Report
21
Figure 4-3 Comparison of historic event and FEH design storms
4.5 Functioning of a RAF In this section, the value of collecting monitoring data is demonstrated through the forensic
examination of RAF-3, an offline pond located immediately upstream of Belford (Figure 3-4). To
allow this investigation the following data were measured or derived:
1. Stream stage heights immediately upstream of the pond inlet (measured using pressure
transducers; ~15min recordings)
2. Current flow measurements, which were used to a derive stage/discharge relationship.
Applied to (1) to derive a time series of upstream stream flows.
3. Stage heights within the offline pond (pressure transducer/15 mins)
4. Field surveys of the pond to provide the stage/volume relationship. Applied to (3) to derive a
time series of pond storage volumes.
Example data sets are provided in Figure 4-4 for the July 2009 storm. The onset of infilling occurs
when the stream stage exceeds the spillway height, which is ~0.35 m for RAF-3. Based on these data,
some interpretations of the performance of RAF-3 are:
The pond has a potential storage volume of 370 m3. It is effective at capturing flow, but it
reaches 90% capacity ~1 hour before the arrival of the main flood peak. Detailed information
of this type can be used to modify features for improved performance. In this case the
spillway height was subsequently raised to delay the onset of filling and increase available
storage capacity later in the storm.
The pond empties in ~6 hours. This is deemed appropriate. If the pond outflow pipe is too
large the feature will not fill; if it is too small the pond will not sufficiently drain to provide
capacity for the next storm event. As a general rule, it is suggested that ponds should drain
within 6-10 hours, so that there is storage available in the eventuality of multi-day extreme
events.
0
1
2
3
4
5
-24 -18 -12 -6 0 6 12 18 24
Sp
ecif
ic D
isch
arg
e (m
m/h
r)
Time (hours, relative to flood peak)
1 in 100 yr
(12hr)1 in 100 yr
(24hr)Mar-2010
Event

June 2013 NFM RAF Report
22
Figure 4-4 Data from RAF-3, 17th
July 2009
4.6 Local Scale Impact of Features
“How does a RAF work?”
In this section an example of the impact of a representative offline pond, RAF-3, on local stream flow
is quantified. Further details of this work are provided in Nicholson et al. (2012) and Nicholson
(2013). The local impact of a pond is simply the difference between the pre- and post-change flows
in the stream channel immediately downstream of the feature. Obviously, the pre-change flows are
not available for an historical event and hence impact is indirectly calculated from the net gains and
losses from the stream channel to the pond:
[ ]
where Qin is the inflow from the channel to the pond and Qout is the outflow from the pond. As the
pond fills (Qout<Qin) there will be a positive impact, with a net loss of streamflow to the pond and
reduction in stream stage height. As a pond empties (Qout>Qin) after the flood peak there will a
negative impact. It should be noted that the storage/attenuation of flow along the travel paths to
and from the pond are not quantified in the above equation; it has been assumed that the pond is
closely coupled to the channel. This is a reasonable assumption for the majority of ponds. Also the
local lateral overland flow inflows and infiltration losses from the pond are assumed small and are
neglected.
The flows into and out of the pond cannot be directly quantified as the flow depths are too shallow
to allow the accurate measurement of depth and velocity. Instead, the inflows are derived from a
weir equation and stream stage, and the outflows from a hydrostatic equation and pond depths.
These equations (termed the Pond Model) have been validated by establishing that the simulated
pond storage accurately reproduced the observed.

June 2013 NFM RAF Report
23
The results for the summer and winter events are shown in Figure 4-5. The pre- and post-change
hydrographs are very similar and the impact is small. For both events there is a net storage on the
rising hydrograph limb (positive impact) and a net loss on the recession limb of the hydrograph
(negative impact). At the time of the arrival of the main flood peak the impact is small because there
is little storage available (Figure 4-4).
However it should be stressed that it is the collective network of RAFs, rather than individual
features, that aim to provide flood mitigation, as demonstrated below.
Figure 4-5 Pre- and post-change hydrographs for RAF-3 and impact; left panel July 2009, right panel March 2010
4.7 Catchment Scale Analyses of Network of Features
“How many RAFs do we need?”
Given the above findings, there is a need to establish how much storage is required to significantly
reduce flood impact in Belford. The approach taken has been to assume a hypothetical reach of
channel (Figure 4-6). Based on experience of the size of interventions that are acceptable to land
owners, each pond of is allocated a storage potential of 550 m3.
Figure 4-6 Synthetic pond network
Using the Pond Model developed above, simulations have been performed in which increasing
numbers of RAFs have been assigned to the channel reach. (A subset of the configurations has also
been simulated using a 2D hydraulic model; the general conclusion drawn was the same, hence the
Qus Qds Qin
Qin
Qin Qin
Qin
Qin
Qin Qin
Qout
Qout
Qout Qout
Qout
Qout
Qout Qout

June 2013 NFM RAF Report
24
results are not presented here). Simulations were performed for the summer and winter events
detailed above, with the upstream channel stage height (Qus) set as in the previous analyses.
In Figure 4-7 each line represents the downstream channel flow (Qds) with an additional RAF
attached to the channel reach. The upper blue line represents a single feature (550 m3 of storage)
and the lower green line 35 features (19,250 m3). Increasing the number of features results in the
attenuation of the flood peak, with water being stored in the RAF network on the rising hydrograph
limb and returned on the recession. As a pond starts to fill, the flood stage immediately downstream
is reduced and hence there is a delay in the onset of the filling of the subsequent pond, producing a
cascade effect along the reach.
Figure 4-7 Impact of different configuration of ponds along a hypothetical steam reach (left panel July 2009; right panel March 2010)
A similar analysis has been performed for the 100 year (24-hour) return period event derived using
the FEH rainfall-runoff methodology, Figure 4-8. In comparison to the historic events, which had
similar peak flows but were of shorter duration, the impacts of increasing the numbers of ponds on
the flood peak is less. This is because of the shape of the hydrograph. The time effectiveness of a
pond network relates to both the flood magnitude and the duration that the stream stage level
exceeds the spillway inflow elevation.
Increasing
number of
RAFs

June 2013 NFM RAF Report
25
Figure 4-8 Impact of different configuration of ponds along a hypothetical steam reach, 100 year design period event
In Figure 4-9, the impacts of increasing number of ponds are illustrated for the three events detailed
above. A storage of 19,250 m3, which is similar to that depicted in Figure 2-1, results in a reduction
of the flood peak by approximately 30% for the historic events and 15% for the design storm.
Figure 4-9 Graph showing number of RAFs versus reduction in peak discharge Qp (each RAF has a storage of 550m3)
It is interesting to note that for the March 2010 event, which is the largest, there is no significant
reduction in the flood peak until a storage of ~10,000 m3 is added to the network. This is because at
lower levels of added storage all of the ponds fill before the arrival of the main flood peak. There is
probably a critical number of RAFs that are needed in order to create significant peak flow reduction
in catchments similar to Belford.

June 2013 NFM RAF Report
26
Box 4
RAFS are designed to target fast runoff pathways and should fill and empty in a timely fashion (ideally <10 hours).
The instrumentation or observation of features is recommended to establish how features operate during extreme events and to highlight the need for improvements in design.
Each RAF performs a small amount of runoff storage/attenuation.
It is the collective network of RAFs, rather than individual features, that aim to provide downstream flood mitigation.
Based on results from modelling, a network of Runoff Attenuation Features has been demonstrated to have a positive impact on flood hazard in small catchments.
The effectiveness of networks of RAFs to attenuate flood depends upon the shape of the hydrograph; RAFs are more effective for flashy short duration flood events.
The impact of RAF networks on the Flood Frequency Curve has not been assessed.
The FEH method has proved to be misleading for Belford, specifically in terms of return period interval.
Therefore conclusions drawn regarding flood magnitude and the required mitigation derived from FEH may be misleading.
The success of the Belford project has been in gaining knowledge of the cause and effect of runoff processes and the mitigation thereof. This evidence is supported by high quality observed data sets.
For Belford a shift in the time of peak of 2-3 hours greatly reduces flood hazard.
The approach of using networks of RAFs in the rural landscape could potentially provide a cost effective means to reduce flood risk in small rapid response catchments.
For a hypothetical pond network providing 19,250 m3 of storage, the peak flow reduction is estimated to be between 15-30% for both observed events and FEH design storm events.

June 2013 NFM RAF Report
27
5 The Powburn and Hepscott Studies
“Do the mitigation schemes in Powburn and Hepscott work?”
Newcastle University installed a rain gauge and 4 stream flow gauges within the Hepscott and the
Powburn catchments (see Annex D). However, there were no significant storms recorded during the
2 year instrumentation period. Several of the mitigation features were instrumented with water
level recorders, but with the exception of one feature (Crawley Dene), no inflows occurred. The
Hepscott and Powburn studies are therefore not described in detail, although some results from ISIS
hydraulic simulations performed by Royal Haskoning are provided in the supporting Annexes. In
Annex B and C the performance of the mitigation schemes for design storms are provided.
In Table 5-1 the catchment characteristics of Powburn and Hepscott are compared to those for
Belford. The physical and hydrological characteristics of the three catchments are broadly similar.
The most significant difference is the time to peak (Tp), a measure of the time between the flood-
producing rainfall and the resulting flood response, which is significantly larger at Hepscott (3.9
hours). This reflects the shallower topography in this catchment (as defined by DPSBAR). A note of
caution is required in the interpretation of Tp; the values have been calculated using a multilinear
regression relationship derived from nationally available datasets rather than site specific
information (IH, 1999). (Also note that the urban extent of Hepscott is probably significantly larger
than that given by the FEH descriptors.)
Table 5-1 FEH catchment descriptors
FEH Descriptor
Description Belford Hepscott Powburn
Physical attributes
AREA Area, km2 5.5 8.0 10.7
ALTBAR Mean catchment altitude, m 118 73 47
DPSBAR Mean slope, m/km 62.5 23.7 84.4
URBEXT Fraction of urban extent, 0:1 0.0 0.0159 0.0005
Hydrological attributes
BFIHOST Baseflow Index est from soil type, fraction 0:1 0.313 0.317 0.408
PROPWET Proportion time SMD <=6mm 1961-90, fraction 0:1 0.45 0.34 0.45
SAAR Average annual rainfall 1961-90, mm 695 698 761
SPRHOST Standard percentage runoff est from soil type, % 40.76 40.98 37.14
Tp(0) Time-to-peak of an instantaneous UH, hours 2.0 3.9 2.3
In comparison to Belford, fewer mitigation features were built in Powburn and Hepscott, but
generally the features were larger (Annex B and C). Also the schemes were significantly different to
the RAFs used in the Belford study and, hence, it is not possible to draw reliable conclusions about
their effectiveness based on experiences in Belford. It is recommended that additional monitoring is
performed of the individual features within in these catchments.
In the absence of observational evidence for extreme events, hydraulic simulation was used to
provide insight into the performance of the Powburn and Hepscott schemes. Existing ISIS models

June 2013 NFM RAF Report
28
that included a representation of several mitigation features were used. As described in the previous
section (4.4, Figure 4-3), the use of design storms may give misleading results, so Belford events
were used as a surrogate for extreme events. The results from the ISIS models indicated that the
impact of the features on downstream flood levels were negligible for large events. However, it
should be noted that it has not been possible to validate the models’ performance in simulating the
features due to a lack of in situ observations. Additionally, there are questions regarding the
suitability of the Belford flows used, which were simply scaled by area to provide flows for the target
sites. The simulation results are not shown herein but the experience has highlighted the need for
future flood studies in small catchments to take into consideration both the duration and return
interval of design storm events.
Box 5
The mitigation schemes implemented by the EA in Hepscott and Powburn differ significantly from the RAF network installed in Belford.
It is therefore not possible to reliably extrapolate findings and interpretations from Belford
to these two catchments.
Hydraulic simulations using observed flow from Belford may have been too large to allow
the local mitigation features to be fairly evaluated.
Due to a lack of data and the simulation results, there is no clear evidence as to whether the Powburn and Hepscott schemes work. Hence, there is a need for continued observation to derive the necessary datasets to underpin analyses and modelling of impacts on flood hazard. We recommend that individual mitigation features and/or shorter river reaches should be monitored, as in the Belford case study.
June 2013 NFM RAF Report
29
6 On-going Research and Future Research Needs There is not a simple methodology or tool for designing an appropriate network of RAFs to achieve a
desired level of reduction in flood hazard for a particular catchment. This challenge is being
addressed by Newcastle University as on-going work. The first step has been to produce a model
that can estimate the impact of a network of ponds detailed, above.
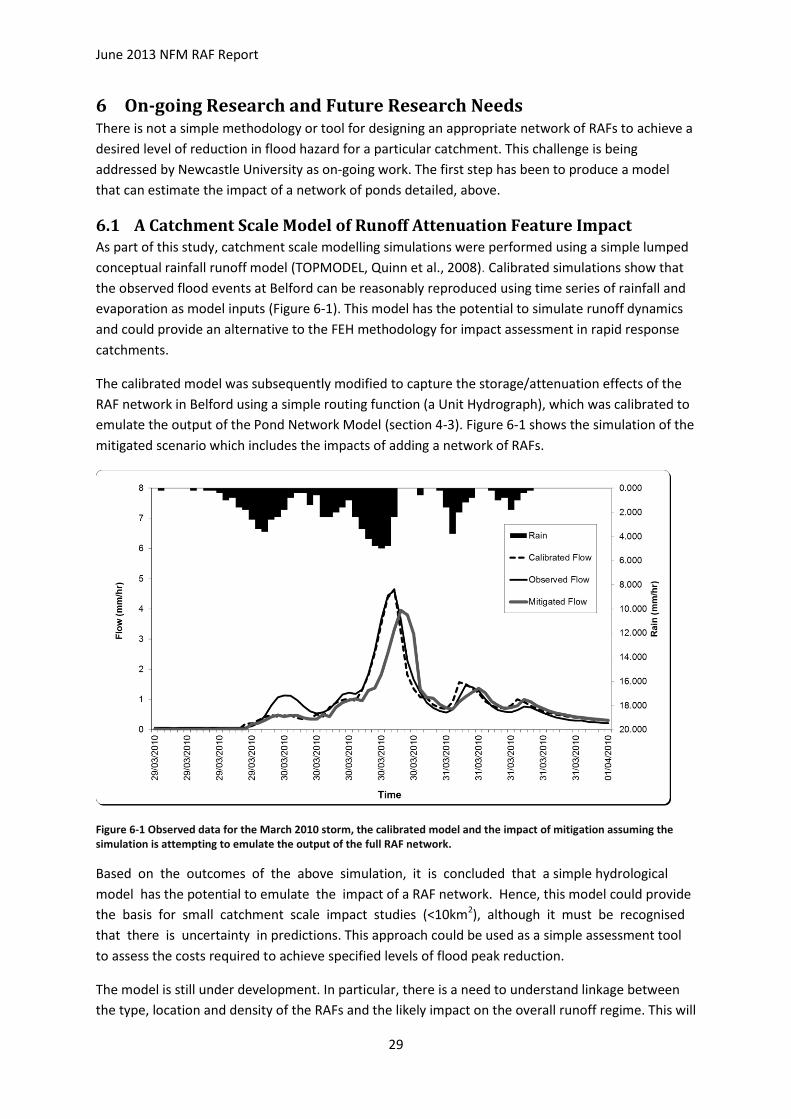
6.1 A Catchment Scale Model of Runoff Attenuation Feature Impact As part of this study, catchment scale modelling simulations were performed using a simple lumped
conceptual rainfall runoff model (TOPMODEL, Quinn et al., 2008). Calibrated simulations show that
the observed flood events at Belford can be reasonably reproduced using time series of rainfall and
evaporation as model inputs (Figure 6-1). This model has the potential to simulate runoff dynamics
and could provide an alternative to the FEH methodology for impact assessment in rapid response
catchments.
The calibrated model was subsequently modified to capture the storage/attenuation effects of the
RAF network in Belford using a simple routing function (a Unit Hydrograph), which was calibrated to
emulate the output of the Pond Network Model (section 4-3). Figure 6-1 shows the simulation of the
mitigated scenario which includes the impacts of adding a network of RAFs.
Figure 6-1 Observed data for the March 2010 storm, the calibrated model and the impact of mitigation assuming the simulation is attempting to emulate the output of the full RAF network.
Based on the outcomes of the above simulation, it is concluded that a simple hydrological
model has the potential to emulate the impact of a RAF network. Hence, this model could provide
the basis for small catchment scale impact studies (<10km2), although it must be recognised
that there is uncertainty in predictions. This approach could be used as a simple assessment tool
to assess the costs required to achieve specified levels of flood peak reduction.
The model is still under development. In particular, there is a need to understand linkage between
the type, location and density of the RAFs and the likely impact on the overall runoff regime. This will

June 2013 NFM RAF Report
30
require additional data, which the study catchments are providing. However there is also a need to
reconcile detailed hydraulic simulations and hydrological approximations.
6.2 Resources Additional information on RAFs, including details of multiple benefits, can be found in the following
peer reviewed papers:
Wilkinson ME, Quinn PF, Welton P. Runoff management during the September 2008 floods in the Belford catchment, Northumberland. Journal of Flood Risk Management 2010, 3(4), 285-295.
Barber, NJ and Quinn P.F. Runoff attenuation features: a sustainable flood mitigation strategy in the Belford catchment, UK. Area, 2012, 44(4), DOI: 10.1111/j.1475-4762.2012.01099.x.
Nicholson, AR, Wilkinson, ME, O’Donnell, GM, Quinn PF. Runoff attenuation features: a sustainable flood mitigation strategy in the Belford catchment, UK. Area, 2012, 44(4), DOI: 10.1111/j.1475-4762.2012.01099.x
The following are on-going PhD studies related to Belford:
Implementation and assessment of the impact of RAFs at Belford- PhD. Alex Nicholson (due for completion in 2013).
Impact of RAFs on water quality (nitrate, phosphorus and sediment)-PhD. Nick Barber. Due to complete in 2013. RAFs are being assessed at Belford and Netherton and both sites are showing positive impact of RAFs to water quality.
Impact of hydrological models on flood flow using RAFS- PhD. Gareth Owen, studying Great Ayton (30km2), and three 10km2 catchments in the River Eden. (First year of study). The model will attempt to map the impact of interventions across more complex river networks.
An object orientated hydraulic simulation of RAFs at the catchment scale- PhD. Luke Smith, using advanced computational fluid dynamics to simulate RAFs by creating individual objects that can be mapped onto real catchments. Belford will be the test site for the model. (First year of study).

June 2013 NFM RAF Report
31
7 Conclusions
The key question that this report has addressed is:
“Does the RAF approach work in Belford?”
Ideally, this question would also be posed for Hepscott and Powburn, but due to a lack of
observational data it has not been possible to derive reliable findings. However, some general
recommendations are provided.
The above key question has been tackled through a series of more focussed questions:
“Why does Belford flood?”
Belford and similar rapid response catchments are susceptible to flooding from short
duration intense periods of rainfall that occur within multiday events.
“What is a Runoff Attenuation Feature?”
A RAF is a man-made landscape intervention that intercepts or modifies a hydrological flow
pathway for the purpose of mitigating the impacts of flood and diffuse pollution.
“How do you build a RAF?” and “Where should a RAF be located?”
Key findings on the design and implementation of RAFs are:
o A variety of RAFs can be used, including online and offline features.
o A range of materials can be used in construction, with treated wood, soil, stone,
woody debris and willow spilings preferred over plastic.
o Offline RAFs typically occupy an area of 500m2, with an average cost of £3K.
o Online features are best suited to smaller channels, with an upstream contributing
area of <2km2.
o At areas above 2 km2 offline features should be used, connected to the stream
network by an armoured draw off channel.
There is no simple recipe for siting or constructing a RAF. This will depend on local factors,
including land owner/farmer preferences and local terrain.
It is essential to engage stakeholders, as this may encourage uptake by farmers.
These findings could be of use in informing works at other similar sites in the UK.
“How does a RAF work?” and “How many RAFs do we need?”
RAFS are designed to target fast runoff pathways and should fill and empty in a timely
fashion (ideally <10 hours).
The instrumentation or observation of features is recommended to establish how features
operate during extreme events and to highlight the need for improvements in design and
performance.
Each RAF performs a small amount of runoff storage/attenuation.
It is the collective network of RAFs, rather than individual features, that aim to provide
downstream flood mitigation.
Based on results from modelling, a network of Runoff Attenuation Features has been
demonstrated to have a positive impact on flood hazard in small catchments.

June 2013 NFM RAF Report
32
The effectiveness of networks of RAFs to attenuate flood depends upon the shape of the
hydrograph; RAFs are more effective for flashy short duration flood events.
The impact of RAF networks on the Flood Frequency Curve has not been assessed.
The FEH method has proved to be misleading for Belford, specifically in terms of return
period interval.
Therefore conclusions drawn regarding flood magnitude and the required level of mitigation
derived from analyses of FEH events may be misleading.
The success of the Belford project has been in gaining knowledge of the cause and effect of
runoff processes and the mitigation thereof. This evidence is supported by high quality
observed data sets.
For Belford a shift in the time of peak of 2-3 hours greatly reduces flood hazard.
The approach of using networks of RAFs in the rural landscape could potentially provide a
cost effective means to reduce flood risk in small rapid response catchments.
Returning to the key question “Does the RAF approach work in Belford?” based on the evidence
presented in this report it is concluded:
At least 30 RAFs proving ~10,000 m3 of storage and runoff attenuation are required to
significantly impact on large flood events in Belford. The estimated construction cost is £70-
100K.
For a hypothetical pond network providing 19,250 m3 of storage, the peak flow reduction is
estimated to be between 15-30% for both observed flood level event and large return
interval FEH events (see section 4-7).
The effectiveness of RAFs, in terms of reduction in peak flow, is related to the event return
period.
It is therefore recommend that additional RAFs should be built, if costs allow, to reduce
flood hazard further.
The RAF approach as implemented at Belford is suited to similar small rapid response
catchments.
Finally, some comments relating to Hepscott and Powburn:
The mitigation schemes implemented by the EA in Hepscott and Powburn significantly from
the RAF network installed in Belford.
It is therefore not possible to reliably extrapolate findings and interpretations from Belford
to these two catchments.
Hydraulic simulations using observed events from Belford may have been too large to allow
the local mitigation features studied by RH to be fairly evaluated.
Due to a lack of data, there is no clear evidence as to whether the Powburn and Hepscott
schemes work. Hence, there is a need for continued observation to derive the necessary
datasets to underpin analyses and modelling on impacts to flood hazard.
7.1 A strategic future for RAFs at the catchment scale There is a desire to actively management catchments to provide a host of ecosystem services. This is
driven by recent legislation, including the WFD and the Nitrates Directive. The Defra funded
Demonstration Test Catchment (DTC; http://www.demonstratingcatchmentmanagement.net/)

June 2013 NFM RAF Report
33
initiative is exploring ways of reducing diffuse agricultural pollution at the catchment scale, while
ensuring the delivery of sustainable food production. The approach taken by DTC has similarities
with the philosophy underpinning the use of RAFs for flooding. Hence there is a potential to
harmonise and co-fund interventions aimed at reducing flooding and improving water quality, but to
date this has not been exploited. Closer cooperation and funding of ecosystems services could
encourage the wider uptake of the RAF approach.

June 2013 NFM RAF Report
34
8 References EA, 2011. Guidance on maintaining the rapid response catchment register and creating action plans,
Operational Guidance note 1131_08 Halcrow, 2007. Environment agency North East region Belford burn, Belford: prefeassibility study,
Halcrow, Edinburgh. Heathwaite, A.L., Quinn, P.F., Hewett, C.J.M., 2005. Modelling and managing critical source areas of
diffuse pollution from agricultural land using flow connectivity simulation. Journal of Hydrology, 304(1–4): 446-461.
IH, 1999. Flood Estimation Handbook, Institute of Hydrology, Wallingford, UK. Jarvis, R.A., 1994. Soils and Their Use in Northern England (Bulletin / Soil Survey of England and
Wales) Rothamsted Experimental Station 432 pp. Letts, J., 2012. Rural Sustainable Drainage Systems (SuDS) Environment Agency, Bristol, UK. Nicholson, A.R., 2013. On-farm storage for flood mitigation, Newcastle University. Nicholson, A.R., Wilkinson, M.E., O'Donnell, G.M., Quinn, P.F., 2012. Runoff attenuation features: a
sustainable flood mitigation strategy in the Belford catchment, UK. Area, 44(4): 463-469. O'Connell, P.E. et al., 2005. Review of impacts of rural land use and management on flood
generation: Impact study report. Department of Environment, Food and Rural Affairs, Research and Development Technical Report FD2114/TR, Defra Flood Management Division, London.
POST, 2011. Natural Flood Management POSTNOTE 396, Parliamentary Office of Science and Technology, UK.
Quinn, P.F., Hewett, C.J.M., Dayawansa, N.D.K., 2008. TOPCAT-NP: a minimum information requirement model for simulation of flow and nutrient transport from agricultural systems. Hydrological Processes, 22(14): 2565-2580.
Wilkinson, M.E., Quinn, P.F., 2010. Belford Catchment Proactive Flood Solutions: A toolkit for managing runoff in the rural landscape. In: SAC (Ed.), SAC and SEPA Biennial Conference: Climate, Water and Soil: Science, Policy and Practice,, Edinburgh.
Wilkinson, M.E., Quinn, P.F., Benson, I., Welton, P., 2010a. Runoff Management: Mitigation measures for disconnecting flow pathways in the Belford Burn catchment to reduce flood risk. In: British Hydrological Society (Ed.), British Hydrological Society International Symposium. 2010, Newcastle upon Tyne.
Wilkinson, M.E., Quinn, P.F., Welton, P., 2010b. Runoff management during the September 2008 floods in the Belford catchment, Northumberland. Journal of Flood Risk Management, 3(4): 285-295.
Annex
Supporting information for these projects can be found at
http://research.ncl.ac.uk/proactive/belford/
Annex A – Runoff Attenuation Features Handbook, Newcastle University and the Environment
Agency 2011
Annex B – Hepscott Flood risk Study Report, Royal Haskoning, July 2011
Annex C – Powburn Flood Risk Study Report, Royal Haskoning, November 2011
Annex D – Flood Mitigation Features in two Northumberland Catchments Catchment Assessment
and Development of Rating Curves, I. Franzen MSc project, 2012.