Embed Size (px)
Citation preview

NASA / TM-2000-210122
Potential Subjective Effectiveness of Active
Interior Noise Control in Propeller
Airplanes
Clemans A. Powell and Brenda M. Sullivan
Langley Research Center, Hampton, Virginia
May 2000
https://ntrs.nasa.gov/search.jsp?R=20000057338 2018-05-17T15:03:53+00:00Z

The NASA STI Program Office ... in Profile
Since its founding, NASA has been dedicated to
the advancement of aeronautics and spacescience. The NASA Scientific and Technical
Information (STI) Program Office plays a keypart in helping NASA maintain this importantrole.
The NASA STI Program Office is operated by
Langley Research Center, the lead center forNASA's scientific and technical information. The
NASA STI Program Office provides access to theNASA STI Database, the largest collection of
aeronautical and space science STI in the world.The Program Office is also NASA's institutional
mechanism for disseminating the results of itsresearch and development activities. These
results are published by NASA in the NASA STI
Report Series, which includes the following
report types:
TECHNICAL PUBLICATION. Reports of
completed research or a major significant
phase of research that present the results ofNASA programs and include extensive
data or theoretical analysis. Includescompilations of significant scientific andtechnical data and information deemed to
be of continuing reference value. NASA
counterpart of peer-reviewed formalprofessional papers, but having less
stringent limitations on manuscript lengthand extent of graphic presentations.
TECHNICAL MEMORANDUM. Scientific
and technical findings that are preliminary
or of specialized interest, e.g., quick release
reports, working papers, andbibliographies that contain minimalannotation. Does not contain extensive
analysis.
CONTRACTOR REPORT. Scientific and
technical findings by NASA-sponsoredcontractors and grantees.
CONFERENCE PUBLICATION. Collected
papers from scientific and technical
conferences, symposia, seminars, or other
meetings sponsored or co-sponsored byNASA.
SPECIAL PUBLICATION. Scientific,
technical, or historical information from
NASA programs, projects, and missions,
often concerned with subjects havingsubstantial public interest.
TECHNICAL TRANSLATION. English-
language translations of foreign scientific
and technical material pertinent to NASA'smission.
Specialized services that complement the STI
Program Office's diverse offerings includecreating custom thesauri, building customized
databases, organizing and publishing research
results ... even providing videos.
For more information about the NASA STI
Program Office, see the following:
• Access the NASA STI Program Home Page
at http'//www.sti.nasa.gov
• E-mail your question via the Internet [email protected]
• Fax your question to the NASA STI HelpDesk at (301) 621-0134
• Phone the NASA STI Help Desk at(301) 621-0390
Write to:
NASA STI Help DeskNASA Center for AeroSpace Information7121 Standard Drive
Hanover, MD 21076-1320

NASA / TM-2000-210122
Potential Subjective Effectiveness of Active
Interior Noise Control in Propeller
Airplanes
Clemans A. Powell and Brenda M. Sullivan
Langley Research Center, Hampton, Virginia
National Aeronautics and
Space Administration
Langley Research CenterHampton, Virginia 23681-2199
May 2000

The use of trademarks or names of manufacturers in the report is for accurate reporting and does not constitute anofficial endorsement, either expressed or implied, of such products or manufacturers by the National Aeronautics
and Space Administration
Available from:
NASA Center for AeroSpace Information (CASI)7121 Standard Drive
Hanover, MD 21076-1320
(301) 621-0390
National Technical Information Service (NTIS)5285 Port Royal Road
Springfield, VA 22161-2171(703) 605-6000

Summary
Active noise control technology offers the potential for weight-efftcient
aircraft interior noise reduction, particularly for propeller aircraft. However,
there is little information on how passengers respond to this type of interior noise
control. This paper presents results of two experiments which used sound quality
engineering practices to determine the subjective effectiveness of hypothetical
active noise control (ANC) systems in five different propeller airplanes. Binaural
recordings were made of the sounds inside the airplanes at passenger head
positions under typical steady flight conditions. Digital filtering and reduction of
the propeller tones at blade passage frequency and higher harmonics provided
simulations of hypothetical reductions in interior sound levels which could be
obtained with active noise control systems. The original recordings and
simulated active noise control sounds were presented to the test subjects using
electrostatic headphones to preserve the realism of the airplane interior sounds.
The two experiments differed by the type of judgments made by the subjects: pair
comparisons based on preference in the first and numerical category scaling of
noisiness in the second. Although the results of the two experiments generally
showed that the hypothetical active control measures improved the interior noise
environments, the pair comparison method appears to be more sensitive to subtle
changes in the characteristics of the sounds which are related to passenger
preference. Subject preference increased with decreases in the level of propeller
tones and with increases in the number of tones reduced by the simulated ANC
conditions. The subjective effectiveness of the simulated ANC conditions was
highly dependent on the spectral content and relative levels of the tonal and
broadband components in the original airplane interior sounds. However, the
reductions in subjective response due to the ANC conditions were predicted with
reasonable accuracy by reductions in measured loudness level. Inclusion of
corrections for the sound quality characteristics of tonality and fluctuation
strength in multiple regression models improved the prediction of the ANC
effects.
Introduction
The National Aeronautics and Space Administration currently is conducting a research program in
aircraft interior noise reduction for commercial transport, business and general aviation airplanes and
rotorcraft. As part of this activity, a program has been initiated to address passenger response to the
interior noise of these aircraft. The goal of the activity is to develop tools that are responsive to passenger
preference and can be used to guide design decisions for interior noise treatments. The ideal tool would
be a passenger response model with a metric or scale that adequately accounts for all of the many
characteristics of cabin noise for a wide range of aircraft. The designers or noise control engineers could
then use this model to insure that changes in the noise characteristics would be reflected by appropriate
changes in passenger acceptance or preference. Such a model would thereby provide guidance towards
the necessary compromises between weight, costs and treatment effectiveness.
Several investigations on passenger response to aircraft cabin noise were conducted in the mid 1970s,
(refs. 1, 2, and 3). These studies concluded that since common noise metrics were so highly correlated
with each other, none of the metrics could be clearly identified as being a substantially better predictor of
passenger satisfaction. In reference 3, however, it was found that summing contributions from different
sound sources provided improvement over models that considered the noise as a whole with only a single
metric. More recent studies (ref. 4 and 5) have used simulated interior noise with both broadband and
tone components. In reference 4, it was found that the tone correction in the metric which is used to
certify aircraft for community noise was ineffective in predicting subjective response to sounds that
contained audible tones in combination with broadband interior sounds. In reference 5, however, it was

found that a model combining loudness (ref. 6) and tonality (ref. 7) predicted subjective annoyance betterthan either unweighted or A- weighted sound level.
Active noise control offers the potential of very weight-efficient aircraft interior noise reduction,particularly for propeller aircraft. The interior noise of a propeller airplane is usually dominated by tonalcomponents resulting from acoustic loads on the fuselage from the propeller(s) and from structurallytransmitted vibration from the engine(s). These include components at the blade passage frequency(BPF), at multiples of the BPF, and occasionally at subharmonics of the BPF and multiples of thosesubharmonics. The number and relative amplitudes of these components in the interior sound field varyconsiderably between different airplanes and determine the general character of the interior noise. Anappropriately designed active noise control system can significantly reduce the sound level of the lowestof these components. However, there is neither a validated model nor a sufficient experimental databasefor predicting how passengers would respond to this type of interior noise control. The two experimentsdescribed in this paper were conducted to determine the subjective effectiveness of hypothetical activenoise control (ANC) systems in a range of propeller airplanes.
Recently, an experimental test technique commonly referred to as "Sound Quality (SQ) Engineering"has been used to determine the sound characteristics of automobile interiors and consumer products whichare preferred by customers (ref. 8 and 9). A number of metrics have been developed for quantifying theeffects that acoustic characteristics have on people's response and preference to different sounds. Suchcharacteristics include loudness (ref. 6), tonality (ref. 10), sharpness (ref. 11), roughness (ref. 12), andfluctuation strength (ref. 13). The SQ technique typically uses an acoustic mannequin, with microphoneslocated at the entrance of the ear canals, and a digital audio recorder (DAT) to record sounds in which thebinaural amplitude and phase characteristics of the sounds as presented to the human auditory system arepreserved. These sounds, as recorded or after some manipulation, are then played back to human testsubjects using very high quality stereo headphones. Through this process, the spatial and temporalcharacteristics of the sounds as heard in situ are largely preserved, thus providing an auditory realism thatis not ordinarily achieved in laboratory listening tests. An additional benefit of this type of subjectivetesting is that multiple test subjects can be simultaneously exposed to acoustic stimuli that are morenearly the same than can be achieved in a reverberant or anechoic laboratory facility using loudspeakers.The experiments to be described in this paper used the binaural presentation and some of the other SQpractices to maintain realism and to reduce variability in sounds presented to the test subjects. In addition,this methodology was expected to enhance the discrimination of sound characteristics that affect humanresponses such as annoyance and preference of one sound over another.
The sections to follow will describe the facility and equipment, the experimental design and testprocedures, and the data analysis methods for two experiments which were conducted to quantify changesin sounds representative of the application of active noise control systems in propeller airplanes. Theprimary difference between the two experiments is that in the first the subjects indicated their preferences,if any, for the ANC sounds over the original uncontrolled sounds, whereas in the second the subjects ratedthe noisiness character of the sounds. The magnitude of the subjective effects and correlation withchanges in the measured physical characteristics of the sounds will also be discussed. In addition,differences between the results of the two tests and findings relative to the application of previouslydefined sound quality metrics to the propeller airplane interior sounds will be presented.
Abbreviations and Symbols
A/C
AL
ANC
BPF
CESL
DAT
Aircraft
A-weighted sound level (ref. 14), dB
Active noise control
Blade passage frequency
Corrected equivalent subjective level, dB or phon
Digital audio tape recorder
2

DL
ESL
fo
FS
Ls
EL
L_
LLz
LLMa
R
S
1L
1R
SQ
SPL
T
A
D-weighted sound level (ref. 14), dB
Equivalent subjective level, dB or phon
Propeller tone fundamental frequency, Hz
Fluctuation strength (ref. 13), vacil
Binaurally summed level, dB or phon
Level of sound presented to left ear, dB or phon
Level of sound presented to right ear, dB or phon
Loudness level calculated using the procedures of Zwicker (ref. 6), phon
Loudness level calculated using the procedures of Moore and Glasberg (ref. 15), phon
Roughness (ref. 12), asper
Sharpness (ref. 11), acum
Loudness of sound presented to left ear, sone
Loudness of sound presented to right ear, sone
Sound quality
Sound pressure level
Tonality (ref. 10)
Difference in the quantity that follows the A symbol
Experimental Method
Test Facility
An aircraft interior simulator, which
uses interior trim and seats from Boeing727, 737 and 757 airplanes to provide thevisual ambiance of a aircraft interior, was
assembled in an acoustically isolated roomwithin the NASA Langley AcousticsResearch Laboratory. A photograph of thesimulator is shown in figure 1. Thesimulator is approximately 24 feet long and11.5 feet wide and provides tourist classseating for 45 passengers. Noise stimuli forthe subjective judgment tests were presentedto the test subjects through electrostaticheadphones to preserve the directivity andspatial information afforded by the binauralrecording system.
Figure 1. Aircraft interior simulator test facility.

AcousticRecording,Presentation,Analysisand SafetySystem
A schematic diagram of the system used to record and modify the noise stimuli, to present the stimulito the test subjects and to ensure that excessive noise levels are not presented to the test subjects is shownin figure 2. Sound recordings were made with a commercially available binaural recording system insidethe cabins of five propeller driven airplanes. Details of these recordings will be presented in the nextsection. The sounds were recorded on a digital audio tape recorder (DAT). A computer workstation wasused to process the digital representations of the recorded sounds. Commercially available sound qualityanalysis software was used to calculate a wide range of conventional noise metrics and sound quality(SQ) metrics. Modifications to simulate the hypothetical ANC conditions from the original recordedinterior sounds were also performed with the sound quality analysis software. In-house developedsoftware was used to control the level, timing and sequence of the stimuli for playback to the test subjects.The digital representations of the stimuli were converted to analog electrical signals by the computer
Recording
maCn°U" q iuCn II
Ic .U:• c2annZISound quality analysis
and stimulus modification
software
"o_ :icpL:)li
Figure 2. Schematic diagram of the binaural acousticrecording, analysis, presentation and safety system.
workstation and passed through alimiter circuit to a series of electrostatic
headphone amplifiers and finally to sixsets of very high quality electrostaticheadphones. Five sets of headphoneswere used to present the stimuli to thetest subjects. The sixth set waspositioned on an acoustic mannequin,the microphones of which wereconnected to sound level meters. The
sound level meters were programmed tooutput a trip indication signal if anacoustic signal from either the left orright ear channel exceeded a preset A-weighted sound level (AL). The tripindication signals were fed to the dualchannel limiter that terminates the inputto the headphone amplifiers uponreceipt of a trip signal. The testprotocol for human testing in thelaboratory requires that the sound levelnot exceed an AL of 95 dB.
Noise Stimuli
Stimuli preparation. Recordings made in five different propeller airplanes during cruise operationswere used to create modified stimuli with spectra approximating sounds that could be achieved by ANCtechnology with three levels of sophistication and three levels of effectiveness. The five propellerairplanes were:
A/C 1.
A/C 2.
A/C 3.
A/C 4.
A/C 5.
single turboprop engine, 15 passenger cargo
twin turboprop engine, 7-10 passenger business
single 4-cylinder piston engine, 4 place general aviation
twin turboprop engine, 30 passenger commuter
single 6-cylinder piston engine, 6 place general aviation
4

TheSQsoftwarewasusedto modifythedurationandpropellertonecontentoftheoriginalsoundrecordingsto producethehypotheticalANCstimuli.A recordingmadein atwinengineconventionaljettransportairplaneduringcruisewasusedto createcomparisonandreferencestimulifor thetwotests.Thissoundconsistedof broadbandboundarylayerandenginejet noisewithnodiscernabletonecontent.Eachstimulushadariseandfall timeof0.3secandatotaldurationof 3.6sec.
Tone modifications. The range of propeller tone reductions for the hypothetical ANC treatments isshown in figure 3. The modified spectra for each airplane type were obtained by reducing the levels oftonal components within each signal by amounts indicated in the graph. Three levels of reduction (7 dB,
21
Component 14level
reduction,dB 7
0
Number of tonsl components
• ,• •_._ -
4 8 12 16Multlplo of propoller fundamental
Figure 3. Number and reductions in level of contolled tonalcomponents.
14 dB and 21 dB) for the fundamentalpropeller tone of each aircraft were selectedto represent the effectiveness of hypotheticalANC systems. For all aircraft except A/C 5,the blade passage frequency (BPF) waschosen as the propeller tone fundamentalfrequency, fo. For A/C 5, one-half the BPF(54 Hz) was chosen to be the fundamentalfrequency, since a strong tone which existedat 1.5 times the BPF would not be affected
by reductions of multiples of the BPF.
Three numbers of harmonics (3, 7 and 15multiples of the fundamental) were reducedin the ANC stimuli to represent thecomplexity of the ANC systems. Theselevels and numbers of harmonics affected
resulted in nine modified spectra for each airplane type. The level of reduction for each tonal componentabove fo decreased linearly with the multiplier of fo. Reductions in sound levels for tone components inthe spectra with 3 components controlled are given in figure 3 by the solid black symbols on the straightlines. Reductions in components for spectra with 7 components controlled are given by the solid andshaded symbols. Reductions in components for spectra with 15 components controlled are given by allthe symbols on the line. A-weighted, 1/24-octave spectra of the original and most modified stimuli foreach airplane type are given in appendix A. The spectrum for the jet noise stimulus is also given inappendix A.
Acoustic analysis. A computer workstation and commercially available software were used todetermine the acoustic characteristics, in terms of conventional and SQ noise metrics, of the stimuli usedin both tests. Table 1 presents a summary of results from these analyses in terms of unweighted soundpressure level (SPL), A-weighted and D-weighted sound levels (AL and DL, ref.14), and two variationsof loudness levels (LLz and LLMa). LLz is normally referred to as the Zwicker Loudness Level and hasbeen incorporated into an international standard (ref. 6). LLMa is a more recent development by Mooreand Glasberg (ref. 13) to more accurately reflect the loudness of partially masked sounds and changes inloudness with level and frequency. In table 1, levels are presented for the original propeller airplaneinterior sounds and for the ANC sounds with the greatest reduction in number and level of the tones. Forthe conventional jet airplane interior sound, only a single level of presentation is presented. A full listingof levels for all propeller airplane stimuli are given in appendix B. Sounds presented at more than onelevel, such as the jet airplane interior sound and the original uncontrolled sounds, which were used ascomparison and reference sounds, are represented in the table by only a single level. The levels presentedin table 1 and appendix B were based on the signals presented over the headphones to each ear of the testsubjects as measured with the acoustic mannequin, computer workstation, and commercial analysissoftware, except for LLMa which was computed from one third octave band levels calculated from thecomputer sound file. For the two loudness metrics, the loudness in sones was summed across left andright ears, and converted to phons. These values are presented in the table as combined sones.
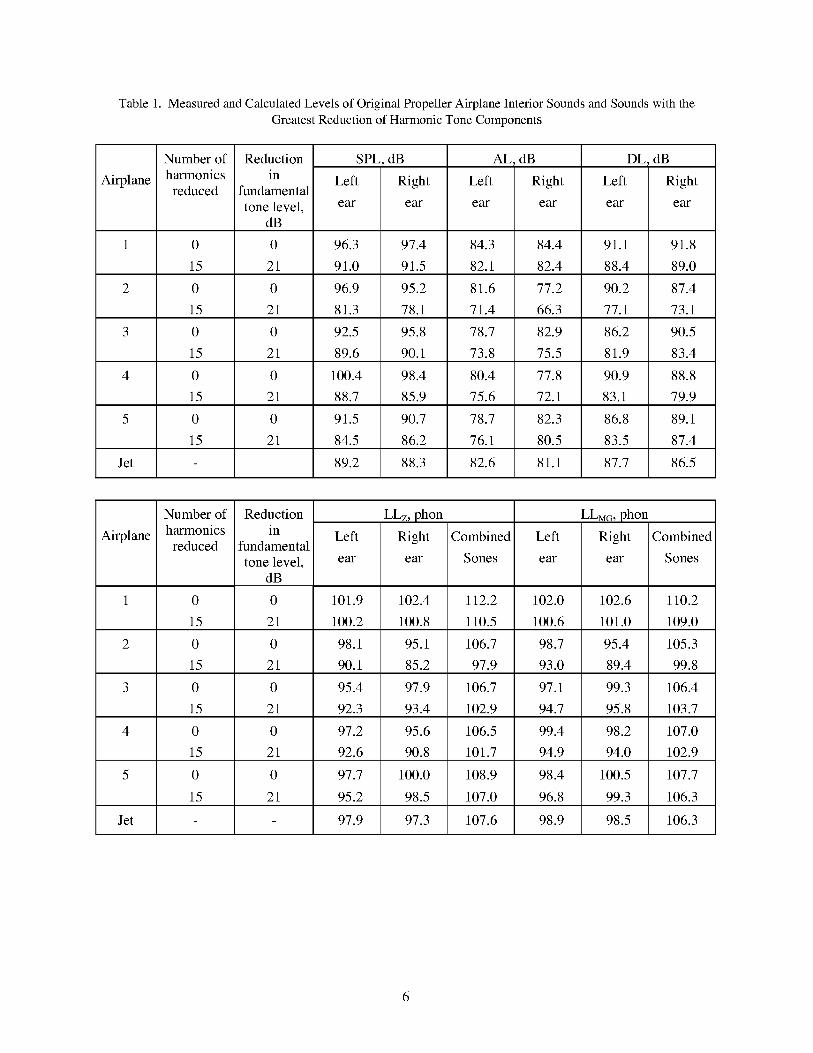
Table 1. Measured and Calculated Levels of Original Propeller Airplane Interior Sounds and Sounds with the
Greatest Reduction of Harmonic Tone Components
Airplane
Number of
harmonics
reduced
Reduction
Left
ear
SPL, dB AL, dBin
fundamental
tone level,dB
DL, dB
Left Right
ear ear
96.3 97.4
91.0 91.5
96.9 95.2
81.3 78.1
92.5 95.8
89.6 90.1
100.4 98.4
88.7 85.9
91.5 90.7
84.5 86.2
89.2 88.3
Left Right
ear ear
84.3 84.4
82.1 82.4
81.6 77.2
71.4 66.3
78.7 82.9
73.8 75.5
80.4 77.8
75.6 72.1
78.7 82.3
76.1 80.5
82.6 81.1
Right
ear
1 0 0 91.1 91.8
15 21 88.4 89.0
2 0 0 90.2 87.4
15 21 77.1 73.1
3 0 0 86.2 90.5
15 21 81.9 83.4
4 0 0 90.9 88.8
15 21 83.1 79.9
5 0 0 86.8 89.1
15 21 83.5 87.4
Jet - 87.7 86.5
Airplane
Number of
harmonics
reduced
Reduction
in
fundamental
tone level,dB
Left
ear
LLz, phon
Right
ear
Combined
Sones
Left
ear
LLMa , phon
Right
ear
Combined
Sones
1 0 0 101.9 102.4 112.2 102.0 102.6 110.2
15 21 100.2 100.8 110.5 100.6 101.0 109.0
2 0 0 98.1 95.1 106.7 98.7 95.4 105.3
15 21 90.1 85.2 97.9 93.0 89.4 99.8
3 0 0 95.4 97.9 106.7 97.1 99.3 106.4
15 21 92.3 93.4 102.9 94.7 95.8 103.7
4 0 0 97.2 95.6 106.5 99.4 98.2 107.0
15 21 92.6 90.8 101.7 94.9 94.0 102.9
5 0 0 97.7 100.0 108.9 98.4 100.5 107.7
15 21 95.2 98.5 107.0 96.8 99.3 106.3
Jet - 97.9 97.3 107.6 98.9 98.5 106.3
6

Experiment Design
Preference test. The first test was conducted using the paired comparison method. To determine thesubjective effectiveness of the ANC treatments relative to changes in measured noise characteristics andlevels for each aircraft type, the noise stimulus with the original spectrum was used as the standard orreference stimulus for the modified (target) stimuli. The presentation levels used for the target stimuliwere those that would have occurred in flight had the hypothetical ANC treatments been achieved inpractice. For each target stimulus, the loudness level, LLz, was determined. Each target stimulus wascompared with the reference stimulus presented at levels -6, -2, +2 and +6 dB relative to thislevel.Similarly, to determine the subjective differences in level between the original stimuli for all aircrafttypes, the interior noise of the commercial jet aircraft was used as a reference stimulus for comparisonwith the original stimulus of each propeller aircraft type, when presented at its recorded level. A total of200 pairs of sounds was required to cover all conditions. The pairs were randomly assigned to 4 sessionsof 50 pairs. An additional set of 4 sessions was prepared which had the order of pairs in the sessions andthe order of stimuli within each pair reversed to provide balance in presentation order of pairs withinsessions and A-B and B-A orders of presentation for the target and reference stimuli. Time betweenstimuli in a pair was one second and time between pairs was 5 seconds. Subjects were tested in groups offive, four groups exposed to the four original sessions and four groups exposed to the reverse ordersessions. The order of presentation of the sessions was balanced across the groups. The subjects wereasked to "indicate which member of the pair you preferred" by circling A or B on a response score sheet.An example score sheet is given in appendix C.
Noisiness test. The second test was conducted using the numerical category scaling method. Thetest subjects made noisiness judgments on the same set of ANC and original stimuli presented at the samelevels as the target stimuli in the first test, a complete repeat of the set at those levels and complete repeatspresented at three additional loudness levels. In addition, the same jet aircraft interior noise as in the firsttest was presented at 10 levels over a range of loudness levels slightly exceeding the range of loudnesslevels of all the propeller aircraft interior noises. These 260 stimuli were randomly assigned to foursessions of 65 stimuli each. An additional set of 4 sessions was prepared which had the order of stimuliin the sessions reversed to provide balance in presentation order. As in the first test, subjects were testedin groups of five, four groups exposed to the four original sessions and four groups exposed to the reverseorder sessions. The order of presentation of the sessions was also balanced across the groups. Thejudgments were made on a graphical scale with equal intervals labeled 0 to 10. The subjects were askedto "indicate how noisy you judge the sounds to be by placing a slash mark along the scale". Arrows on
the scale indicated the "Less noisy" and "More noisy" directions of the scales. An example score sheetis given in appendix D.
Test Subjects
Eighty test subjects, 40 for each experiment, were randomly selected from a pool of local residentswith a wide range of socioeconomic backgrounds, and were paid to participate in the experiments. Allsubjects were given audiograms prior to testing to verify normal hearing, i.e. within 40dB of ISOthreshold values.
Preference Test. Fourteen of the subjects were males, age range 18-65 years with a mean age of 33.1years. Twenty-six were females, age range 18-65 with a mean age of 33.9 years. Thirty-three of thesubjects had flown in airplanes and 17 had flown in propeller airplanes within the previous 10 years.
Noisiness test. Sixteen of the subjects were males, age range 18-66 years with a mean age of 30.2years. Twenty-four were females, age range 19-72 with a mean age of 47.5 years. Only one of the

femalesand4 of themaleshadparticipatedin thepreferencetest.Thirty-sixof thesubjectshadflowninairplanesand18hadflowninpropellerairplaneswithintheprevious10years.
Test Procedures
Very similar procedures were used for both tests. Upon arrival at the laboratory a group of testsubjects was escorted into the aircraft interior acoustic simulator and seated. The test conductor then gaveeach subject a clipboard with a set of general instructions and information, consent forms, specificinstructions and scoring sheets. After reading the general instructions and information, the safety featuresand procedures of the simulator were described and the subjects were requested to sign the voluntaryconsent form. The test conductor then described the specific test procedures and method of respondingon the scoring sheets, and helped the subjects in placing and adjusting the headphones for a good fit. Thesubjects heard a sample of five of the sounds used in the test and then responded to a short practice test ofeither six pair of sounds for the preference test or six individual sounds for the noisiness judgment test.After the practice session the test conductor again asked if there were any questions and then left thesubjects to begin the first session. Each session lasted 10 to 12 minutes. To help the subjects keep trackof the stimuli presented, voice cues were given over the headphones before the presentation of the firstand each succeeding fifth pair of stimuli (preference test) or individual stimulus (noisiness test).Complete instructions and scoring sheets are given in appendix C for the preference test and in appendixD for the noisiness test.
Subjective Response Conversions
In the following sections the procedures used to convert the preference and noisiness judgements intoan ordinal scale with decibel like properties are described. The regression analyses used for theconversions and all other statistical analyses for this report were conducted using the commerciallyavailable statistical analysis package, SPSS for Windows TM.
Preference judgments: The paired comparison responses were converted to percentage of subjectspreferring the target ANC stimuli (modified spectra) to the comparison (original unfiltered) stimuli.Equivalent subjective levels (ESL), for each aircraft type and ANC condition and for each metric, were
Percentage ofjudgements
preferring targetstimulus
100
75
50
25
Logit curve
/ I Equivalent subjective level
/ I ESL = 102.0 phon
0 0o . :. ........95 100 105 110
Loudness level of comparison stimulus, phon
Figure 4. Use of logit regression analysis to convert preferencejudgements to equivalent subjective levels (ESL).
determined by calculating the levels atwhich 50% preferred the ANCstimulus. This was accomplishedusing logit regressions of the percentpreferring the ANC stimulus on themeasured levels of the comparisonstimuli as indicated in figure 4. Forone target stimulus, each of the fourdata points indicates the percentage ofjudgements preferring the target(ANC) stimulus over the comparison(original spectrum) stimulus when thecomparison stimulus was presented atone of the four loudness levels. A
logit regression analysis wasconducted for the set of data for each
aircraft type and ANC condition, foreach noise metric considered. From
these analyses the level of thecomparison was calculated for which
therewasequallikelihoodthattheANCstimulusor thecomparisonwouldbepreferred.Thislevelwasconsideredtobe theequivalentsubjectivelevel,ESL,of eachANCstimulus.SinceeachANCstimuluswascomparedonly with its originalunmodifiedsound,it wasnotpossibleto comparetheESLvaluesdirectlyfor thedifferentaircraft.Howeversimilaranalysesweremadeforthedatasetswheretheoriginalstimuliwerecomparedto theconventionaljet aircraftinteriorsound. TheseESLvaluesprovidedameansof directlycomparingtheoriginal soundsof the differentaircraft,andan indirectmeansofcomparingallsoundaswill bedescribedina latersection.
Noisiness judgments: In the second test, the mean of the judgements over subjects and repeats foreach stimulus was calculated. The mean noisiness judgements of the ANC stimuli were converted to ESLvalues based on the mean noisiness judgements of the conventional jet aircraft stimuli. For each noise
Mean noisiness
judgement
10
8 JMean noisiness judgement
46 exam__pl_
o,f I Equivalent subjective level2 _ ' ESL = 96.5 phon
-_ I
0 , , , , I , , , , I , , , , I ,_| , , I , , , , I , , , , I
80 85 90 95 100 105 110
Loudness level of jet airplane stimulus, phon
Figure 5. Use of polynomial regression analysis of loudness onmean noisiness for the jet aircraft interior sounds to determineequivalent subjective levels for the ANC sounds.
metric, a least-squares third orderpolynomial regression was made ofthe measured levels of the ten jetstimuli on the mean noisiness
judgements of the jet stimuli. Anexample for Zwicker loudness level isshown in figure 5. For each ANCstimulus, the mean noisinessjudgement was transformed into anESL value using the regressionequation found in the polynomial fit.In the example shown in figure 5, amean noisiness judgement of 5.8corresponds to an ESL of 96.5 phons.Thus an ANC stimulus that received a
mean noisiness judgement of 5.8 wasdeemed to have a perceived noisinessequivalent to the jet aircraft interiorsound at an LLz of 96.5 phons.
Results and Discussion
Preference Test
Since the primary objective of the study was to determine the benefits or subjective reductions ininterior noise afforded by the hypothetical reductions in propeller tones, it was necessary to examine thedifferences between the ESL of each ANC sound and the ESL of the original or unmodified sound. TheESL of the original sound is assumed to be the same as its measured level. For a given modified stimulusthe difference in equivalent subjective level is given by
AESL = ESL(ANC sound) - ESL(original sound) (1)
and is dependent on which metric is used to describe the ESLs. Linear regression analyses of AESL wereconducted on the difference between the measured levels of the modified (ANC) stimuli and the originalstimuli for several different sound level metrics. Results of these analyses are given in table 2 for themetrics: unweighted sound pressure level (SPL), A-weighted sound level (AL), D-weighted sound level(LD), loudness level using the Zwicker calculation method (LLz) (ref. 6), and loudness level as morerecently proposed in reference 15 (LLMa). These analyses also considered four methods of combining thelevels presented to the two ears of the subjects, i.e., binaural summation.
9

The arithmetic average method is the simple average of the dB or phon levels presented to the twoears
1 LLs(average) = "_( L + LR) (2)
where Ls is the combined level, LL is the level presented to the left ear, and LR is the level presented to the
right ear.
The energy summation method adds the relative acoustic power or energy presented to the two ears
and converts the resultant to a sound level by the relationship
Ls(energy) = 101ogl0(10LL/10 + 10LR/10) (3)
The pressure summation method adds the weighted acoustic pressure presented to the two ears andconverts the resultant to a sound level.
10LL/20L s (pressure) = 20 log10 + 10 LR/20)(4)
The loudness summation method adds the loudness, in sones, at the two ears and converts the
resultant to a loudness level in phons. For LLz, the conversion formula is
L s (loudness) = 40 + 10log 2 (1L + 1R) (5)
where 1L and 1R are the loudness of the sound in sones presented to the left and right ears, respectively.
For LLMa,, the conversion is performed from a table look-up procedure. Only the two loudness levelmetrics could be combined in this manner.
Table 2 Coefficients of Determination (Square Of Correlation Coefficients) for AESL and Measured Level for
Various Metrics; Preference Judgements
Binaural
summation
method
Arithmetic average
Energy summation
Pressure summation
Loudness summation
(Combined Sones)
Noise metric
SPL, AL, DL, LLz, LLMG ,
dB dB dB phon phon
0.654 0.878 0.838 0.893 0.864
.671 .858 .846 .898 .864
.663 .869 .843 .896 .865
.895 .869
10

The analysesin table2 indicatedthatdifferencesin equivalentsubjectivelevelwere slightly more correlated withdifferencesin measuredLLz than withchangesin AL or anyof theothermetricsconsidered.Becauseof this performanceandsincethismethodof loudnesspredictioniscalculatedby aninternationalstandard,theresultsin the following sectionswill bedescribedprimarilyin termsof ALLz Thearithmeticaveragemethodwas found toprovideslightly lowercorrelationthantheothersummationmethodsfor mostmetrics.Very little differencein correlationwasfound for the other summationmethods.This result is not unexpectedsince thesoundspresentedto thetwoearsdifferedbyonly 1 to 2 dB, exceptfor A/C 2. Theloudnesssummationmethodis generallyacceptedasbeingappropriateto accountforbinaural loudnesssummation(ref. 13).However, there is someevidence thatbinauralloudnesssummation,particularlyathigh sound levels, may be less thancomplete,i.e., the loudnessof the samesoundpresentedatequallevelsto bothears
Differencein
equivalentsubjective
level,phon
0
-2
-4
-6
-8
-10
-12
-14-14
//
o A/C1
[] A/C2
O A/C3
Z_ A/C4
V A/C5
,/,/
/[]
/// /
/°
O
/IA"
7r2 = 0.895
A ESL= 0.0 + 1.21ALL z
-12 -10 -8 -6 -4 -2
Difference in loudness level, phon
Figure 6. Reductions, based on preference judgments, in
equivalent subjective levels of the propeller aircraftinterior sounds provided by the hypothetical ANC
conditions as compared with measured loudness levelreductions.
appears somewhat less than twice as loud as when presented to either ear alone. Such a small effect
would not be expected to significantly affect the results of the present study. Therefore the results in the
following section will be described in terms of loudness summation and will be designated in tables ascombined sones.
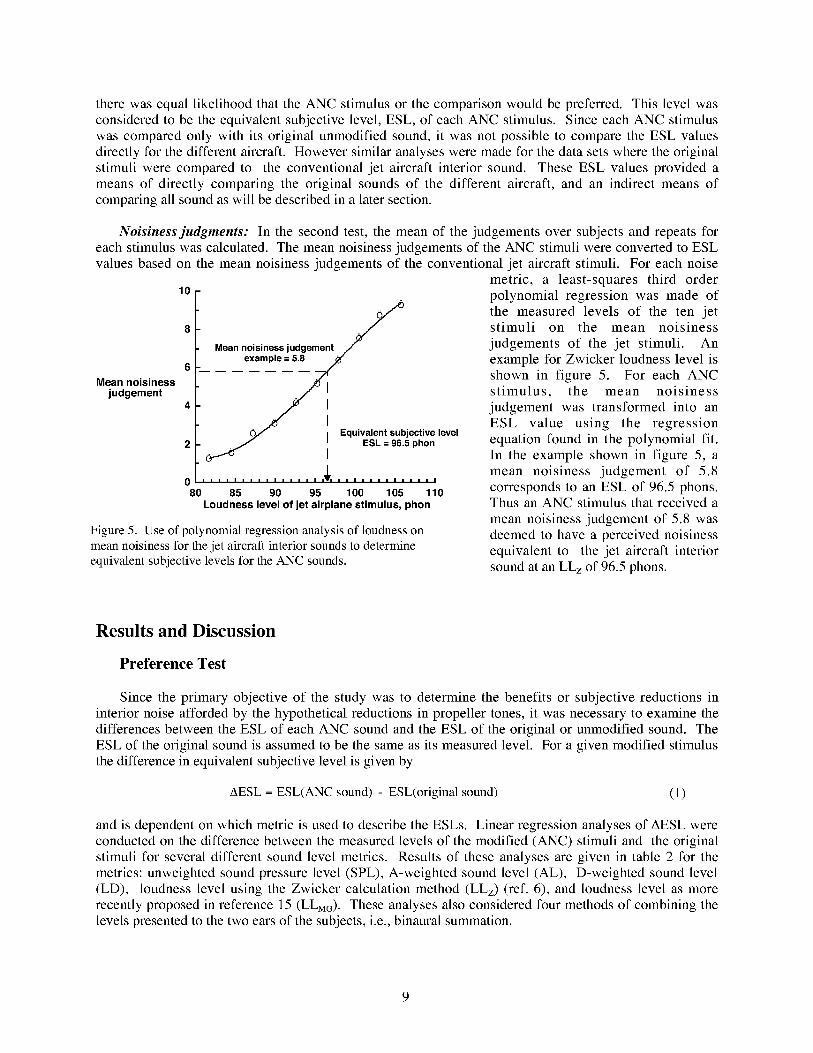
Effects of ANC conditions. The changes in equivalent subjective level and in LLz with changes in
harmonic content associated with the hypothetical ANC conditions are given in table 3. There is a
generally consistent trend for an increase in preference (decrease in AESL) with an increase in attenuationof the level of the tones and with an increase in the number of harmonics reduced. The effectiveness of
the reductions in tones was greatest for A/C 2 and least for A/C 1 and A/C 5. These results are not
unexpected since it is very apparent from the figures in appendix A that the low frequency tones dominate
the A-weighted spectrum of A/C 2 but are comparable to components in the 400 Hz to 1000 Hz range forA/C 5.
Correlation of ANC effects with objective measures. Differences in equivalent subjective level
associated with the differences in loudness level, LLz, for the hypothetical ANC conditions are shown in
figure 6. The maximum reduction in LLz for A/C 1 was 1.8 phon; for A/C 5, 1.9 phon; for A/C 4, 4.8
phon; for A/C 3, 3.8 phon; arid for A/C 2, 8.8 phon. While the equivalent subjective level differences for
A/C 1 and A/C 5 are comparable to the measured differences in loudness level, the equivalent subjective
differences for the other aircraft and particularly for A/C 2 were somewhat greater than the measured
differences in loudness level. This is reflected by the slope determined in a linear least-squares regression
analysis of the differences in ESL on measured differences in LLz. This analysis yielded a slope of 1.2
phon of subjective change per phon of change in loudness level across all conditions and aircraft.
11
Table3. ChangesinEquivalentSubjectiveLevelswithReductioninHarmonicToneContent:PreferenceJudgments
Airplane Reductioninfundamental
tonelevel,dB
7142171421714217142171421
ALLz,dB-0.6-1.0-1.1-3.3-5.3-6.4-1.7-2.2-2.3-2.6-3.8-4.3-0.8-1.1-1.2
Numberofharmonicsreduced3 7 15
AESL,dB-0.3-2.2-1.0-2.9-5.2-6.2-1.5-1.9-3.9-3.3-4.5-5.3-0.2-1.9-2.2
ALLz,dB-0.8-1.2-1.4-4.0-6.8-8.3-2.2-3.1-3.5-2.8-4.1-4.6-1.0-1.4-1.6
AESL,dB-1.4-1.9-1.7-3.9-8.0-9.8-2.1-4.1-5.3-2.2-4.3-6.1-1.2-2.4-2.7
ALLz,dB-0.9-1.4-1.7-4.1-7.2-8.8-2.4-3.4-3.8-2.9-4.2-4.8-1.2-1.7-1.9
AESL,dB-0.8-2.2-2.1-3.2-8.8-12.6-1.8-5.3-6.9-2.7-4.8-6.3-1.5-2.1-2.0
Correlation of equivalent subjective level with objective measures. The regression analysis in the
previous section provided information only on the prediction of the effect of changes in the sounds from
their unmodified state and not on the ability to predict response to the individual stimuli across the
different aircraft. Based on the paired comparisons of the unmodified propeller aircraft interior noise
stimuli with the commercial jet aircraft interior noise stimulus, it was found that the response to the
different propeller aircraft interior sounds were underestimated by LLz by 0.6 phon to 4.5 phon relative to
the jet interior sound. Corrections for these under-estimations were made to the ESL values for each
modified propeller aircraft stimulus so that an overall prediction ability could be assessed.
Table 4. Coefficients of Determination (Square Of Correlation Coefficients) for CESL and Measured Level
for Various Metrics; Preference Judgements
Binaural
summation
method
Arithmetic average
Energy summation
Pressure summation
Loudness summation
(Combined Sones)
Noise metric
SPL, AL, DL, LLz, LLMG ,
dB dB dB phon phon
0.540 0.829 0.885 0.819 0.853
.534 .820 .884 .801 .848
.537 .825 .885 .810 .851
.814 .858
12

Table 4 presents the results of linearregression analyses of the correctedequivalent subjective level, CESL, onmeasured sound level for the differentmetrics and binaural summation methods.
Some differences in results of the analysesfor CESL are noted, as compared to theresults in table 2 for changes in subjectiveresponse with reductions in propeller tones.The highest correlations were found for DLand both LLM_ and LA were more highlycorrelated with CESL than was LLz.However, except for DL, the correlationsfor all metrics were less than those in table
2. The relationship and scatter for allcorrected equivalent subjective levels,CESL, with measured LLz are shown infigure 7. Except for A/C 4, loudness levelappears to predict the subjective loudnessfor all of the different propeller aircraftinterior sounds with reasonable accuracy.The deviations from the dashed line, whichrepresented perfect prediction, are generallyless than 2 phon for all aircraft except A/C4.
Corrected
equivalentsubjective
level,phon
114
112 .____
o A/C1110
[] A/C2
108 -- O A/C3
Z_ A/C4106
V A/C5
104
102100 Jr
98 j //96
/ r/
94 /"94 96 98 100
//
/ /
/,,o
o
o//
r2 = 0.814
ESL= 13.3 + 0.89LL z
102 104 106 108 110 112 114
Loudness level, phon
Figure 7. Correlation between corrected equivalentsubjective level and measured loudness level.Equivalent subjective levels have been corrected basedon differences between measured levels of the
unmodified propeller aircraft interior sounds andconventional jet interior sounds when they were equallypreferred. Filled sybols are for unmodified sounds.
Noisiness Test
It was anticipated that the inclusion of some of the other sound quality attributes of the stimuli, whichwill be considered later in this report, could reduce scatter and provide guidance on the prediction ofsubjective reactions to measured or predicted sound characteristics in a propeller airplane. However,since the correction factors were based solely on judgements of the unmodified sounds relative to the jetsounds, it is possible that one relatively large random error could bias the corrected equivalent subjectivelevels for all of the modified sounds of that aircraft type. Because of this potential bias, it was decided torun an additional test in which the equivalent subjective levels were determined directly. The use of thepaired comparison method presented two options for using preference between sounds as the subjectivecorrelate. Each sound could be compared with different levels of a single reference sound or each soundcould be compared with all of the unmodified sounds. It was thought that using a single reference sound,particularly the jet aircraft interior sound, could overemphasize the tonal quality of the propeller aircraftinterior sounds. As a consequence, the subjects could be biased towards less tone being preferableregardless of other characteristics of the propeller airplane interior sounds. The latter option was thoughtnot to introduce a bias but would require many more comparisons that could introduce significant testsubject fatigue or loss of diligence. The use of category scaling was thought to offer advantages over theoptions for pair comparisons in that testing time would not be increased and emphasis on tone level wouldbe minimized. It was not possible to use preference as the subjective scale, since it is a comparativedescriptor related to different conditions rather than one that could easily be used to describe a singlesound. It was hoped that the descriptor noisiness, which has frequently been used in subjective tests forsingle event aircraft community noises, would elicit an equivalent response due to the unwanted characterof the interior sounds as would preference. That is, a sound that was judged preferable to another soundwould also be judged less noisy.
The subjective results were examined in much the same way for the noisiness test as was done for thepreference test. The exception was that all of the ESL and CESL values were determined by comparing
13

the noisinessjudgementsof the propelleraircraft interior soundsagainstthe relationshipbetweenjudgementsandpresentedsoundlevelsof thejet aircraftinteriorsound.Thisprocedurewasdescribedintheprevioussectiononsubjectiveresponseconversion.
Effects of ANC condition. Table 5 presents results of linear least-squares regression analyses of thedifference in equivalent subjective level, AESL, on the difference in measured sound level between theoriginal propeller aircraft interior sounds and the ANC sounds for various metrics and binauralsummation methods. The differences for the two loudness measures, LLz and LLM_, were found to beslightly more correlated with differences in equivalent subjective levels than were the differences for thesimple frequency weighted measures, AL and DL, and considerably more correlated than the differencesfor the unweighted measure, SPL. In contrast to the results of the preference test, ALLM_ was found to beslightly more correlated than ALL> Little difference in results was found for the different binauralsummation methods. Since differences between the loudness calculation procedures and binauralsummation methods are so small and since LLz is an international standard, further results will bepresented primarily in terms of LLz using the loudness summation method.
Table 5. Coefficients of Determination (Square Of Correlation Coefficients) for AESL and Measured Level forVarious Metrics; Noisiness Judgements
Binauralsummation
method
Arithmetic average
Energy summation
Pressure summation
Loudness summation(Combined Sones)
Noise metric
SPL, AL, DL, LLz, LLMo,
dB dB dB phon phon
0.612 0.864 0.831 0.859 0.878
.630 .853 .846 .881 .883
.621 .860 .840 .871 .881
.867 .895
The changes in equivalent subjective level and changes in LLz with changes in harmonic contentassociated with the hypothetical ANC conditions for the noisiness test are given in table 6. There is agenerally consistent trend for a decrease in AESL with an increase in attenuation of the level of the tonesand with an increase in the number of harmonics reduced. The effectiveness of the reductions in tones
was greatest for A/C 2 and least for A/C 1 and A/C 5. The reductions in equivalent subjective level basedon noisiness are generally about the same or slightly less than the reductions in loudness level for thedifferent ANC conditions. This effect is examined more closely in the next section.
Correlation of ANC effects with objective measures. Based on the noisiness judgements, thedifferences in equivalent subjective level, associated with ALLz for the hypothetical ANC conditions areshown in figure 8. The maximum reduction in ALLz for A/C 1 was 1.7 phon; for A/C 5, 1.9 phon; forA/C 4, 4.8 phon; for A/C 3, 3.8 phon; and for A/C 2, 8.8 phon. While the equivalent subjective leveldifferences for A/C 3, A/C 4 and A/C 5 are comparable to the measured differences in loudness, theequivalent subjective differences for A/C 1 and particularly for A/C 2 were somewhat less than themeasured changes in loudness level. A linear least-squares regression analysis of the differences in AESLon ALLz yielded a slope of 0.78 phon of subjective change per phon of change in measured loudnessacross all conditions and aircraft. The deviation from unity slope resulted primarily from the results forA/C 2.
14

Table 6. Changes in Equivalent Subjective Levels with Reduction in Harmonic Tone Content:
Noisiness Judgments
AirplaneReduction in
fundamental
tone level, dB
7
14
21
7
14
21
7
14
21
7
14
21
7
14
21
ALLz, dB
-0.8
-1.2
-1.3
-3.3
-5.3
-6.4
-1.8
-2.3
-2.5
-2.6
-3.8
-4.3
Number of harmonics reduced
3 7 15
AESL, dB
-1.0
-0.9
-0.5
-2.4
-2.9
-4.2
-2.0
-2.4
-2.5
ALLz, dB
-0.8
-1.2
-1.4
-4.0
-6.8
-8.3
-2.2
-3.1
-3.5
-2.8
-4.1
-4.6
AESL, dB
-0.6
-1.1
-1.0
-2.6
-4.9
-7.5
-2.3
-4.1
-3.9
-3.1
-3.6
-4.9
-2.3
-4.4
-4.0
-0.8
-1.1
-1.2
-1.0
-1.4
-1.7
-1.0
-1.4-1.6
-1.1
-1.1
-2.1
ALLz, dB
-1.1
-1.6
-1.8
-4.1
-7.2
-8.8
-2.4
-3.5
-3.9
-2.8
-4.2
-4.7
-1.2
-1.8
-2.0
AESL, dB
-1.2
-1.0
-1.0
-3.3
-5.5
-7.4
-3.2
-3.6
-4.1
-3.2
-4.1
-4.5
-1.3
-2.1-1.6
Correlation of equivalent subjective level
with objective measures. Table 7 presents the
results of linear regression analyses, based on
the noisiness judgements, of the equivalent
subjective level on measured sound level forthe different metrics and binaural summation
methods. Some differences in results of these
analyses, as compared to the results in table 5for AESL, are noted. The correlations for all
metrics except SPL were higher for ESL thanfor AESL; the correlation for SPL was muchless for ESL than for AESL. As was found for
AESL, the highest correlations were for LLMa,
and both LLz and LA were more highlycorrelated with ESL than was DL. The
correlation between ESL and any of the
metrics was slightly greater for the arithmetic
average binaural summation than for the other
summation methods. Again, the differencesbetween the two loudness metrics and between
the binaural summation methods are small
enough to be of little practical significance.
Therefore only LLz and the loudness
summation procedure will be considered forfurther discussion of results.
Difference
in
equivalent
subjectivelevel,phon
0
-2
-4
-6
-8
-10
-12
/
/
-14 " •-14
_l_/A/C1
A/C2
O A/C3
A/C40 A/C5
//
/
t
r_r_
/ ,"/
• #/
/
/ r2 = 0.867
AESL= -0.4 + 0.78ALL z
-12 -10 -8 -6 -4 -2
Difference in loudness level, phon
Figure 8. Reductions, based on noisiness judgments, in
equivalent subjective levels of the propeller aircraft
interior sounds provided by the hypothetical ANC
conditions as compared with measured loudness levelreductions.
15

Table7. CoefficientsofDetermination(SquareOfCorrelationCoefficients)forESLandMeasuredLevelforVariousMetrics;NoisinessJudgements
BinauralsummationmethodArithmeticaverage
EnergysummationPressuresummation
Loudnesssummation(CombinedSones)
Noisemetric
SPL, AL, DL, LLz, LLMG,dB dB dB phon phon
0.376 0.953 0.892 0.966 0.981
.362 .946 .888 .956 .978
.369 .950 .890 .961 .980
.963 .982
The relationshipand scatterfor theequivalentsubjectivelevels,ESL, withmeasuredloudness,LLz, basedon thenoisinessjudgements,areshownin figure9. The explainedvariance(r2) of theregressionanalysisis 0.96andloudnesslevel appearsto predict the subjectiveloudnessof all of the differentpropelleraircraft interior soundswith reasonableaccuracy. The deviations from theregressionline andfrom the unity slope(dashed)line, are generallyless than2phonfor allaircraft.
Comparison of Preference andNoisiness Results
Examination of the results of the two
different tests indicated manyconsistencies but also several
inconsistencies. The inconsistencies could
either be due to the different test
Equivalentsubjective
level,phon
114
112
A/C1
11o r_ _c2 _'_ r108 -- O A/C3
106 -- (_ A/C 4 .a( ,"_'//,"
,0,
100 ,_4//
I98 -- r2 = 0.983 ....
/
96 / "/ 1 ESLi 10.8 + 0.91LL z ...." I I 194 "" " "
94 96 98 100 102 104 106 108 110 112 114
Loudness level, phon
Figure 9. Correlation between equivalent subjective levels,based on noisiness judgements and measured loudnesslevels.
methodologies, i.e., pair comparisons versus numerical category scaling, or could be due to differences in
response based on preference or noisiness. The following two sections will address the inconsistenciesbetween the two tests in more detail.
Relative preference and noisiness of original sounds. In the first test the only way to compare the
relative difference in preference for the interior sounds of the different aircraft types was indirectly
through comparisons of the unmodified propeller aircraft interior sounds with the jet aircraft interior
sound. In a previous section it was noted that the preference responses to the different propeller aircraft
interior sounds were underestimated by LLz by 0.6 phon to 4.5 phon relative to the jet interior sound. A
similar comparison was made based on the results of noisiness test. A comparison of the results from the
16

Relativesubjective
level,phon
-1
-2
5
4 [] Preference --
3 [] Noisiness __
2
0 _
1 2 3 4 5Aircraft
Figure 10. Subjective level of original airplane interior
sounds relative to Zwicker loudness level, LLz.
two tests is shown in figure 10. In the
preference test, all of the original propeller
interior sounds were judged less preferable than
the jet interior sound when presented at equal
values of LLz. In the noisiness test, the interior
sounds of aircraft 1 and 2 were judged slightly
less noisy than the jet interior sound for equal
LLz. While these relatively small differences
could be due to random error, the general trends
with aircraft type indicated in figure 10 are also
reflected in figure 9 for the original and
modified sounds. The ESLs for A/C 2 generally
lie below the regression line. Similarly the ESLs
for A/C 1 generally lie below the line but the
effect is not as pronounced. The ESLs in figure
9 for A/C 4, on the other hand, all lie somewhat
above the regression line. However, the subjects
in the preference test indicated that A/C 4 was
much less preferable than the other sounds. Thus it appears that the subjects are indicating that preference
may not be adequately represented by noisiness judgements.
Effects of ANC conditions. Comparisons
hypothetical ANC conditions for each of the
tests, the previously mentioned general trends
in the fundamental tone level,and with an increase in
number of tones reduced, are
readily apparent. The
smallest changes with the
ANC conditions, for both the
preference and noisiness test,occurred for A/C 1 and A/C
5. Reduction in tone level
had a slightly greater effect
on the preference judgements
than on the noisiness Change in
judgements. The number of equivalentsubjective
tones reduced appears to level,
have very small effects on phon
either type of judgement for
these two airplanes.Reduction in tone level had
larger effects on noisiness
and preference for A/C 3 andA/C 4 than for A/C 1 and
A/C 5. The magnitude ofthese effects was about the
same for A/C 3 and A/C 4.
However, the number of
tones reduced had a very
small effect on preference for
A/C 4 but a larger effect onA/C 3. Reduction in the
of the results for the two tests related to the effects of the
different aircraft types are shown in figure 11. For both
for reduction in equivalent subjective level with reduction
-2
-4
-6
-8
-10
-12
-14
0
'%-\
A/C2 t t
-4
A/C3-8 t t
0 7 14 21
Number Noisinessof tones
testreduced
3
7
15 A
Preference
test
0
-2
-4
-6
-8 A/C4 t t
-2
.41 A/CS , , I0 7 14 21
Reduction in fundamental tone level, dB
Figure 11. Effects of hypothetical ANC conditions on preference andnoisiness judgements.
17

level of tones, and the number of tones reduced, had more effect for A/C 2 than for any of the otheraircraft, particularly in the preference judgements. Thus the subjects' preference for the hypotheticalANC conditions tended to be greater than indicated by either the measured loudness or subjectivejudgements of noisiness.
Applicability of Sound Quality Measures
A number of different metrics, in addition to loudness, have been developed (refs. 10-13) to quantifysome of the characteristics of sounds that have been shown to be related to subjective response and thatmay help predict preference for some sounds over others. The fluctuation strength, roughness, sharpnessand tonality of the original and ANC modified propeller airplane and jet airplane interior sounds werecalculated (table B3, appendix B), and their relevance to the subjective response to the sounds isexamined in the following sections. Models which considered inclusion of these variable as correctionsto simple loudness models are also examined.
Correlation between SQ measures. Ideally a set of metrics for quantifying characteristics of soundsrelated to human response should be independent or orthogonal. Pearson Product-Moment correlationcoefficients and level of significance for the sound quality metrics for the particular set of sounds used inthe present experiments are given in table 8. The interrelationships between these metrics are also
Table 8. Correlation between Sound Quality Metrics.
Fluctuation Roughness Sharpness TonalityStrength (FS) (R) (S) (T)
Loudness Level (LLz) -0.181 0.311" 0.679** -0.300*
Fluctuation Strength (FS) .028 -. 192 .084
Roughness (R) .539** -.850**
Sharpness (S) -.683**
* indicates significant at the 5% level, ** indicates significant at the 1% level
indicated in the scatterplots in figure 12. For each scatterplot, the abscissa is the metric identified by thelabel in that column and the ordinate is the metric identified by the label in the row. From the first row,it can be seen that loudness has a weak negative relationship with fluctuation strength. Although thecorrelation coefficient between loudness and fluctuation strength for all data combined (table 8) is notsignificant, based on the groupings in figure 12 and the data in tables B2 and B3, appendix B, there doesseem to be a negative relationship within each aircraft type. Based on the correlation coefficient,loudness is positively related to roughness. Examination of the scatter plot confirms this trend except forA/C 2 and A/C 4 (see tables B2 and B3, Appendix B). For these two aircraft a strong negativerelationship is indicated. Although the correlation between loudness and tonality is negative andsignificant, the scatterplot and tables B2 and B3 indicate that within each aircraft type, the relationshipbetween loudness and tonality is positive. From the second row in figure 12, fluctuation strength does notappear to be related to roughness but does have a weak positive relation ship with sharpness and a weaknegative relationship with tonality. The correlation coefficients in table 8, however, are all not significantand the trends again are only within aircraft types. From the third and fourth rows, respectively,
18
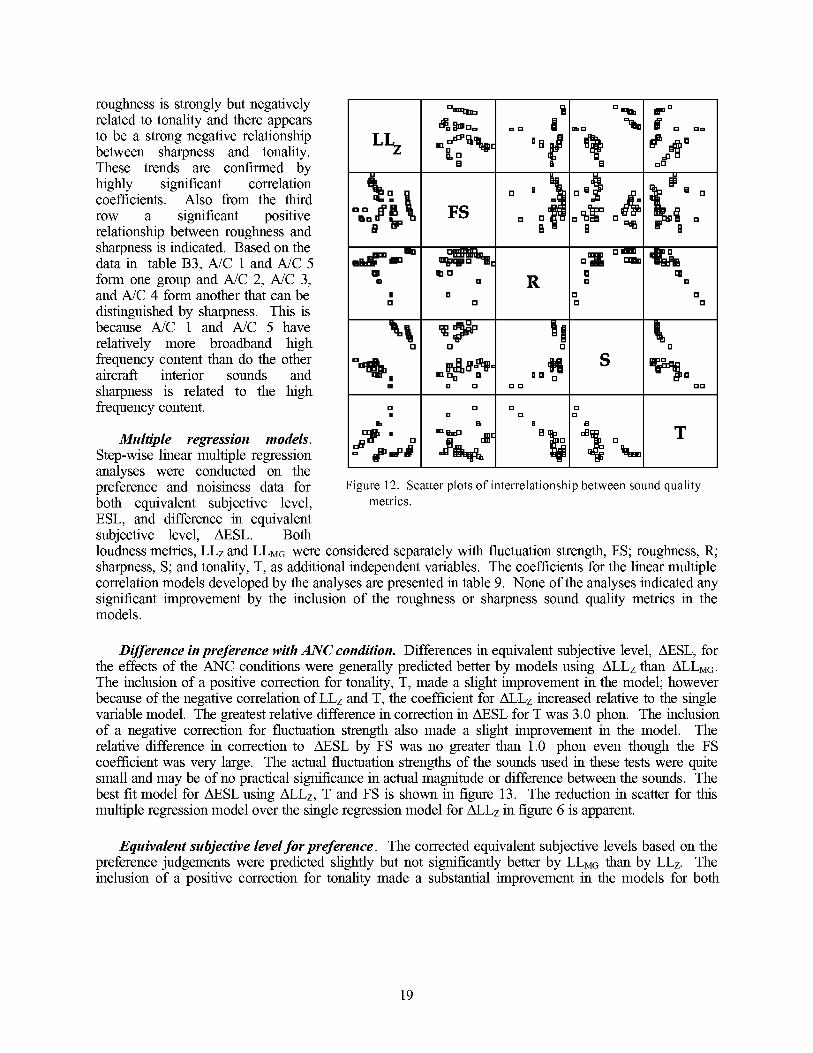
roughnessis stronglybutnegativelyrelatedto tonalityandthereappearsto be a strongnegativerelationshipbetweensharpnessand tonality.These trends are confirmedbyhighly significant correlationcoefficients. Also from the thirdrow a significant positiverelationshipbetweenroughnessandsharpnessis indicated.Basedonthedatain tableB3, A/C 1andA/C 5form onegroupandA/C 2, A/C 3,andA/C 4 formanotherthatcanbedistinguishedby sharpness.This isbecauseA/C 1 and A/C 5 haverelatively more broadbandhighfrequencycontentthando theotheraircraft interior sounds andsharpnessis relatedto the highfrequencycontent.
Multiple regression models.Step-wise linear multiple regressionanalyses were conducted on thepreference and noisiness data forboth equivalent subjective level,ESL, and difference in equivalentsubjective level, AESL. Both
L½
mm
n
[]
a
FS
_a[]
[]
[]
O
[] D
[]
[]
°[] |i
m
[]
[]o
R
[]
[]
°_ gpa
=_ it [] []°
u i aO
oU Illo []
[] []
[] []
S
T
Figure 12. Scatter plots of interrelationship between sound qualitymetrics.
loudness metrics, LLz and LLMG were considered separately with fluctuation strength, FS; roughness, R;sharpness, S; and tonality, T, as additional independent variables. The coefficients for the linear multiplecorrelation models developed by the analyses are presented in table 9. None of the analyses indicated anysignificant improvement by the inclusion of the roughness or sharpness sound quality metrics in themodels.
Difference in preference with ANC condition. Differences in equivalent subjective level, AESL, forthe effects of the ANC conditions were generally predicted better by models using ALLz than ALLMG.The inclusion of a positive correction for tonality, T, made a slight improvement in the model; howeverbecause of the negative correlation of LLz and T, the coefficient for ALLz increased relative to the singlevariable model. The greatest relative difference in correction in AESL for T was 3.0 phon. The inclusionof a negative correction for fluctuation strength also made a slight improvement in the model. Therelative difference in correction to AESL by FS was no greater than 1.0 phon even though the FScoefficient was very large. The actual fluctuation strengths of the sounds used in these tests were quitesmall and may be of no practical significance in actual magnitude or difference between the sounds. Thebest fit model for AESL using ALLz, T and FS is shown in figure 13. The reduction in scatter for thismultiple regression model over the single regression model for ALLz in figure 6 is apparent.
Equivalent subjective level for preference. The corrected equivalent subjective levels based on thepreference judgements were predicted slightly but not significantly better by LLMG than by LLz. Theinclusion of a positive correction for tonality made a substantial improvement in the models for both
19
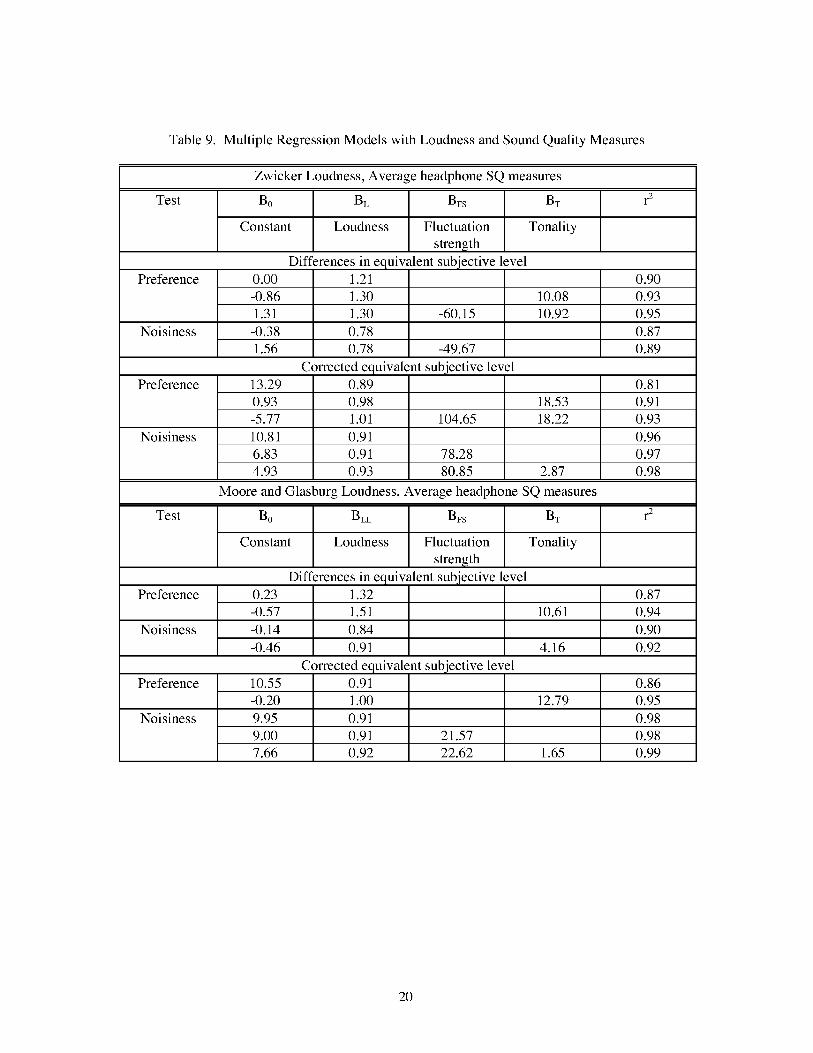
Table9. MultipleRegressionModelswithLoudnessandSoundQualityMeasures
ZwickerLoudness,AverageheadphoneSQmeasures
Test Bo Bs r2
Preference
Constant
0.00
BL BFS
Loudness Fluctuation
strength
Differences in equivalent subjective level1.21
1.301.30 -60.15
0.78
0.78 -49.67
Tonality
0.90-0.86 10.08 0.93
1.31 10.92 0.95
Noisiness -0.38 0.87
1.56 0.89
Corrected equivalent subjective levelPreference 13.29 0.89 0.81
0.93 0.98 18.53 0.91
-5.77 1.01 104.65 18.22 0.93
Noisiness 10.81 0.91 0.96
6.83 0.91 78.28 0.97
4.93 0.93 80.85 2.87 0.98
Moore and Glasburg Loudness, Average headphone SQ measures
Test Bo BT r 2
Preference
Constant
0.23
BEE BFS
Loudness Fluctuation
strength
Differences in equivalent subjective level1.32
Tonality
0.87-0.57 1.51 10.61 0.94
Noisiness -0.14 0.84 0.90
-0.46 0.91 4.16 0.92
Corrected equivalent subjective levelPreference 10.55 0.91 0.86
-0.20 1.00 12.79 0.95
Noisiness 9.95 0.91 0.98
9.00 0.91 21.57 0.98
7.66 0.92 22.62 1.65 0.99
20

0
-2
-4
Difference -6in
equivalentsubjective -8
level,
phon
-10
-12
-14-14
_: kO A/C 3 A_"
A ESL= 1.3 ÷ 1.30ALL z ÷10.9T
-- - 60.1 FS --
] ] ] ]-12 -10 -8 -6 -4 -2
Predicted difference in level
114
112
110
108
106Corrected
equivalentsubjective 104
Ievel,phon 102
100
98
96
9494
E A/C1
A, A/C3 , ,_
0 A/C5 _i
"A
_/h I I I I I Ir 2 = 0.934
ESL-- -5.8 + 1.01LL z + 18.2T
I_ + 104.7FSl.J.J.J.J.J.96 98 100 102 104 106 108 110 112 114
Predicted equivalent subjective level
Figure 13. Multiple regression model for predicting
effect of hypothetical ANC conditions on
subjective response based on preferencejudgements.
Figure 14. Multiple regression model for predicting
subjective response based on preference
judgements.
loudness metrics and increased the coefficients for the loudness metrics to very near unity. The greatest
relative differences in corrections in ESL for T were 5.2 phon and 3.7 phon for LLz and LLMa,
respectively. While the inclusion of a positive correction for fluctuation strength made a slight
improvement in the LLz model, the addition for a correction to the LLMa model was not verified by the
stepwise regression analysis. The best-fit model for corrected ESL using LLz, T and FS is shown in
figure 14. The reduction in scatter for this multiple regression model over the single regression model for
LLz in figure 7 is clearly noticeable.
Difference in noisiness with ANC condition. In contrast to the results for the preference judgements,
the stepwise regression analyses did not find tonality a significant variable along with LLz for predicting
difference in noisiness due to the ANC conditions. However, a slight improvement in correlation was
found by the inclusion of fluctuation strength. This result is shown in figure 15 as compared with figure
8. In effect, the inclusion of the fluctuation strength improved the alignment of A/C 2 with the other
aircraft. The stepwise regression analyses, however, found a slight improvement to the model with LLMa
by including tonality but no improvement by including the fluctuation strength. These very slight
improvements probably indicate that the inclusion of either sound quality metric is of little practical
significance in improving the prediction of differences in noisiness for interior noise treatments for a
given aircraft type.
Equivalent subjective level of noisiness. Although the correlations of the noisiness judgements with
LLz and LLMa were very high, the stepwise regression analyses found that the addition of positive
corrections for FS and T were significant. The inclusion of these factors, however, had very little effect
on the coefficients for loudness. Figure 16, as compared with figure 9, indicates the improvement was
primarily a result of correcting the underprediction of noisiness for A/C 4.
21

0 /_L-2 -- O A/C 1 r£_
[] A/C 2 D _I'_-
-4 -- O A/C 3 D.iA/C 4 D/_A
p,Difference -6 -- V A/C5
in -- /
equivalent josubjective -8
level, /phon
-10 r2 = 0.886 -
A ESL-- 1.6 ÷ 0.78ALL z - 49.7FS-12
-14 /
-14 -12 -10 -8 -6 -4 -2 0
Predicted difference in level
Figure 15. Multiple regression model for predictingeffect of hypothetical ANC conditions on noisinessjudgements.
Equivalentsubjective
level,phon
o A/C1
[] A/C2
__ O A/C3
Z_ A/C4
V A/C5
114
112
110
108
106
104
102
100 ,_
90 /96
gI I
r2 = 0.976
ESL-- 4.9 + 0.93LLz + 80.9FS+ 2.86T
9,./ J.J.J.J.J.J.94 96 98 100 102 104 106 108 110 112 114
Predicted equivalent subjective level
Figure 16. Multiple regression model for predicting
subjective response based on noisiness judgements.
Conclusions
Two experiments were conducted, which used sound quality engineering practices to determine the
subjective effectiveness of hypothetical active noise control (ANC) systems in five different propeller
airplanes. Binaural recordings were made at passenger head positions of the sounds inside the airplanes
under typical steady flight conditions. Digital filtering and reduction of the propeller tones at blade
passage frequency and higher harmonics provided simulations of hypothetical reductions in interior sound
levels which could be obtained with active noise control systems. The two experiments differed by the
type of judgments made by the subjects: pair comparisons based on preference in the first and numerical
category scaling of noisiness in the second. The following conclusions were noted:
1. The results of the two experiments were in general agreement that the hypothetical active noise
control measures improved the interior noise environments.
2. Subject preference increased with decreases in the level of propeller tones and with increases in
the number of tones reduced by the simulated ANC conditions.
3. The subjective effectiveness of the simulated ANC conditions was highly dependent on the
spectral content and relative levels of the tonal and broadband components in the original airplane interiorsounds.
4. The reductions in subjective response due to the ANC conditions were predicted with reasonable
accuracy by reductions in measured loudness level.
5. Inclusion of corrections for the sound quality characteristics of tonality and fluctuation strength in
multiple regression models improved the prediction of the effects of the hypothetical ANC conditions.
6. Although the results of the two tests are in general agreement, the pair comparison method based
on subject preference appears to be more sensitive to subtle changes in the characteristics of the sounds
which are related to passenger preference than is the numerical category method based on noisiness.
22

Appendix A
Spectra of Noise Stimuli
A-weighted 1/24-Oct. Band Level,dB
85 -
75
65
55
45
Spectrum modification
• None
[] Maximum
35I , , , , I , , , , , , , , I , , , , , , , , I
50 100 1000 10000
1/24-Oct. Band Center Frequency, Hz
Figure A1. Spectra of noise stimuli for A/C 1, original spectrum and spectrum with the greatest reduction in tonal
components illustrated.
A-weighted 1/24-Oct. Band Level,dB85 -
75
65
55
45
Spectrum modification
• None
[] Maximum
35, , , , I , , , , , , , , I , , , , , , , , I
50 100 1000 10000
1/24-Oct. Band Center Frequency, HzFigure A2. Spectra of noise stimuli for A/C 2, original spectrum and spectrum with the greatest reduction in tonal
components illustrated.
23

A-weighted 1/24-Oct. Band Level,dB
85 -
75 -
65 -
55 -
45 -
35 -I .... I
50 100
Spectrum modification
• None
[] Maximum
m m m m m m m m i m m
1000
1/24-Oct. Band Center Frequency, Hz
m m m m i
10000
Figure A3. Spectra of noise stimuli for A/C 3, original spectrum and spectrum with the greatest reduction in tonal
components illustrated.
A-weighted 1/24-Oct. Band Level,dB85 -
75 -
65 -
55 -
45 -
35 -I .... I
50 100
Spectrum modification
• None
[] Maximum
m m m m m m m m i m m
1000
1/24-Oct. Band Center Frequency, Hz
m m m m i
10000
Figure A4. Spectra of noise stimuli for A/C 4, original spectrum and spectrum with the greatest reduction in tonal
components illustrated.
24
A-weighted 1/24-Oct. Band Level,dB
85 F
75
Spectrum modification
• None
[] Maximum
65
55
45
35I .... I ........ I ........ I
50 100 1000 10000
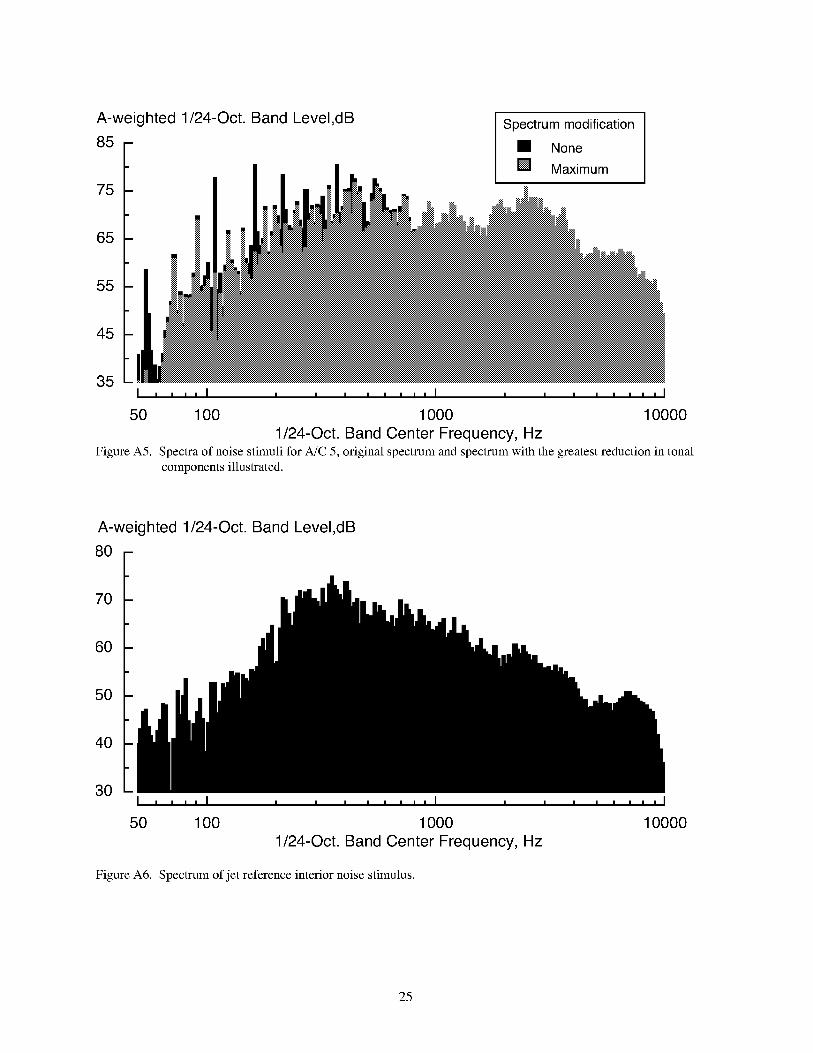
1/24-Oct. Band Center Frequency, HzFigure A5. Spectra of noise stimuli for A/C 5, original spectrum and spectrum with the greatest reduction in tonal
components illustrated.
A-weighted 1/24-Oct. Band Level,dB
80 F
70
60
50
40
30I .... I ........ I ........ I
50 100 1000 10000
1/24-Oct. Band Center Frequency, Hz
Figure A6. Spectrum of jet reference interior noise stimulus.
25
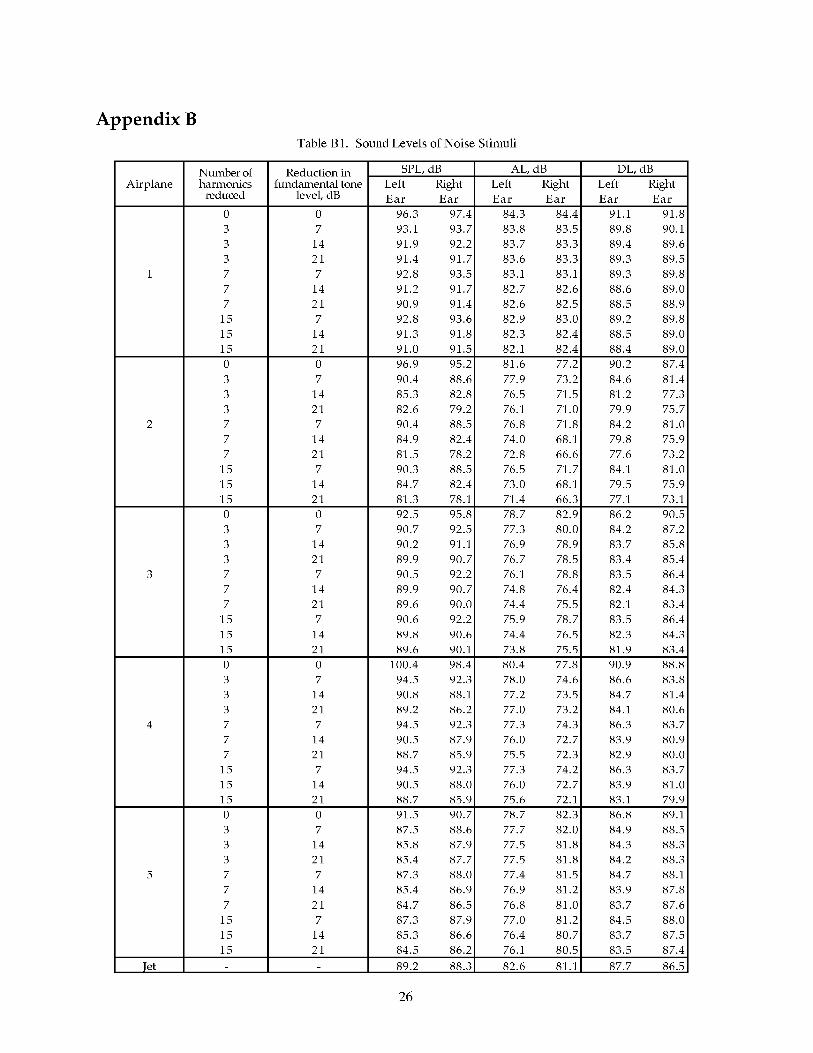
Appendix B
Table B 1. Sound Levels of Noise Stimuli
Airplane
Number ofharmonics
reduced
0
3
3
3
7
7
7
15
15
15
0
3
3
3
7
7
7
15
15
15
0
3
3
3
7
7
7
15
15
15
0
3
3
3
7
7
7
15
15
15
0
3
3
3
7
7
7
15
15
15
Reduction infundamental tone
level, dB
0
7
14
21
7
14
21
7
14
21
0
7
14
21
7
14
21
7
14
21
0
7
14
21
7
14
21
7
14
21
0
7
14
21
7
14
21
7
14
21
0
7
14
21
7
14
21
7
14
21
SPL, dB
Left Right
Ear Ear
96.3 97.4
93.1 93.7
91.9 92.2
91.4 91.7
92.8 93.5
91.2 91.7
90.9 91.4
92.8 93.6
91.3 91.8
91.0 91.5
96.9 95.2
90.4 88.6
85.3 82.8
82.6 79.2
90.4 88.5
84.9 82.4
81.5 78.2
90.3 88.5
84.7 82.4
81.3 78.1
92.5 95.8
90.7 92.5
90.2 91.1
89.9 90.7
90.5 92.2
89.9 90.7
89.6 90.0
90.6 92.2
89.8 90.6
89.6 90.1
100.4 98.4
94.5 92.3
90.8 88.1
89.2 86.2
94.5 92.3
90.5 87.9
88.7 85.9
94.5 92.3
90.5 88.0
88.7 85.9
91.5 90.7
87.5 88.6
85.8 87.9
85.4 87.7
87.3 88.0
85.4 86.9
84.7 86.5
87.3 87.9
85.3 86.6
84.5 86.2
AL, dB
Left Right
Ear Ear
84.3 84.4
83.8 83.5
83.7 83.3
83.6 83.3
83.1 83.1
82.7 82.6
82.6 82.5
82.9 83.0
82.3 82.4
82.1 82.4
81.6 77.2
77.9 73.2
76.5 71.5
76.1 71.0
76.8 71.8
74.0 68.1
72.8 66.6
76.5 71.7
73.0 68.1
71.4 66.3
78.7 82.9
77.3 80.0
76.9 78.9
76.7 78.5
76.1 78.8
74.8 76.4
74.4 75.5
75.9 78.7
74.4 76.5
73.8 75.5
80.4 77.8
78.0 74.6
77.2 73.5
77.0 73.2
77.3 74.3
76.0 72.7
75.5 72.3
77.3 74.2
76.0 72.7
75.6 72.1
78.7 82.3
77.7 82.0
77.5 81.8
77.5 81.8
77.4 81.5
76.9 81.2
76.8 81.0
77.0 81.2
76.4 80.7
76.1 80.5
DL, dB
Left Right
Ear Ear
91.1 91.8
89.8 90.1
89.4 89.6
89.3 89.5
89.3 89.8
88.6 89.0
88.5 88.9
89.2 89.8
88.5 89.0
88.4 89.0
90.2 87.4
84.6 81.4
81.2 77.3
79.9 75.7
84.2 81.0
79.8 75.9
77.6 73.2
84.1 81.0
79.5 75.9
77.1 73.1
86.2 90.5
84.2 87.2
83.7 85.8
83.4 85.4
83.5 86.4
82.4 84.3
82.1 83.4
83.5 86.4
82.3 84.3
81.9 83.4
90.9 88.8
86.6 83.8
84.7 81.4
84.1 80.6
86.3 83.7
83.9 80.9
82.9 80.0
86.3 83.7
83.9 81.0
83.1 79.9
86.8 89.1
84.9 88.5
84.3 88.3
84.2 88.3
84.7 88.1
83.9 87.8
83.7 87.6
84.5 88.0
83.7 87.5
83.5 87.4
Jet 89.2 88.3 82.6 81.1 87.7 86.5
26
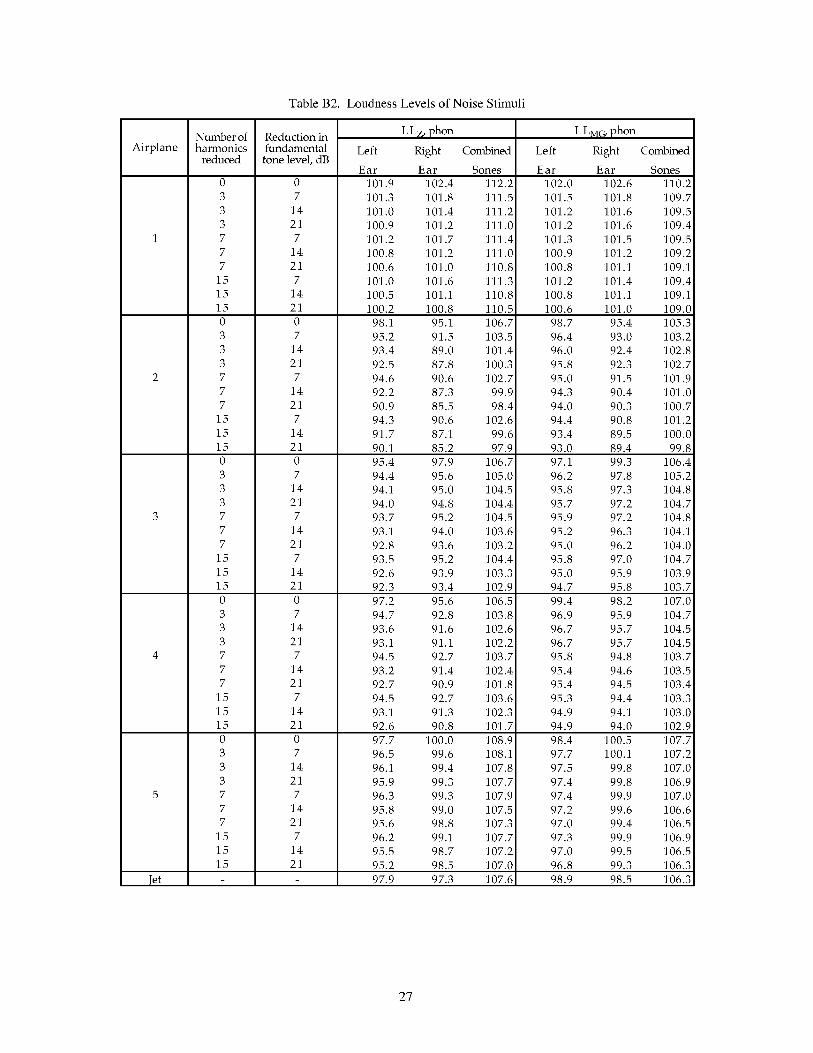
Table B2. Loudness Levels of Noise Stimuli
AirplaneNumber ofharmonics
reduced
0
3
3
3
7
7
7
15
15
15
0
3
3
3
7
7
7
15
15
15
0
3
3
3
7
7
7
15
15
15
0
3
3
3
7
7
7
15
15
15
0
3
3
3
7
7
7
15
15
15
Reduction infundamental
tone level, dB
0
7
14
21
7
14
21
7
14
21
0
7
14
21
7
14
21
7
14
21
0
7
14
21
7
14
21
7
14
21
0
7
14
21
7
14
21
7
14
21
L Lz, phon
Left Right Combined
Ear Ear Sones
101.9 102.4 112.2
101.3 101.8 111.5
101.0 101.4 111.2
100.9 101.2 111.0
101.2 101.7 111.4
100.8 101.2 111.0
100.6 101.0 110.8
101.0 101.6 111.3
100.5 101.1 110.8
100.2 100.8 110.5
98.1 95.1 106.7
95.2 91.5 103.5
93.4 89.0 101.4
92.5 87.8 100.3
94.6 90.6 102.7
92.2 87.3 99.9
90.9 85.5 98.4
94.3 90.6 102.6
91.7 87.1 99.6
90.1 85.2 97.9
95.4 97.9 106.7
94.4 95.6 105.0
94.1 95.0 104.5
94.0 94.8 104.4
93.7 95.2 104.5
93.1 94.0 103.6
92.8 93.6 103.2
93.5 95.2 104.4
92.6 93.9 103.3
92.3 93.4 102.9
97.2 95.6 106.5
94.7 92.8 103.8
93.6 91.6 102.6
93.1 91.1 102.2
94.5 92.7 103.7
93.2 91.4 102.4
92.7 90.9 101.8
94.5 92.7 103.6
93.1 91.3 102.3
92.6 90.8 101.7
Left
Ear
102.0
101.5
101.2
101.2
101.3
100.9
100.8
101.2
100.8
100.6
98.7
96.4
96.0
95.8
95.0
94.3
94.0
94.4
93.4
93.0
97.1
96.2
95.8
95.7
95.9
95.2
95.0
95.8
95.0
94.7
99.4
96.9
96.7
96.7
95.8
95.4
95.4
95.3
94.9
94.9
98.4
97.7
97.5
97.4
97.4
97.2
97.0
97.3
97.0
96.8
0
7
14
21
7
14
21
7
14
21
97.7 100.0 108.9
96.5 99.6 108.1
96.1 99.4 107.8
95.9 99.3 107.7
96.3 99.3 107.9
95.8 99.0 107.5
95.6 98.8 107.3
96.2 99.1 107.7
95.5 98.7 107.2
95.2 98.5 107.0
L LMG, phon
Right
Ear
102.6
101.8
101.6
101.6
101.5
101.2
101.1
101.4
101.1
101.0
95.4
93.0
92.4
92.3
91.5
90.4
90.3
90.8
89.5
89.4
99.3
97.8
97.3
97.2
97.2
96.3
96.2
97.0
95.9
95.8
98.2
95.9
95.7
95.7
94.8
94.6
94.5
94.4
94.1
94.0
100.5
100.1
99.8
99.8
99.9
99.6
99.4
99.9
99.5
99.3
Combined
Sones
110.2
109.7
109.5
109.4
109.5
109.2
109.1
109.4
109.1
109.0
105.3
103.2
102.8
102.7
101.9
101.0
100.7
101.2
100.0
99.8
106.4
105.2
104.8
104.7
104.8
104.1
104.0
104.7
103.9
103.7
107.0
104.7
104.5
104.5
103.7
103.5
103.4
103.3
103.0
102.9
107.7
107.2
107.0
106.9
107.0
106.6
106.5
106.9
106.5
106.3
Jet 97.9 97.3 107.6 98.9 98.5 106.3
27

TableB3.ValuesofSoundQualityMeasuresofNoiseStimuli
Airplane
11111111112222222222333333333344444444445555555555Jet
Numberofharmonicsreduced
03337771515150333777151515033377715151503337771515150333777151515
Reductioninfundamental
tone,dB
07142171421714210714217142171421071421714217142107142171421714210714217142171421
FluctuationStrength,vacilLeft Rightear ear0.035 0.0280.044 0.0250.043 0.0310.044 0.0330.040 0.0280.041 0.0350.041 0.0380.042 0.0290.045 0.0360.046 0.0380.027 0.0350.026 0.0370.025 0.0370.031 0.0390.021 0.0350.024 0.0380.028 0.0420.022 0.0320.027 0.0360.032 0.0380.037 0.0310.037 0.0360.040 0.0380.044 0.0410.037 0.0340.042 0.0380.047 0.0400.036 0.0320.044 0.0370.049 0.0400.042 0.0420.043 0.0440.044 0.0490.042 0.0490.041 0.0450.046 0.0530.043 0.0510.042 0.0440.045 0.0490.044 0.049
Roughness,asperLeft Rightear ear0.37 0.390.37 0.400.37 0.400.37 0.400.37 0.400.37 0.400.37 0.400.37 0.400.37 0.400.37 0.400.27 0.130.34 0.260.35 0.330.34 0.320.33 0.260.34 0.340.33 0.340.33 0.260.34 0.340.34 0.340.32 0.370.33 0.410.34 0.410.33 0.410.33 0.410.33 0.410.33 0.400.34 0.410.33 0.400.33 0.400.16 0.170.26 0.260.34 0.340.37 0.350.26 0.260.33 0.340.36 0.350.26 0.260.34 0.340.36 0.34
Sharpness,acumLeft Rightear ear0.97 1.001.03 1.061.06 1.101.07 1.121.04 1.081.09 1.121.10 1.151.05 1.081.09 1.131.11 1.150.67 0.640.76 0.720.82 0.770.86 0.810.77 0.730.85 0.800.90 0.840.77 0.730.85 0.800.90 0.840.74 0.700.78 0.780.80 0.810.81 0.830.80 0.800.82 0.850.84 0.880.80 0.800.83 0.860.84 0.880.62 0.710.69 0.800.74 0.870.77 0.900.70 0.810.76 0.880.79 0.910.70 0.810.76 0.880.79 0.92
TonalityLeftear0.150.110.080.080.100.080.080.090.070.080.200.150.150.160.150.130.120.140.110.070.120.090.090.090.070.060.060.060.040.050.320.230.170.150.240.170.160.240.180.16
0.034 0.0260.031 0.0270.038 0.0300.042 0.0310.031 0.0290.038 0.0320.038 0.0340.027 0.0300.035 0.0360.038 0.040
0.33 0.370.34 0.360.33 0.360.33 0.360.34 0.360.33 0.360.33 0.350.34 0.360.33 0.350.33 0.35
1.05 1.101.09 1.131.11 1.141.12 1.151.11 1.151.13 1.171.14 1.181.12 1.151.15 1.181.16 1.19
0.130.090.070.070.090.080.070.090.070.07
Rightear0.140.100.080.070.100.070.080.090.070.060.380.220.230.220.260.130.100.260.140.080.250.090.070.090.100.060.060.110.050.050.330.240.180.150.240.180.140.240.180.140.060.060.080.080.060.070.080.060.070.08
0.044 0.045 0.36 0.38 0.91 0.94 0.07 0.07
28

Appendix C
Instructions and Scoring Sheet for Preference Test
Test Instructions
We would like you to help us investigate peoples' reactions to aircraft
interior sounds.
Today there will be 4 test sessions, each lasting 10 to 15 minutes. During
each session, you will hear 50 pairs of aircraft interior sounds. Each sound in the
pairs will last a few seconds. Your job will be to score each pair of sounds on a
response sheet in the following manner:
After listening to each pair of sounds, you are to indicate which member of
the pair you preferred on the response sheet. Each line has an A and B choice. If
you prefer the first sound of the pair, you should circle the A for that sound pair.
Likewise, if you prefer the second sound of the pair, you should circle the B.
There are no right or wrong answers but you must choose either A or B for each
sound pair. You will have a few seconds between pairs to make your choice. A
voice message will be heard every 5 pairs to help you keep track of which pair is
being presented. In case you lose track, please tell the test conductor at the end of
the session and part of the session will be repeated.
Please listen carefully and make your choice at the end of each pair of
sounds. Again, there are no right or wrong answers, we just want a measure of
your own personal reaction to each pair of aircraft interior sounds. For this reason,
we request that you do not talk during the tests nor make any sounds or express
any emotion which might influence the response of the other people in the room.
Before we start the actual test we will play 5 sounds to give you the
opportunity to hear the range of sounds and become comfortable with the
headphones. We will then have a practice session with 6 pairs of sounds. This
will let you become familiar with the scoring and give you the opportunity to ask
us any questions about the test.
Thank you for helping us with this investigation.
29

Scoring Sheet
Subject Number:_Date:
Test Name:
Session name:
Circle A if you prefer the first sound you hear.
Circle B if you prefer the second sound you hear.
First Second
i i A B
2. A B
3. A B
4. A B
5. A B
7. A B
8. A B
9. A B
10. A B
12. A B
13. A B
14. A B
15. A B
17. A B
18. A B
19. A B
20. A B
22. A B
23. A B
24. A B
25. A B
.z,
.:..
.:.:.....
First Second
iiiiiiiiii26iiiiiiiiiiiiiiiiiiiiiAiiiiiiiiiiiiiiiiiiiiiiiiiiiiiiiiiiiiiiiiiiBiiiiiiiiiiiiiiiiiiii
:_iiiiiiiiii_27. A B_iiii'_ 28. A B
_: 29. A B
'iiiii_: 30. A B
'iiiii_' iiiiiiiiii3iiIiiiiiiiiiiiiiiiiiiiiiiiAiiiiiiiiiiiiiiiiiiiiiiiiiiiiiiiiiiiiiiiiiiBiiiiiiiiiiiiiiiiiiii
32. A B
33. A B
34. A B
35. A B
37. A B
38. A B
39. A B
40. A B
42. A B
43. A B
44. A B
45. A B
47. A B
48. A B
49. A B
50. A B
30

Appendix D
Instructions and Scoring Sheet for Noisiness Test
Test Instructions
We would like you to help us investigate peoples' reactions to aircraft interior
sounds. We would like you to judge how noisy some of these sounds are. By
noisy, we mean annoying, unwanted, objectionable, unacceptable, and so on.
Today there will be 4 test sessions, each lasting 10 to 15 minutes. During each
session, you will hear 65 aircraft interior sounds. Each sound will last a few
seconds. Before each session you will be given 5 scoring sheets, each containing
13 rating scales like the one shown below.
_., Less Noisy More Noisy .r0 1 2 3 4 5 6 7 8 9 10
1 I I I I I I I I I I I
After each sound there will be a few seconds of silence. During this interval
please indicate how noisy you judge the sound to be by placing a slash mark along
the scale. If you judge a sound to be not very noisy, then place your slash mark
close to the end of the scale marked 0, that is, near or between a low number near
the left end of the scale. Similarly, if you judge a sound to be very noisy, then
place your mark closer to the other end of the scale, that is, near or between a high
number near the right end of the scale. A moderately noisy judgement should be
marked in the middle portion of the scale. In any case, please make only one mark
on each scale. There are no right or wrong answers; we are only interested in your
opinion of the sound.
The scales on the first sheet are numbered 1 through 13, those on the second
sheet are numbered 14 through 26. The third is 27 through 39, the fourth is 40
through 52 and the last is 53 through 65. A voice message will be heard every 5
sounds to help you keep track of which sound is being presented. In case you lose
track, please tell the test conductor at the end of the session and part of the session
will be repeated. Please listen carefully and make your rating at the end of each
sound. Again, there are no right or wrong answers, we just want a measure of your
own personal reaction to these aircraft interior sounds. For this reason, we ask that
you do not talk during the tests nor make any sounds or express any emotion which
might influence the response of the other people in the room. Before we start the
actual test we will play 6 sounds to give you the opportunity to hear the range of
sounds and become comfortable with the headphones. We will then have a
practice session with 6 sounds. This will let you become familiar with the scoring
and give you the opportunity to ask us any questions about the test.
Thank you for helping us with this investigation.
31

Subject
2
3
4
5
6
7
8
9
10
11
12
13
o 1 2
o 1 2
I
o 1 2
I
o 1 2
I
o 1 2
I
o 1 2
I
o 1 2
o 1 2
o 1 2
o 1 2
o 1 2
o 1 2
o 1 2
Scoring Sheet
Session ID
Less Noisy3 4 5
I I
More Noisy6 7
I
Date
8 9
I
3 4 5
I I
6 7
I
8
I
9
3 4 5
I I
6 7
I
8
I
9
3 4 5
I I
6 7
I
8
I
9
3 4 5
I I
6 7
I
8
I
9
3 4 5
I I
6 7
I
8
I
9
3 4 5
I I
6 7
I
8
I
9
3 4 5
I I
6 7
I
8
I
9
3 4 5
I I
6 7
I
8
I
9
3 4 5
I I
6 7
I
8
I
9
3 4 5
I I
6 7
I
8
I
9
3 4 5
I I
6 7
I
8
I
9
3 4 5
I I
6 7
I
8
I
9
10
10
10
10
10
10
10
10
10
10
10
10
10
32
References
1. Rudrapatna, A. N.; and Jacobson, I. D.: The impact of interior cabin noise on passenger acceptance. SAE paper
760466, Proceedings of Society of Automotive Engineers Business Aircraft Meeting, Wichita_ April 1976.
2. Rupf, J. A.: Noise effects on passenger communication in light aircraft. SAE paper 770446, Society of
Automotive Engineers Business Aircraft Meeting, Wichita, March/April 1977.
3. Jacobson, I. D.: A trade-off analysis design tool. Aircraft interior noise-motion�passenger satisfaction. NASA
CR-154807, Sept. 1977.
4. Leatherwood, J. D.: Annoyance response to simulated advanced turboprop aircraft interior noise containing
tonal beats. NASA TP-2689, July 1987.
5. Angerer, J. R.; McCurdy, D. A.; and Erickson, R. A.: Development of an annoyance model based upon
elementary auditory sensations for steady-state aircraft interior noise containing tonal components. NASA
TM-104147, Sept. 1991.
6. International Organization for Standards; Method for Calculating Loudness Level (Method B), ISO R532, 1975.
7. Aures, W.: Berechnungsverfahren for den sensorishen Wohlklang beliebiger Schallsignale. Acoustica 59, 130-
141, 1985.
8. Otto, N. C. and Wakefield, G. H.: A Subjective Evaluation and Analysis of Automotive Starter Sounds. Noise
Control Engineering Journal, Vol. 41, no.3, pp. 377-382, November-December 1993
9. Disch, T. M.: Using Electronic Noise Sources to Improve the Sound Quality of Fans for Aircooled Engines.
Proceedings of Inter-Noise 95, Newport Beach, pp. 911-916, July 1995.
10. Terhardt, E.; Stoll, G.; and Seewann, M.: Algorithm for Extraction of Pitch and Pitch Salience from
Complex Tonal Signals. Journal of the Acoustical Society of America, 71(3), pp. 679-688, 1982.
11. Aures, W.: Berechnungsverfahren ftir den Wohlklang belieber Schallsignale, ein Beitrag zur geh6rbezogenen
Schallanalyse. Dissertation, Munich University,1984.
12. Aures, W.: Ein Berechnungsverfahren der Rauhigkeit. Acoustica 58, pp. 268-281,1985.
13. Zwicker, E.; and Fastl, H.: Psychoacoustics: Facts and Models, Springer-Verlag, 1990.
14. Pearsons, Karl S.: and Bennett, Ricarda L.: Handbook of Noise Ratings, NASA CR-2376, April 1974.
15. Moore, B. C. J. ; and Glasberg, B. R.: A Revision of Zwicker's Loudness Model. Acoustica, 82, pp. 335-345,1996.
33

REPORT DOCUMENTATION PAGE Form ApprovedOMB No. 0704-0188
Publicreportingburdenfor thiscollectionof informationisestimatedto average1 hourperresponse,includingthetimeforreviewinginstructions,searchingexistingdatasources,gatheringandmaintainingthedataneeded,andcompletingandreviewingthe collectionof information.Sendcommentsregardingthisburdenestimateoranyotheraspectof thiscollectionof information,includingsuggestionsfor reducingthis burden,to WashingtonHeadquartersServices,Directoratefor InformationOperationsandRe)orts,1215JeffersonDavisHighway,Suite1204,Arlington,VA22202-4302,andto theOfficeof ManagementandBudget,PaperworkReductionProject(0704-0188),Washington,DC20503.
1. AGENCY USE ONLY (Leave blank) 2. REPORT DATE 3. REPORT TYPE AND DATES COVERED
May 2000 Technical Memorandum
4. TITLE AND SUBTITLE 5. FUNDING NUMBERS
Potential Subjective Effectiveness of Active Interior Noise Control in Propeller WU 522-81-14-01
Airplanes
6. AUTHOR(S)
Clemans A. Powell and Brenda M. Sullivan
7. PERFORMING ORGANIZATION NAME(S) AND ADDRESS(ES)
NASA Langley Research Center
Hampton, VA 23681-2199
9. SPONSORING/MONITORING AGENCY NAME(S) AND ADDRESS(ES)
National Aeronautics and Space Administration
Washington, DC 20546-0001
8. PERFORMING ORGANIZATIONREPORT NUMBER
L-17976
10. SPONSORING/MONITORINGAGENCY REPORT NUMBER
NASA/TM-2000-210122
11. SUPPLEMENTARY NOTES
12a. DISTRIBUTION AVAILABILITY STATEMENT
Unclassified-Unlimited
Subject Category 71 Distribution: Standard
Availability: NASA CASI 301-621-0390
12b. DISTRIBUTION CODE
13. ABSTRACT (Maximum 200 words)
Active noise control technology offers the potential for weight-efficient aircraft interior noise reduction, particularly for propeller
aircraft. However, there is little information on how passengers respond to this type of interior noise control. This paper presents
results of two experiments that use sound quality engineering practices to determine the subjective effectiveness of hypothetical
active noise control (ANC) systems in a range of propeller aircraft. The two experiments differed by the type of judgments made by
the subjects: pair comparisons based on preference in the first and numerical category scaling of noisiness in the second. Although
the results of the two experiments were in general agreement that the hypothetical active control measures improved the interior
noise environments, the pair comparison method appears to be more sensitive to subtle changes in the characteristics of the sounds
which are related to passenger preference. The reductions in subjective response due to the ANC conditions were predicted with
reasonable accuracy by reductions in measured loudness level. Inclusion of corrections for the sound quality characteristics of
tonality and fluctuation strength in multiple regression models improved the prediction of the ANC effects.
14. SUBJECT TERMS
Aircraft Interior Noise; Psychoacoustics; Sound Quality; Active Noise Control; Propeller Aircraft;
Human Response to Noise
17. SECURITY CLASSIFICATIONOF REPORT
Unclassified
18. SECURITY CLASSIFICATIONOF THIS PAGE
Unclassified
19. SECURITY CLASSIFICATIONOF ABSTRACT
Unclassified
15. NUMBER OF PAGES
38
16. PRICE CODE
A03
20. LIMITATION OF ABSTRACT
UL
NSN 7540-01-280-5500 Standard Form 298 (Rev. 2-89)PrescribedbyANSIStd.239-18
298-102