Embed Size (px)
Citation preview

Potential post-Brexit tariff costs for EU-UK trade
Briefing note: October 2016
Justin Protts
Summary
Our analysis shows that if the UK leaves the EU without a trade deal UK exporters could
face the potential impact of £5.2 billion in tariffs on goods being sold to the EU. However,
EU exporters will also face £12.9 billion in tariffs on goods coming to the UK.
Exporters to the UK in 22 of the 27 remaining EU member states face higher tariffs costs
when selling their goods than UK exporters face when selling goods to those countries.
German exporters would have to deal with the impact of £3.4 billion of tariffs on goods
they export to the UK. UK exporters in return would face £0.9 billion of tariffs on goods
going to Germany.
French exporters could face £1.4 billion in tariffs on their products compared to UK
exporters facing £0.7 billion. A similar pattern exists for all the UK’s major EU trading
partners.
The biggest impact will be on exports of goods relating to vehicles, with tariffs in the
region of £1.3 billion being applied to UK car-related exports going to the EU. This
compares to £3.9 billion for the EU, including £1.8 billion in tariffs being applied to
German car-related exports.
This purpose of this analysis is to determine the potential tariff implications for both UK and
EU exporters in the event a free trade deal has not been reached by the time the UK exits
the European Union.1
The study aims to achieve this by providing estimates for the level of tariff costs that could
be introduced if trade between the UK and EU was conducted under WTO Most Favoured
Nations (MFN) terms, on the assumption the UK leaves the EU customs union and has no
new free trade deal. Doing so allows us to examine the importance of continued free trade
for both the UK and our EU trading partners and so highlights the relative strengths for and
pressures on both sides in upcoming negotiations.
The findings of our analysis highlight the importance of a trade deal for both the UK and for
EU countries.
1 Some commentators have questioned the extent to which tariffs are felt by exporting companies, suggesting
that their impact is in fact on consumers. A response to this point has been added on page 8.

civitas.org.uk/research/europe • 2
The analysis uses import data from 2015, combined with the EU’s MFN tariff schedule, to
provide the most up-to-date estimate of tariffs that would be payable on UK-EU trade if our
trade continued under the ‘WTO-only’ option. This study is ‘static’, i.e. it does not take into
account the elasticity of sales in response to tariff-induced price increases. However, using
the most recent annual data, it provides an indication of the relative magnitude of tariff costs
and hence the pressure to ensure the UK and EU secure a trade deal.
Tariffs are not the only factor that could damage in the absence of a comprehensive trade
deal. Regulatory and other non-tariff barriers (NTBs) could increase the cost of trading
goods between the EU and UK and make it harder for exporters selling goods in either
direction. These NTBs become increasingly significant as tariffs are reduced. However, with
the assumption that the EU and UK would both maintain the same initial tariff schedules, and
given the UK is currently compliant with all EU regulation, preventing the introduction of
tariffs must be the first and potentially most significant step in the process of achieving
continued free trade.
As such, realising the potential cost of re-introducing tariffs to trade between the UK and
most of Europe is the first step in making the case for a trade deal that will allow both EU
and UK citizens to benefit from continued tariff-free trade across the continent.
The change in trading terms (including the potential introduction of tariffs), UK trade policy
and the relative values of sterling and the euro will all influence the level of trade. These
issues are not covered by our data analysis but are discussed in the note.
Estimating the level of tariffs relating to UK-EU trade
By country
Though negotiations on the future EU-UK relationship will take place at an EU level, it is vital
to remember that 28 different countries (including the UK) will have to approve any new EU-
UK trade deal. Further still, the 27 national governments of the EU will be providing direction
for the negotiations and each working to strike a deal which will protect the interests of their
electorate. The same of course applies to the UK.
As such our analysis draws on national data to show the level of tariffs that could have been
applied to EU-UK trade had goods been subject to the EU’s current MFN tariff regime.
The analysis is summarised in Table 1. For imports, columns 2 and 5, the country with the
higher value (i.e. has a trade surplus) is shaded red. For potential tariff costs, columns 3 and
6, the ’loser’ country (i.e. the one whose exporters suffer higher total costs) is shaded red.
Exporters to the UK from 22 of the 27 remaining EU member states would face higher tariff
costs on their goods than UK exporters would face when selling goods in the other direction.
Those 22 include all of the UK’s major trading partners, with Germany facing a potential tariff
barrier of around £3.4 billion and France and Ireland seeing a barrier of £1.4 billion and £1.3
billion respectively. This stands in comparison to UK exporters who would see tariffs of £0.9
billon on goods going to Germany, and £0.7 billion and £0.8 billion on exports to France and
Ireland, respectively.

civitas.org.uk/research/europe • 3
This pattern is repeated with all the UK’s major EU trading partners. In total the EU faces a
potential of having to deal with the cost of £12.9 billion in UK tariffs, an average levy of 5.8%,
and UK exporters face EU tariffs of £5.2 billion, an average of 4.5%.2
2 Comtrade Data: UK Imports ('Goods', 'Annual', 'HS12','2015','United Kingdom','All','Imports','AG6 - All 6-digit
HS2012 commodities') and EU Imports ('Goods', 'Annual', 'HS12','2015','All','United Kingdom','Imports','AG6 - All 6-digit HS2012 commodities'): http://comtrade.un.org/data/; EU MFN AVE Tariffs for 2015: ITC MACMap AVE Tariffs (World Tariff Profile Method): http://www.macmap.org/QuickSearch/FindTariff/FindTariff.aspx; Comtrade GBP/USD 2015 Imports Exchange Rate: 1.528854 http://comtrade.un.org/db/mr/daExpNoteDetail.aspx?r=826&y=2015,
Partner CountryUK
Imports
Tariffs
Payable
Estimate
Average
Tariff RateEU Imports
Tariffs
Payable
Estimate
Average
Tariff Rate
Austria 3,061 125 4.1% 1,701 78 4.6%
Belgium 20,481 1,258 6.1% 12,140 547 4.5%
Bulgaria 365 19 5.3% 327 11 3.5%
Croatia 95 5 4.9% 152 7 4.5%
Cyprus 152 16 10.8% 327 22 6.7%
Czechia 4,833 203 4.2% 1,901 65 3.4%
Denmark 3,435 282 8.2% 2,519 113 4.5%
Estonia 184 3 1.6% 277 12 4.4%
Finland 2,026 44 2.2% 1,094 51 4.6%
France 25,017 1,394 5.6% 14,284 707 4.9%
Germany 61,275 3,366 5.5% 24,048 859 3.6%
Greece 703 65 9.3% 865 46 5.3%
Hungary 2,516 125 5.0% 1,004 38 3.8%
Ireland 12,452 1,279 10.3% 12,342 768 6.2%
Italy 16,190 870 5.4% 7,554 347 4.6%
Latvia 483 8 1.6% 151 5 3.4%
Lithuania 769 40 5.2% 520 18 3.4%
Luxembourg 485 13 2.7% 202 9 4.4%
Malta 181 6 3.1% 284 15 5.2%
Netherlands 30,801 1,561 5.1% 15,041 644 4.3%
Poland 8,084 483 6.0% 3,305 158 4.8%
Portugal 2,345 158 6.7% 1,366 71 5.2%
Romania 1,545 99 6.4% 1,086 48 4.4%
Slovakia 2,012 171 8.5% 744 18 2.4%
Slovenia 325 14 4.2% 290 13 4.7%
Spain 13,930 1,049 7.5% 9,125 376 4.1%
Sweden 6,807 204 3.0% 4,563 173 3.8%
EU Total 220,551 12,861 5.8% 117,210 5,220 4.5%
Table 1. Estimate of annual tariffs payable on UK-EU Imports by EU Partner Country (2015, £ million)
EU Goods UK Goods

civitas.org.uk/research/europe • 4
This is a reflection of the current balance of trade between the EU and the UK. As a net
importer of EU goods the UK government would potentially collect over twice as much in
tariffs on EU goods than would be levied on UK goods going to the EU.
Of course, a high-level aggregate approach of this nature obscures the direct impact on the
ground. It is unlikely to provide much comfort to a British exporter facing higher costs to learn
that overall the UK is a net ‘winner’ or to be told that his overseas competitors are left in an
even worse position. However, the £12.9 billion in additional revenues would provide the UK
government with significantly more funds than our EU counterparts to invest in boosting the
UK economy, or to implement on ‘mitigation’ measures to counteract the impact (within the
bounds of WTO rules).
That said, these tariffs would be a cost that would be damaging to both UK and EU exporters
and should put pressure on both sides in the negotiations to achieve a deal that is in the
interest of their own economies.
The value of tariffs payable on EU and UK goods is estimated by applying the average tariff
for each 6-digit HS (Harmonized System) code to the value of goods traded between the UK
and each of its partner EU countries.3 The tariff (or customs duty) paid on goods imported to
3 The HS Code is from the World Customs Organisation harmonized system for the classification of goods:
http://www.wcoomd.org/en/topics/nomenclature/instrument-and-tools/hs_nomenclature_2012/hs_nomenclature_table_2012.aspx; the value of goods by partner country and HS code is taken from the UN Comtrade database: http://comtrade.un.org/data/

civitas.org.uk/research/europe • 5
the EU is calculated by applying the tariff to the value of the good imported.4 Chart 1 breaks
down the potential tariff burden for exporters in the EU countries exporting to the UK (in
blue) and compares it to the tariff burden facing UK businesses exporting to each EU trading
partner (in red).5
By industry
Country-by-country estimates and EU-UK comparisons provide a broad comparison that
makes it clear there will be an economic impact for all current EU members if a trade deal
that allows continued tariff-free trade is not agreed.
A closer look at the difference across different industries allows us to see more clearly the
4 The value of the good is calculated as the value payable to the seller, so includes the cost of transport and
packaging. The tariff for goods is applied using tariff codes based on the Harmonized System code which is an international system which identifies products by a code. Most tariffs are calculated as a percentage of the value of the good (ad valorem tariffs). However, a number of goods are calculated depending on the weight.
Our
estimate uses average tariffs calculated at the 6-digit HS code level. The tariffs are calculated as simple means at a 6-digit level. For the non-AV tariffs an AV equivalent (AVE) figure is used in calculating the 6-digit average. The AVE figures are from the ITC MACMap using the World Tariff Profile methodology (http://www.macmap.org/SupportMaterials/Methodology.aspx#method_B11). These AVE estimates are provided at a national code level and are then included in the 6-digit HS code average, these 6-digit averages are multiplied by the value of goods imported (from each EU country to the UK and from the UK to each EU country) which fall into that 6-digit category. These are the figures that are then used in the report and which are used to provide the weighted averages for the 2-digit HS chapters. For comparison, the same research was done using export figures and, though subtle differences between the data exist, the findings remain broadly unchanged with EU goods imported to the UK seeing an estimated £12.9 billion in tariff and UK goods imported to EU countries seeing a total of £5.6 billion in tariffs. 5 The 15 EU members that can be expected to suffer the greatest tariff impacts are included separately with the
remaining 12 combined in the ‘Other’ columns.
Table 2: 10 Biggest Losers by Value: UK and EU industries facing the most tariffs (£ millions)
EU Exporters of Tariff
Estimate UK Exporters of
Tariff Estimate
1. Vehicles (including parts and accessories)
£3,896m 1. Vehicles (including parts and accessories)
£1,348m
2. Meat £1023m 2. Meat £378m
3. Dairy produce £956m 3. Dairy produce £331m
4. Preparations of meat and fish £563m 4. Plastics and plastic products £286m
5. Plastics and plastic products £498m 5. Nuclear reactors, boilers and mechanical appliances
£210m
6. Electrical machinery and equipment (including parts)
£477m 6. Mineral Fuels, oils and other products their distillation
£167m
7. Preparations of vegetables and other parts of plants
£372m 7. Preparations of meat and fish £154m
8. Nuclear reactors, boilers and mechanical appliances
£366m 8. Electrical machinery and equipment (including parts)
£144m
9. Vegetables £326m 9. Organic chemicals £134m
10. Preparations of cereals £303m 10. Waste from food industries and animal fodder
£123m
civitas.org.uk/research/europe • 6
pressure points for upcoming negotiations. Tables 2 and 3 highlight the biggest losers in
both the UK and EU, by value and by percentage, in the event tariffs are introduced.
Table 2 shows that manufacturers of vehicles and parts would be set to incur the most costs
in absolute terms. Applying tariffs to the trade values in 2015 would see UK vehicle
(including parts) manufacturers dealing with the cost of £1.3bn in tariffs on EU bound goods.
This compares with exporters in the remaining EU countries having to deal with the
consequence of £3.9bn in tariffs on UK bound goods. Germany alone would see vehicle
goods facing £1.8bn in UK tariffs.
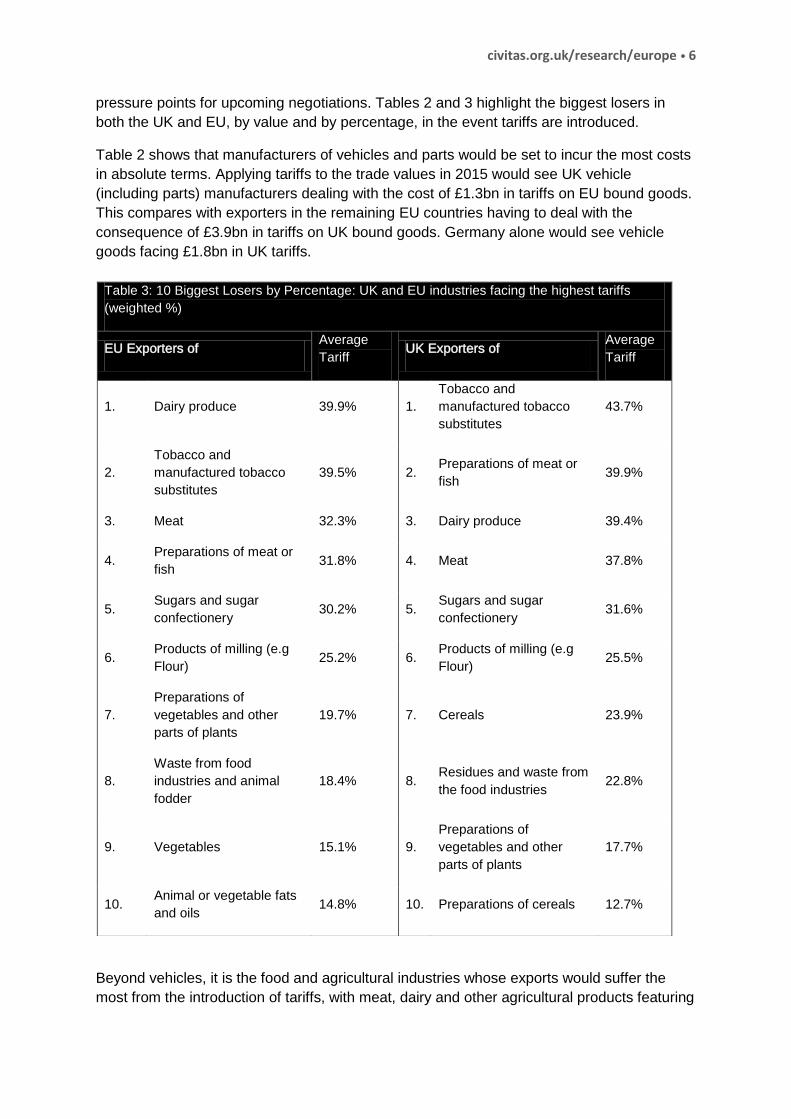
Beyond vehicles, it is the food and agricultural industries whose exports would suffer the
most from the introduction of tariffs, with meat, dairy and other agricultural products featuring
Table 3: 10 Biggest Losers by Percentage: UK and EU industries facing the highest tariffs
(weighted %)
EU Exporters of Average
Tariff UK Exporters of
Average
Tariff
1. Dairy produce 39.9% 1.
Tobacco and
manufactured tobacco
substitutes
43.7%
2.
Tobacco and
manufactured tobacco
substitutes
39.5% 2. Preparations of meat or
fish 39.9%
3. Meat 32.3% 3. Dairy produce 39.4%
4. Preparations of meat or
fish 31.8% 4. Meat 37.8%
5. Sugars and sugar
confectionery 30.2% 5.
Sugars and sugar
confectionery 31.6%
6. Products of milling (e.g
Flour) 25.2% 6.
Products of milling (e.g
Flour) 25.5%
7.
Preparations of
vegetables and other
parts of plants
19.7% 7. Cereals 23.9%
8.
Waste from food
industries and animal
fodder
18.4% 8. Residues and waste from
the food industries 22.8%
9. Vegetables 15.1% 9.
Preparations of
vegetables and other
parts of plants
17.7%
10. Animal or vegetable fats
and oils 14.8% 10. Preparations of cereals 12.7%

civitas.org.uk/research/europe • 7
heavily in the top ten biggest losers. This is more evident when you look at the industries
that will face the highest tariffs in percentage terms. This is important, as a high absolute
amount of tariff costs might simply be a reflection of higher sales volumes.
Table 3 shows the weighted average tariff rates by product type, to indicate the significance
of tariffs for each exporting sector. The biggest losers for both the EU and UK are all
agricultural and food products. Tariffs of around 40 per cent could have a significant effect
on agricultural exports and in the event they were introduced, there would likely be a
significant drop in trade between the EU and UK. The introduction of tariffs on any goods
traded between the UK and the rest of the EU could significantly damage the business of
exporters.
A more detailed breakdown of the aggregate UK and EU figures into the different types of
products, according to the World Customs Organisations Harmonised System 2-digit codes,
is included in the Appendix along with tables showing the top ten biggest losers by value for
each EU country. This analysis allows us to see that for only 14 of the WTO 97 product
groups listed in Table 4 (in the Appendix) will the UK government receive less in tariff
revenues than all governments in the EU combined. This again highlights the fact that the
remaining EU 27, not just the UK, has a great deal to lose if a deal is not struck to continue
free trade across the continent.
Looking further
The static nature of this study means that we have not adjusted for the change in demand
should tariffs be introduced. Normally increases in prices would see demand for products
fall. A fall in sales would likely lead to lower tariff income.
The UK will have the chance to adjust for these changes. It has the opportunity on leaving
the EU to alter its tariff schedule in a manner that is more favourable to UK businesses,
reducing tariffs on input products for UK manufacturers and other products that are not
manufactured in the UK, while keeping tariffs on goods that can be manufactured in the UK
that are perhaps not yet competitively produced. Further still, the depreciation of sterling,
although it will lead to increases in import prices, will reduce the cost of buying goods from
the UK. Both these factors will allow the UK economy to adjust for the introduction of tariffs if
there is no trade agreement.
The EU does not have the opportunity to easily change its tariff schedule and has seen the
euro rise against sterling. This will put pressure on EU manufacturers who export to the UK.
The introduction of tariffs therefore will be harmful to both the remaining EU countries and
the UK, but as an independent country the UK at least will have the ability to adjust.
Beyond the European Union
As it seems to be the case that the government is planning to leave the single market and
customs union our trading relationship with third countries will be dependent on the success
of UK diplomacy rather than our future relationship with the EU. It therefore makes sense to
focus initially on the potential tariff impacts for the UK and EU countries only.
There is a case for looking at tariffs impacts for third countries with which we have an EU
trade agreement currently, but estimates will be highly speculative.

civitas.org.uk/research/europe • 8
Appendix
Table 4 breaks down the import figures and potential tariff costs into aggregates by WTO HS
chapter. In the import columns, if imports by the UK of EU goods are greater than the
corresponding imports by the EU of UK to goods then the value is shaded red, and similarly
if imports by the EU of UK goods are greater than imports by the UK of EU goods. This
represents a trade surplus for EU or UK goods respectively. For the tariff cost columns, the
value of tariffs which is higher by product group (either for EU or UK goods) is shaded red,
representing a higher tariff b urden in absolute monetary terms.
Tables 5 and 6 show the top ten product groups exposed to tariffs in absolute monetary
terms for each EU country, including the UK. Table 5 shows, for each country, the HS
chapter (product group) and the tariff cost estimate in millions of pounds. Table 6 lists the full
description for each HS chapter number.
For example, Table 5 shows us the top two product groups exposed to UK tariffs for Irish
exporters are HS chapters 2 and 4 with estimates of £463 million and £265 million in tariff
costs respectively. Table 6 shows us that these product groups are ‘Meat and edible meat
offal’ and ‘Dairy produce; birds’ eggs; natural honey; edible products of animal origin not
elsewhere specified or included’.
Response to critics (added November 1, 2016)
Some commentators on the first edition of this paper noted that we had not explicitly stated
that consumers ultimately pay import duties.
The purpose of the analysis, as stated in the opening paragraph, was to determine the
potential tariff implications for both UK and EU exporters in the event a free trade deal had
not been reached by the time the UK exits the European Union.
Despite suggestions otherwise, the report does not make an assumption tariffs are paid by
exporters. The failure to explicitly state the fact that tariffs (or customs duties) are paid by the
importer is only a result of a failure to realise it needed stating. The fact that tariffs are paid
by the importer and, as stated, the value of the tariff is calculated based on the import value
(the value the buyer has paid for the good) is not forgotten, and it is the reason the data
published was based on import values (See footnote 3).
However, the impact of tariffs will be shared by both; the consumer, who will either cover the
tariff cost by purchasing the good at a higher price or choose not purchase the product
(potentially buying an alternative); and the exporters, who may find that the tariff leads to a
fall in demand or who may have to adjust their business model in a way that absorbs the
cost and allows them to sell the product at a competitive price despite the tariffs.
The simplest method of looking at the relative impact for exporters for tariffs is to see what
tariffs will have to be paid on their goods. The exact impact of the tariffs for exporters will
vary by product due to varying levels of demand and the availability of substitute products.
These variations, among others, mean it would likely be an impossible task to accurately
model such an impact at an aggregate level, nationally or by product type.

civitas.org.uk/research/europe • 9
The analysis was written on the assumption that exporters, being made aware of the
potential tariffs that would be applied to their goods, could then determine the likely impact of
these tariffs for their own businesses.
The reason for publishing the analysis was to highlight that there will be a cost to both EU
and UK exporters if tariffs are introduced. It is also true that there will be a cost to
consumers, and one could equally write a piece setting out the potential cost to UK
consumers and importers.
One could also use the data to try and determine the potential impact on domestic UK
businesses who may benefit from the protection or may benefit from the removal of tariffs to
the reduce costs of importing goods in the UK.
By publishing the analysis, I hoped to encourage a debate on the potential negative impact
on tariffs for businesses across the UK and EU, in the build up to the EU-UK negotiations.
Indeed, I argue that ‘these tariffs would be a cost to both UK and EU exporters and should
put pressure on both sides in the negotiations to achieve a deal that is in the interest of their
own economies.
I did comment that the fall in sterling and the opportunity to reduce the UK tariff schedule
puts the UK in a position that could help it adjust to the impact of tariffs should they be
applied by the EU to UK goods.
Following on from this, as part of a wider effort to determine how the UK government can
support UK business post Brexit, we are now looking at how specific UK businesses, and
consumers, may benefit from a new UK specific tariff schedule, one in which the UK would
likely see a reductions in tariffs levied on imports, as the current schedule is designed to
offer protection to 28 economies rather than designed in the interests of the UK economy.

civitas.org.uk/research/europe • 10
Product Description (Full description in Table 6) UK Imports
Tariffs
Payable
Estimate
Average
Tariff Rate
EU
Imports
Tariffs
Payable
Estimate
Average
Tariff Rate
Live animals 427 23 5.5% 286 6 2.2%
Meat 3,163 1,023 32.3% 999 378 37.8%
Fish and crustaceans 514 45 8.8% 924 87 9.4%
Dairy produce (including Eggs) 2,394 956 39.9% 840 331 39.4%
Products of animal origin 68 0 0.4% 82 0 0.2%
Live trees and other plants 932 70 7.5% 46 3 6.9%
Edible vegetables 2,154 326 15.1% 204 24 11.8%
Edible fruit and nuts 1,660 168 10.1% 200 15 7.5%
Coffee, tea, maté and spices 396 22 5.6% 191 9 4.7%
Cereals 599 79 13.1% 322 77 23.9%
Products of milling (e.g Flour) 253 64 25.2% 124 32 25.5%
Oil seeds, straw and fodder 318 10 3.3% 217 2 1.1%
Vegetable saps and extracts 68 3 4.6% 32 0 1.4%
Other vegetable products 4 - 0.0% 3 - 0.0%
Animal or vegetable fats and oils 820 122 14.8% 316 28 8.8%
Preparations of meat or fish 1,771 563 31.8% 386 154 39.9%
Sugars and sugar confectionery 719 217 30.2% 310 98 31.6%
Cocoa and cocoa preparations 1,440 16 1.1% 468 6 1.3%
Preparations of cereals, flour, starch or milk; pastrycooks' products 2,554 303 11.9% 953 121 12.7%
Preparations of vegetables, fruit, nuts or other parts of plants 1,893 372 19.7% 352 62 17.7%
Miscellaneous edible preparations 2,140 192 9.0% 889 79 8.9%
Beverages, spirits and vinegar 4,159 240 5.8% 2,148 60 2.8%
Residues and waste from the food industries 1,160 214 18.4% 539 123 22.8%
Tobacco and manufactured tobacco substitutes 333 132 39.5% 208 91 43.7%
Salt; sulphur; earths and stone; plastering materials, lime and cement 265 1 0.5% 264 1 0.3%
Ores, slag and ash 397 - 0.0% 62 - 0.0%
Mineral fuels, oils and products; bituminous substances; mineral waxes 7,684 127 1.7% 15,659 167 1.1%
Inorganic chemicals 1,186 37 3.1% 928 24 2.6%
Organic chemicals 4,010 209 5.2% 3,516 134 3.8%
Pharmaceutical products 16,773 - 0.0% 7,168 - 0.0%
Fertilisers 511 29 5.6% 228 9 3.7%
Dyeing extracts and colouring matter; paints and varnishes; putty and
other mastics; inks1,309 79 6.0% 1,200 72 6.0%
Essential oils and resinoids; perfumery, cosmetic or toilet preparations 2,964 58 1.9% 2,061 37 1.8%
Soap, organic surface-active agents, prepared waxes, candles, modelling
pastes and dental preparations1,357 45 3.3% 920 28 3.1%
Albuminoidal substances; modified starches; glues; enzymes 451 35 7.8% 221 16 7.2%
Explosives; pyrotechnic products; matches; pyrophoric alloys; certain
combustible preparations10 1 6.3% 25 2 6.3%
Photographic or cinematographic goods 211 13 6.2% 268 16 6.1%
Miscellaneous chemical products 2,483 118 4.7% 2,625 113 4.3%
Plastics and articles thereof 8,125 498 6.1% 4,656 286 6.1%
Rubber and articles thereof 1,967 62 3.2% 1,724 54 3.1%
Raw hides and skins (other than furskins) and leather 156 7 4.7% 160 4 2.4%
Articles of leather and articles of animal gut (other than silkworm gut) 993 41 4.1% 296 13 4.2%
Furskins and artificial fur; manufactures thereof 37 1 3.0% 18 0 2.0%
Wood and articles of wood; wood charcoal 2,551 49 1.9% 271 8 3.1%
Cork and articles of cork 23 1 4.2% 1 0 3.9%
Manufactures of straw, of esparto or of other plaiting materials;
basketware and wickerwork6 0 3.3% 2 0 3.8%
EU Goods UK Goods
Table 4. Estimate of annual tariffs payable on UK-EU exports by EU Partner Country (2015, £ millions)

civitas.org.uk/research/europe • 11
Product Description (Full description in Table 6) UK Imports
Tariffs
Payable
Estimate
Average
Tariff Rate
EU
Imports
Tariffs
Payable
Estimate
Average
Tariff Rate
Pulp of wood or of other fibrous cellulosic material; recovered (waste and
scrap) paper or paperboard347 - 0.0% 137 - 0.0%
Paper and paperboard; articles of paper pulp, of paper or of paperboard 3,997 - 0.0% 1,317 - 0.0%
Printed books, newspapers, pictures and other products of the printing
industry566 - 0.0% 932 - 0.0%
Silk 19 1 5.7% 7 0 6.6%
Wool, fine or coarse animal hair; horsehair yarn and woven fabric 156 6 4.1% 143 6 4.5%
Cotton 105 7 6.7% 65 5 7.5%
Other vegetable textile fibres; paper yarn and woven fabrics of paper yarn 26 2 6.2% 8 1 6.5%
Man-made filaments; strip and the like of man-made textile materials 273 15 5.4% 396 22 5.5%
Man-made staple fibres 204 11 5.3% 144 9 6.3%
Wadding, felt and nonwovens; special yarns; twine, cordage, ropes and
cables and articles thereof328 16 4.8% 157 7 4.7%
Carpets and other textile floor coverings 595 47 7.9% 72 6 7.7%
Special woven fabrics; tufted textile fabrics; lace; tapestries; trimmings;
embroidery143 11 7.7% 64 5 7.4%
Impregnated, coated, covered or laminated textile fabrics; textile articles
suitable for industrial use183 12 6.8% 238 17 7.1%
Knitted or crocheted fabrics 60 5 8.0% 65 5 8.0%
Articles of apparel and clothing accessories, knitted or crocheted 1,940 230 11.9% 859 102 11.8%
Articles of apparel and clothing accessories, not knitted or crocheted 2,428 283 11.7% 979 113 11.5%
Other made-up textile articles; sets; worn clothing and worn textile
articles; rags271 28 10.2% 243 21 8.5%
Footwear, gaiters and the like; parts of such articles 1,896 209 11.0% 723 83 11.4%
Headgear and parts thereof 85 3 3.1% 47 1 3.0%
Umbrellas, sun umbrellas, walking sticks, seat-sticks, whips, riding-crops
and parts9 0 4.4% 5 0 4.3%
Prepared feathers and down; artificial flowers; articles of human hair 11 0 2.7% 6 0 2.8%
Articles of stone, plaster, cement, asbestos, mica or similar materials 693 7 1.0% 349 2 0.6%
Ceramic products 748 38 5.1% 141 10 6.8%
Glass and glassware 1,007 49 4.9% 470 23 5.0%
Pearls, precious or semi-precious stones and metals 3,457 33 0.9% 2,085 9 0.4%
Iron and steel 2,714 3 0.1% 2,437 3 0.1%
Articles of iron or steel 3,272 55 1.7% 1,493 32 2.1%
Copper and articles thereof 984 40 4.1% 582 9 1.6%
Nickel and articles thereof 231 3 1.3% 375 2 0.6%
Aluminium and articles thereof 2,186 149 6.8% 1,174 66 5.7%
Lead and articles thereof 31 1 2.7% 155 3 1.9%
Zinc and articles thereof 61 2 3.5% 77 2 2.8%
Tin and articles thereof 28 - 0.0% 41 - 0.0%
Other base metals and cermets 210 9 4.3% 238 11 4.8%
Tools implements of base metal 628 18 2.9% 306 9 3.0%
Miscellaneous articles of base metal 858 21 2.4% 366 9 2.5%
Nuclear reactors, boilers, and mechanical appliances 25,915 366 1.4% 12,739 210 1.7%
Electrical machinery 19,749 477 2.4% 8,385 144 1.7%
Railway or tramway locomotives rolling stock 313 6 2.0% 83 1 1.7%
Vehicles other than railway or tramway rolling stock 43,111 3,896 9.0% 15,439 1,348 8.7%
Aircraft, spacecraft, and parts thereof 3,391 49 1.4% 3,852 63 1.6%
Ships, boats and floating structures 187 2 1.0% 398 4 1.1%
Optical, photographic, cinematographic, measuring, medical instruments
and apparatus6,627 74 1.1% 4,123 52 1.3%
Clocks and watches 504 8 1.5% 102 2 1.5%
Musical instruments 99 3 3.2% 27 1 3.1%
Arms and ammunition 88 2 2.9% 56 1 2.1%
Furniture 3,257 58 1.8% 744 13 1.7%
Toys, games and sports requisites 827 13 1.6% 657 10 1.5%
Miscellaneous manufactured articles 896 25 2.8% 259 8 3.0%
Works of art, collectors' pieces and antiques 1,432 - 0.0% 138 - 0.0%
TOTAL 220,551 12,861 5.8% 117,210 5,220 4.5%
EU Goods UK Goods

civitas.org.uk/research/europe • 12

civitas.org.uk/research/europe • 13

civitas.org.uk/research/europe • 14
01 Live animals
02 Meat and edible meat offal
03 Fish and crustaceans, molluscs and other aquatic invertebrates
04 Dairy produce; birds' eggs; natural honey; edible products of animal origin, not elsewhere specified or included
05 Products of animal origin, not elsewhere specified or included
06 Live trees and other plants; bulbs, roots and the like; cut flowers and ornamental foliage
07 Edible vegetables and certain roots and tubers
08 Edible fruit and nuts; peel of citrus fruit or melons
09 Coffee, tea, maté and spices
10 Cereals
11 Products of the milling industry; malt; starches; inulin; wheat gluten
12 Oil seeds and oleaginous fruits; miscellaneous grains, seeds and fruit; industrial or medicinal plants; straw and fodder
13 Lac; gums, resins and other vegetable saps and extracts
14 Vegetable plaiting materials; vegetable products not elsewhere specified or included
15 Animal or vegetable fats and oils and their cleavage products; prepared edible fats; animal or vegetable waxes
16 Preparations of meat, of fish or of crustaceans, molluscs or other aquatic invertebrates
17 Sugars and sugar confectionery
18 Cocoa and cocoa preparations
19 Preparations of cereals, flour, starch or milk; pastrycooks' products
20 Preparations of vegetables, fruit, nuts or other parts of plants
21 Miscellaneous edible preparations
22 Beverages, spirits and vinegar
23 Residues and waste from the food industries; prepared animal fodder
24 Tobacco and manufactured tobacco substitutes
25 Salt; sulphur; earths and stone; plastering materials, lime and cement
26 Ores, slag and ash
27 Mineral fuels, mineral oils and products of their distillation; bituminous substances; mineral waxes
28 Inorganic chemicals; organic or inorganic compounds of precious metals, of rare-earth metals, of radioactive elements or of isotopes
29 Organic chemicals
30 Pharmaceutical products
31 Fertilisers
32Tanning or dyeing extracts; tannins and their derivatives; dyes, pigments and other colouring matter; paints and varnishes; putty and other mastics;
inks
33 Essential oils and resinoids; perfumery, cosmetic or toilet preparations
34Soap, organic surface-active agents, washing preparations, lubricating preparations, artificial waxes, prepared waxes, polishing or scouring
preparations, candles and similar articles, modelling pastes, ‘dental waxes’ and dental preparations with a basis of plaster
35 Albuminoidal substances; modified starches; glues; enzymes
36 Explosives; pyrotechnic products; matches; pyrophoric alloys; certain combustible preparations
37 Photographic or cinematographic goods
38 Miscellaneous chemical products
39 Plastics and articles thereof
40 Rubber and articles thereof
41 Raw hides and skins (other than furskins) and leather
42 Articles of leather; saddlery and harness; travel goods, handbags and similar containers; articles of animal gut (other than silkworm gut)
43 Furskins and artificial fur; manufactures thereof
44 Wood and articles of wood; wood charcoal
45 Cork and articles of cork
46 Manufactures of straw, of esparto or of other plaiting materials; basketware and wickerwork
47 Pulp of wood or of other fibrous cellulosic material; recovered (waste and scrap) paper or paperboard
48 Paper and paperboard; articles of paper pulp, of paper or of paperboard
49 Printed books, newspapers, pictures and other products of the printing industry; manuscripts, typescripts and plans
Table 6: 2-digit HS Chapter Product Despriction

civitas.org.uk/research/europe • 15
50 Silk
51 Wool, fine or coarse animal hair; horsehair yarn and woven fabric
52 Cotton
53 Other vegetable textile fibres; paper yarn and woven fabrics of paper yarn
54 Man-made filaments; strip and the like of man-made textile materials
55 Man-made staple fibres
56 Wadding, felt and nonwovens; special yarns; twine, cordage, ropes and cables and articles thereof
57 Carpets and other textile floor coverings
58 Special woven fabrics; tufted textile fabrics; lace; tapestries; trimmings; embroidery
59 Impregnated, coated, covered or laminated textile fabrics; textile articles of a kind suitable for industrial use
60 Knitted or crocheted fabrics
61 Articles of apparel and clothing accessories, knitted or crocheted
62 Articles of apparel and clothing accessories, not knitted or crocheted
63 Other made-up textile articles; sets; worn clothing and worn textile articles; rags
64 Footwear, gaiters and the like; parts of such articles
65 Headgear and parts thereof
66 Umbrellas, sun umbrellas, walking sticks, seat-sticks, whips, riding-crops and parts thereof
67 Prepared feathers and down and articles made of feathers or of down; artificial flowers; articles of human hair
68 Articles of stone, plaster, cement, asbestos, mica or similar materials
69 Ceramic products
70 Glass and glassware
71Natural or cultured pearls, precious or semi-precious stones, precious metals, metals clad with precious metal, and articles thereof; imitation jewellery;
coin
72 Iron and steel
73 Articles of iron or steel
74 Copper and articles thereof
75 Nickel and articles thereof
76 Aluminium and articles thereof
78 Lead and articles thereof
79 Zinc and articles thereof
80 Tin and articles thereof
81 Other base metals; cermets; articles thereof
82 Tools, implements, cutlery, spoons and forks, of base metal; parts thereof of base metal
83 Miscellaneous articles of base metal
84 Nuclear reactors, boilers, machinery and mechanical appliances; parts thereof
85Electrical machinery and equipment and parts thereof; sound recorders and reproducers, television image and sound recorders and reproducers, and
parts and accessories of such articles
86Railway or tramway locomotives, rolling stock and parts thereof; railway or tramway track fixtures and fittings and parts thereof; mechanical (including
electromechanical) traffic signalling equipment of all kinds
87 Vehicles other than railway or tramway rolling stock, and parts and accessories thereof
88 Aircraft, spacecraft, and parts thereof
89 Ships, boats and floating structures
90 Optical, photographic, cinematographic, measuring, checking, precision, medical or surgical instruments and apparatus; parts and accessories thereof
91 Clocks and watches and parts thereof
92 Musical instruments; parts and accessories of such articles
93 Arms and ammunition; parts and accessories thereof
94Furniture; bedding, mattresses, mattress supports, cushions and similar stuffed furnishings; lamps and lighting fittings, not elsewhere specified or
included; illuminated signs, illuminated nameplates and the like; prefabricated buildings
95 Toys, games and sports requisites; parts and accessories thereof
96 Miscellaneous manufactured articles
97 Works of art, collectors' pieces and antiques
Table 6: 2-digit HS Chapter Product Despriction

Author
Justin Protts is a Civitas Research Fellow. He can be emailed at [email protected]
and tweets @Justin_Protts.
55 Tufton Street, London SW1P 3QL
T: 020 7799 6677 E: [email protected] Civitas: Institute for the Study of Civil Society is an independent think tank which seeks to facilitate informed public debate. We search for solutions to social and economic problems unconstrained by the short-term priorities of political parties or conventional wisdom. As an educational charity, we also offer supplementary schooling to help children reach their full potential and we provide teaching materials and speakers for schools. Civitas is a registered charity (no. 1085494) and a company limited by guarantee, registered in England and
Wales (no. 04023541).