Embed Size (px)
Citation preview

J. Sci. Tech. Env. Info. 01(01): 1-15, 2014 | Siddique et al.
Published with open access at www.journalbinet.com 1
Volume 01, Issue 01, Article No. 1, pp. 1-15 Siddique et al., 2014 http://www.journalbinet.com/current-issue-jstei.html Original Research Paper
Potential of soil sensor EM38 measurements for soil fertility mapping in the Terrace soil of Bangladesh
Md. Noor-E-Alam Siddique, Mohammad Monirul Islam1, Jakia Sultana2, Md. Kamaruzzaman3 and Md. Abdul Halim4
Soil Resource Development Institute (SRDI), Ministry of Agriculture, District Office, Pabna
Dept. of Agronomy, Bangladesh Agricultural University, Mymensingh1
Wageningen University, the Netherlands2
SRDI, Regional office, Rajshahi3
SRDI, District office, Dinajpur, Bangladesh4
Article Info
ABSTRACT
Key Words:
Terrace soil Soil sensor EM38 Apparent electrical conductivity (ECa) Variogram and Kriging Soil Mapping
Received: 05.10.2014 Accepted: 10.11.2014 Published: 20.11.2014
An assessment of field-scale variation of apparent electrical conductivity
(ECa) survey and characterization of correlated soil property was
investigated for mapping of a terrace soil in Bangladesh. The
electromagnetic induction (EMI) technique was applied by a soil sensor,
EM38 which provide ancillary ECa data sets accurately. Survey was
supported by soil sampling to assure the reliability and potential of ECa
measurements for soil mapping. Study site consisted of a shallow depth
clay substratum. ECa readings in mS m-1 ranged from 40 to 64 and 32 to 53
in the vertical (ECa-V) and horizontal (ECa-H) orientation of measurement
respectively. ECa readings correlated best with soil property such as top-,
sub-, and deepsoil texture (clay and sand), and topsoil chemical property, i.
e., pH, CEC, Ca2+ and Mg2+. A modest correlation was found between ECa-V
and the subsoil clay (r = 0.78), and ECa-V and the subsoil sand (r = - 0.84).
The variogram analysis revealed that a large portion of the total variation
of soil property (about 70 %) was accounted by the spatially structured
component of the variogram. The study findings have brought an
expectation that soil mapping through ECa measurement is possible in
Bangladesh. For mapping, the ECa-V measurement in the terrace soil is
more predictive than ECa-H. The maps of ECa can fairly represent the
spatial variation of soil properties such as texture, chemical fertility and
organic matter content.
*Contact author: [email protected]
Citation (APA): Siddique, M. N. A., Islam, M. M., Sultana, J., Kamaruzzaman, M. & Halim, M. A., (2014). Potential of soil sensor EM38 measurements for soil fertility mapping in the Terrace soil of Bangladesh. Journal of Science, Technology & Environment Informatics, 01(01), 1–15.
J. Sci. Tech. Env. Info. 01(01): 1-15, 2014 | Siddique et al.
Published with open access at www.journalbinet.com 2
© 2014, Journalbinet. This is an open access article distributed under the terms of the Creative Common Attribution 4.0 International License.
I. Introduction
Conventional agriculture and mono-culture of rice has caused degradation of agricultural land in Bangladesh. Chemical fertilizer based soil fertility management is commonly practiced which is inefficient. Land degradation and soil fertility decline has evident in many parts of Bangladesh (FRG, 2012). It is imperative to conduct soil characterization at preferred scale for better understanding, soil management and sustainable use of resource. Bangladesh comprises of three major physiographic units, Holocene floodplain (80 %), Tertiary hills (12 %) and Pleistocene terraces (8 %) with a total land area of 147,570 km2 (BBS, 2008). The terrace area representing the second largest agriculturally important land type comprises of the Barind Tract (BT), Madhupur Tract and Akhaura Terrace. Within the BT, three major sub-units can be recognized mostly to the north-west of the country: level BT, high BT and north-eastern BT. The soil of the BT classified as deep and shallow grey terrace soil which are poorly drained, and has silty topsoil with mottled grey subsoil overlying a tertiary clay substratum. The level BT occupies about 80 % of BT and consists of 60-90 cm local differences in elevation (Bramer, 2002 and 1996; Saheed, 1992). The agricultural activities in level BT mainly depend on seasonal rains. The soil bears poor natural fertility, low water holding capacity, low structural stability in topsoil and low organic matter with deficiency of plant nutrients, and considered as problem soil of Bangladesh (Bramer, 1996 and USG-Birol, 2008). To find out a suitable combination of agronomic practice, to overcome the principal constraint of moisture and fertility various research activities and technology transfer (BMDA, 2010; Orr et. al., 2008; Ali, 2007) are usually found in BT region, which intend to increase crop production through cropping intensity and diversification. Food security and sustained production of BT areas require sufficient inputs, proper management practice and preferred management of soil. Therefore, this study is conducted in BT to characterize the soil through soil fertility mapping, which will facilitate management decision and optimize inputs requirement. Semi-detail soil survey reports including a thematic polygon map (1:50,000) derived from a conventional survey are available for the area that belongs to the study site. The soils are grouped according to soil series having similar texture, drainage, parent material and use potentials (Saheed, 1992). Due to lack of quantitative observation, the descriptions about soil attributes are inadequate, and boundaries of such map represent abrupt discontinuity whereas soil attributes are heterogeneous and continuous in nature. Furthermore, spatial variability occurs due to numerous soil processes acting simultaneously, and the prevailing uniform management of fields does not take into account the spatial variability, which is not the preferred way of soil management. Hence, a quick and less expensive method of survey capable of generating quantitative data is required to assess soil spatial variability through detailed soil mapping. Geospatial methods such as electromagnetic induction based sensing are capable of producing exhaustive and accurate reliable measurements related to soil attributes over large areas in a rapid and cost effective way. Apparent soil electrical conductivity (ECa) survey information has been widely used to measure various soil physico-chemical properties and subsequent soil mapping (Moral et. al., 2010; Corwin and Lesch, 2005) such as moisture content (Billal, 2008; Sheets and Hendrickx, 1995), and texture, organic matter and CEC (Moral et. al., 2010; Kühn et. al., 2009; Triantafilis and Santos, 2009; Triantafilis et. al., 2009; Sudduth et. al., 2005). The ECa survey measurements provide the basis for detailed soil mapping to investigate the spatial heterogeneity of the soil characteristics. ECa Survey has never been implemented in Bangladesh until the year 2009, and there remains a potential of quantitative soil mapping using non-invasive electromagnetic induction soil sensor information for characterization of the terrace soils of Bangladesh. The study was conducted to explore the potential of ECa survey and to assess the value of ECa survey to generate detailed soil property maps for soil under paddy cultivation, and to investigate the nature and extent of correlation of ECa with soil physico-chemical properties.

J. Sci. Tech. Env. Info. 01(01): 1-15, 2014 | Siddique et al.
Published with open access at www.journalbinet.com 3
II. Materials and Method
Location: The study site lies between latitude 25° 39' 29" N and longitude 88° 35' 44" E of Birol upazila, Dinajpur district in Bangladesh during July 2009. Geology of terrace soils: Terrace soils/Barind Tracts (BT) are in the Pleistocene physiographic unit which occupies a nearly level to gently undulating landscape. Soil is mostly made up of older alluvium which differs from the surrounding floodplain. It comprises of three major sub-units: level, high and north-eastern BT. BT is floored by Pleistocene sediments which is compact and sticky known as the Madhupur Clay (MC). This semi-consolidated substratum is variably weathered, brown or yellowish brown in colour, deeply oxidised and assumed to be of fluvial origin and deposited towards the end of the last glacial period. Major part of this tract is poorly drained, mottled silty top soils merged with MC at shallower depth. The BT is fragmented, being made up separate uplifted fault blocks in the north eastern part of the country. It covers a total area of approximately 7,770 km² (Brammer, 2002 and 1996; Ibrahim and Baset, 1973). The soil is imperfectly to poorly drained developed in shallowly weathered MC in level areas of the BT. The top soil is silty and light grey, generally brightly oxidised with yellowish brown mottles along cracks and root channels, and bears low level of organic matter. The soil of studied area belongs to ‘Amnura’ soil series and subgroup - Aeric Haplaquept and order - Inceptisols in the USDA Soil Taxonomy. The cultivated layer is puddle and reduced in the monsoon season and under irrigated rice in the dry season. The soil becomes white and powdery when dry. The reaction is medium or strongly acidic when dry but the surface layer becomes neutral in reduced condition. The subsoil has a mixed yellowish brown and grey, red mottled, silty loam or silty clay loam texture which is commonly friable and porous. The soil shows a pronounced increase in mottles and clay content with depth. The substratum is strongly structured and compacted heavy plastic clay. The soil bears low natural fertility and has low moisture holding capacity. The low structural stability of the top soil and presence of a ploughpan which is beneficial for transplanted paddy but providing severe limitations for dry land crops (Brammer, 2002 and 1996; Ibrahim and Baset, 1973). Electromagnetic induction (EMI) survey: Soil conductivity sensor used in this research was EM38, which is a non-invasive proximal soil sensor. The ECa survey was conducted on the July 25, 2009 and point measurements were taken in grid spacing of 17 by 10 m from a wet field. The calibration was done according to the steps described in the EM38 operating manual. ECa data in mS m-1 were recorded on a laptop computer. The EM38 was operated in both measurement modes, i.e., horizontal orientation (ECa-H) and vertical orientation (ECa-V). All the measurements were duly geo-referenced with a highly sensitive GPS manufactured by Navilock®. ECa data are expressed at 25 °C (Sheets and Hendrix, 2005), during the ECa measurements soil temperature was recorded at 20 cm depth using a soil thermometer. As the temperature of the soil was stable at 25.3 °C, no temperature correction of ECa data was required. Soil sampling design: The field was sampled according to a grid sampling design at 104 locations on a 17 by 10 m grid basis from a representative area of 2.02 ha. Composite soil samples were collected from a radius of 1 m. Soil samples were taken at three depth increments (0-30 cm, 30-60 cm and 60-90 cm) through augering from the marked geo-referenced locations the week following the ECa survey. The samples were analyzed by Central laboratory, Soil Resource Development Institute, Bangladesh. Soil physical and chemical analysis: Texture was determined by Hydrometer method described by Day, 1965. The following USDA size fractions were determined: Sand (>50 µm), Silt (2-50 µm) and Clay (<2 µm). The pH was determined by a glass-electrode pH meter in the soil suspension having a soil: water ratio of 1:2.5, after 30 minutes of shaking. Dry combustion method was used for determination of organic matter. Total nitrogen content of soils was determined by the Kjeldahl digestion method. The available P content was determined by the Bray and Kurtz (1945) method. Cation exchange capacity (CEC) was calculated by the methods described by Hendershot and Duquette, 1986. For determination of
Potassium (K+), Calcium (Ca2+) and Magnesium (Mg2+), ammonium acetate (NH4OAc) extract method was used, and the amounts of K determined by flame emission, and Ca2+ and Mg2+ determined by atomic

J. Sci. Tech. Env. Info. 01(01): 1-15, 2014 | Siddique et al.
Published with open access at www.journalbinet.com 4
absorption spectroscopy (AAS) (Knudsen et. al., 1982). Base saturation was calculated as, % Base saturation = [(Ca2++ Mg2++ K+)/CEC]*100. Geostatistical analysis: The data analyses were conducted in three stages: i) Distribution was analyzed by classical statistics (mean, median, maximum, minimum, variance, standard deviation, skewness, kurtosis and coefficient of variation, frequency from histograms and scatter plots). Skewness is considered as the most common form of departure from normality. The exploratory statistical analyses were performed by PASW 18.0 (Predictive Analytics SoftWare) Statistics, ii) to find out the spatial structure of the selected soil properties, variography was used, variograms were calculated and modelled with VARIOWIN 2.2 software (Pannatier, 1996) and iii) kriged maps of spatial distribution of selected soil properties were constructed using SURFER Version 9.2 software (Golden Software, Inc.). Ordinary kriging method was used throughout. Spatial variation through variography: Geostatistics view soil properties as continuous variables and models these as realizations of a random function or a random process (Webster, 2001). To characterize a random function assumptions are limited to the intrinsic hypothesis. The intrinsic hypothesis assumes stationarity of the first- and second-order moments of the increments [Z(x+h)-Z(x)] of the random function, where x is the location vector and h is a spatial lag. This implied that the expected value of the increments [Z(x+h)-Z(x)] is zero and their variance exists and both are independent of the position x. The two conditions are expressed as follows: [Z(x+h)-Z(x)] = 0 x
Var [Z(x+h)-Z(x)] = E [(Z(x+h)-Z(x)) 2] = 2 γ (h) x
Where, γ (h) is the semivarience, mostly called the (semi) variogram. The semivarience measures the average dissimilarity between data separated by vector h and can be calculated based on a series of observations z (xα) (Goovaerts, 1997):
Where, γ (h) is the calculated semivariance for a lag vector h between observations z (xα) and z ( +h)
and N (h) the number of pairs of observations separated by h. Ideally pairs of observations close together should have a smaller semi-variance, whereas pairs of observations farther away from each other should display a large semi-variance. A plot of the calculated γ(h) versus h yields the experimental variograms to which a theoretical model is fitted. Four of the most common variograms models are the spherical, the exponential, the gausian and the linear model (Burrough, 1993). Unlike the first three model types, the linear model describes an unbounded variogram meaning that the variograms increases with increasing lag distance. Bounded variograms are characterized by three parameters which describe the spatial variance across the study area: the nugget variance (C0), the sill variance (C0+ C1) and the range (r). In theory, the semi-variance at h = 0 is zero, but it is often found as the lag distance approaches zero, the semi-variance remains a positive value, called the nugget. The nugget is the intercept of the variogram with the Y-axis and represents unexplained spatiality dependent variation (micro variability at distances closer than the smallest sampling lag) or purely random variance (like measurement or sample error). The semi-variance increases with increasing lag until it stabilizes to a maximum, the still variance. The lag distance at which the still is reached is called the range. The still is the a priori sample variance σ2 and the range represents the limit of the spatial dependence since at that distance the autocorrelation become zero. Beyond the range, the expected difference between two observations is maximum (equalling the sill) and independent of the lag distance between them. At distances smaller than the range there exist a spatial dependence between two observations which increases with an increasing lag distance. So the variograms describes the pattern of spatial variability in terms of its magnitude, scale and general form (Oliver, 1987).

J. Sci. Tech. Env. Info. 01(01): 1-15, 2014 | Siddique et al.
Published with open access at www.journalbinet.com 5
Spatial prediction through Kriging: Kriging is a geostatistical tool for the prediction of the value of a variable at an unsampled location on the basis of sample observations made in its neighbourhood. It is a weighted linear estimator where the weights are derived using the variogram ensuring an unbiased estimation with a minimum estimation error (Webster and Oliver, 1990). Kriging provides a Best Linear Unbiased Estimator (BLUE) (Burrough and McDonnel, 1998). A variety of Kriging algorithms are available, such as ordinary and simple Kriging use the target (primary) variable to make predictions. On the other hand, techniques such as co-kriging use the joint spatial variation of the target variables and densely measured ancillary variables, such as ECa, to improve the prediction accuracy. In this dissertation, ordinary Kriging was used as a common methodology for the prediction of soil variables. The probabilistic interpolators aim to give optimal representation of the stochastic part of the regionalized variable, the local interpolator is extended to a more geostatistical form giving general Kriging equation. Consider a random variable Z that has been measured at n locations, z (xα), α = 1,…, n, the Kriging estimator at an unsampled location x0 can be written as:
Where z (xα) is the number of neighbourhood measurements Z(xα) used for estimating Z*(x0), λα are the weights assigned to data Z(xα) which are considered to be a realization of the random variable Z, and m(x0) and m(xα) are the expected values (or means) of Z*(x0) and Z(xα), respectively. The eights are calculated minimizing the estimation error variance: s2(x0) = E [{Z* (x0) - Z(x0)}] 2
Under the condition of unbaisedness: E [Z* (x0) - Z(x0)] = 0 Ordinary Kriging (OK): Ordinary Kriging is the most common type of Kriging used in geostatistics and it serves to estimate a value at a point of a region for which a variogram is known using data in the neighbourhood of the estimation location. However it assumes the mean of the observations to be unknown but locally stationary. The ordinary Kriging estimator can be written as:
Where n ( ) is the number of observations in the local neighbourhood around and λi are the weights
assigned to each of these observations which results the expected interpolation.
III. Results and Discussion Soil chemical properties
Geo-referenced ECa measurements were taken including a total of 312 soil samples. The spatial variability of the soil properties were discussed according to topsoil (0-30 cm), subsoil (30-60 cm) and deepsoil (60-90 cm) characteristics. Chemical properties showed larger within-field variability for all properties except total N which was further explained by their relatively higher CV`s (Table 1). Soil featured a high level of acidity (mean pH 5.07) and low level of organic C (mean 8.45 g kg-1) which varied greatly from 3.90 to 18.26 g kg-1. A medium level of CEC (mean 12.63 cmol+ kg-1) was found. The percentage of base saturation in the investigated site varied from 23 to 43 % with a mean of 32 %. The total N was found to be low and available P was in an optimum level. The level of exchangeable cation, Ca2+ was observed to be medium while the level of Mg2+ and K+ were low. The levels of chemical property were determined according to Fertilizer Recommendation Guide, 2005 of Bangladesh. Frequency distributions of examined properties are shown in Figure 01.
with

J. Sci. Tech. Env. Info. 01(01): 1-15, 2014 | Siddique et al.
Published with open access at www.journalbinet.com 6
Table 1. Descriptive statistics of topsoil chemical properties in the terrace site, n = 104
Variable Units Mean Median Min Max Variance Std.
dev.
Skewness Kurtosis CV (%)
pH water 5.07 5.00 4.30 6.20 0.19 0.44 0.33 -0.90
9
Organic C
g kg-1 8.45 7.67 3.90 18.26 7.89 2.81 1.33 1.88
33
Total N
g kg-1 1.16 1.20 0.30 2.30 0.23 0.48 0.03 -0.86
4
Avil. P
mg kg-1 19.43 19.97 11.67 26.94 11.37 3.37 0.23 -0.59
17
CEC
cmol+ kg-1
12.63 12.50 8.50 17.30 4.02 2.00 0.37 -0.60 16
Ca2+
cmol+ kg-1 3.10 2.93 2.11 4.74 0.32 0.57 0.64 -0.29 18
Mg2+
cmol+ kg-1 0.83 0.84 0.21 1.32 0.07 0.26 -0.26 -0.76 31
K+
cmol+ kg-1 0.14 0.13 0.07 0.31 0.00 0.04 1.35 3.04 29
Base
saturation
% 32 32 23 43 13.54 3.68 0.27 0.47
12
(a) (b)
(c) (d)

J. Sci. Tech. Env. Info. 01(01): 1-15, 2014 | Siddique et al.
Published with open access at www.journalbinet.com 7
(e)
Apparent electrical conductivity (ECa)
The ECa measurements were approximately of symmetrical distribution and skewed to the right. The ECa readings ranged from 32 to 53 mS m-1 and 40 to 64 mS m-1 for the horizontal and vertical orientation of measurement respectively. The readings of ECa-V measurement were relatively larger than those of the simultaneous ECa-H (Table 2). The coefficients of variation (CV`s) were in the same order in both orientations. The two orientations ECa measurement were well correlated with a linear positive correlation coefficient of r = 0.81. Table 2. Descriptive statistics of ECa (mS m-1) measurements in the terrace site
Variable N Mean Median Min Max Variance Std.dev. Skewness Kurtosis CV (%)
ECa-H 104 39.3 38 32 53 22.83 4.78 0.88 0.41 10
ECa-V 104 49.4 49 40 64 26.49 5.15 0.63 0.09 10
ECa-H and ECa-V, apparent ECa measured in the horizontal and vertical mode respectively.
Correlation coefficients of ECa with textural and chemical soil properties
ECa and texture: Pearson product moment (r) correlations were calculated between ECa and textural fractions, as shown in table 3. The scatter plots are shown in figure 12. The best positive linear correlation (r = 0.78) occurred between ECa-V and subsoil clay. The correlation between ECa-V and deepsoil (r = 0.68) nearly coincided with subsoil clay while the correlation with topsoil clay was relatively lower (r = 0.57). The negative correlation coefficients between ECa-V and the sand fractions were r = - 0.60, r = - 0.84 and r = - 0.75 for the top-, sub- and deepsoil sand respectively. These correlations were likely due to an evident increase of clay throughout the examined depth in the reference site. The weight of r values were corresponded with increasing clay and indicated the importance of clay content in determining soil ECa readings for non-saline soil (Kühn et. al., 2009; Triantafilis et. al., 2009; Bronson et. al., 2005). In addition, the spatial variation in the ECa readings is controlled mainly by clay content and mineralogy for soils in a humid climate containing negligible amounts of salts (Lesch et. al., 2005; Auerswald et. al., 2001). The similar trends of correlations were observed for ECa-H but the strength was relatively lower than the ECa-V, as shown in table 4. The kriged map of ECa-V more closely reflects the spatial distribution of subsoil and deepsoil clay than the ECa-H map. More specifically, the survey provides fairly representative soil ECa-V map of the spatial
Figure 01. Histograms of a) Ca2+ (cmol+ kg-1), b) Mg2+
(cmol+ kg-1), c) Organic C (g kg-1) d) Base saturation
(%) and e) ECa-V

J. Sci. Tech. Env. Info. 01(01): 1-15, 2014 | Siddique et al.
Published with open access at www.journalbinet.com 8
extent and magnitude of clay and sand content of the reference site. Furthermore, the EM38 readings measured in the vertical dipole mode were more predictive than the horizontal dipole mode readings. Table 3. Pearson correlations (r) of ECa and textural fractions in the terrace site, n = 104
ECa-V ECa-H T_clay S_clay D_clay T_ silt S_silt D_ silt T_ sand S_ sand D_ sand
ECa-V 1 0.81** 0.57** 0.78** 0.68** 0.47** 0.66** 0.45** -0.60** -0.84** -0.75**
ECa-H 1 0.50** 0.60** 0.58** 0.28* 0.61** 0.44* -0.43* -0.70** -0.65**
T_clay 1 0.62** 0.57** 0.50** 0.35* 0.25* -0.80** -0.56** -0.53**
S_clay 1 0.63** 0.45* 0.56** 0.35** -0.59** -0.88** -0.63**
D_clay 1 0.43* 0.50** 0.33** -0.54** -0.64** -0.87**
T_silt 1 0.41* 0.36** -092** -0.49** -0.49*
S_silt 1 0.43* -0.45** -0.87** -0.57**
D_silt 1 -0.37* -0.45* -0.74**
T_sand 1 0.61** 0.58**
S_sand 1 0.69**
D_sand 1
ECa-H and ECa-V (mS m-1), ECa measured in the horizontal and vertical mode respectively and P ≤ 0.01**, 0.05*.
ECa and chemical properties: The association between ECa and the examined chemical properties were reflected by the pearson product moment (r) correlation coefficient as shown in table 4. The scatter plot between ECa-V and CEC is shown in figure 02d. Table 4. Pearson correlations of ECa and topsoil chemical properties in the terrace site, n = 104
Variable ECa-V ECa-H OC CEC Ca2+ Mg2+ K+ BS Total N P pH
ECa-V 1 0.81** 0.16 0.53** 0.51** 0.66** -0.17 0.23* -0.27** -0.14 0.46**
ECa-H 1 0.03 0.43** 0.40** 0.50** -0.27** 0.14 -0.34** -0.18 0.36**
OC 1 0.64** 0.51** 0.33** 0.55** -0.04 0.43** -0.15 0.28**
CEC 1 0.76** 0.58** 0.23* -0.12 0.02 -0.22* 0.45**
Ca2+ 1 0.53** 0.19 0.48** 0.02 -0.24* 0.53**
Mg2+ 1 0.08 0.42** -0.12 -0.05 0.29**
K+ 1 0.05 0.62** 0.03 0.14
BS 1 -0.03 -0.03 0.20*
Total N 1 0.18 0.04
P 1 -0.14
pH 1
ECa-H and ECa-V (mS m-1), apparent ECa measured in horizontal and vertical mode respectively; OC, % organic C; CEC (cmol+ kg-1), cation exchange capacity; Exchangeable Ca2+, Mg2+ and K+ (cmol+ kg-1) ; BS, % Base saturation; Total N (g kg-1); Available P (mg kg-1); pH water, 1 : 2.5 and P ≤ 0.01**, 0.05*.

J. Sci. Tech. Env. Info. 01(01): 1-15, 2014 | Siddique et al.
Published with open access at www.journalbinet.com 9
Positive linear correlation coefficients (r = 0.46, r = 0.53, r = 0.51 and r = 0.66) were found between ECa-V, and pH, CEC, Ca2+ and Mg2+ respectively (Table 04). Corwin and Lesch (2005) reported pH, CEC and Mg2+ to be related with ECa measurements while McBride et. al. (1990) and Triantafilis et. al. (2009) related ECa measurements to CEC, and exchangeable Ca2+ and Mg2+. Furthermore, correlations of ECa with clay content and CEC were generally highest and most persistent. It may be feasible to develop relationships between ECa and clay, and CEC that are applicable across a wide range of soil and climatic conditions (Sudduth et. al., 2005). However, the correlation coefficients were relatively higher for ECa-V than the ECa-H in the reference site. The observed correlations suggest that ECa-based sample design will provide a better spatial representation for those four properties. The weakly correlated properties were organic C, K+, base saturation, total N and available P.
(a)
(b)
(c)
(d)
Figure 02. Scatter plots between ECa-V and a) topsoil, b) subsoil, c) deepsoil clay and d) CEC Spatial variability and Mapping
Mapping of ECa measurements: The horizontal and vertical ECa data sets were modeled with omni-directional spherical variograms (Figure 3). The model parameters were listed in table 6. The spatial variability of ECa showed ranges of 27 m and 30 m of approximate distance at which spatial autocorrelation between data points pairs ceases or becomes much more variable for ECa-H and ECa-V respectively. The relative nugget effects (RNE), i. e., the ratio of nugget variance to the total variance (the sill), were found nearly similar which indicated that spatial variability of ECa approximately highly structured by the fitted models. Furthermore, the variograms had a strong spatial structure as only 32 % and 30 % of the variability remain unaccountable or the variance not attributable to spatial dependence. However, the data sets were kriged to construct their continuous surface soil ECa maps

J. Sci. Tech. Env. Info. 01(01): 1-15, 2014 | Siddique et al.
Published with open access at www.journalbinet.com 10
(Figure 04 and 05) where the ordinary kriging interpolation technique was used. The map of ECa-H and ECa-V with grid geometry 1 by 1 m showed similar pattern and mutual integrity. Table 6. Model parameters of the fitted omni-directional spherical variograms
Variogram parameters
Variable C0, nugget variance (mSm-1)2
C, sill (mSm-1)2
h, range (m)
RNE, relative nugget effect (%)
ECa-H 6.7 21.1 27 32
ECa-V 6.7 22.6 30 30 This spatial distribution of clay fairly reflected in the ECa maps (Figure 04 & 05)as those areas showed higher ECa response where the clay content is higher shown by dotted lines and arrows in figure 04 and 05. In addition, the clay content in three depths found lower along the southern border extending to centre of the field which is fairly reflected by relatively lower ECa response in the ECa maps.
(a)
(b) Figure 03. Variograms of a) ECa-H and b) ECa-V
(a) (b)

J. Sci. Tech. Env. Info. 01(01): 1-15, 2014 | Siddique et al.
Published with open access at www.journalbinet.com 11
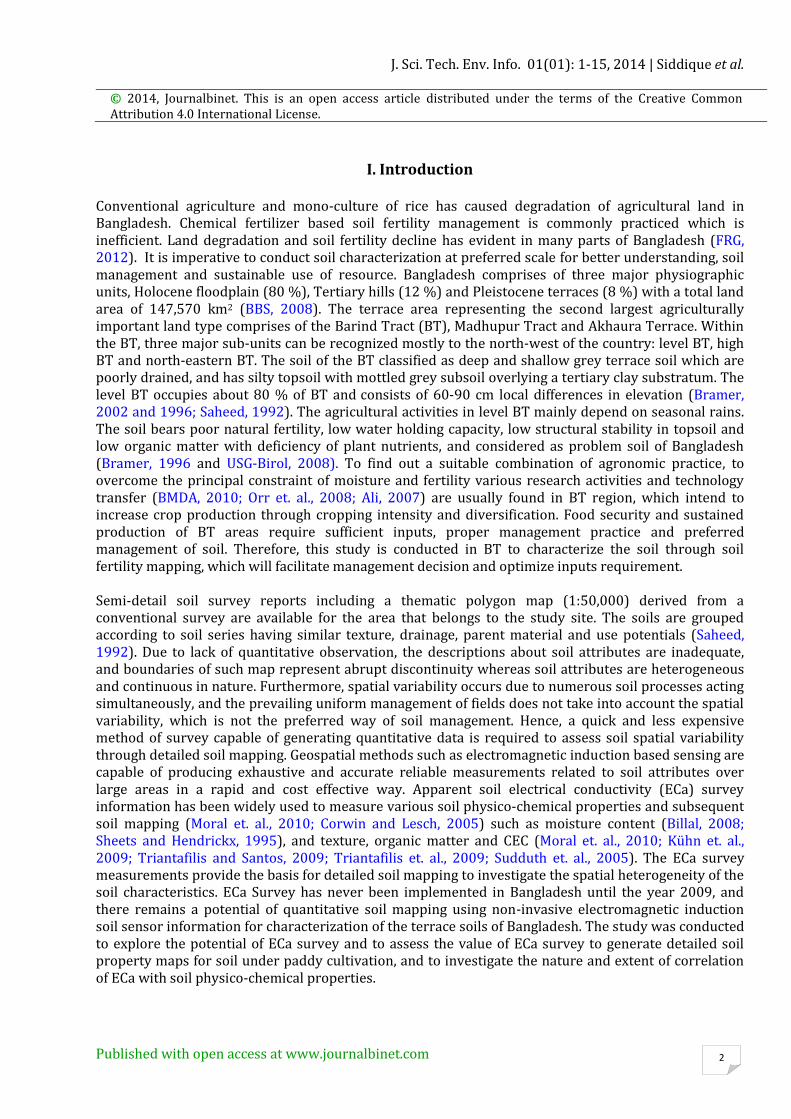
Mapping chemical soil properties: Fitted spherical variogram of chemical properties, i. e., pH, CEC, Ca2+ and Mg2+, are shown in figure 06 while the model parameters are listed in table 5. The omni-directional range of autocorrelation is 32 m and 30 m for pH and CEC respectively. But the extent of autocorrelation for the exchangeable ions Ca2+ and Mg2+ is 25 m. The relative nugget effect is relatively high (pH – 60 %, Ca2+ - 46 % and Mg2+- 57 % except the CEC (30 %) which means that the inexplicable or short distance random variations are considerable. Moreover, the higher RNE`s of pH, Ca2+ and Mg2+ indicates that their spatial variation are moderately structured by the fitted models. Maps of kriged predictions are shown in figure 07. The soil acidity varies regularly throughout the field; the distribution is somewhat polygonal in nature. The relative nugget effect is 60 % which means random variation of acidity over the site is considerable. The CEC content shows relatively less variation, its spatial distribution is approximately strongly structured, i.e. RNE 30 %. Kriged map revealed that CEC is higher in the west and north corners, and lower at the eastern size of the field shown by broken and solid arrows respectively in figure 7b. This higher CEC in those areas might be caused by relatively higher clay content and organic matter. Nevertheless, the mean CEC of the reference site is found to be 12.63 cmol+ kg-1. The organic matter level for majority area of the field is quite low which means that CEC mostly caused by the clay. CEC is the total sum of exchangeable cations that a soil can absorb or hold. The exchange capacity is mainly dependent on the type and amount of clay minerals, sesquioxides and organic matter. In highly weathered and acidic terrace soil, clay fractions are dominated by mica and kaolinite which cause the CEC to be relatively low than the adjoining floodplain (Moslahuddin et. al., 2008). The exchangeable Ca2+ showed somewhat similar distribution as the CEC (Figure 7c). Mg2+ showed a nugget variance close to zero which means that hardly any changes take place within distance smaller than 25 m of an autocorrelation radius. Kriged map shows two major spatial distributions with a patch of lower Mg2+ in the eastern side shown by arrow in figure 7d. The exchangeable cations showed a moderately structured spatial distribution as revealed from their respective relative nugget effect. Moreover, the spatial distribution for pH and Ca2+ showed approximate periodicity or recurrence at regular interval which is evident from their kriged maps shown in figure 07a and 07c respectively. Table 5. Model parameters of omni-directional spherical variograms for the chemical properties
Variogram parameters
Variable C0, nugget variance (mSm-1)2
C, sill (mSm-1)2
h, range (m)
RNE, relative nugget effect (%)
pH 0.12 0.02 32 60 CEC 1 3.3 30 30 Ca++ 0.18 0.39 25 46 Mg++ 0.04 0.07 25 57
(a) pH
(b) pH
b) CEC (cmol+ kg-1)
J. Sci. Tech. Env. Info. 01(01): 1-15, 2014 | Siddique et al.
Published with open access at www.journalbinet.com 12
(d) Ca2+ (cmol+ kg-1)
(e) Mg2+ (cmol+ kg-1)
Figure 06. Variograms of a) pH, b) CEC, c) Ca2+ and d) Mg2+

J. Sci. Tech. Env. Info. 01(01): 1-15, 2014 | Siddique et al.
Published with open access at www.journalbinet.com 13
IV. Conclusion
Soil apparent electrical conductivity (ECa) readings in the vertical orientation (ECa-V) of measurement obtained from soil sensor EM38 ranged from 40 to 64 mS m-1 while readings in the horizontal orientation (ECa-H) ranged from 32 to 53 mS m-1. The EM38 response to soil conductivity was relatively higher for the vertical orientation than the horizontal orientation. ECa readings correlated best with soil property such as top-, sub-, and deepsoil texture (clay and sand), and topsoil chemical property, i. e. pH, CEC, Ca2+ and Mg2+. A modest correlation was found between ECa-V and the subsoil clay (r = 0.78), and ECa-V and the subsoil sand (r = - 0.84). This might be caused due to the high amount of clay in the subsoil (about 40 %) and for the shallow Tertiary clay substratum. While the variogram analysis revealed that a large portion of the total variation of soil property (about 70 %) was accounted for the spatially structured component of the variogram. The ECa-V map (Figure 15) fairly represents the spatial distribution of subsoil clay showing higher ECa response in the areas where level of clay is also higher. Among the chemical properties, four soil properties namely, pH, CEC and exchangeable Ca2+ and Mg2+ showed positive and significant correlation coefficients (r = 0.46, r = 0.53, r = 0.51, and r = 0.66 respectively) with ECa-V. Other tested chemical properties, i.e., organic C, total N, available P, base saturation and K+ did not show explicable correlations with the ECa measurements. Nevertheless, these findings suggest that there is a potential of location specific and field scale ECa survey to map the spatial extent and magnitude of soil texture including key chemical properties (pH, CEC, Ca2+ and Mg2+) through EM38 sensor in terrace soils of Bangladesh. For soil mapping, ECa-V measurement in the is more predictive than ECa-H. The maps of ECa can fairly represent the spatial variation of soil properties. Thus provide useful information on soil texture, chemical fertility and organic matter content. The ECa map also provides a means of monitoring the spatial variation of soil properties that potentially influence the crop production. Furthermore, ECa maps can also guide directed soil sampling with the purpose of updating the existing soil maps of Bangladesh.
V. Recommendation
Firstly, EMI based survey with prevailing updating scheme of national soil maps could be useful for updating of existing semi-detail polygon maps. Secondly, delineation of location-specific management zones in relatively heterogeneous soils in combination with yield data might help interpretation of relationship between EM38 maps and yield variations that may lead to adoption of site-specific management. Thirdly, spatial and temporal variability of moisture content could be identified at different depth using EM38 which might substantially estimate massive irrigation requirement during drier periods in Barind areas. However, the study was premeditated and deliberately confined to small area, the results showed potential for further exploration and extension. More deliberately weighted frameworks could be implemented over large areas of different soil type and conditions. Fourthly, the lateral extent and depth of clayey substratum of terrace areas could be mapped by EM38. Fifthly, floodplain soils characterized by a ploughpan, the depth variability and compactness of this hardpan could be identified by EMI based survey. Finally, Bangladesh has about 2.8 million ha of land affected by salinity and poor quality water. The EMI survey for saline soils has already been a proven tool and there exist a great potential to characterize saline soils through EM38.
VI. Acknowledgement
This study was done for partial fulfilment of Master of Science in Physical Land Resources by Md. Noor-E-Alam Siddique from the Dept. of Soil Management, Ghent University, Belgium under an International Master Course Program of VLIR during the years 2008-2010. The study was funded by the Belgium Development Cooperation and VLIR-UOS. The authors highly appreciate the cooperation and contribution of staff from Dept. of Soil Management, Ghent University, Belgium and staff of Soil Resource Development Institute, Ministry of Agriculture, Bangladesh.

J. Sci. Tech. Env. Info. 01(01): 1-15, 2014 | Siddique et al.
Published with open access at www.journalbinet.com 14
VII. Reference
Ali, M. Y., Rahman, M. A., Quayyum, M. A. and Islam, M. B. (2007). Improved adaptive capacity to climate change for sustainable livelihoods in the agricultural sectors - The case of High Barind Tract: BARI-FAO collaborative program. On-Farm Research Division (OFRD), Bangladesh Agricultural Research Institute (BARI), Gazipur, Bangladesh.
Auerswald, K., Simon, S. and Stanjek, H. (2001). Influence of soil properties on electrical conductivity under humid water regimes. Soil Science 166: 382-390.
BBS, 2008. Statistical Pocketbook of Bangladesh, (2008). Bangladesh Bureau of Statistics, Government of the People’s Republic of Bangladesh, Dhaka, Bangladesh.
Billal, H. M. (2008). EM38 for measuring and mapping soil moisture in a cracking clay soil. PhD thesis. Department of Geography and planning, University of New England, Australia.
BMDA, (2010). Barind Multipurpose Development Authority, Ministry of Agriculture, Bangladesh. http://bmda.gov.bd/ (Read June 15, 2010).
Brammer, H. (1996). The Geography of the soils of Bangladesh. The University Press Limited, Dhaka, Bangladesh.
Brammer, H. (2002). Land use and land use planning in Bangladesh. The University Press Limited, Dhaka, Bangladesh.
Bray, R. H. and Kurtz, L. T. (1945). Determination of total, organic, and available forms of phosphorus in soils. Soil Science 59: 39-45.
Bronson, K. F., Booker, J. D., Officer, S. J., Lascano, R. J., Maas, S. J. , Searcy, S. W. and Booker, J. (2005). Apparent electrical conductivity, soil properties and spatial covariance in the U.S. Southern High Plains. Precision Agriculture 6: 297-311.
Burrough, P. A. and McDonnell, R. A. (1998). Principals of geographical information systems. Oxford University Press, Oxford.
Burrough, P.A. (1993). Soil variability: a late 20th century view. Soil and Fertilizers 56: 529-562. Corwin D. L. and Lesch, S. M. (2005). Apparent soil electrical conductivity measurements in agriculture.
Computers and Electronics in Agriculture 46: 181-202. Day, P. R. (1965). Particle fractionation and particle-size analysis. Methods of soil analysis, p. 545-567,
C. A. Black, Ed. Agronomy No. 1. American Society of Agronomy, Madison, WI. FRG, (2005) and (2012). Fertilizer Recommendation Guide, Bangladesh Agriculture Research Council
(BARC), Farmgate, Dhaka 1215, pp. 65-69. Goovaerts, P. (1997). Geostatistics for natural resources evaluation. Oxford University Press, New York. Hendershot, W. H. and Duquette, M. (1986). A simple barium chloride method for determining cation
exchange capacity and exchangeable cations. Soil Science Society America Journal 50: 605-608. Ibrahim and Baset, (1973). Reconnaissance soil survey of sadar sub-division, Dinajpur district. Soil
Resource Development Institute (SRDI), Ministry of Agriculture, Bangladesh. Knudsen, D., Peterson, G. A. and Pratt, P. F. (1982). Lithium, sodium and potassium. In: A. L. Page et. al.,
editors. Methods of soil analysis, Pages 247-262. Part 2. Agronomy No. 9. American Society of Agronomy, Madison, WI.
Kühn, J., Brenning, A., Wehrhan, M., Koszinski, S. and Sommer, M. (2009). Interpretation of electrical conductivity patterns by soil properties and geological maps for precision agriculture. Precision Agriculture 10: 490-507.
Lesch, S.M., Corwin, D. L. and Robinson, D. A. (2005). Apparent soil electrical conductivity mapping as an agricultural management tool in arid zone soils. Computers and Electronics in Agriculture 46: 351–378.
McBride, R. A., Gordon, A. M. and Shrive, S. C. (1990). Estimating forest soil quality from terrain measurements of apparent electrical conductivity. Soil Science Society of America Journal 54: 290-293.
Moral, F. J., Terron, J. M. and Marques, J. R. (2010). Delineation of management zones using mobile measurements of soil apparent electrical conductivity and multivariate geostatistical techniques. Soil & Tillage Research 106: 335–343.
Moslehuddin, A. Z. M., Habibullah, Moniruzzaman, M. and Egashira, K. (2008). Mineralogy of Soils from Different Agroecological Regions of Bangladesh: Region 25 - Level Barind Tract and Region 27-
J. Sci. Tech. Env. Info. 01(01): 1-15, 2014 | Siddique et al.
Published with open access at www.journalbinet.com 15
North-eastern Barind Tract. Journal of Faculty of Agriculture, Kyushu University, 53 (1): 163–169.
Oliver, M. A. (1987). Geostatistics and its application to soil science. Soil Use and Management 3: 8-20. Orr, A., Riches, Mortimer, C. R., Harris, A. M. and Mazid, M. A. (2008). Farm-level opportunities for
increasing productivity and income in the High Barind Tract: a synthesis. In: Riches, C. R., Harris, D. and Hardy, B., editors, Improving agricultural productivity in Rice-Based systems of the high Barind Tract of Bangladesh, p. 9-25. International Rice Research Institute (IRRI), Philippines.
Pannatier Y. (1996). VARIOWIN: Software for Spatial Data Analysis in 2D. Sprin-ger-Verlag, New York. Saheed, S.M. (1992). Soil Survey: perspective and strategies for the 21st century. In: J. A. Zinck, editor, An
International Workshop for Heads of National Soil Survey Organizations, ITC publication, No. 21, p. 55-60, The Netherlands.
Sheets, K. R. and Hendrickx, J. M. H. (1995). Non-invasive soil water content measurement using electromagnetic induction. Water Resource Research 31 (10): 2401-2409.
Sudduth, K. A., Kitchen, N. R., Wiebold, W. J., Batchelor, W. D., Bollerod, G. A., Bullock, D. G., Clay, D. E., Palm, H. L., Pierce, F. J., Schuler, R. T. and Thelen, K. D. (2005). Relating apparent electrical conductivity to soil properties across the north-central USA. Computers and Electronics in Agriculture 46: 263–283.
Triantafilis, J. and and Monteiro Santos, F. A. (2009). 2-Dimensional soil and vadose-zone representation using an EM38 and EM34 and a laterally constrained inversion model. Australian Journal of Soil Research 47: 809–820.
Triantafilis, J., Lesch S. M., Kevin, L. and Buchanan S. M. (2009). Field level digital soil mapping of cation exchange capacity using electromagnetic induction and a hierarchical spatial regression model. Australian Journal of Soil Research 47: 651–663.
USG-Birol, Upazila Soil Guide (land and soil resource utilization guide), (2008). Soil survey and interpretation division, Soil Resource Development Institute (SRDI), Bangladesh.
Webster, R. and Oliver, M. A. (1990). Statistical methods in soil and land resource survey. Oxford University Press, NY.
Webster, R. and Oliver, M.A. (2001). Geostatistics for environmental scientists, p. 271, John Wiley and Sons, Chichester.
Citation for this article (APA Style): Siddique, M. N. A., Islam, M. M., Sultana, J., Kamaruzzaman, M. & Halim, M. A. (2014). Potential of soil sensor EM38 measurements for soil fertility mapping in the Terrace soil of Bangladesh. Journal of Science, Technology & Environment Informatics, 01(01), 1–15. Retrieved November 20, 2014, from http://www.journalbinet.com/current-issue-jstei.html