Embed Size (px)
Citation preview

RESEARCH ARTICLE
Potential of ASAR-ENVISAT for Estimating NearSurface Soil Moisture in a Sloping Terrainof a Himalayan Watershed
S. Saran & G. Sterk & P. J. van Oevelen &
V. K. Dadhwal
Received: 7 September 2009 /Accepted: 14 October 2011 /Published online: 28 December 2011# Indian Society of Remote Sensing 2011
Abstract Soil moisture estimation is considered to beone of the important parameters in hydrologicalstudies. The extraction of information on near surfacesoil moisture from the synthetic aperture radar is wellestablished. The available Advanced SyntheticAperture Radar (ASAR) data onboard ENVISAT withmulti-incidence and multi-polarization mode for soilmoisture estimation on sloping terrain was investigat-ed. Empirical models were developed to estimate nearsurface soil moisture in the fallow agricultural fieldsby incorporating the effects of surface roughnessusing multi-incidence angle ASAR data. Mediumincidence angle (IS-4) with VV polarization ofASAR data had higher correlation coefficient tovolumetric soil moisture content. The ratio of medium(IS-4) to high incidence (IS-6) angle could further
reduce the effect of surface roughness. The effect oftopography on the radar data is taken care bycalculating local incidence angle derived fromASTER DEM data. The VV polarization in thesloping terrain provided better results in comparisonto VH polarization.
Keywords Soil moisture .Multi-incidence .
Multi-polarization . Local incidence angle .
Surface roughness
Introduction
Catchments stakeholder use a variety of models toplan soil conservation systems, conduct environmen-tal planning, or assess offsite impacts caused by watererosion (e.g. Wischmeier and Smith 1978; Morgan2001). For most of these models the input of soilmoisture requires field observations, which restrict theapplications of such models to small catchments(Smith et al. 1995). Soil moisture is highly dynamic,both spatially and temporally, due to the heterogeneityof soil properties (e.g. soil texture, soil depth),topography, land use/cover and rainfall. In this regardsatellite data covering large areas can be considered asan alternative input for such models (Beven 2002;Saran et al. 2002).
Surface soil moisture is the temporary storage ofwater within the shallow layer of the earth’s uppersurface. Though, this water in this shallow layer
J Indian Soc Remote Sens (September 2012) 40(3):541–550DOI 10.1007/s12524-011-0178-z
S. Saran (*)Indian Institute of Remote Sensing (NRSC), ISRO,Dehradun, Indiae-mail: [email protected]
G. SterkDepartment of Physical Geography, Utrecht University,Utrecht, The Netherlands
P. J. van OevelenDirector, International GEWEX Project Office,Silver Spring, MD, USA
V. K. DadhwalNational Remote Sensing Centre, ISRO,Hyderabad, India
seems to be insignificant as compared to the totalamount of water on the global scale but this smallamount of water controls all the agricultural activitiesand is considered to be the link between the water andenergy balance at the land surface (van Oevelen1999). The information on spatial distribution andtemporal behavior of near surface soil moisture arecrucial ingredients for water erosion modeling both atlocal, regional and global scales (van Oevelen 1999).Near surface soil moisture distribution helps todetermine the partitioning of rainfall into surfacerunoff and infiltration into the soil column. Key factorbehind the soil moisture estimation using microwaveremote sensing is the large difference betweendielectric constant of water (~80) and of dry soil (3to 4) at microwave frequencies (Ulaby et al. 1986)and because of this property, radar signals getsattenuated due to dielectric constant and is stronglyrelated to soil moisture estimation (van Oevelen1999).
Estimation of soil surface parameters from imagingradar has been of interest in the recent past (Ulaby etal. 1986). During the last few decades the sensitivityof radar backscattered signal to soil surface parame-ters have been investigated thoroughly by variousresearchers (Ulaby et al. (1986; Oh et al. 1992; Fung1994; van Oevelen 1999; Baghdadi et al. 2002; Zribiand Dechambre 2002; Srivastava et al. 2003; Holah etal. 2005; Zribi et al. 2005; Baghdadi et al. 2006). Inorder to retrieve this information, there is a need toexamine the influence of various surface properties onmicrowave response. Synthetic Aperture Radar (SAR)offers an opportunity for retrieval of soil moisturethrough space-borne imaging radar satellites (vanOevelen 1999; van Oevelen and Hoekman 1999;Baghdadi et al. (2002)). However, the contribution ofthe soil surface parameters on the radar backscatteredsignal needs to be estimated accurately, since both soilmoisture and soil roughness influence radar backscat-ter (Ulaby et al. 1986).
Radar backscatter is a function of radar configura-tion, dielectric constant, soil surface roughness con-ditions and soil texture for areas without vegetationcover. Excluding soil moisture and soil roughnessother variables like incidence angle, polarization andwavelength also affect the radar backscatter signals.However it was observed that estimation of soilmoisture is optimal at low and medium incidenceangles (20°–37°) while the backscatter coefficient is
more sensitive to volumetric soil moisture content inHH (horizontal-horizontal) polarization than in HV(horizontal-vertical) polarization (Holah et al. 2005).The retrieval of soil moisture over the agriculturalfields leads to inaccuracy due to variations in thesurface roughness conditions which in turn may evendominate over soil moisture variability (Borgeaud etal. 1995). Studies by Dobson and Ulaby (1981),Ulaby et al. (1986), and Srivastava et al. (2003)revealed that fields having same soil moisture andsurface roughness give different value of backscattercoefficient at different incidence angles. Although thedifference in backscatter values at two differentincidence angles depends on the surface roughnessof that field. These studies therefore concluded thatsoil moisture estimation may be improved by usingthe multi-incidence angle to minimize the effect ofsurface roughness (Srivastava et al. 2003).
The backscatter is highly influenced by the randomsurface roughness of the bare agricultural fields and isnever smaller than 2 db. Moreover the influence ofrow pattern can be strong as 10 db (Beaudoin et al.1990). The roughness as seen by the radar is ameasure of surface RMS height and surface correla-tion length. Nevertheless surface roughness parame-ters have an influence on smaller numerical valuesand it is necessary to have field knowledge about thecorrelation length which is important at lowerincidence angles whereas the RMS height has to beaccurately known at higher incidence angles (Hoebenet al. 1997).
Radar backscatter is also affected by topographyover the entire range of local incidence angles in thesloping terrain (Walker et al. 2004). The localincidence angle is considered to be as one of theimportant variables influencing the appearance of thedifferent terrain conditions in the images. For localincidence angles of 0°–30°, radar backscatter isdominated by topographic slope and for angles of30°–70°, surface roughness dominates (Lillesand andKiefer 2000). Moreover the influence of topographyaffects the surface parameters estimation from back-scattered observation through the local incidenceangle being different from that assumed for a flatsurface (van Zyl 1993). However, in relatively flatareas the angle of depression of the radar beam isequivalent to the complement of the local incidenceangle. But in case of sloping terrain or hilly terrain thelocal incidence angle is likely to differ from the angle
542 J Indian Soc Remote Sens (September 2012) 40(3):541–550
of depression of the radar beam. The resultant effect isthat the models do underestimate the soil moisturecontent and overestimate the surface roughness forsurfaces tilted towards the radar, whereas it under-estimates the surface roughness and over estimates thesurface moisture for surfaces tilted away from theradar (Dubois et al. 1995). The study by Lin et al.(1994) revealed that HH polarization appears to bemost sensitive to the topographic effect.
The effect of vegetation on microwave backscat-tering is due to the structure of the vegetation androughness of the surface. When the soil is coveredwith vegetation, the total backscatter is thecontribution from the following components: (a)the contribution from the vegetation (volumescattering), (b) the contribution from the soilsurface and (c) the contribution from the interac-tion between vegetation and the soil (van Oevelenand Hoekman 1999). Therefore, it is necessary tomask the vegetation while estimating the soil mois-ture. Nevertheless, it has been observed that C-banddata can penetrate the vegetation canopy better whenthe vegetation is drier (Brown et al. 1992). However,the effect of vegetation can be reduced also by usingdifferent radar configurations for instance the effectbeing smaller at low incidence angles (Wang et al.1987).
There exist a number of scattering models whichare specifically developed to simulate radar echoesto derive soil surface parameters but they all havesome limitations. Some of the empirical modelsdeveloped from the experimental relationship be-tween radar backscatter and soil moisture were site-dependent and do not fully explain the phenomena(Oh et al. 1992; Dubois et al. 1995). However,theoretical models do explain the complexity ofphenomena like the interaction between electro-magnetic wave and the Earth’s surface (Fung1994). But the condition of theoretical models likein the case of Integral Equation Model (IEM) (Fung etal. 1992) generally requires specification of thesurface characteristics with one or more roughnessparameters (RMS height, autocorrelation length, etc.).Nevertheless, these models also failed to accuratelyaccount for the complex geometry of natural soilsurfaces (Fung et al. 1992). Hence, because of thesereasons, no accurate method is available to explicitlyaccount for roughness effects to estimate soil moisturefor existing SAR applications.
The aim of this study was to develop an empiricalmodel to derive spatial pattern of near surface soilmoisture in the bare agricultural fields of a Himalayanwatershed by incorporating the effects of surfaceroughness using multi-incidence angle data fromASAR.
Materials and Methods
Study Site
The experimental area selected for this study isknown as Sitla Rao Watershed. It is situated in thewest of Dehradun city in the Lesser Himalayas ofnorthern India. The geographical dimension extendsfrom 30° 24′ 39′′ to 30° 29′05′′ N latitude and 77° 45′33′′ to 77° 57’46′′ E longitude. The size of thewatershed is 5800 ha, with altitude varies from 440–2000 m above msl. The geomorphology of the areaconstitutes a chain of hills, extensive piedmonts andriver valleys. The slope of the terrain varies frommoderately sloping (< 15%) in the downstream part,to steep sloping (> 30%) in the upper part. The soilsgenerally have textures varying from loam to sandyloam. Physiographically the area is divided into fourmajor units based on similarity in relief, slope,texture, geology and arrangement of landform fea-tures: (a) hillside slope, (b) upper piedmont, (c)middle piedmont and (d) lower piedmont.
The annual rainfall depends on the elevation, butvaries from 1600 mm to 2200 mm. Most of thisrainfall (~1000 mm) occurs during the monsoonseason (June to August), while the remaining rainfall occurs during the winter season (December-April). The mean monthly temperature in the middlepart of the watershed ranges from 15.8°C in winter to33.3°C in summer. The main cropping seasons areKharif (June-Sept.) and Rabi (Dec.-March). Rice, andmaize are grown in the Kharif season, whereas wheatis cultivated during the Rabi season. Erosion is amajor problem for farmers, especially on the steeperslopes. Most of the farmers practice terrace farming toreduce the erosion risk. The major land use/coverclasses in the study area are: forest, agriculture, scruband settlements. The forest occupies the majority ofthe study area and is distributed in different classes ofdensities like open, moderate and dense forest. Theseforests mainly consist of Sal trees (Shorea robusta).
J Indian Soc Remote Sens (September 2012) 40(3):541–550 543
Dataset
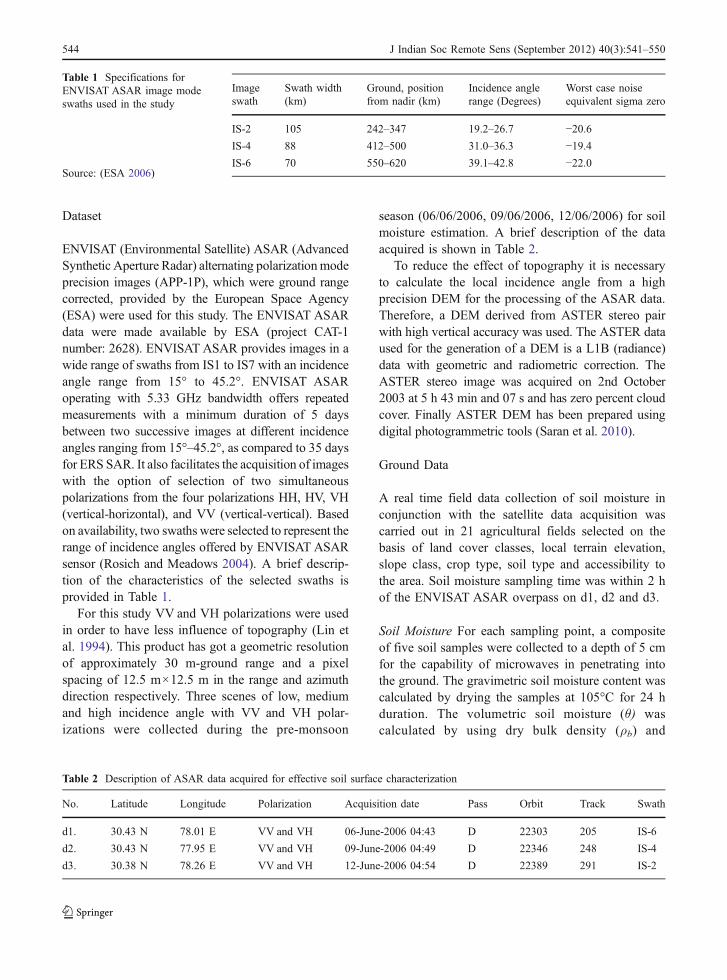
ENVISAT (Environmental Satellite) ASAR (AdvancedSynthetic Aperture Radar) alternating polarizationmodeprecision images (APP-1P), which were ground rangecorrected, provided by the European Space Agency(ESA) were used for this study. The ENVISAT ASARdata were made available by ESA (project CAT-1number: 2628). ENVISAT ASAR provides images in awide range of swaths from IS1 to IS7 with an incidenceangle range from 15° to 45.2°. ENVISAT ASARoperating with 5.33 GHz bandwidth offers repeatedmeasurements with a minimum duration of 5 daysbetween two successive images at different incidenceangles ranging from 15°–45.2°, as compared to 35 daysfor ERS SAR. It also facilitates the acquisition of imageswith the option of selection of two simultaneouspolarizations from the four polarizations HH, HV, VH(vertical-horizontal), and VV (vertical-vertical). Basedon availability, two swaths were selected to represent therange of incidence angles offered by ENVISAT ASARsensor (Rosich and Meadows 2004). A brief descrip-tion of the characteristics of the selected swaths isprovided in Table 1.
For this study VV and VH polarizations were usedin order to have less influence of topography (Lin etal. 1994). This product has got a geometric resolutionof approximately 30 m-ground range and a pixelspacing of 12.5 m×12.5 m in the range and azimuthdirection respectively. Three scenes of low, mediumand high incidence angle with VV and VH polar-izations were collected during the pre-monsoon
season (06/06/2006, 09/06/2006, 12/06/2006) for soilmoisture estimation. A brief description of the dataacquired is shown in Table 2.
To reduce the effect of topography it is necessaryto calculate the local incidence angle from a highprecision DEM for the processing of the ASAR data.Therefore, a DEM derived from ASTER stereo pairwith high vertical accuracy was used. The ASTER dataused for the generation of a DEM is a L1B (radiance)data with geometric and radiometric correction. TheASTER stereo image was acquired on 2nd October2003 at 5 h 43 min and 07 s and has zero percent cloudcover. Finally ASTER DEM has been prepared usingdigital photogrammetric tools (Saran et al. 2010).
Ground Data
A real time field data collection of soil moisture inconjunction with the satellite data acquisition wascarried out in 21 agricultural fields selected on thebasis of land cover classes, local terrain elevation,slope class, crop type, soil type and accessibility tothe area. Soil moisture sampling time was within 2 hof the ENVISAT ASAR overpass on d1, d2 and d3.
Soil Moisture For each sampling point, a compositeof five soil samples were collected to a depth of 5 cmfor the capability of microwaves in penetrating intothe ground. The gravimetric soil moisture content wascalculated by drying the samples at 105°C for 24 hduration. The volumetric soil moisture (θ) wascalculated by using dry bulk density (ρb) and
Table 1 Specifications forENVISAT ASAR image modeswaths used in the study
Source: (ESA 2006)
Imageswath
Swath width(km)
Ground, positionfrom nadir (km)
Incidence anglerange (Degrees)
Worst case noiseequivalent sigma zero
IS-2 105 242–347 19.2–26.7 −20.6IS-4 88 412–500 31.0–36.3 −19.4IS-6 70 550–620 39.1–42.8 −22.0
Table 2 Description of ASAR data acquired for effective soil surface characterization
No. Latitude Longitude Polarization Acquisition date Pass Orbit Track Swath
d1. 30.43 N 78.01 E VV and VH 06-June-2006 04:43 D 22303 205 IS-6
d2. 30.43 N 77.95 E VV and VH 09-June-2006 04:49 D 22346 248 IS-4
d3. 30.38 N 78.26 E VV and VH 12-June-2006 04:54 D 22389 291 IS-2
544 J Indian Soc Remote Sens (September 2012) 40(3):541–550
gravimetric soil moisture. Dry bulk density of the soilsamples was measured using standard analyticalprocedures. The volumetric soil moisture (θ) wasobtained from the following expression:
q ¼ wwet � wdry
wdry
� �rb ð1Þ
where, wwet=weight of samples without drying, wdry=weight of dried samples and rbis bulk density
Data Preprocessing
The ASAR data analysis requires different pre-processing steps. The following steps were involvedto process the ASAR data:
Georeferencing: It was necessary to geo-referenceASAR data with an accuracy that could not beachieved with the help of feature matching techni-ques. For geo-referencing of the ASAR data, cornerreflectors were installed in the field. The exactposition of the reflectors was determined using aGPS. The corner reflectors were distributed in such away that they covered the entire study area andallowed maximum accuracy at the time of geo-referencing. The positions of the corner reflectorswere selected in those areas that would have a lowerdecibel value as compared to the corner reflector’sradar cross section thus facilitating their easy identi-fication in the image (Saran 2006).
Local Incidence Angle: Processing of ASAR dataincludes calculation of local incidence angle, deriva-tion of slant range distance for each pixel andderivation of backscattering coefficients. The neces-sary input data for this purpose were ASAR groundrange precision image, ASAR flight and sceneparameters as well as calibration parameters, a digitalelevation model covering the area of interest and itsderivatives (slope and aspect), and the geometricalrelation between geocoded and original ground range
images. Outputs of the processing are a map of localincidence angle and a map of the backscatteringcoefficients for each of the data under consideration.Since the present study envisaged high precision forthe derivation of the local incidence angle, a DEMderived from any ASTER stereo pair with highvertical accuracy was used (Saran et al. 2010). TheASTER Level-5 DEM was used in the calculation ofthe local incidence angle images and the subsequentderivation of the backscattering coefficients.
A detailed knowledge of the local incidence angleis required to perform the absolute image calibrationand to derive the radar backscattering coefficients fordetected ground range products. Since this informa-tion is usually not available at the processing time, a“flat terrain” is assumed during processing (based onthe ellipsoid WGS84) and the final intensity image istherefore, proportional to the radar brightness of theilluminated scene (Laur et al. 2004). In the presentstudy to derive the local incidence angle for eachpixel in the study area Eq. 2 was used (Su and Troch1997)
aði;jÞ ¼ cos�1ðcos qði;jÞ cos gði;jÞ þ sin qði;jÞ sin gði;jÞ cosðt � bði;jÞÞÞð2Þ
where, a(i,j)=local incidence angle, θ(i,j) and β(i,j)=slope and aspect angle respectively of the pixelsderived from the ASTER Level-5 DEM, γ(i,j)=zenithangle of sensor defined as the angle between thesensor and the normal to the horizontal surface at thatlocation, τ=actual flight track of the sensor.
Backscattered Coefficient: Backscatter image genera-tion from ENVISAT ASAR APP satellite imagefollowed the given steps:(i) linear backscatter imagegeneration from APP image, and (v) conversion fromlinear to decibels.
Linear backscattered image generated from theAPP image by using the following algorithm and therelationship may be given as (Laur et al. 2004):
s0i; j ¼
DN 2i; j
Ksinðai; jÞ for i ¼ 1; 2; 3; . . . . . . ; L and j ¼ 1; 2; 3; . . . . . . ::;M ð3Þ
where, s0i;j is the backscattering coefficient at image
line and column “i, j”, K is the absolute calibrationconstant taken from header file, is local incidenceangle at image line and column “i, j”, is the pixel
J Indian Soc Remote Sens (September 2012) 40(3):541–550 545

intensity value at image line and column “i, j”, L isthe number of image lines and M is the number ofimage columns. The resultant image gives thebackscatter image at linear scale and pixel valuesrepresents the backscatter coefficient. Backscattercross-section (sigma nought) which is represented bythe ratio of power levels per unit area is usuallyexpressed on a logarithmic scale i.e. decibel (dB)scale (van der Sanden 1997) for better discriminationrange between the agricultural classes. To convert s0
i;j
from linear units to decibels the following equationwas used (Laur et al. 2004):
s0i; jðdbÞ ¼ 10:log10ðs0
i; jÞ ð4Þ
where, db is Decibels.
Soil Moisture Model and Validation
A land use/cover map of Sitla Rao watershed wasderived using both optical and microwave remotesensing data (Saran et al. 2007). Twelve land use/coverTypes were classified, including detailed agriculturalclasses (rice and maize). Only the agricultural fieldswere mask out from the land use/cover classes. Theempirical model was only applied to the bareagricultural fields in which the crop is recently sownwith no crop cover on it. To retrieve soil moisture ofbare agricultural fields from radar, it is necessary toestablish a relationship between the observed volu-metric soil moisture (θ) and backscattered coefficient(σ°) obtained from the corresponding samplinglocation. The soil moisture retrieval model derivedusing (σ°) is given by Eq. 5.
q ¼ Aþ B»ðs0IS�4ðVV ÞdBÞ ð5Þ
Further the regression analysis was done usingSPSS 12.0 statistical software package for windows.The regression model of soil moisture was evaluated
using Root Mean Square Error (RMSE) statisticalindices. The expression may be given as:
RMSE ¼ffiffiffiffiffi1
N
r XNn¼1
ðPn � OnÞ2 ð6Þ
where Pn represents the estimated value whileOn is themeasured value, and N is the number of data points.
Results and Discussion
The field data collection sampling was performed in21 bare agricultural fields distributed across thewatershed. The sample points were mostly concen-trated in the lower and middle part of the watershedcovering maize and paddy fields. The upper part ofthe watershed was partially covered because ofdifficult terrain conditions and time constraint. Thepaddy fields are cultivated on the terraces distributedmostly in the middle and upper part of the watershed.All the fields were almost in dry conditions during allthe three dates. The surface roughness conditions ofthe bare fields were almost same for the initial twopasses but before the last pass some of the plowing/harrowing operations have been performed. Therewere slight variations in the moisture content ofpaddy and maize fields. The following table describesthe moisture conditions of all the bare fields duringthe three different dates (Table 3).
The correlation coefficients were estimated between theextracted backscatter coefficient (σ°) values of all samplepoint to the measured volumetric moisture content (θ) forall the three acquisition dates (Tables 3 and 4).
It was found that IS-4 (medium incidence angle)gave better correlation coefficients than IS-2 (lowincidence angle) and IS-6 (high incidence angle). Thelow correlation coefficient of IS-6 was due to wideincidence angle and also surface roughness effect hasdominated over soil moisture estimation (Holah et al.
Table 3 Volumetric moisture content (%) measured from the field samples for different dates (Nos. of Observations (N)=21)
Date Incidence angle Minimum (%) Maximum (%) Range (%) Standard deviation (%)
06-June-2006 04:43 39.1–42.8 (IS-6) 2.8 9.81 7.01 1.78
09-June-2006 04:49 31.0–36.3 (IS-4) 2.6 9.63 7.03 1.48
12-June-2006 04:49 19.2–26.7 (IS-2) 3.78 9.19 5.41 1.28
546 J Indian Soc Remote Sens (September 2012) 40(3):541–550

2005). However the reason of low correlationcoefficient for IS-2 is attributed due to tillage effect(plowing and harrowing by the farmers) practiced justbefore the satellite pass. Eventually the radar waveswere more influenced by surface roughness effectcompared to soil moisture (Borgeaud et al. 1995).
Nevertheless, the high backscatter coefficient of IS-4with volumetric soil moisture is also due to highcorrelation coefficient of IS-4 with local incidence angle(Table 5). However, the effect of IS-6 to local incidenceangle is comparatively less than IS-4. The topographiceffect has been reduced by incorporating the localincidence angle to derive backscatter coefficient.
It was also observed that the variability amongdifferent incidence angles on deriving the localincidence angle has been analyzed (Table 6). Thehighest variability of local incidence angle is shownin IS-4 compared to IS-6.
Since the moisture conditions were almost similarbetween the two dates of IS-4 and IS-6 (Table 3), it isdecided to use multi-incidence angle approach tofurther reduce the effect of surface roughness for thesoil moisture estimation (Srivastava et al. 2003). Out
of 21 points, only 16 common points were selectedwhich have almost similar moisture conditions (range1 to 2% approx.) between the two acquisition dates(IS-4 and IS-6). For the development of regressionmodel only 12 points were used and remaining 4points were used for the model validation.
Soil Moisture Retrieval Model
To retrieve soil moisture values of bare agriculturalfields, regression analysis was carried out to develop therelationship between the observed soil moisture valuesand backscattered coefficient obtained from 12corresponding sample points. The soil moisture retrievalmodel was derived using s0
IS�4 dB is given as:
q ¼ Aþ B»ðs0IS�4ðVV ÞdBÞ ð7Þ
The derived coefficients are
q ¼ 10:28þ 1:03»ðs0IS�4ðVV ÞdBÞ ð8Þ
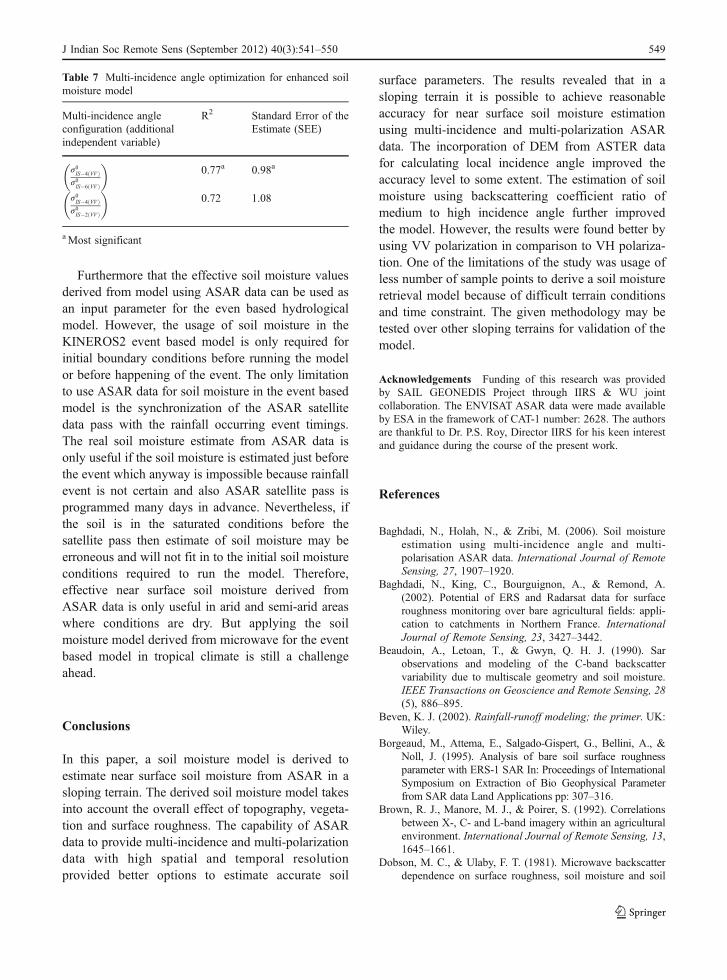
The coefficient of determination (R2) obtained inregression analysis for IS-4 (VV) was 0.71 withstandard error of estimate (SEE) being 1.02 (Fig. 1).Multi-incidence angle approach was applied to furtherimprove the soil moisture model to reduce roughnesseffects. Optimal configuration of multi-incidenceangle was used as an additional independent variablealong with IS-4 for the refinement of the model(Table 7).
The soil moisture model was further improved byadding another variable i.e. ratio of medium and high
incidence angles0IS�4ðVV Þ
s0IS�6ðVV Þ
� �as predictor variable
(independent variable) to reduce the surface rough-ness effects, because it provides better results as
compared tos0IS�4ðVV Þ
s0IS�2ðVV Þ
� �. The detailed analysis revealed
Table 4 Correlation coefficientbetween the backscatter coeffi-cient and volumetric moisturecontent (%) for different inci-dence angles in sloping terrain(Nos. of Observations (N)=21)
aMost significant
Date Incidence angle Polarization Correlation aoefficient
06-June-2006 04:43 39.1–42.8 (IS-6) VV 0.075
VH 0.164
09-June-2006 04:49 31.0–36.3 (IS-4) VV 0.84a
VH 0.42
12-June-2006 04:49 19.2–26.7 (IS-2) VV 0.63
VH 0.34
Table 5 Correlation coefficient between the backscatteredcoefficient and local incidence angle for different incidenceangle with vertical-vertical polarization (Nos. of Observations(N)=21)
Date Incidenceangle
Polarization Correlationcoefficient
06-June-2006 04:43 39.1–42.8(IS-6)
VV 0.21
09-June-2006 04:49 31.0–36.3(IS-4)
VV 0.48a
12-June-2006 04:49 19.2–26.7(IS-2)
VV 0.06
aMost significant
J Indian Soc Remote Sens (September 2012) 40(3):541–550 547

that the value of the ratios0IS�4ðVV Þ
s0IS�6ðVV Þ
� �was close to
3.3 dB which is an indicator of rough surfaceconditions in the agricultural fields (Oh et al. 1992;Srivastava et al. 2003).
This improved model is given as:
q ¼ 7:73þ 0:33»ðs0IS�4ðVV ÞdBÞ
� 0:23»s0IS�4ðVV Þ
s0IS�6ðVV Þ
!dB ð9Þ
The R2 has improved from 0.71 to 0.77 and theSEE has decreased from 1.02 to 0.98. The contribution of
the ratios0IS�4ðVV Þ
s0IS�6ðVV Þ
� �in the improved model has helped
for the better estimation of soil moisture in the slopingterrain though improvement is not very significant.
Model Validation
The soil moisture model has been validated using rootmean square error (RMSE) between the observed
surface parametric values and model derived estimat-ed values. The estimated values of soil moisture werecalculated using the backscattered coefficient withvarying incidence angle for randomly distributedpoints. The soil moisture model was validated usingremaining four points left for the error estimation. TheRMS error between the observed and estimatedvalues of soil moisture from Eq. 9 was 1.8 ascompared to that of 2.9 for Eq. 8. The RMS error isless in the improved model compared to previousmodel and hence provided better estimates of soilmoisture in the Sitla Rao.
It is understood that the variability of the moisturecontent in the fields was equally distributed in theupper, middle and lower part of the watershed. It wasobserved that the moisture conditions in the paddyfields are high as compared to maize fields. Thereason of high moisture conditions in the paddy fieldsis due to farming on the terraces. Moreover theterraces have better water holding capacity comparedto other agricultural fields. Some of the fields havehigh moisture content may be due to irrigationpractices.
Table 6 Statistical analysis of different incidence angles on local incidence angle
Date Incidence angle& polarization
Minimum(in Radians)
Maximum(in Radians)
Range (inRadians)
Standard deviation(in Radians)
06-June-2006 04:43 39.1–42.8 (IS-6–VV) 0.32 1.02 0.70 0.21
09-June-2006 04:49 31.0–36.3 (IS-4–VV) 0.19 1.05 0.85 0.22
12-June-2006 04:49 19.2–26.7 (IS-2–VV) 0.09 0.77 0.68 0.19
y = 1.03x - 10.28R2 = 0.71
-16
-14
-12
-10
-8
-6
-4
-2
0
0 1 2 3 4 5 6 7 8
Volumetric Moisture Contents (%)
Sigm
a dB
val
ues
at I
S-4
VV
Fig. 1 Relationshipbetween volumetric mois-ture content and radarbackscatter for 9 June, 2006in Sitla Rao watershed
548 J Indian Soc Remote Sens (September 2012) 40(3):541–550
Furthermore that the effective soil moisture valuesderived from model using ASAR data can be used asan input parameter for the even based hydrologicalmodel. However, the usage of soil moisture in theKINEROS2 event based model is only required forinitial boundary conditions before running the modelor before happening of the event. The only limitationto use ASAR data for soil moisture in the event basedmodel is the synchronization of the ASAR satellitedata pass with the rainfall occurring event timings.The real soil moisture estimate from ASAR data isonly useful if the soil moisture is estimated just beforethe event which anyway is impossible because rainfallevent is not certain and also ASAR satellite pass isprogrammed many days in advance. Nevertheless, ifthe soil is in the saturated conditions before thesatellite pass then estimate of soil moisture may beerroneous and will not fit in to the initial soil moistureconditions required to run the model. Therefore,effective near surface soil moisture derived fromASAR data is only useful in arid and semi-arid areaswhere conditions are dry. But applying the soilmoisture model derived from microwave for the eventbased model in tropical climate is still a challengeahead.
Conclusions
In this paper, a soil moisture model is derived toestimate near surface soil moisture from ASAR in asloping terrain. The derived soil moisture model takesinto account the overall effect of topography, vegeta-tion and surface roughness. The capability of ASARdata to provide multi-incidence and multi-polarizationdata with high spatial and temporal resolutionprovided better options to estimate accurate soil
surface parameters. The results revealed that in asloping terrain it is possible to achieve reasonableaccuracy for near surface soil moisture estimationusing multi-incidence and multi-polarization ASARdata. The incorporation of DEM from ASTER datafor calculating local incidence angle improved theaccuracy level to some extent. The estimation of soilmoisture using backscattering coefficient ratio ofmedium to high incidence angle further improvedthe model. However, the results were found better byusing VV polarization in comparison to VH polariza-tion. One of the limitations of the study was usage ofless number of sample points to derive a soil moistureretrieval model because of difficult terrain conditionsand time constraint. The given methodology may betested over other sloping terrains for validation of themodel.
Acknowledgements Funding of this research was providedby SAIL GEONEDIS Project through IIRS & WU jointcollaboration. The ENVISAT ASAR data were made availableby ESA in the framework of CAT-1 number: 2628. The authorsare thankful to Dr. P.S. Roy, Director IIRS for his keen interestand guidance during the course of the present work.
References
Baghdadi, N., Holah, N., & Zribi, M. (2006). Soil moistureestimation using multi-incidence angle and multi-polarisation ASAR data. International Journal of RemoteSensing, 27, 1907–1920.
Baghdadi, N., King, C., Bourguignon, A., & Remond, A.(2002). Potential of ERS and Radarsat data for surfaceroughness monitoring over bare agricultural fields: appli-cation to catchments in Northern France. InternationalJournal of Remote Sensing, 23, 3427–3442.
Beaudoin, A., Letoan, T., & Gwyn, Q. H. J. (1990). Sarobservations and modeling of the C-band backscattervariability due to multiscale geometry and soil moisture.IEEE Transactions on Geoscience and Remote Sensing, 28(5), 886–895.
Beven, K. J. (2002). Rainfall-runoff modeling; the primer. UK:Wiley.
Borgeaud, M., Attema, E., Salgado-Gispert, G., Bellini, A., &Noll, J. (1995). Analysis of bare soil surface roughnessparameter with ERS-1 SAR In: Proceedings of InternationalSymposium on Extraction of Bio Geophysical Parameterfrom SAR data Land Applications pp: 307–316.
Brown, R. J., Manore, M. J., & Poirer, S. (1992). Correlationsbetween X-, C- and L-band imagery within an agriculturalenvironment. International Journal of Remote Sensing, 13,1645–1661.
Dobson, M. C., & Ulaby, F. T. (1981). Microwave backscatterdependence on surface roughness, soil moisture and soil
Table 7 Multi-incidence angle optimization for enhanced soilmoisture model
Multi-incidence angleconfiguration (additionalindependent variable)
R2 Standard Error of theEstimate (SEE)
s0IS�4ðVV Þ
s0IS�6ðVV Þ
� �0.77a 0.98a
s0IS�4ðVV Þ
s0IS�2ðVV Þ
� �0.72 1.08
aMost significant
J Indian Soc Remote Sens (September 2012) 40(3):541–550 549
texture: part III-soil tension. IEEE Transactions onGeoscience and Remote Sensing, 19, 51–61.
Dubois, P. C., van Zyl, J., & Engman, T. (1995). Measuring soilmoisture with imaging radars. IEEE Transcations onGeoscience and Remote Sensing, 33, 915–926.
ESA, 2006. ENVISAT ASAR Handbook 2.1.Fung, A. K., Li, Z., & Chen, K. S. (1992). Backscattering from
a randomly rough dielectric surface. IEEE Transactions onGeoscience and Remote Sensing, 30, 356–369.
Fung, A. K. (1994). Microwave scattering and emission modelsand their applications. UK: Arctech.
Hoeben, R., Troch, P. A., Zhongbo, Su, Mancini, M., & Chen,K. S. (1997). Sensitivity of radar backscattering to soilsurface parameters: a comparison between theoreticalanalysis and experimental evidence. IEEE Transcationson Geoscience and Remote Sensing, 3, 1368–1370.
Holah, N., Baghdadi, N., Zribi, M., Bruand, A., & King, C.(2005). Potential of ASAR/ENVISAT for the character-ization of soil surface parameters over bare agriculturalfields. Remote Sensing of Environment, 96, 78–86.
Laur, H., Bally, P., Meadows, P., Sanchez, J., Schaettler, B.,Lopinto, E., et al. (2004). Derivation of the backscatteringcoefficient σo in ESAWRS SAR PRI. (http://earth.esa.int/pub/ESA_DOC/ers_sar_calibration_issue2_5f.pdf)
Lillesand, T. M., & Kiefer, R. W. (2000). Remote sensing andimage interpretation. New York: Wiley.
Lin, D. S., Wood, E. F., Beven, K., & Saatchi, S. (1994). Soilmoisture estimation over grass-covered areas usingAIRSAR.International Journal of Remote Sensing, 15, 2323–2343.
Morgan, R. P. C. (2001). A simple approach to soil lossprediction: a revised Morgan-Morgan-Finney model.Catena., 44, 305–322.
Oh, Y., Sarabandi, K., & Ulaby, F. T. (1992). An empirical-model and an inversion technique for radar scattering frombare soil surfaces. IEEE Transactions on Geoscience andRemote Sensing, 30, 370–381.
Rosich, B., & Meadows, P. (2004). Absolute calibration ofASAR Level 1 products, ESA-ESRIN and BAESYSTEMS Advanced Technology Centre.
Saran, S., Roy, P. S., Kumar, S., Sterk, G., & Oevelan, P. (2002).Role of microwave remote sensing in soil erosion studiesusing inversion process modeling- a precursor attempt inlesser Himalayas. IAPRS & SIS, Vol.34, Part 7, Dec03-06,2002, “Resource and Environmental Monitoring”, ISPRSProceedings Hyderabad, India. pp 57–61.
Saran, S. (2006). Corner reflector installation at the field sitefor microwave ENVISAT ASAR passes, contact newsletter(pp. 7–8). Dehradun: Published by Indian Institute ofRemote Sensing.
Saran, S., Sterk, G., & Kumar, S. (2007). Optimal land use/coverclassification using remote sensing imagery for hydrologicalmodeling in a Himalayan watershed In: Christopher M. U.Neale, M. Owe and G. D’Urso (Editors), Remote Sensing forAgriculture, Ecosystems, and Hydrology IX, Proceedings ofSPIE, 21 Sept, 2007, Firenze, Italy. SPIE, USA. pp. 6742–6764.
Saran, S., Sterk, G., Peters, P., & Dadhwal, V. K. (2010).Evaluation of Digital Elevation Models for delineation ofhydrological response units (HRU’s) in a Himalayanwatershed. Geocarto International., 25(2), 105–122.doi:10.1080/10106040903051967.
Smith, R. E., Goodrich, D. C., Woolhiser, D. A., & Unkrich, C.L. (1995). KINEROS- a kinematic runoff and erosionmodel. In V. P. Singh (Ed.), Computer models ofwatershed hydrology (pp. 697–732). Littleton: WaterResources Publication.
Srivastava, H. S., Patel, P., Manchanda, M. L., & Adiga, S.(2003). Use of multi-incidence angle RADARSAT-1 SARdata to incorporate the effect of surface roughness in soilmoisture estimation. IEEE Transactions on Geoscienceand Remote Sensing., 41, 1638–1640.
Su, Z., & Troch, P. A. (1997). Remote sensing of bare surfacesoil moisture using EMAC/ESAR data. InternationalJournal of Remote Sensing, 18, 2105–2124.
Ulaby, F. T., Moore, R. K., & Fung, A. K. (1986). Microwaveremote sensing: active and passive (Vol. III From theory toapplications). Norwood: Arctech.
van der Sanden, J. J. (1997). Radar remote sensing to supporttropical forest management. Tropenbos- Guyana Series 5,Guyana.
van Oevelen, P. J. (1999). Estimation of areal soil water contentby means of microwave remote sensing. PhD dissertation,Wageningen Agricultural University, Wageningen, TheNetherlands.
van Oevelen, P. J., & Hoekman, D. H. (1999). Radarbackscatter inversion techniques for estimation of surfacesoil moisture: EFEDA-Spain and HAPEX-Sahel casestudies. IEEE Transaction Geoscience Remote Sensing,37, 113–123.
van Zyl, J. J. (1993). The effects of topography on the radarscattering from vegetated areas. IEEE Transcations onGeoscience and Remote Sensing, 31, 153–160.
Walker, J. F., Houser, P. R., & Willgoose, G. R. (2004). Activemicrowave remote sensing for soil moisture measurement:a field evaluation using ERS-2. Hydrological Processes,18, 1975–1997.
Wang, J. R., Engman, E. T., Schmugge, T. J., & Shiue, J. C. (1987).The effects of soil moisture, surface roughness and vegetationon L-band emissions and backscatter. IEEE Transactions onGeoscience and Remote Sensing, 25, 825–833.
Wischmeier, W. H., & Smith, D. D. (1978). Predicting rainfallerosion losses: a guide to conservation planning. UnitedStates Department of Agriculture, Washington, DC, USA.Agricultural Handbook 537.
Zribi, M., & Dechambre, M. (2002). A new empirical model toretrieve soil moisture and roughness from C-band radardata. Remote Sensing of Environment, 84, 42–52.
Zribi, M., Baghdadi, N., Holah, N., Fafin, O., & Guerin, C.(2005). Evaluation of a rough soil surface description withASAR-ENVISAT radar data. Remote Sensing ofEnvironment, 95, 67–76.
550 J Indian Soc Remote Sens (September 2012) 40(3):541–550