Embed Size (px)
Citation preview

University of Southern Queensland Faculty of Engineering and Surveying
Potential Impact of Rising Sea Level on Land Ownership and Government Planning.
A dissertation submitted by
Mr. Alex Lascelles
In fulfilment of the requirements of
Courses ENG4111 and 4112 Research Project
Towards the degree of
Bachelor of Spatial Science
October 2009

Abstract Climate change and consequent sea level rises over the next century will create major
challenges for regulators determining land use. In excess of 150 million people
worldwide live within one metre of mean high water mark (MHWM). Many
populated areas in Australia will face challenges associated with rising sea levels in
the next century.
This study seeks to model the potential impact of rising sea levels on two sample
parcels of land in the Great Lakes and Lake Macquarie areas of New South Wales,
based on anticipated changes to MHWM. It will also explore the consequences for
land ownership where boundaries are defined by MHWM using the principles
outlined in the Doctrine of Erosion and Accretion.
While there is a range of scientific opinion on the scope and speed of climate change,
ranging from quite small to the catastrophic, this study has accepted the models
developed by the Intergovernmental Panel on Climate Change (2007) and regional
variations for the east coast of Australia proposed by the Commonwealth Scientific
and Industrial Research Organisation.
Anticipated sea level rises will cause inundation of low-lying land in many areas of
the world including Australia. There will be a landward migration of MHWM
creating ownership issues for landowners and planning issues for government and
regulatory bodies. Regulatory bodies will need to proceed cautiously with future land
use to avoid legal liability for a foreseen event.
i

University of Southern Queensland Faculty of Engineering and Surveying
ENG4111 Research Project Part 1 & ENG4112 Research
Limitations of Use The Council of the University of Southern Queensland, its Faculty of Engineering and
Surveying, and the staff of the University of Southern Queensland, do not accept any
responsibility for the truth, accuracy or completeness of material contained within or
associated with this dissertation. Persons using all or any part of this material do so
at their own risk, and not at the risk of the Council of the University of Southern
Queensland, its Faculty of Engineering and Surveying or the staff of the University of
Southern Queensland.
This dissertation reports an educational exercise and has no purpose or validity
beyond this exercise. The sole purpose of the course "Project and Dissertation" is to
contribute to the overall education within the student’s chosen degree programme.
This document, the associated hardware, software, drawings, and other material set
out in the associated appendices should not be used for any other purpose: if they are
so used, it is entirely at the risk of the user.
Professor Frank Bullen
Dean
ii

Acknowledgements
I would like to thank my supervisor, Shane Simmons, for his assistance in developing
this project and providing on-going feedback throughout the course of the year. I
would also like to thank my colleague, Nigel Delfs, for assistance with the field work
and professional advice. For the provision of resources, equipment and office
facilities, I would like to thank Michael O’Sullivan, Executive Director, RPSHSO
located in Broadmeadow.
Finally I would like to thank my wife, Laura, for her patience and assistance in
completing the project.
iv

Table of Contents Abstract i
Limitations of use ii
Certification ii
Acknowledgements iv
Table of Contents v
List of Figures vii
List of Tables viii
List of Appendices ix
List of Abbreviations x
Chapter 1 Project Introduction 1.1 Introduction 1
1.2 Project Aims 2
1.3 Project Objectives 3
1.4 Summary 4
Chapter 2. Literature Review 2.1 Introduction 5
2.2 Population 5
2.3 Sea Level Rise, Past, Present & Future 5
2.4 The Range of Scientific Opinion 7
2.5 Conclusion and Adopted Model 9
2.6 Mean High Water Mark 10
2.7 Ambulatory (MHWM) Boundaries –
The Doctrine of Erosion and Accretion 11
2.8 Duty of Care 12
2.9 Government Policy 13
2.10 Conclusion 15
v

Chapter 3. Project Methodology/Justification/Resource Analysis 3.1 Introduction 16
3.2 Defining the Case Study Land Areas 16 3.3 Defining Future Sea Level Changes to Case Study Areas 17 3.4 Details of the Land Areas 17
3.4.1 Site 1 Brightwaters 17 3.4.2 Site Pindimar 19
3.5 Collection of Historical Data and Search 21
3.6 Description of Data Collection & Redefinition of
Case Study Areas 21
3.7 Justification of Methodology 22
3.8 Equipment/Resources Selection and Justification 23
3.9 Investigation Protocols 23
3.10 Conclusion 24
Chapter 4 Results 4.1 Introduction 25
4.2 Site 1 Brightwaters 25
4.3 Site 2 Pindimar 30
4.4 Conclusion 35
Chapter 5 Discussion
5.1 Implications for case Study Lots 36
5.2 Broader Implications 38
5.3 The Doctrine of Erosion and Accretion – Will it Suffice? 40
5.4 Project Contribution to Sustainability 41
Chapter 6 Conclusion and Recommendations 43 References 44
vi

List of Figures
1. Projected Global Sea Level Rise for 21st Century. 10
2. Section of DP for Lot 68 DP8055 for Brightwaters. 18
3. Aerial Photograph of Brightwaters Land Parcel. 19
4. Section of DP 10869 Showing Lot 15 for Pindimar. 20
5. Aerial Photograph of Pindimar Land Parcel. 21
6. Contour Plan Showing Current MHWM at Brightwaters. 25
7. Contour Plan Showing Predicted MHWM
for 2050 at Brightwaters. 26
8. Contour Plan Showing Predicted MHWM
for 2100 at Brightwaters. 27
9. Photographic View of Brightwaters Site Showing Foreshore 29.
10. Photographic view of Brightwaters Site Showing
Topographical Features. 30
11. Contour Plan Showing Current MHWM at Pindimar. 30
12. Contour Plan Showing Predicted MHWM for 2050 at Pindimar 31.
13. Contour Plan Showing Predicted MHWM for 2100 at Pindimar. 32
14. Photographic Evidence of Erosion and Undercutting at Pindimar. 32
15. Photograph Showing Proximity to Sea Level at Pindimar. 34
16. Photograph Showing Existing Topography & Vegetation
at Pindimar. 35
vii

List of Tables
1. Projected Sea Level Rise for 2050 and 2100. 9
2. Changes in MHWM at Brightwaters to 2100. 17
3. Changes in MHWM at Pindimar to 2100. 17
4. Changes in Eastern and Western Boundary for Brightwater. 28
5. Changes in Metres From Original MHWM for Brightwaters. 28
6. Percentage of Land Lost to Inundation
at 2050 and 2100 Brightwaters. 29
7. Changes in Northern and Southern Boundaries for Pindimar. 33
8. Changes in Metres From Original MHWM for Pindimar. 33
9. Percentage of Land Lost to Inundation at 2050
and 2100 Pindimar. 34
viii

List of Appendices
A. Project Specification 46
B. MHWM – Manly Hydraulic Laboratory for Pindimar 47
C. MHWM – Manly Hydraulics Laboratory for Brightwaters 48
D. SCIMS Document Pindimar 49
E. SCIMS Document Brightwaters 50
F. CRE Search Pindimar 51
G. CRE Search Brightwaters 52
H. Deposited Plans Pindimar 53
I. Deposited Plans Brightwaters 55
J. Contour Plan Showing Current MHWM Brightwaters 57
K. Contour Plan Showing Predicted 2050
MHWM Brightwaters 58
L. Contour Plan Showing Predicted 2100
MHWM Brightwaters 59
M. Cross Sections of DTM 2009, 2050, 2100 Brightwaters 60
N. Contour Plan Showing 2009 MHWM Pindimar 61
O. Contour Plan Showing Predicted 2050 MHWM Pindimar 62
P. Contour Plan Showing Predicted 2100 MHWM Pindimar 63
Q. Cross Sections of DTM 2009, 2050, 2100 Pindimar 64
R. Project Sustainability Matrix 65
ix

List of Abbreviations
MHWM Mean High Water Mark
CSIRO Commonwealth Scientific & Industrial Research Organisation
IPCC Intergovernmental Panel on Climate Change
DECC Department of Environment & Climate Change
NSW New South Wales
ppm Parts per million
CO2 Carbon dioxide
cm centimetres
DTM Digital Terrain Models
AHD Australian Height Datum
CRE Cadastral Records Enquiry
DP Deposited Plan
x

Chapter 1 1.1 Introduction
The maps of the world will have to be redrawn. (Sir David King, UK
Science Adviser)
Climate change is a dominant topic in both global and local politics. The implication
of climate change for a planet with a rapidly expanding human population are at best
challenging for the future of humanity and at worst, potentially catastrophic. While
debate rages within scientific circles about the extent of climate change, there appears
to be consensus that the Earth is warming and as a consequence sea levels are rising.
While it is not within the terms of reference of this paper, overwhelming scientific
opinion suggests the causal effect of climate change is the elevation in carbon levels
as a result of human activity, particularly since the industrial revolution (ref Garnaut
report). The important aspect of climate change, and indeed the focus for this study,
is based on the premise that the Earth is warming and that there will be consequential
effects of this including, but not limited to, sea level rises. Although other scientific
opinion exists regarding the causality of global warming including the views of
geologist Ian Plimer, who refutes the contribution of carbon levels to changes in
global temperature, there is little doubt in scientific circles that for whatever reason,
the planet is warming. As Walker and King (2008, p.23) clearly state: “In summary,
we know the world is warming.”
Accepting this premise, this study will seek to identify the projections for sea level
changes in the next 100 years and apply this information to two specific land parcels
in the Lake Macquarie and Great Lakes areas of New South Wales that may be at risk.
The study will explore the implications to the Doctrine of Erosion and Accretion in
relation to changes in mean high water mark as a consequence of climate change.
From the findings of the study the discussion will focus on the implications for
planning and zoning in the future.
1

1.2 Project Aims
The focus of this paper is to:
1.1 examine the implications of sea level rises on land ownership, based on an
analysis of scientific opinion on the extent of sea level changes expected over
the next 100 years.
1.2 examine the concept of mean high water mark and the legal implications for
landowners including the application of the doctrine of erosion and accretion
in relation to changes in high water mark.
1.3 explore, based on the projected changes in sea level, the legal, social and
planning implications for government in dealing with inundation
1.4 conduct a case study of two blocks of waterfront land of different topography
and zoning in the Great Lakes and Lake Macquarie areas with the view to
applying the findings in the above areas to their specific situations.
1.5 identify the issues for land ownership on the blocks identified in the study
and explore the broader implications.
2

1.3 Project Objectives
This research project seeks to identify the effect of changes in mean high water mark
(MHWM) as a result of climate change on land ownership and the legal, social and
planning implications for the future. This will be achieved by targeting two case
study land parcels abutting coastal areas in the Newcastle region. The case study
parcels selected are topographically different and provide two useful perspectives of
the effect of sea level rise on land ownership.
In the course of the study, the projected sea level rises over the next century will be
examined. There is an extensive range of literature exploring models of climate
change and consequent sea level rise. One key objective will be to identify a model
of climate change that is broadly accepted as being based on the best evidence
available and therefore a reasonable basis for planning. Climate change models are
under constant review and refinement as a result of new data and better modelling
techniques. This implies that predicted changes will also be revised which has
substantial implications for planning authorities. The preparedness of government
authorities, in particular the Great Lakes and Lake Macquarie Councils where the
project land is located, will be explored set against the accepted climate change
models.
The research methodology requires an understanding of the concept of MHWM and
the way it is used to define coastal boundaries. The methodologies for defining
MHWM will be reviewed and a justification for the study methodology provided.
The definition and concept of MHWM are critical aspects of this study. Apart from
the obvious link to rising sea level, there is a large legal component particularly in
relation to the Doctrine of Erosion and Accretion. The literature review will cite
specific case studies involving changes to MHWM and the implications for land
ownership including zoning regulations. Further, the broader implications for
government authorities in dealing with such cases will be considered.
The study will also review government planning policies applying to climate change
and in particular sea level change. This will include government at all levels and the
3
degree and importance of the link between the various levels of government. An
examination of the possible responses to property affected by changes to MHWM will
be conducted.
Two land areas have been identified as case study lots for this project. They are
located in the Great Lakes and Lake Macquarie Shires of New South Wales, both in
proximity to the Newcastle areas. The lots offer two perspectives on the affect of
changes to MHWM due to their topography and current land use. Surveys will be
conducted on the lots to ascertain current MHWM. Using survey plans and
photographs, the consequential effects of sea level rise will be shown based on the
findings identified in the literature review. The implications for the study lots will be
examined from a local viewpoint and extrapolated to provide an insight into the
national perspective.
1.4 Summary
The findings of this study will be used to review the practical and legal position of the
landholders on the case study lots. The research will seek to identify the adequacy of
government and planning policy for future development. The literature review that
follows in the next chapter will explore each of the aforementioned issues, with the
broad objective of reaching an acceptable model on which to base changes to MHWM
over the course of the next century.
The outcomes of this study will provide a clear illustration of the need for a review of
coastal lands in the local Newcastle region and indeed nationally. While there
appears to be a broader acceptance of the reality of climate change and its consequent
effects, there is a growing urgency to review land use in potentially at risk areas and
consider the issues faced by landholders and the adequacy of current law to deal with
the impending issues.
4

Chapter 2
Literature Review
2.1 Introduction
This chapter will review the literature to establish projections for changes in sea level
over the next century. It will consider the range of views and seek to identify the
most authoritative evidence at this point in the climate change debate. This will
provide the basis for application to the case study land parcels. The literature review
will also seek to establish and justify the methodology used in defining and
establishing MHWM and its relationship to the doctrine of erosion and accretion.
Government policies pertaining to coastal lands and climate change will be reviewed
with reference to applicable case law.
2.2 Population
Over three billion people worldwide live within two hundred kilometres of a
coastline. It is estimated that 150 million people worldwide live within an elevation
of one metre from high tide level and 250 million within five metres (Commonwealth
Scientific and Industrial Research Organisation (CSIRO) website, 2009). In
Australia, most human habitation is in coastal areas and waterfront land has become a
highly prized possession. Clearly changes to sea level will have a major impact on
many people around the world.
2.3 Sea Level Rise Past, Present & Future
There is considerable debate in scientific circles about the extent of sea level rises. In
the period from 1870 –2001 global sea level rose by 17 cm at a rate of 1.7mm per
year (Church & White, 2006). It was further noted by the authors that sea level rises
accelerated during the latter part of the 20th century. Walker and King (2008)
5

generally support this stating that for the twentieth century, the rise was 2 mm per
year rising to 3 mm per year in the latter part of the century. They further suggest that
this rate is still accelerating and state that even without calculating ocean inflows from
melting ice sheets and glaciers, a rise of 10 cm is possible in the next few decades.
Over half of the rises in sea level to date can be accounted for by expansion of the
ocean volume due to warming. The full effect of melting glacial ice, melting of the
Greenland and Antarctic ice shelves, and the reduced reflection of sunlight by the
diminishing ice mass at the North Pole, has not been fully realised (Hansen, 2007).
There is a range of predictions about rises to sea level, from totally catastrophic
estimates to more modest changes. The James Hanson Group at NASA Goddard
Institute (cited in Gaia, 2009, p37) suggest a sea level rise in excess of five metres by
2100 based on their modelling. This is at odds with the more conservative estimates
made by the Intergovernmental Panel on Climate Change (IPCC). The IPCC consists
of leading climate scientists and government advisers from around the globe. While it
is regarded as the definitive authority on climate change, it is generally considered
conservative, possibly due to the wide range of views to be reflected (Walker & King
2008). IPCC reports from 2001 and 2007 (IPCC, 2001 & IPCC, 2007) suggest a
range of possible sea level rises based on various greenhouse gas emission scenarios.
The upper limit scenario has been adopted in the New South Wales Sea Level Rise
Policy Statement (2009) based on the fact that the emission level on which it is based
has already been exceeded. The upper limit scenario for 2100 is derived from the
IPCC prediction of 59 cm. However this model fails to take account of glacial and ice
sheet melt known as “dynamic melting of ice sheets” (Gore, 2006). The IPCC report
(2007) states that if this melting were to grow in line with a rise in global temperature,
the sea level rise would be a further 10 – 20 cm by 2100. The IPCC further cautions
that these levels could be exceeded. Sea level rises will also have a regional impact
due to oceanographic and atmospheric conditions at different places around the globe.
The CSIRO in conjunction with the Department of Environment and Climate Change
(DECC) suggests a New South Wales (NSW) regional variation of 8cm by 2030 and
12 cm by 2070. The DECC (2009) has extrapolated these figures to fit the 2050 and
2100 time frame creating regional increases above the model to be 10 cm and 14 cm
respectively. This provides a benchmark of 40 cm for 2050 and 90cm for 2100.
6

2.4 The Range of Scientific Opinion
The Garnaut Climate Change Review (2008) has drawn attention to the emission
levels adopted by the IPCC in developing climate models. The report suggests that
unless rapid reductions in carbon levels can be achieved in the short term, which
current trends do not indicate, the IPCC scenarios even at the highest end will be
exceeded. The Garnaut Report models a number of emission scenarios, each of which
is largely dependent on the global response to reducing carbon emissions. The report
makes the following note on the level of human activity:
“The largest source of increased urgency is the unexpectedly high
growth of the world economy in the early twenty first century,
combined with unexpectedly high-energy intensity of that growth and
continuing reliance on high emission fossil fuel as sources of energy.”
(Garnaut, 2008).
Based on the uncertainty around the various climate change models that form the
basis of much of the current policy formulation by government authorities in
Australia, it is important to consider other credible sources where projections differ
from the current wisdom. Rahmstorf, Cazenave, Church, Hansen, Keeling, Parker,
Somerville (2007, p709) draw attention to the inadequacy of IPCC projected estimates
in the 1993 –2006 period of 2mm/year. Satellite data for the period showed a linear
trend of 3.3 mm/year. Further the rate of sea level rise for the last twenty years has
been 25% faster than the rate of rise in any twenty-year period for the last 115 years.
It is also interesting to note that the authors point out that the largest contributors to
rising sea levels to date are ocean thermal expansion and melting from non-polar
glaciers. They also point out that the contribution from ice sheet melt (that is
Antarctica and Greenland) has thus far been small but expect that these areas will
contribute far more in the future. In summary:
“projections, as summarised by the IPCC, have not exaggerated but
may in some respects even have underestimated the change, in
particular for sea level.” (Rahmsdorf et al, 2007, p709)
7

While Rahmsdorf and his colleagues query the adequacy of the IPCC models, there
are a number of highly credible researchers in the climate change field who take an
even more drastic view of sea level change. Hansen (2007) who heads the NASA’s
Goddard Institute for Space Studies, asserts that a 2 – 3 degree Celsius rise in
temperature over the next century would result in sea level rises closer to five metres
and rejects the linear approach to calculating melting ice sheet, particularly with an
unclear future in regard to atmospheric carbon levels. He also suggests that the Earth
is now believed to be within one degree Celsius of the warmest it has been in the last
one million years. In historical terms, the Earth was last in a similar state climatically
to the present about three million years ago. Carbon levels were similar, perhaps
slightly higher and temperatures two to three degrees warmer. Sea levels were 10 to
25 metres higher than today. Hansen is also critical in his article of the research
funding in this field, noting that moderate predictions are more likely to attract
research dollars!
The complexities of climate change are immense and there is considerable
disagreement amongst scientists and academics in this field other than the basic
premise that the climate is warming as a result of human activity (Gore, 2006). The
IPCC modelling and predictions have been widely used by government bodies in
Australia to date. It should be carefully noted that there are predictions by creditable
sources both above and below these estimates. There is concern that IPCC estimates
are conservative (Walker & King , 2008).
Much of the key to climate change is linked to the levels of carbon in the atmosphere
with temperature rises in the future adjusted accordingly. At the lower end
predictions (450 parts per million (ppm) CO2) a temperature rise of 2.5 degrees
Celsius is predicted (thought to be the lowest we can hope for). At the higher end
(650 ppm CO2) there would be a likely temperature rise of 4 degrees Celsius (Walker
& King 2008). Without immediate urgent action, it is anticipated that by 2035, CO2
will be at 550 ppm and by century’s end over 1000 ppm, which would certainly flow
dramatically into sea level rises and indeed rates of change. Walker and King (2008)
are adamant that carbon levels are the key link in the global warming story stating:
8

“There are plenty of areas for debate in the global warming story but
this is not one of them. If anybody tells you differently they either have
a vested interest in ignoring the scientific arguments or they are a
fool.”
2.5 Conclusion and Adopted Model
The IPCC appears to be the most respected authority in the area of climate change and
sea level rise. While there is credible debate around the extent of temperature
increases linked to CO2 levels and the consequential sea level rises, major authorities
in Australia including CSIRO and state and federal authorities working in this field
tend to support the IPCC predictions as “the most robust” (CSIRO 2009). From the
literature review to date, it appears (and the IPCC concedes) that the figures provided
(90 centimetres (cm) rise by 2100), while at the upper end of their modelling, may
still be exceeded. The modelling for this project will therefore be based around the
upper and lower projections of the IPCC models, which reflects the likely views to be
taken by authorities in Australia.
The table below outlines projected sea level rises for 2050 and 2100 based on the
upper range scenario outlined by the IPCC and including a regional allowance derived
from CSIRO modelling (2009, DECC).
Component Year 2050 Year 2100 Sea level rise 30 cm 59 cm Accelerated ice melt (included in above value) 20 cm Regional sea level rise variation
10 cm 14 cm
Rounding* - -3 cm Total 40 cm 90 cm
Table 1. Projected Sea Level Rise for 2050 and 2100.
9

Figure 1 below illustrates the model projections made by the IPCC using a range of
scenarios based on differing atmospheric carbon levels.
Figure 1. Projected Global Sea Level for the 21st Century.
2.6 Mean High Water Mark
Butt (1996, p40) defines mean high-water mark (MHWM) in the following way:
“The mean high-water mark is the line of the medium high tide
between the highest tide each lunar month (the springs) and the lowest
tide each lunar months (the neaps), averaged out over the year.”
He further states that land below this level belongs to the Crown and includes the
foreshore, that is, the land lying between high and low water marks.
Watson & Harcombe (2004) identify two types of waterfront boundaries in NSW,
namely Right Line boundaries and ambulatory boundaries. In summary, the right line
boundary is defined against survey monuments, linear measurements and adjoining
boundaries. Ambulatory boundaries are boundaries that are subject to movement over
time and are defined by rivers, streams, the shorelines of lakes and the sea (which
10

include the water boundaries of the target properties in this study). These boundaries
are subject to change including the MHWM. Due to changes in global climate,
oceanographic conditions or a range of other natural (and man made) phenomena, this
measurement is less definitive at any point in time. Fifty thousand waterfront
properties in NSW are defined by this mechanism.
2.7 Ambulatory (MHWM) Boundaries – The Doctrine of Erosion
and Accretion
Ambulatory boundaries, in accordance with Common Law principles, give ownership
rights to the MHWM (Lipman & Stokes, 2003). As stated, this boundary is subject to
change. These boundaries are based on the doctrine of erosion and accretion. It is
based on the principle that the sea and its foreshores should be held in trust by the
Crown on behalf of its citizens (Gordon, cited in Watson & Harcombe, 2004). There
is now considerable debate as to the application of this doctrine in the light of climate
change (Lipman & Stokes, 2003).
The doctrine of accretion and erosion applies to where the boundary between land and
water changes in a manner that it is not readily noticeable (Hughes Ed, 2007). Butt
(1996) identifies two basic tests that apply to accretion and erosion. The slow and
gradual test states that the change must be so slow and imperceptible to the naked eye
as it occurs. The second test is that the changes must be from a natural process not
from artificial sources such as reclamation by human intervention. In practice, this
means that land added to belongs to the owner and land encroached upon by water
belongs to the Crown. In the case of global warming and subsequent sea level rise,
the process of divulation may occur. This refers to the encroachment of water and is
the opposite of accretion (Department for Transport, Energy & Infrastructure, South
Australia, 2009). Erosion also fits under this category.
11

2.8 Duty of Care
It has been well established so far that sea level rises as a result of climate change will
impact on high water marks around the globe. Government authorities will be
exposed to a range of pressures in the future regarding waterfront properties (Lipman
& Stokes, 2003). In particular local councils may be exposed to legal action if their
decisions on development do not show a duty of care. In July 2008 the Gippsland
Coastal Board challenged South Gippsland Shire Council regarding permits issued for
six single dwellings at risk of coastal subsidence and inundation due to sea level rises
predicted by a commissioned CSIRO study. Section 60 (1) (e) of the Planning and
Environment Act 1987 (Vic) states:
“before deciding on an application, the responsible authority must
consider… any significant effects which the responsible authority
considers the use or development may have on the environment or
which the responsible authority considers the environment may
have on the use or development.”
It was determined that a general consensus existed that climate change would create
conditions that historical records could not adequately provide for in planning terms.
It was also determined that there was an unacceptable and foreseeable risk of
inundation. The approvals were overturned.
In NSW, the case of Walker v the Minister for Planning, also takes account of climate
change and sea level rises. In this case Justice Peter Biscoe in 2007 overturned a
decision by the NSW Planning Minister for a proposed residential development at
Sandon Point, near Wollongong. Justice Biscoe stated in the decision that the
Minister failed to take into account implied mandatory considerations including the
principle of ecologically sustainable development and, in particular, impact of
flooding and inundation of the project land that would ultimately be exacerbated by
climate change.
12

The High Court of Australia in recent cases has examined ‘salient factors’ in
determining whether a duty of care exists. They identify six key factors:
• Statutory Powers – do the powers exist for the relevant authority?
• Proximity – is the relationship between the parties one of neighbourhood?
• Control – does the authority have the power to control the situation that
brought about harm?
• Knowledge – did the authority know, or ought to have known of an existing
risk of harm?
• Vulnerability - is the claimant vulnerable in the sense that he or she could not
safeguard her or himself?
• Reasonableness – is it reasonable in all the circumstances for the authority to
show a duty or care. (Lipman & Stokes, 2003).
The Local Government Act 1993 Section 733(1) offers some protection to councils in
relation to coastal erosion, provided decisions are made “in good faith.” This implies
that the council acts in accordance with guidelines such as the Coastline Management
Manual 1990. Councils may also be exposed under the Civil Liability Act NSW 2002
although this act tries to restrict the liability of public authorities for issues such as
personal injury or death as a result of coastal hazards, but the issue of property
damage from coastal erosion is yet to be tested (Lipman & Stokes 2003). They also
provide a range of scenarios where councils could be seriously compromised and
liable in relation to the zoning and development consent provided to properties in at
risk areas, based on our developing knowledge and understanding of climate change.
Lipman & Stokes (2003) make the point that traditional interpretations of the
doctrines of accretion and erosion are incongruous with modern environmental policy
because they do not adequately reflect the interests of the general population and their
rights to securing public access to waterfront land. As most issues are now related to
erosion and divulation rather than accretion on the NSW coast, coastal foreshore will
become an issue of greater significance as the effects of sea level rise further impacts
the coastline.
13

2.9 Government Policies
The NSW Government has released a Draft Sea Level Rise Policy Statement outlining
policies, programs and legislation in relation to coastal hazards including rising sea
levels. Fundamental to this statement is reference to the 1997 NSW Coastal Policy
that seeks to guide the development of the coastal zone in an ecologically sustainable
manner. It provides guidance to councils in the planning and management of coastal
areas. Coupled with these policies, the Sea Level Rise Policy Statement considers the
economic, social and environmental impacts of sea level rise, and outlines five policy
principles:
• an adaptive, risk based approach
• provision of guidance to councils
• guide appropriate development on at risk land
• provision of emergency management support in floods and storms
• provision of up-to-date information on sea level rises
The NSW DECC has developed a draft technical note entitled the ‘Scientific Basis of
the 2009 Sea level Rise Benchmark.’ This document essentially embraces the IPCC
2007 sea level model described above, including the CSIRO regional allowance. It is
currently the basis for sea level rise advice in NSW.
The Lake Macquarie Council has adopted the NSW DECC recommendation for the
upper limit sea level rise in determining “risk assessment, policy development,
community empowerment, planning and development decisions” (Lake Macquarie
Sea Level Rise Preparedness Adaptation, 2008). They have also made a commitment
to review polices in light of changes of position by the NSW DECC as new
information becomes available. This decision is wise in light of the legal implications
outlined for government authorities in previous sections.
It is interesting to note that Great Lakes Council, the site of the Pindimar blocks
targeted in this study, do not yet have a clear policy position such as the above from
Lake Macquarie Council.
14

2.10 Conclusion
While there is an extensive range of scientific opinion on the magnitude of climate
change and consequent sea level rise within the academic literature, the IPCC
predictions and the CSIRO regional adjustments provide the most credible and widely
agreed view at this time. However it is important to appreciate the complexity of the
science associated with the Earth’s climatic system and the potential for error in
making predictions. The IPCC will no doubt take an adaptive approach to their
predictions as more evidence comes to light and more reliable modeling techniques
are developed. This factor is actually one of the greatest challenges for planning
authorities in terms of deciding on what predictions to adopt. This study will use the
IPCC and CSIRO models with the cautionary note that adaptations over time are
inevitable.
The properties used in the case study parcels are defined by ambulatory boundaries.
Based on the adopted projections, encroachment of water will take place as a result of
changes to MHWM. The doctrine of erosion and accretion applies in the sense that
the boundary between land and water change will be slow and imperceptible to the
naked eye. However the second test, that is, it must be from natural processes, may
open considerable debate if man made global warming is clearly established as the
cause. Government authorities will be tested in terms of their duty of care, not only in
terms of future land use, but whether they have acted “in good faith.” Certainly a
failure to act on the basis of information such as the IPCC projections, or other
credible models, would seriously test this premise.
The following chapter detailing the methodology applies the findings in this chapter
to the case study land parcels.
15

Chapter 3 Project Methodology/Justification & Resource Analysis
3.1 Introduction
In designing this project, it was decided to try and contrast the effects of sea level rise
on different coastal areas by selecting land parcels with different topographical
features. Lake Macquarie and Port Stephens are located in close proximity to
Newcastle and have varying levels of exposure to sea level change. The
topographical difference between the two land parcels establishes the effect of
migrating MHWM on the overall loss of land and the implications for its future use.
By applying the IPCC/CSIRO sea level models for 2050 and 2100, a clear picture of
the effects on each land parcel can be displayed.
3.2 Defining the Case Study Land Areas
Two parcels of land that may be affected by rising sea levels have been selected for
the purposes of this study. Both these parcels are bounded by tidal waters and are
defined by Mean High Water Mark (MHWM). The identified sites provide examples
of the contrasting effects that rising sea levels will have on the changing position of
MHWM and the severity of impacts on the landowners.
The natural topography of the land, determines the level of impact of rising sea levels.
A low-lying flat block of land will obviously be more affected than a block of land
that is steep and higher in elevation.
16

3.3 Defining Future Sea Level Changes to Case Study Areas Initially the study identified the current position of MHWM (see method description
below) for both case study blocks. Using the IPCC/CSIRO estimates for sea level rise
over the next 50 and 100 year periods, new MHWM levels were determined to
illustrate the effects of specified sea level changes on the case study lots. This was
simply calculated by adding the current MHWM supplied by Manly Hydraulics
Laboratory to the IPCC predicted rises for the specified locations. Tables 2 and 3
below shows the changes to MHWM for both sites. 1
Year MHWM (estimate) 2009 0.11 2050 0.51 2100 1.01
Table 2. Changes in MHWM at Brightwaters to 2100.
Year MHWM (estimate) 2009 0.476 2050 0.876 2100 1.376
Table 3. Changes to MHWM at Pindimar to 2100.
A series of digital terrain models (DTM) were created for each lot illustrating the
position of the estimated MHWM contour lines at each specified year in the above
table.
3.4 Details of the Land Areas
3.4.1 Site 1 Brightwaters
Street Address: Buttaba Road
Locality: Brightwaters
Local Government Authority: Lake Macquarie
Parish: Morisset
17

County: Northumberland
Lot: 2
DP: 1058010
Figure 2. Section of Deposited Plan for Lot 68, DP8055 for Brightwaters.
*Explanatory Note: This lot was originally known as Lot 68, DP 8055. It has since
been subdivided and now a Lake Macquarie Council reserve abuts the tidal boundary.
For the purposes of this study, it will be assumed that it has not been sub-divided.
The rationale for this is that it will be a significantly easier process to gain permission
from Lake Macquarie Council rather than from a private owner to carry out survey
work. However the block definition will be based on the most current deposited plan.
The ownership issue is irrelevant to the purpose of this study.
The subject lot is on Buttaba Road and running parallel to Lake View Avenue. It
abuts Lake Macquarie on the southern boundary. The property is surrounded by
existing residential development including both new and older style residences. The
18

case study block is steep at the waterfront and gently sloping at the northern, road
end. On surrounding properties there are multiple boatsheds and jetties built over
Lake Macquarie.
Figure 3. Aerial Photograph of Brightwaters Land Parcel
3.4.2 Site 2 Pindimar
Street Name: Carruthers Avenue
Locality: Pindimar
Local Government Authority: Great Lakes
Parish: Coweambah
19

County: Gloucester
Lot: 15
DP: 10869
Figure 4. Section of DP 10869 Showing Lot 15 Pindimar
This case study lot is located at North Pindimar in Great Lakes Shire. It is located on
the northern shores of Port Stephens approximately 70 kilometres north of Newcastle.
The North Pindimar township is in an area of low lying land ranging between zero
and three metres on the Australian Height Datum (AHD). The topography is flat and
the soils is mainly sand. The land is mostly uncleared. Interestingly the village of
Pindimar was sub-divided as a futuristic city with the intent of attracting returning
troops after World War 1. On this basis a plan for small, rare blocks in a rural zoned
area was registered.
20
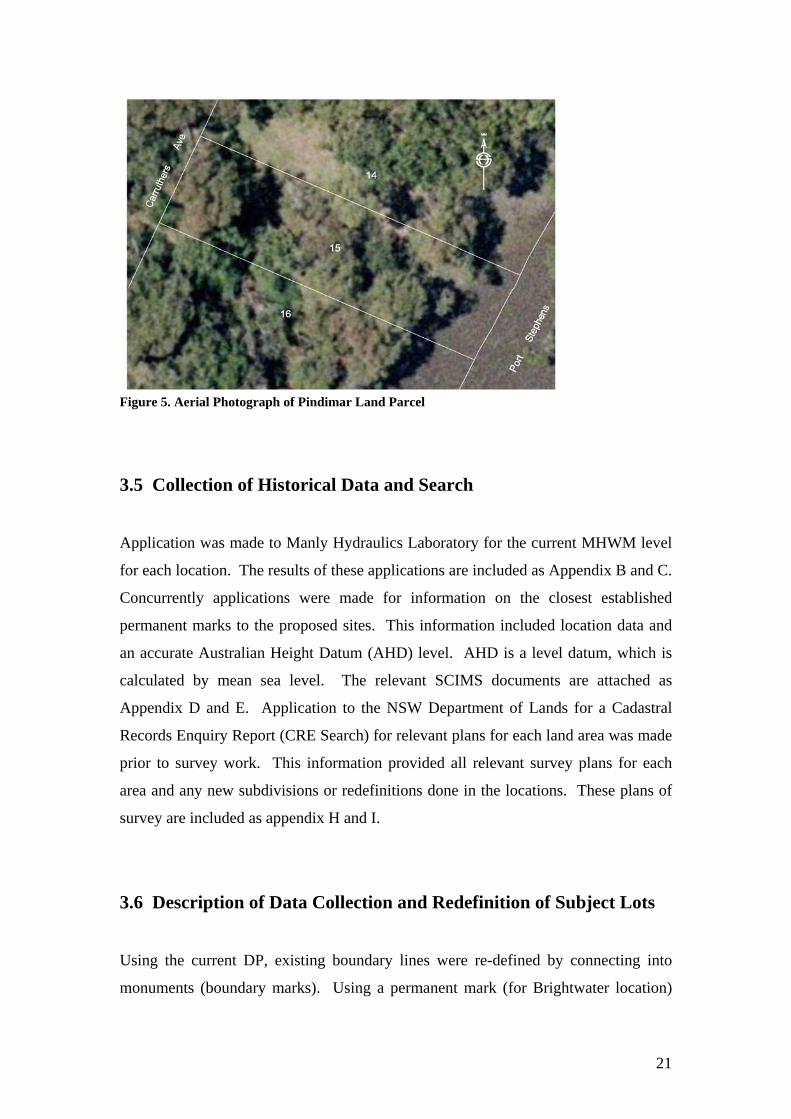
Figure 5. Aerial Photograph of Pindimar Land Parcel
3.5 Collection of Historical Data and Search
Application was made to Manly Hydraulics Laboratory for the current MHWM level
for each location. The results of these applications are included as Appendix B and C.
Concurrently applications were made for information on the closest established
permanent marks to the proposed sites. This information included location data and
an accurate Australian Height Datum (AHD) level. AHD is a level datum, which is
calculated by mean sea level. The relevant SCIMS documents are attached as
Appendix D and E. Application to the NSW Department of Lands for a Cadastral
Records Enquiry Report (CRE Search) for relevant plans for each land area was made
prior to survey work. This information provided all relevant survey plans for each
area and any new subdivisions or redefinitions done in the locations. These plans of
survey are included as appendix H and I.
3.6 Description of Data Collection and Redefinition of Subject Lots
Using the current DP, existing boundary lines were re-defined by connecting into
monuments (boundary marks). Using a permanent mark (for Brightwater location)
21

and state survey mark (for Pindimar location) with an AHD level, the current MHWM
was reinstated. Levels were taken over both sites to produce digital terrain models on
which contour lines were plotted. From this information, the resulting contour maps
over the sites were used to predict MHWM positions, based on IPCC/CSIRO sea level
rises.
3.7 Justification of Methodology
The methodology for re-defining boundaries is standard surveying practice and was
done in accordance with surveying regulations.
There are a number of methodologies for defining MHWM. These include:
• Levelling from a benchmark: this method is commonly used in locations on
the coast reasonably close to tide gauges and where the relationship between
mean high water and Australian Height Datum is known. Newcastle is
identified as an area suitable for this method (Mean High Water Mark and 100
feet reserves, NSW Institute of Surveyors, Sep 06).
• Level from a local tide gauge: studies suggest that this method requires
observations over a twelve-month period or taking the mean of all high waters
observed at a tide gauge over a lunation period of 29 days. This also requires
that tide gauges are available and close enough to take readings.
• The Range Ratio Method: this method requires an automatic tide recorder
and long-term values of the tidal planes. It requires the surveyor to take
readings on one day of high and low water marks of consecutive tides and
applying a formula to calculate mean high water. This method is most
commonly used in streams and estuaries.
While these methodologies have limitations and accuracy issues in certain situations
as discussed in the literature review, it was decided to use the levelling from a
benchmark method. This method provided sufficient accuracy to meet the aims of
the project.
22

3.8 Equipment/Resources Selection and Justification
Typical modern survey party equipment was used to carry out all field measurements.
All field observations were made using a Leica TC 1105 Total Station. Traversing
equipment included Leica Circular Prisms, adaptors, tri-brachs, tripods and range
pole. A digital camera was used to photograph and document various aspects of the
fieldwork.
The standardization of all field equipment including the total station, prisms, tri-
brachs and ranging pole was done prior to commencement of each job. The total
station calibration was undertaken on the University of Newcastle baseline
(recommended in the Surveyors General’s Directions for Survey Practice). All other
equipment was standardized as required. A survey vehicle, personal protective
equipment deemed suitable for the task and signage for safety issues around traffic
areas were used. Safety protocols were followed, including a job safety analysis, risk
assessment and a safe work methods statement.
For the calculations, such as the re-definition of the subject land parcels and plotting
of the position of the MHWM contour lines, the software package, CivilCAD was
used. Drafting of plans and plan presentation was done using AutoCAD (2008).
Access was provided to computer hardware and the aforementioned software to carry
out the fieldwork, plotters and printers for presentation of output data.
3.9 Investigation Protocols
As part of the practical component of the surveying work the following protocols
were followed. All neighbouring property owners were informed of the purpose and
dates of fieldwork. The owners of the land parcel at Pindimar were approached for
approval to carry out the investigation and the associated fieldwork. All safety
measures were outlined to the owners of the land. Lake Macquarie Council were
approached for approval to carry out the survey work on the land at Brightwaters.
Safety measures were again outlined. Both parties were briefed on the surveying
guidelines and protocols used by the company Harper, Somers, O’Sullivan in
23

Newcastle as the equipment used was kindly provided by them. All safety protocols
were followed.
3.10 Conclusion
From the activities outlined above, contour plans were developed for each land parcel
showing current MHWM and the MHWM on the original survey. Both land parcel
contour plans were then superimposed with the IPCC/CSIRO projections for 2050
and 2100 to show the landward migration of seawater. Cross sections were also
developed and calculations made to show the percentage of land area lost to
inundation.
24

Chapter 4
Results
4.1 Introduction
The results gathered on site were recorded in the field notes. They are included as
Appendix F and G. They were collated and contour plans produced illustrating
changes to sea level over the next century. The data collected is outlined below for
each parcel of land.
4.2 Site 1 Brightwaters Appendix H is a contour plan showing the position of the current MHWM. A smaller
version is shown as Figure 5.
Figure 6. Contour Plan Showing Current MHWM Brightwater
25
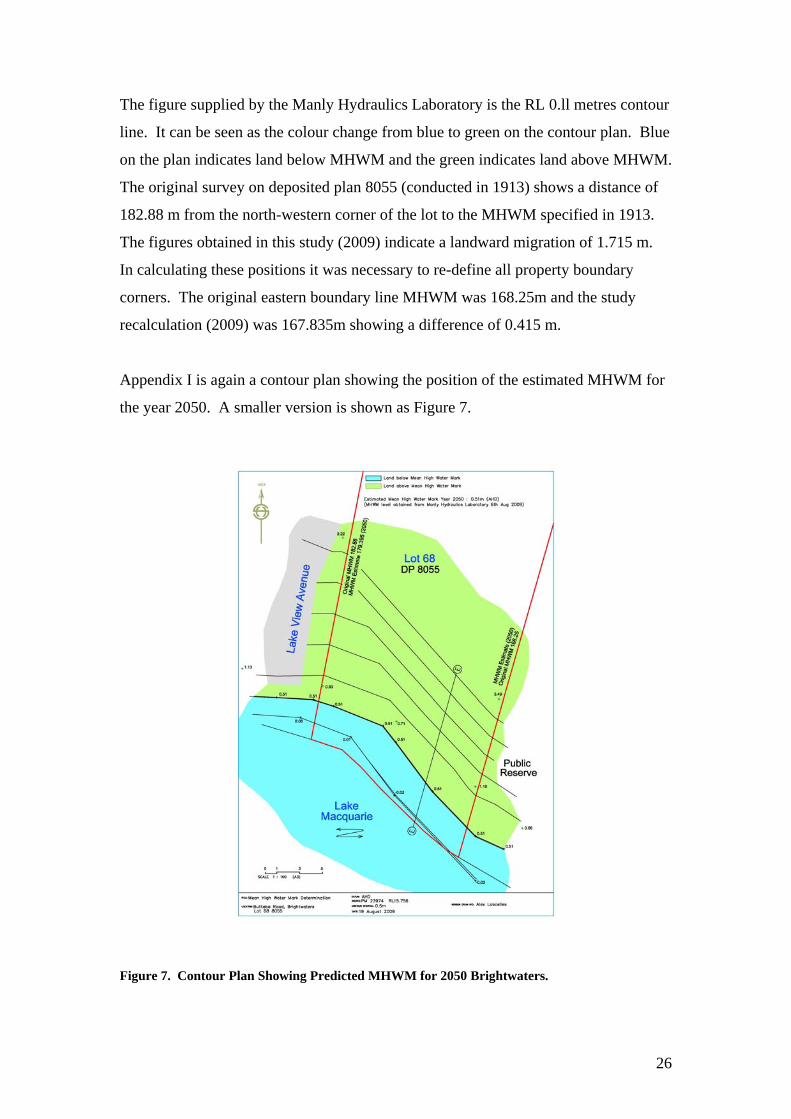
The figure supplied by the Manly Hydraulics Laboratory is the RL 0.ll metres contour
line. It can be seen as the colour change from blue to green on the contour plan. Blue
on the plan indicates land below MHWM and the green indicates land above MHWM.
The original survey on deposited plan 8055 (conducted in 1913) shows a distance of
182.88 m from the north-western corner of the lot to the MHWM specified in 1913.
The figures obtained in this study (2009) indicate a landward migration of 1.715 m.
In calculating these positions it was necessary to re-define all property boundary
corners. The original eastern boundary line MHWM was 168.25m and the study
recalculation (2009) was 167.835m showing a difference of 0.415 m.
Appendix I is again a contour plan showing the position of the estimated MHWM for
the year 2050. A smaller version is shown as Figure 7.
Figure 7. Contour Plan Showing Predicted MHWM for 2050 Brightwaters.
26

The western boundary indicates a landward migration of 3.485m set against the
original MHWM calculated in 1913. The eastern boundary shows a landward
migration of 2.79m. This means that the new MHWM value is RL0.51m.
Appendix J provides a contour plan for the estimated MHWM for 2100. A smaller
version is shown below as Figure 8.
Figure 8. Contour Plan Showing Predicted MHWM for 2100 Brightwaters.
The western boundary is 5.88m landward of the original MHWM. The eastern
boundary is 5.805m landward of the original MHWM.
27

Appendix K provides a cross section of the DTM using an exaggerated vertical scale
for visual purposes. The cross sections show 2009, 2050 and 2100 estimates and
indicate the changes in MHWM set against the topography of the lot.
The raw figures for the above information are presented in the following table and are
shown in metres.
Year Eastern Boundary Western Boundary
1913 original 168.25 182.88
2009 study 167.835 181.165
2050 predicted 165.46 179.395
2100 predicted 162.445 177.0
Table 4. Changes in Eastern and Western Boundaries for Brightwaters.
Year Eastern Boundary Western Boundary
1913 original 168.25 MHWM 182.88 MHWM
2009 study 0.415 1.715
2050 predicted 2.79 3.485
2100 predicted 5.805 5.88
Table 5. Changes in metres from the original MHWM for Brightwaters.
28

0102030405060708090
100Pe
rcen
tage
2009 2050 2100Year
Land above MHWM
Land below MHWM
Table 6. Percentage of land lost to inundation at 2050 and 2100 Brightwaters.
The results indicate a landward migration from the original MHWM. The topography
of this block is such that the incline from the waterfront is quite steep. The contour
lines shown on the contour plan indicate an elevation rise of over 3 metres in the first
15 metres from MHWM.
Figure 9 and Figure 10 provide a photographic view of the Brightwaters site.
Figure 9. Photographic View of Brightwaters Site Showing Foreshore.
29

Figure 10. Photographic View of Brightwaters Site Showing Topographical Features. 4.3 Site 2 Pindimar
Appendix L is the current contour plan created in 2009 for the purpose of this study.
Figure 11 provides a smaller view.
Figure 11. Contour Plan of Current MHWM at Pindimar.
30

On this site the northern and southern boundaries are the lines on which comparisons
will be made. The original MHWM on DP 10869 for the northern boundary is
85.955m taken from the north west corner to the MHWM. The study measurement
(2009) was 71.59m showing a landward migration of 14.365m. The original MHWM
on the southern boundary was 84.735m compared to 70.98m for 2009, showing a
landward migration of 13.755m.
Adopting the same procedure as for site 1, the 2050 and 2100 figures were
extrapolated. The northern boundary measured 68.02m indicating a landward
migration from the original measurement of 17.935m. The southern boundary was
68.42m indicating a landward migration of 16.315m. The figures for 2100 indicate an
almost complete inundation of the lot. Only a small parcel remains above the
estimated MHWM figure for 2100. A visual analysis further indicates that tidal
activity, storm surges and erosion would probably destroy remaining land based on
the topography and base materials (sand) on the lot. Appendix M shows changes to
MHWM for 2050 at Pindimar. The figure below provides a reduced view of the
original.
Figure 12. Contour Plan Showing Predicted MHWM for 2050 at Pindimar.
31

Appendix N shows an almost complete inundation by 2100. A reduced version is
shown below in figure 13.
Figure 13. Contour Plan Showing Predicted MHWM for 2100 at Pindimar.
Evidence of current erosion, such as exposed tree roots and undercutting, suggest
probable total inundation by 2100. Figure 14 is a recent photograph showing the
already vulnerable nature of the foreshore.
Figure 14. Photograph of Evidence of Erosion and Undercutting at Pindimar.
32

Appendix O provides a cross section of the DTM using an exaggerated vertical scale
for visual purposes. The cross sections show 2009, 2050 and 2100 estimates and
provide further illustration of the probable total inundation by 2100.
The following table summarises the raw data on MHWM for the northern and
southern boundaries for the specified periods. Values are in metres.
Year Northern Boundary Southern Boundary
Original 85.955 84.753
2009 study 71.59 70.98
2050 predicted 68.02 68.42
2100 predicted Total inundation Total inundation
Table 7. Changes in Northern and Southern Boundaries for Pindimar.
Changes from the original MHWM, shown in metres are shown in the following
table.
Year Northern Boundary Southern Boundary
Original 85.955 MHWM 84.753 MHWM
2009 study 14.365 13.773
2050 predicted 17.935 16.333
2100 predicted Total inundation Total inundation
Table 8. Changes in Metres from Original MHWM Pindimar.
The following table outlines the percentage of land lost to inundation at 2050 and
2100.
33

0102030405060708090
100Pe
rcen
tage
2009 2050 2100
Year
Land above MHWM
Land below MHWM
Table 9. Percentage of Land Lost to Inundation at 2050 and 2100 for Pindimar .
Figures 15 and 16 are site photographs illustrating the current status of the site
including undercutting as already discussed. Figure 15 highlights the topographic
proximity of the land parcel to the waters of Port Stephens.
Figure 15. Showing Proximity to Sea Level at Pindimar.
34

Figure 16. Showing Existing Topography and Vegetation at Pindimar.
4.4 Conclusion
The results illustrate the potential effect of sea level rise. In particular, the topography
of the land abutting the sea will be fundamental to the percentage loss overall. The
contrast between the two parcels of land, that is, one low lying, the other with a steep
incline away from MHWM demonstrates this. This has substantial implications for
areas of low lying land such as the Pindimar parcel where total inundation is a distinct
possibility. Moreover, regulatory authorities will need to consider carefully their
response to the types of activities that at-risk properties should be allowed to
undertake. There is also a need to review the regulations surrounding land use at
various levels of risk on the continuum from total inundation to more minor
encroachment.
35

Chapter 5
Discussion
5.1 Implications for the Case Study Lots
There is a distinct contrast between the identified effects on both lots. The first lot at
Brightwaters is less affected due to its steep topography. Despite losing some land to
landward migration by sea water, there is enough elevation on the block to ensure the
majority of the land is still usable and probably suitable for housing development,
based on the IPCC/CSIRO estimates. On this particular lot, the land area due to the
change in MHWM, would remain large enough to meet the requirements for its
zoning, that is, 2(1) Residential under the Lake Macquarie LEP 2004. Although
Lake Macquarie City Council has produced A ‘Sea Level Rise Policy Factsheet,’ it
has not yet adopted a sea level rise prediction. However it does refer to the
IPCC/CSIRO figures used in this paper. The lot is currently open to a range of
residential developments including sub-division and residential building. More
radical estimates of sea level change, should they prove to be correct, may change the
level of impact on this lot.
Under the current laws, if application were made, the owners would lose the
inundated land to the Crown in the 2050 and 2100 models. Even with the current
1913 to 2009 (current study) readings, it is likely that a redefinition would be required
as part of a development consent. This is because the local authority would require it
to comply with their developmental control plans, particularly in relation to building
setbacks and land areas and floor levels. Due to the changes in MHWM, the lot size
would be reduced. This would include the land between high and low water mark in
addition to the inundated land. This assumes that the Doctrine of Erosion and
Accretion applies. There are possible grounds for challenge here however. The
Doctrine of Erosion and Accretion states that the change must be gradual and
imperceptible. If sea level rises change in line with IPCC expectations, this may well
be the case. However it also states that the process must be natural and not, for
example, by a man made change such as reclamation. This may raise legal questions
36

about the extent to which global warming and subsequent sea level rise is man made.
While it is quite clear from the literature review that current wisdom suggests this is
the case, it may be more difficult to prove beyond doubt given the fact that world
climate (certainly in the medium to long term) is known to fluctuate. The laws in this
area may need to be reviewed in light of new and more definitive evidence.
The second case study lot at Pindimar is very different. The modelling carried out in
this study suggests that the lot will be all but inundated by 2100 and possibly well
before due to the affects of erosion and divulation. This lot is located in the Great
Lakes Shire and is zoned 1(a) Rural under the Great Lakes Local Environment Plan
1996. The implications of the zoning and potential use of this lot is particularly
relevant to this study. The zone aims to restrict development on the basis of the
following development consents (Great Lakes Shire Website, 2009)
Zone No 1 (a) (Rural Zone)
1 What are the objectives of the zone?
The objective of the zone is to restrict development to those uses which are unlikely to:
(a) prejudice in a significant manner the agricultural production potential of land within the zone, and
(b) generate significant additional traffic, or create or increase a condition of ribbon development on any road, relative to the capacity and safety of the road, and
(c) have an adverse impact on the area’s water resources, and
(d) create unreasonable or uneconomic demands for the provision or extension of public amenities or services.
2 What is permitted without development consent?
Development for the purpose of:
agriculture; bushfire hazard reduction.
3 What is permitted only with development consent?
Any development not included in Item 2 or 4.
4 What is prohibited?
Development for the purpose of:
boarding houses; bulky goods premises; commercial premises; hotels; medical centres; multiple dwellings; off-site promotional signs;
37

residential flat buildings; shops (other than convenience stores); vehicle body repair workshops; vehicle repair stations; warehouses.
While the area remains relatively undeveloped in terms of road infrastructure
(although the road to the block is not formed it is a gazetted road), there is other
evidence of development such as easements on the DP for services onto surrounding
lots and existing overhead electricity. There is also a development consent for an
abalone farm close to the case study lot which would require significant infrastructure
including buildings. There are existing dwellings within 500 metres of the case study
lot. From the Great Lakes Council website and the LEP quoted above, it appears that
the construction of a dwelling or other non-precluded development would be possible
with consent. Given the data gathered in this project and the models developed, it
would appear that Great Lakes Council could place itself at considerable risk if such
developments were approved on the basis of their duty of care. In particular, the
salient factors identified by the High Court of Australia impose some level of
responsibility on statutory authorities. The notion of knowledge – that is, did the
authority know, or ought to have known of an existing risk of harm? No doubt there
will be considerable debate in legal circles as to when it was a reasonable point in
history to know about sea level rise. It should be noted that even the NSW Planning
Minister has been overruled by the court in the case Walker v Minister for Planning
on the basis that certain developments are prone to the effects of sea level changes.
5.2 Broader Implications If one accepts the IPCC models for sea level rises over the next century, vast areas of
the globe will be affected. The case study lots clearly illustrate the vulnerability of
land in proximity to current sea level. However sea level rise is only part of a
broader set of effects of climate change. Lake Macquarie Council in its “Sea Level
Rise Policy Factsheet” identifies five general areas of impact from climate change.
These include:
• Coastal and foreshore erosion, retreat and storm. This includes the risk of
increased flooding, beach realignment, intrusion of saline water and increased
storm surges and long term inundation.
38

• Ecological Impacts including changes to flora and fauna, and the distribution
of wetlands and mangroves.
• Damage to infrastructure such as public and private housing, roads bridges and
public utilities.
• Public Health issues and community well-being.
• Economic costs such as increased insurance premiums, mitigation measures,
depreciation of land and assets and loss of tourism and recreational areas.
Lake Macquarie Council has identified these issues and possible responses. These
include zoning restrictions, planned retreat, building setbacks, raised floor levels,
dune protection and other protective works. While this at least identifies some of the
associated issues with climate change a more coordinated national approach would be
a better course of action. There are philosophical issues associated with the
delegation of power throughout our community. However it must be recognised that
local governments in many regions will not have the resources to make judgements
about the extent and impact of climate change and consequent sea level rises. A
national policy framework would offer local authorities the duty of care that may be a
major issue in the future. The IPCC will continue to up-date its predictions and
government at all levels will need to be adaptive. The most recent modelling by the
IPCC attempts to provide worst case scenarios coupled with percentage chances of its
occurrence. These models may provide the best basis for a national approach. The
other advantage of a national approach using a higher than moderate sea level
predictions is that a foreshore plan ensuring public access in the future could be
accommodated. It is important to note that as with many other local government
authorities, that the recognition of the potential impact of climate change has not yet
translated into specific policy. Indeed this is the case with Lake Macquarie Council.
Great Lakes Council appears to be further behind again.
It is important to review the duty of care and some of the salient factors identified by
the High Court of Australia (2003) in relation to the liability of local authorities in
these matters. In particular, do the powers exist for councils to account for climate
change within their own policy framework? The Draft Sea Level Rise Policy
Statement 2009 put out by the DECC of NSW provides information and support for
39

local councils in their decision making about climate change. This document adopts
the IPCC model, but suggests that refinement of these figures over time should be
anticipated. They recommend and ‘adaptive, risk based approach.’ The NSW
Government has adopted a sea level rise planning benchmark that is designed to
provide guidance on sea level rise impacts. It is designed to operate within current
decision making frameworks including the Environmental Planning and Assessment
Act 1979. However there is no regulatory or statutory requirement to comply. Local
governments are currently guided by a range of policies and legislation to protect life
and property from coastal hazards and flooding. The NSW Coastal Policy 1997 refers
specifically to the possible effects of climate change. This policy applies the
principles of ecologically sustainable development. The Local Government Act 1993
exempts councils from liability in relation to advice, action and omissions in relation
to natural hazards in the coastal zone provided their decisions were taken in good
faith. Good faith implies that the council has acted in accordance with guidelines
such as the Coastline Management Manual (1990).
There is clearly scope within the policy frameworks within NSW for local
government to manage sea level rise through their own planning instruments. It
would appear that local governments that are slow to respond and allow inappropriate
developments could not claim that powers did not exist to allow them to respond. In
relation to the case study blocks, it would be unwise on the basis of current
knowledge for the Great Lakes Council to approve developments on the Pindimar
parcel that might be vulnerable to sea level rise and other climate change
consequences.
5.3 The Doctrine of Erosion and Accretion – Will it Suffice?
The selected lots illustrate the potentiality of sea level rises to affect coastal lands in
different ways. The Brightwaters parcel, while affected, should remain viable in its
current form with possible adaptations, such as building set backs and elevated floor
levels. The issue of public access to waterfront land may be an issue on land similar
in topography and elevation to this land parcel. Land such as this parcel, subject to
40

‘gradual and imperceptible’ change over time, could be dealt with under the current
Doctrine of Erosion and Accretion, particularly if planning authorities make adaptive
changes to regulations over time. Essentially the level of land loss will not
fundamentally hinder the landholders capacity to make use of the land parcel. This is
illustrated in the percentage loss of land for this parcel shown in Table 6.
The application of the Doctrine of Erosion and Accretion, if applied in its current
form to the Pindimar land parcel, would result in a virtual total loss to the landholder.
Applying the 2050 and 2100 sea levels changes nationally, there may be tens of
thousands of land parcels and/or properties at risk of substantial or total inundation. It
is vital that planning authorities initially at least, identify at risk areas, to warn
planning authorities of the potential over the next century. Granting of development
applications (without forewarning at least) in light of this information would place
those authorities in breach of their duty of care. A national approach to this issue
would potentially alleviate many legal and social problems in the future. However it
does not offer protection to the owners of land parcels and property prior to the
current time. The interpretation of the Doctrine of Erosion and Accretion in relation
to these land parcels and properties, that is, the notion of man-made change, may be
the only means of challenge for landholders. It raises the question as to whether the
government (via the taxpayer) should foot the bill for loss of land and property,
should the sea level changes unfold as currently predicted.
5.4 Project Contribution to Sustainability The implications of this study should heighten awareness of the potential impact of
global warming and consequent sea level change. Although it was clearly stated that
the project would not try to determine the causes of global warming, other than to
summarise general scientific opinion, the results of the study highlight the
consequences of sea level change, albeit on the scale of the case study. The broader
implications for sustainability in terms of the capacity of the human race to not only
manage the change, but to positively reverse the trend can be drawn from a broader
understanding of climate change and the role of human activity as the cause. The
following matrix is based on the appendix in the Research Project Study Guide (2009)
41

and addresses the relevant sustainability issues. It is derived from a document put out
by the Institution of Engineers, Australia, entitled Towards Sustainable Engineering
Practice: Engineering Frameworks for Sustainability, Canberra, Australia (1997).
The matrix is included as Appendix R and shows how the project takes account of the
sustainability criteria for engineering work. It is important in a project of this nature,
which is largely focused on environmental issues and how our society might respond,
to include this appraisal.
42

Chapter 6
Conclusion & Recommendations By its nature, science is evidence based. This implies that knowledge changes as new
evidence comes to light. The current evidence suggests that man-made climate
change will have a significant impact on global climate including a rise in sea level.
While there is a range of predictions from experts in the field of climate science,
ultimately a reasonable position has to be taken that reflects a consensus of expert
opinion. The IPCC/CSIRO position used in this study is generally accepted as this
benchmark. A flexible and adaptive approach, as suggested by the NSWDECC, will
be required in the years ahead as new information comes to light. However it is
reasonable to suggest that the upper level predictions in the IPCC models are tending
to be a more accurate reflection of reality.
This scenario leaves government and planners little option other than to move ahead
with policies that account for adaptations to changing climate and sea level. From the
findings of this study come the following recommendations:
• Australia wide adoption of the upper IPCC predictions for sea level change as
a basis for federal, state and local government policy and planning.
• Extensive coastal vulnerability modelling based on projected sea level rise
using the IPCC projections and the CSIRO regional adjustments.
• A national policy framework for local government to ensure that duty of care
is clearly established. This should include a national, evidence based position
on sea level rise to promote a coordinated approach to planning and
development.
• A review of the Doctrine of Erosion and Accretion and its application to the
circumstances of man made climate change, to ensure that public access to
foreshores is maintained and whether current at risk landholders will receive
just treatment.
• A review of vulnerable coastal regions and a national response to the
anticipated change in sea level and associated destructive forces.
In the words of UK Science Advisor, Sir David King:
“The maps of the world will have to be redrawn.”
43

References
Butt, P. 1996, Land Law, 3rd Edition, LBC Information Services, North Ryde, Australia. Church, J.A. & White, N.J. 2006, A 20th Century acceleration in global sea-level rise, Research Letters, Vol 33. Commonwealth Scientific & Industrial Research Organisation 2009, Sea Level Projections, Melbourne. Commonwealth Scientific & Industrial Research Organisation Website 2009, Sea level rise: what does the future hold? Department of Transport, Energy & Infrastructure, 2009, Natural Boundaries, Government of South Australia. Gaia, V. 2009, Sea Level Rises in the Maldives, New Scientist, May Edition p37 –39. Garnaut Climate Change Review, 2008, Garnaut Review Site Website, www.garnautreview.org.au Gore, A. 2006, An Inconvenient Truth, Bloomsbury Publishing, London. Hansen, J. 2007, Huge sea level rises are coming unless we act now, New Scientist, 25th July, 2614, p. 30 – 34. Hughes, L. (Ed), 2007, Hallmans Legal Aspects of Boundary Surveying as Applied inNew South Wales, Institution Of Surveyors, NSW. Intergovernmental Panel on Climate Change, 2001, Climate Change 2001: the scientific basis, summary for policymakers, www.environment.nsw.gov.au Intergovernmental Panel on Climate Change, 2007, Climate change 2007, Synthesis report, summary for policymaker, www.environment.nsw.gov.au Lake Macquarie Council, 2008, Sea Level Rise Preparedness Adaptation. Lipman, Z. Stokes, R. 2003, Shifting Sands: Coastal processes and climate change. Implications for Owners and Regulators of Land, Lawbook Company. New South Wales Consolidated Acts, Local Government Act, 1993. New South Wales Coastal Policy, 1997, NSW Department of Planning. New South Wales Government, Draft Sea Level Rise Policy Statement, NSW Department of Planning. Plimer, I. 2009, Heaven & Earth, Connor Court, North America.
44
Rahmstorf, S, Cazenave, A, Church, J, Hansen, J, Keeling, R, Parker, D, & Somerville, R, 2007, Recent Climate Observations Compared to Projections, Science, Vol 316, p 709. New South Wales Department of Environment and Climate Change, 2009, The Scientific basis of the 2009 sea level rise benchmark – draft technical note. Walker, G. & King, D. The Hot Topic, Bloomsbury Publishing, London. Watson, P. & Harcombe, P. 2004, Sea Level Rise – Challenges for Coastal Managers, NSW Coastal Conference Paper.
45

Appendix A
46

Appendix B
47

Appendix C
48

Appendix D
49

Appendix E
50

Appendix F
51

Appendix G
52

Appendix H
53

Appendix H
54

Appendix I
55

Appendix I
56

Appendix J
57

Appendix K
58

Appendix L
59

Appendix M
60

Appendix N
61

Appendix O
62

Appendix P
63

Appendix Q
64

Appendix R
Statement of Issue Potential Effect from Project
Sustainability 1
Development today should not undermine
the development and environmental
needs of future generations.
Build awareness of planning issues into
the future for land abutting coastal areas.
Identifying at risk areas for level change.
Sustainability 2
Environmental protection shall constitute
an integral part of the development
process.
Draw attention to the need for a re-
evaluation of land-use in proximity to at
risk areas.
Highlight the need for keeping abreast of
sound scientific analysis of current and
future changes in climate.
Sustainability 3
Surveying people should take into
consideration global environmental
impacts of local actions and policies.
Ensure that sound planning information is
available with best scientific analysis of
future trends used to make local
decisions.
Sustainability 4
Scientific uncertainty should not be used
to postpone measures to prevent
environmental degradation.
Policy decisions between local
government, states and territories
coordinated to ensure self-interest for
short-term gains does not outweigh best
scientific opinion.
Clearly establish areas of scientific
uncertainty in this issue, ie, extent of sea
level rise as opposed to factual
information that sea levels are rising.
Consider scientific evidence and take
cautious approach.
65

Sustainability 5
Environmental issues should be handled
with the participation of all concerned
citizens.
The issue is one of concern to all citizens
and the effects will be directly felt by
some, and indirectly by others.
Government bodies to take account of
local concerns (such as rising sea levels)
through to broader implications of
climatic change.
Sustainability 6
The community has the right of access to
and an understanding of environmental
information.
Provision of easy access to climate
change information by impartial bodies
such as CSIRO.
Monitor the reporting of climate change
information by non-expert people (often
with vested interest or political
motivation) and provide up to date
materials from reputable institutions for
public consideration.
Sustainability 7
The eradication of poverty, the reduction
of differences in living standards and the
full participation of women, youth and
indigenous people are essential to achieve
sustainability.
With such a large percentage of the
world’s population living in close
proximity to high water mark (many of
whom are from poorer countries) a
coordinated world effort will be required
to re-locate potentially millions of people.
Sustainability 8
People in developed countries bear a
special responsibility to assist in the
achievement of sustainability.
See above.
66

Sustainability 9
Warfare is inherently destructive of
sustainability, and, in contrast, peace,
development and environmental
protection are interdependent and
indivisible.
One of the most alarming aspects of
climate change in a world with a rapidly
increasing population is the possibility of
warfare as a result of diminishing
resources. International organizations
will have to play a key role in
coordinating efforts to alleviate the
consequences of climate change.
67