Embed Size (px)
Citation preview

1
Potential Health Impacts from the COVID-19 Pandemic for
New Zealand if Eradication Fails:
Report to the NZ Ministry of Health
Prepared for the Ministry of Health
by
Prof Nick Wilson, Dr Lucy Telfar Barnard, Dr Amanda Kvalsvig, Prof Michael
Baker
COVID-19 Research Group
Health, Environment & Infection Research Unit (HEIRU)
Burden of Disease Epidemiology, Equity and Cost-Effectiveness Programme
(BODE³)
University of Otago Wellington
23 March 2020
NOTE Although this report was correct at the time of writing, the information it presents may no
longer be current because of continuing evolution of the COVID-19 pandemic and our
understanding of it.
Unless otherwise indicated, peer review and full consultation with relevant agencies was not
always possible in the timeframe available for producing this report.
https://www.otago.ac.nz/wellington/departments/publichealth/research/heiru/index.html
https://www.otago.ac.nz/wellington/departments/publichealth/research/bode3/index.html

2
Potential Health Impacts from the COVID-19 Pandemic for New
Zealand if Eradication Fails: Report to the NZ Ministry of Health
23 March 2020
Prof Nick Wilson1 2, Dr Lucy Telfar Barnard2, Dr Amanda Kvalsvig2, Prof Michael Baker2 (Contact:
Prof Michael Baker, HEIRU, University of Otago Wellington; contact: [email protected])
1 BODE3 Programme, University of Otago Wellington, New Zealand 2 HEIRU, University of Otago Wellington, New Zealand
Abstract
Aims: While New Zealand may hopefully succeed with its current eradication strategy for COVID-
19, this modelling aimed to considered the health outcomes if this strategy fails.
Methods: A SEIR model designed for COVID-19 (CovidSIM) was adapted and utilised. It was
populated with NZ demographic data and relevant parameters sourced from the international
literature. Different scenarios varied the basic reproduction number (R0) and levels of disease
control, and involved threshold analyses for controls to push the epidemic peak into the next year (ie,
a point where a vaccine might become available).
Results: We found that it would be relatively easy to push some epidemic curves into the subsequent
year (ie, for R0 = 1.5). This would be harder for the more plausible R0 = 2.5 scenarios, but still
potentially feasible eg, via over 41% of “general contact reduction” for nine months, combined with
over 50% of cases having hospital isolation for nine months.
When considering the two highest levels of R0 (2.5 and 3.5), and the two levels of “general contact
reduction” (at 25% for six months and 50% for nine months), the estimated health impacts were:
44% to 64% of the population sick; 18% to 26% seeking a medical consultation (including
Healthline and internet consultations); 22,200 to 32,000 people needing to be hospitalised; 5,540 to
8,000 people needing critical care (in an intensive care unit [ICU]); 2,770 to 4000 requiring
ventilators; and 8560 to 14,400 dying (0.17% to 0.29% of the population). On the worst day for the
worst scenario (R0 = 3.5, 25% contact reduction), there would be 11,200 people needing to be
hospitalised and 2,800 needing to be admitted to critical care. For this scenario ICU capacity would
be full on day 92, at a very early point in the epidemic curve. Such demands are unprecedented in
New Zealand’s history and unless there was a major reconfiguration of services, would be
overwhelming, with a risk of this pushing up the case fatality rate. The mortality burden would
almost certainly be much higher in older age-groups (eg, 89% of the deaths estimated to be in the
60+ age-group), and also would probably be patterned by ethnicity (higher for Māori and Pacific
peoples), and for people living in deprived areas.
Conclusions: If New Zealand fails with its current eradication strategy toward COVID-19, then
health outcomes for New Zealand could be very severe. If interventions were intense enough
however, in some scenarios the epidemic peak could still be suppressed or pushed out to the
following year (at which time a vaccine may be available). Due to the high levels of uncertainty with
some of the parameters used in this modelling work, it should be regularly repeated as new
information on the epidemiological characteristics of COVID-19 become available.
3
Introduction
There is pandemic spread of the new coronavirus “SARS-Cov-2”, causing the disease “COVID-19”,
with the World Health Organization (WHO) reporting over 200,000 cases and over 8000 deaths on
19 March 2020 [1]. One approach to informing the potential health burden and relevant control
measures for a new pandemic is to study its dynamics using mathematical models. Recently
published mathematical modelling work on COVID-19 has reported that “in most scenarios, highly
effective contact tracing and case isolation is enough to control a new outbreak of COVID-19 within
3 months” [2]. Another modelling study found that “combining all four interventions (social
distancing of the entire population, case isolation, household quarantine and school and university
closure) is predicted to have the largest impact, short of a complete lockdown which additionally
prevents people going to work” [3]. Other such models have been used to estimate the impact of
disease control measures in China [4, 5].
Given this background, we explore the potential health impact of the spread of the COVID-19
pandemic in the New Zealand, particularly if the Government’s current strategy of eradication of
COVID-19 fails.
Methods
In this modelling, we took the standard approach of using a deterministic SEIR model ie, key
compartments for: susceptible [S], exposed [E], infected [I], and recovered/removed [R]. This model
was developed specifically for COVID-19 by our German collaborators (see Acknowledgements),
with various adaptations suggested by the New Zealand authors. This model is freely available
online with a dashboard display to facilitate user interaction (http://covidsim.eu; version 1.0, 19
March). For additional quality tests we subjected the CovidSIM model to extreme value testing and
conducted a head-to-head comparison with a completely independently developed SEIR model
produced by Australian colleagues (McVernon et al, University of Melbourne). The comparison
results (when accounting for minor differences in model structure) were very similar and gave us
additional confidence in the quality of the CovidSIM model.
The Appendix details the parameters, derived variables and differential equations used in the
CovidSIM model. Table A1 in the Appendix also provides the input parameters used in the
modelling, as based on available publications and best estimates used in the modelling work on
COVID-19 to date (as known to us on 21 March 2020).
Results
It is to be hoped that New Zealand can succeed with its current eradication strategy. But this
modelling consider the potential outcomes if this strategy fails.
Baseline and threshold analyses: To provide a baseline, Figure 1 shows the epidemic curves for
three values of the reproduction number (R0) – all with the unrealistic scenario of no changes in
normal behaviour in response to the pandemic. In an attempt to push the peaks of these epidemic
curves into the subsequent year (when a vaccine might become available), we adjusted various
interventions (Table 1). The results suggest that pushing the peak of the epidemic into the next year,
when assuming a low basic reproduction number (R0) of only 1.5, was achievable with “general
contact reduction” at levels of over 16% to over 21% (for nine and six month time periods

4
respectively) (Table 1). Similarly, it was achievable for probabilities of isolating symptomatic cases
in hospital in the range of over 30% to over 35% (Table 1). Using a possibly more realistic value of
2.5 for R0, the most achievable way of shifting the epidemic peak into the next year was if both
contact reduction and case isolation were used (at levels of over 41% and over 50% respectively for
nine months). The equivalent values for when R0 = 3.5, was over 64% and over 50% for nine
months.
Figure 2 shows the impact of “25% general contact reduction” for a six-month intervention period.
The epidemic curves for the R0 = 3.5 and R0 = 2.5 epidemic scenarios still occurred in the
intervention period, albeit partly suppressed compared to the baseline in Figure 1. But the R0 = 1.5
epidemic scenario was very largely suppressed with no peak.
Figure 3 shows the impact of “50% general contact reduction” for a nine-month period. The
epidemic curve for the R0 = 3.5 epidemic scenario still occurred in the intervention period, albeit
partly suppressed compared to the baseline in Figure 1. But the R0 = 2.5 epidemic scenario was
suppressed until the intervention period ended and then the epidemic accelerated again, peaking at
the end of the year. Similar to the results in Figure 2, the R0 = 1.5 epidemic was almost extinguished.
Health impacts: When considering the two highest levels of R0, and the two levels of “general
contact reduction” (at 25% for six months and 50% for nine months), the estimated ranges for health
impacts were: 44% to 64% of the population sick; 18% to 26% seeking a medical consultation
(including Healthline and internet consultations); 22,200 to 32,000 people needing to be hospitalised;
5,540 to 8,000 people needing critical care (in an ICU); 2,770 to 4000 requiring ventilators; and 8560
to 14,400 dying (0.17% to 0.29% of the population) (Table 2).
In terms of timing, on the worst day for the worst scenario studied (R0 = 3.5, 25% contact reduction),
there would be 11,200 people needing to be hospitalised and 2,800 needing to be admitted to critical
care. In this particular scenario, New Zealand’s 221 ICU beds would be filled up with COVID-19
patients on day 92, at a very early point of the epidemic curve (Table 2, Figure 2). If ICU capacity
was doubled, then all these additional beds would be filled up with COVID-19 patients just six days
later (day 98).
Age distribution of health impacts: Based on the age distribution data from China [6], the
hospitalisations and deaths from COVID-19 are known to particularly effect older age-groups. But
using New Zealand population distribution data and age-specific case fatality estimates for a more
similar country (UK, [3]), we generated the results shown in Figure 4. This suggested that 88.9% of
the deaths would occur in the 60+ age group. Indeed, nearly a third (32.9) occurred in the 80+ age
group.
Ethnic and socio-economic distribution of health impacts: There is no robust basis for estimating
impacts by ethnic group in New Zealand from international COVID-19 data. But we note that in the
2009 Influenza A(H1N1) pandemic in New Zealand, the risk of hospitalisation was five times higher
for Māori and seven times higher for Pacific peoples than for New Zealand European/Other [7].
Similarly, the risk of death was 2.6 times higher for Māori (95%CI: 1.3 – 5.3) than for NZ
European/Other [8]. Indeed, there is evidence for relatively higher Māori mortality in both the 1957
and 1918 influenza pandemics as well [8].
Furthermore, there was also some evidence of a socioeconomic gradient in the 2009 influenza
pandemic with 39% of those dying having an area deprivation score of either 9 or 10 (the most

5
deprived two deciles), compared with the expected 20% of the population. Of those dying, 86% had
at least one comorbid or associated condition [8].
Seasonality impacts: Figure 5 shows that increased seasonal variation in the R0 value resulted in
winter acceleration of the epidemic and a higher peak to the epidemic curve. However, as discussed
in the parameter table (Table A1) there is substantial uncertainty about the role of seasonality in the
epidemiology of COVID-19.
Table 1: Threshold analyses for pushing the peak of the spread of the COVID-19 pandemic in New Zealand into the next year if the current eradication strategy fails (ie, pushing the peak to after day 365 of the simulation with the start of the simulation on 1 April 2020, the date we assumed that uncontrolled spread began; see Table A1 for input parameters)
Intervention settings Assumed basic reproduction number (with R0=2.5
being the most plausible value; Table A1)
R0=1.5 R0=2.5 R0=3.5
Intensity and length of “general contact reduction” starting on day 1 of the simulation
Level of general contact reduction for 6 months needed to push the epidemic into the next year
>21% Not possible Not possible
– for 9 month intervention period (274 days) >16% >53% >71%
Proportion of symptomatic cases in hospital isolation (with home isolation at 50% effectiveness when hospital capacity is exceeded; beginning on day 1 of the simulation)
Probability of case isolation in hospital needed to push the epidemic into the next year (for a 6 month intervention period)
>35% Not possible Not possible
– for 9 month intervention period (274 days) >30% >91% Not possible
Intensity and length of “general contact reduction” in the context of 50% of symptomatic cases being identified and having hospital isolation for a six month period (with home isolation at 50% effectiveness when hospital capacity is exceeded)
Level of general contact reduction for 6 months needed to push the epidemic into the next year
≥0% Not possible Not possible
– for 9 month intervention period (274 days) ≥0% >41% >64%

6
Table 2: Potential health impacts of the spread of the COVID-19 pandemic in New Zealand if the current eradication strategy fails (for a range of basic reproduction number (R0) values and differing intensity of “general contact reduction” as the control measure; see Table A1 for input parameters)
Key results R0=1.5
R0=2.5 (the most plausible value)
R0=3.5
25% control for 6 months*
50% control for 9 months*
25% control for 6
months
50% control for 9 months*
25% control for 6 months
50% control for 9 months
General pattern seen for symptomatic cases
Highly suppressed, peak in next
year
Highly suppressed, peak in next
year
Peak in intervention
period
Peak after intervention
period (truncated)
Peak in intervention
period
Peak in intervention
period
Symptomatic cases (which are 67% of all infected cases)
Total 617,000 1,770 2,830,000 2,220,000 3,200,000 2,620,000
Proportion of population (%)** 12.3% 0.04% 56.6% 44.3% 64.0% 52.4%
Peak week for incidence Next year Next year 23 50 17 24
Peak month for incidence Next year Next year 5 12 4 6
Number of sick people on the worst day of the simulated year
57,800 110 660,000 375,000 1,120,000 550,000
Proportion of population sick on the worst day (%)**
1.2% 0.0% 13.2% 7.5% 22.4% 11.0%
Consultations (40% of symptomatic cases seek consultations, possibly mainly telephone/internet)
Total 247,000 706 1,132,000 887,000 1,280,000 1,050,000
Proportion of population (%)** 4.9% 0.0% 22.6% 17.7% 25.6% 21.0%
Severe cases likely to require hospitalisation (1.0% of symptomatic cases)
Total 6,170 18 28,300 22,200 32,000 26,200
Proportion of population (%)** 0.12% 0.00% 0.57% 0.44% 0.64% 0.52%
Number of people in hospital on the worst day (if capacity existed)
578 223 6,600 3,750 11,200 5,500
Proportion of population in hospital on the worst day (%)**
0.01% <0.01% 0.13% 0.07% 0.22% 0.11%
Cases likely to require ICU (25% of hospitalised cases)
Total 1,540 4 7,070 5,540 8,000 6,550
People in ICU on the peak day (if capacities exist)
145 2 1,650 937 2,800 1,380
Day when the current 221 ICU beds are all full
Not reached Not reached 123 305 92 132
As above, but assuming bed capacity is doubled to 442
Not reached Not reached 131 321 98 142
Cases likely to require ventilation in ICU (50% of those in ICU)
Total** 771 2 3,540 2,770 4,000 3,280
Deaths (case fatality risk amongst symptomatic cases of 0.45%)
Total 2,520 7 12,700 8,560 14,400 11,800
Proportion of population (%)** 0.05% <0.01% 0.25% 0.17% 0.29% 0.24%
* Results are shaded as they were right truncated (ie, only the results for the first 365 days of the simulation are reported) as the epidemic peak was pushed into the following year. ** Results in these rows were not standard outputs for the CovidSIM model but were based on further Excel-based calculations from the CovidSIM output. All numbers are rounded to three meaningful digits.
7
Figure 1: Epidemic curves for the uncontrolled spread of the COVID-19 pandemic in New Zealand for three different reproduction numbers (R0) and with no changes in human behaviour or interventions assumed (ie, which is unrealistic but is shown here to demonstrate uncontrolled epidemic patterns)
Figure 2: Epidemic curves for the spread of the COVID-19 pandemic in New Zealand for three different reproduction numbers and at 25% “general contact reduction” intervention for six months (albeit the epidemic curve for R0 = 1.5 is largely suppressed)
-
200,000
400,000
600,000
800,000
1,000,000
1,200,000
1,400,000
1,600,000 - 1
0
20
30
40
50
60
70
80
90
10
0
11
0 1
20
13
0 1
40
15
0 1
60
17
0 1
80
19
0 2
00
21
0
22
0
23
0 2
40
25
0
26
0 2
70
28
0 2
90
30
0 3
10
32
0 3
30
34
0 3
50
36
0
Nu
mb
er o
f sy
mp
tom
atic
cas
es
R0=3.5 R0=2.5 R0=1.5
Mid-winter in NZ on day 106
-
200,000
400,000
600,000
800,000
1,000,000
1,200,000
- 10
20
30
40
50
60
70
80
90
10
0
11
0 1
20
13
0
14
0
15
0
16
0 1
70
18
0
19
0 2
00
21
0 2
20
23
0
24
0
25
0
26
0
27
0
28
0
29
0 3
00
31
0
32
0
33
0
34
0 3
50
36
0
Nu
mb
er o
f sy
mp
tom
atic
cas
es
R0=3.5 R0=2.5 R0=1.5
Assumed end of contact reduction on
day 183
Uncontrolled spread assumed to begin on 1 April 2020
Mid-winter in NZ on day 106
ICU beds full day 92 (R0=3.5 scenario)

8
Figure 3: Epidemic curves for the spread of the COVID-19 pandemic in New Zealand for three different reproduction numbers and with the 50% “general contact reduction” intervention for nine months (albeit the epidemic curve for R0 = 1.5 is nearly completely suppressed)
Figure 4: Distribution of deaths by age-group for the R0 = 2.5 epidemic scenario (with 25% “general contact reduction” for six months; using NZ population age structure from the 2018 Census and age-specific case-fatality rates as per Imperial College modelling [3]
-
100,000
200,000
300,000
400,000
500,000
600,000
- 10
20
30
40
50
60
70
80
90
10
0
11
0
12
0
13
0
14
0
15
0
16
0
17
0
18
0
19
0
20
0
21
0
22
0
23
0
24
0
25
0
26
0
27
0
28
0
29
0
30
0
31
0
32
0
33
0
34
0
35
0
36
0
Nu
mb
er o
f sy
mp
tom
atic
cas
es
R0=3.5 R0=2.5 R0=1.5
Uncontrolled spread assumed to begin on 1 April 2020
Mid-winter in NZ on day 106
Assumed end of contact reduction on
day 274
ICU beds full day 123 (R0=3.5
scenario)
-
500
1,000
1,500
2,000
2,500
3,000
3,500
4,000
4,500
0 to 9 10 to 19 20 to 29 30 to 39 40 to 49 50 to 59 60 to 69 70 to 79 80+
Nu
mb
er o
f d
eath
s
Age-groups

9
Figure 5: Impact of seasonality via sinusoidal variation throughout the year of the R0 value for the R0 = 2.5 epidemic scenario (with 25% “general contact reduction” continuously throughout the simulated year)
Discussion
Main findings and interpretation
It is obvious that achieving eradication of COVID-19 in New Zealand would be the optimal outcome
from a health sector perspective. But if this fails then in some scenarios it is still possible to nearly
completely suppress the epidemic (as per the R0 = 1.5 scenarios). But such suppression becomes
more difficult for the more plausible R0 = 2.5 epidemic scenarios where even nine months of “50%
general contact reduction” still doesn’t quite push the epidemic peak into the subsequent year. Even
so, the delay from this intervention could still allow for time for improved health system organisation
and treatments to be identified – as so could allow for reductions in the hospitalisation and mortality
burdens.
The most concerning aspect of the results is the mortality burden for the two highest R0 values at
8,560 to 14,400 deaths. Nevertheless, at 0.17% to 0.29% of the population dying, this is still not as
severe as the 0.8% seen for the 1918 influenza pandemic in New Zealand (ie, 9,000 deaths [9] out of
1.149 million people at that time). Another unfortunate comparison with the 1918 pandemic is the
potential increased risk of death for Māori and Pacific populations (albeit based on the H1N1
influenza pandemic experience in 2009 [7, 8]).
When focusing on the R0 = 2.5 scenario with 25% control for six months, the modelling indicates
very major impacts on health services. These levels of demand would be completely unprecedented
for New Zealand, which has a secondary care sector with very little surge capacity. The filling up of
all ICU beds in the country at a very early stage of the epidemic curve (Figures 2 and 3), would mean
that the case fatality risk would probably increase (with some signs of this occurring in Italy in
March 2020 from the pandemic there).
Study strengths and limitations
This is one of the first SEIR modelling studies of this new pandemic agent COVID-19 and the
associated online model has advanced dashboard features and graphic visualisation of results that
-
200,000
400,000
600,000
800,000
1,000,000
1,200,000
1,400,000 - 1
1
22
33
44
55
66
77
88
99
11
0
12
1
13
2
14
3
15
4
16
5
17
6
18
7
19
8
20
9
22
0
23
1
24
2
25
3
26
4
27
5
28
6
29
7
30
8
31
9
33
0
34
1
35
2
36
3
Nu
mb
er o
f sy
mp
tom
atic
cas
es
50% variation 25% variation 0% variation
Mid-winter in NZ on day 106

10
facilitate user engagement. Nevertheless, the following are the major limitations of this work, with
more minor ones alluded to in the table on the input parameters (Table A1).
There is still a high degree of uncertainty around many aspects of COVID-19 epidemiology.
For example, the R0 could conceivably be higher than the highest level in the scenarios we
modelled (at 3.5, Table 2). Similarly, the CFR could be overestimated (due to missing mild
cases in the denominator) or underestimated (if hospitals and ICUs become overloaded and if
there are shortages of ventilators during an epidemic peak). Pre-symptomatic spread might
also be more important than we have assumed.
The model was not stochastic, though we largely offset this issue with modelling a wide
range of scenarios. The lack of stochastic elements mainly translates into increased
uncertainty in the very early stages of epidemic spread, which then impacts on the timing of
the peak. But as soon as there are some hundreds of infections in the population, the time
course becomes highly predictable (ie, “deterministic”), particularly for the period from “1%
of the population have been infected” to the peak.
The model neither considers any long-term health damage to survivors (especially among risk
patients) nor does it consider the hard-to-estimate health loss arising from untreated other
health conditions as a result of having an overburdened health system. Likewise we do not
consider the additional health harm to the health workers involved (eg, adverse mental health
impacts arising from working during a pandemic [10, 11]).
Potential research and policy implications
Clearly, given the uncertainty with many of the input parameters, there will be an on-going need to
further revise this type of modelling work. In particular, a more accurate estimate of the R0 is critical,
but even so, this will vary by setting (and New Zealand might be expected to have a relatively low
value given that it has comparatively low population density and low use of mass transit compared to
many other countries). The uncertainty around this key input parameter further highlights the
importance of intensive case identification and contact tracing in the New Zealand population, not
only as a control measure per se, but also to generate a rapid understanding of local transmission
dynamics to ensure that potentially costly population control measures are appropriate and
proportionate. Firmer data are also needed on the CFR and the hospitalisation rate from the
international literature (ie, the rate when excluding where mild cases are hospitalised just to isolate
them and also the rates when a health system becomes overloaded).
Another critical research need is around the feasibility of achieving high levels of contact reduction
and case isolation and how long these can be sustained for. At least in the short-term, China has used
intensive containment measures successfully as per the findings of the WHO-China Joint Mission
Report [12]. This report stated that: “China has rolled out perhaps the most ambitious, agile, and
aggressive disease containment effort in history.” Since this report was published it appears that
China may have succeeded with eradication (ie, in late March it was only reporting imported cases).
While it is an open question around the generalisability of the Chinese approach to other jurisdictions
[13], there is also evidence of containment success (as of late March 2020) outside mainland China,
from Singapore, Hong Kong and Taiwan [14].
But if the current eradication strategy fails in New Zealand, it is important to also consider how to
reduce the load on the health system – which if overloaded may fail to prevent severe outcomes such
as death. Potential options are:
Continue with major investment in prevention and intense containment to slow disease spread
(eg, identification and isolation/quarantine of cases and contacts; promoting hygiene
measures and physical distancing measures). If strong enough, these measures may still allow

11
for epidemic peak suppression and displacement into the future until a vaccine becomes
available.
Consideration around investing in website-based educational information for home care for
mild/moderately severe cases and capacity for online consultations with health workers (to
reduce the demand on the Healthline, other primary care services and hospital services).
Consideration of specific programmes to protect highly vulnerable groups from infection.
The data from China shows older age-groups and those with co-morbidities are at relatively
much greater risk of death than younger and healthier groups [6]. Previous New Zealand
research on influenza has identified markedly higher rates of hospitalisation for those living
with long-term conditions [15]. Also if COVID-19 follows the same patterns as previous
pandemics, we would expect a relatively high and heavily unequal hospitalisation and
mortality burden on Māori and Pacific populations. Such a protection programme could aim
to ensure vulnerable people have the option of moving to or living in “safe havens” for the
duration of the pandemic, or for periods when it is at its most intense. Options could include a
range of scales from: specific measures for those living in their own homes and well managed
institutions to voluntary relocation to specific places that can be protected.
Continue with investment in planning by hospitals and ICUs (eg, updating triage processes
and planning around when to suspend elective surgery and annual leave for public sector
health workers etc). For example 40% of admissions to the ICU in Wellington are following
elective major surgery [16]. One ICU expert has suggested that ICU bed capacity could
potentially be doubled in New Zealand [17]. Fortunately, as of late March 2020, there was
already much District Health Board attention being paid to addressing these issues.
Many of these interventions require substantial resources and indeed these are being mobilised by the
New Zealand Government with substantial additional health sector funding announced in March
2020. But it will be up to political leaders to continue to balance the potential health benefits of
various pandemic control interventions with their downsides. These include the psychological, social
and economic costs that may arise from any closing of schools, closing of venues, restricting mass
transit and restricting internal travel.
Acknowledgements: We thank the New Zealand Ministry of Health for funding support and for
providing feedback on an earlier manuscript draft which used more provisional parameters:
particularly the Chief Science Advisor Dr Ian Town; and Dr Richard Jaine. Nevertheless, we note
that this work is that of the named authors alone and does not necessarily represent the views of the
New Zealand Ministry of Health or any other parties. We thank our German colleagues for their
developmental work on the CovidSIM model and their rapid responses around improvements to it:
Prof Martin Eichner (University of Tübingen, Germany, and Epimos GmbH), Stefan Brockmann
(Landesgesundheitsamt Baden-Württemberg, Stuttgart, Germany), and Dr Markus Schwehm
(ExploSYS GmbH, Germany). We also thank our Australian colleagues (Prof Jodie McVernon et al
of the University of Melbourne) for providing modelled results from their SEIR model (as used in
the head-to-head model comparison). Prof Wilson is supported by the Health Research Council and
Ministry of Business Innovation and Employment (MBIE) funding of the BODE3 Programme.
12
Appendix 1: Parameters, derived variables and differential equations used in the
CovidSIM model
Model Description of CovidSIM Model dynamics
21
21
21
0
max
1
max
max
11
IsoIso
n
k
kSickIsoIso
n
k
kSickIsoIso
n
k
kSick
Iso
tttt
QtIptttQ
QtIpttttIp
tItI
II
orif
andif
andif
time at cases isolated of Number
I
I
P
E
IP
IP
nDeathSick
nDeathSick
Ikkk
n
Pkkk
n
Ekkk
Cont
n
k
HomeHomeIsokI
n
k
kP
Cont
n
k
HomeHomeIsokI
n
k
kP
Ippdt
dD
Ippdt
dR
nkIIdt
dI
IPdt
dI
nkPPdt
dP
PEdt
dP
nkEEdt
dE
EtcctItItIttPtN
S
dt
dE
tcctItItIttPtN
S
dt
dS
sindividual dead of Number
sindividual removed of Number
periodc symptomati the in sindividual of Number
period prodromal the in sindividual of Number
period latent the in sindividual of Number
sindividual esusceptibl of Number
1
1
1
1
1
1
1
11
1
11
1
1
11
1
11
otherwise
andif
time at cases isolated home of Number
orif
andif
andif
time at cases isolatedfully of Number
0
:
0
:
max
1
max
1
max
1
max
max
11
21
21
21
21
QtIptttQtIptI
t
tttt
QtIptttQ
QtIpttttIp
tI
t
II
I
II
n
k
kSickIsoIso
n
k
kSickHome
IsoIso
n
k
kSickIsoIso
n
k
kSickIsoIso
n
k
kSick
Iso

13
Initial values
00
00
100
100
100
0
0
1
D
R
nkI
nkP
nkE
XE
XNS
Ik
Pk
Ek
sindividual dead of Number
sindividual immune of Number
periodc symptomati the in sindividual of Number
period prodromal the in sindividual of Number
period latent the in sindividual of Number
sindividual esusceptibl of Number

14
Parameters
disease the from die whosindividual sick of Fraction
ICU the to admitted are whosindividual edhospitaliz of Fraction
edhospitaliz are whosindividual sick of Fraction
help medical seek whosindividual sick of Fraction
sick become whosindividual infected of Fraction
time at period prodromal the in sindividual of rate contact Effective
time at periodc symptomati the in sindividual of rate contact Effective
periodc symptomati the in rate transition Stage
periodc symptomati the for stages of Number
periodc symptomati the of duration Average
period prodromal during nessinfectious Relative
period prodromal the in rate transition Stage
period prodromal the for stages of Number
period prodoromal the of duration Average
period latent the in rate transition Stage
period latent the for stages of Number
period latent the of duration Average
of nfluctuatio seasonal the of Amplitude
number onreproductibasic the of value Average
)travellers via (e.g. population the of outside from originates whichinfection of Force
time at reduced are whichcontacts of Fraction
ends reduction contact whichat Time
starts reduction contact whichat Time
prevented are whichcontacts of Fraction
isolation home in are whocases for prevented are whichcontacts of Fraction
end measures isolation whichat Time
start measures isolation whichat Time
capacity isolation Maximum
highest is potiential ontransmissi the wheninfection the of onintroducti afterDay
infections initial of Number
size Population
Death
ICU
Hosp
Consult
Sick
PIPP
IPPI
I
II
I
I
P
PP
P
P
EE
E
E
Cont
Cont
Cont
Home
Iso
Iso
p
p
p
p
p
itttt
taDDiRt
tt
Dn
n
D
i
Dn
n
D
Dn
n
D
Ra
R
ttc
t
t
c
c
t
t
Q
t
X
N
365/cos1/
/
/
/
0
0
0
max
max
2
1
2
1

15
Derived variables
dttIpp],t[t
dttPppp],t[t
dttPpp],t[t
dttPpp],t[t
dttPp],t[t
dttIttPtN
tS],t[t
tIpppt
tIppt
tIpt
tIpt
t
t
nIDeathSick
t
t
nICUHospSick
t
t
nHospSick
t
t
nConsultSick
t
t
nSick
t
t
n
k
kI
n
k
kP
n
k
kICUHospSick
n
k
kHospSick
n
k
kSick
n
k
kSick
P
P
P
P
IP
I
I
I
I
2
1
2
1
2
1
2
1
2
1
2
1
21
21
21
21
21
11
21
1
1
1
1
1
interval in deathsNew
interval in admissions ICUNew
interval in ationshospitalizNew
interval in onsconsultatiNew
interval in sindividual sickNew
interval in infectionsNew
time at ICU in Cases
time at cases edHospitaliz
time at casesic Asymptomat
time at casesc Symptomati

16
Detection probability
SARS-CoV-2 infections which are brought into the country may not be detected and may spread
without being noticed because the symptoms of COVID-19 may easily be confused with other
influenza-like illnesses (ILI). Few practitioners may decide to order a SARS-CoV-2 test for what
they regard a normal ILI patient while no community-transmitted cases in the population have been
reported. If we assume that fraction of pTest ILI patients who (a) seek medical help or who (b) are
hospitalized or who (c) die from the disease are tested for SARS-Cov-2, then the probability that not
one single test has been performed on a COVID-19 patient by time t despite the ongoing
transmission in the population is given by:
The probability that at least one test has been performed (and has returned a positive result) is then
.1 0
t
DeathHospConsultSickPn dppppPTestp
.11 0
t
DeathHospConsultSickPn dppppPTestp

17
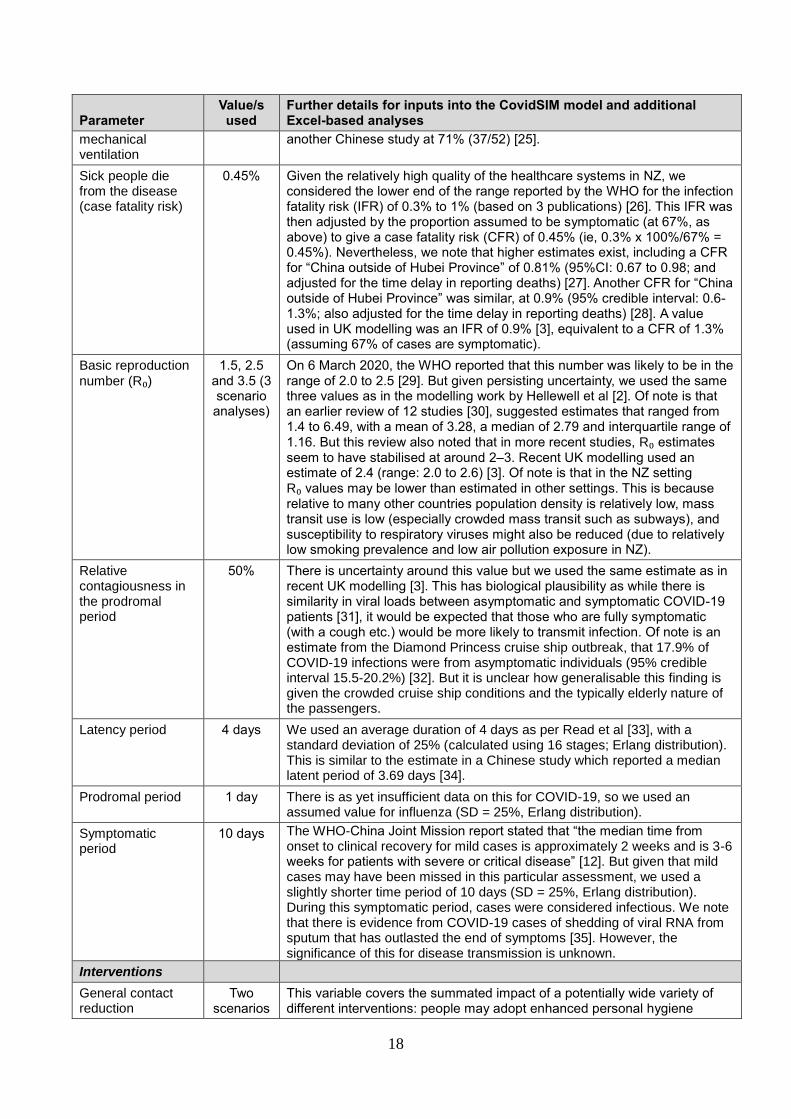
Table A1: Input parameters for modelling the potential health impacts of the COVID-19 pandemic in the New Zealand setting if eradication fails
Parameter Value/s used
Further details for inputs into the CovidSIM model and additional Excel-based analyses
Population size 5 million NZ population as per December 2019 was rounded up from 4,951,500.[18]
Indeed, the 5 million figure is probably more accurate as per March 2020 due to both population growth and the return of New Zealanders from overseas.
Incoming infected people from outside of NZ
1 per day (from 1 April)
To simulate the start of uncontrolled silent spread in the modelling, we assumed that this began on 1 April 2020 as a result of an asymptomatic traveller entering the country. For the remaining course of the one year simulation, we assumed that this level of introduction persisted (given NZ’s commitment to allow its citizen’s to return and the potential for home isolation to fail).
Infections that lead to sickness
67% This figure is still uncertain but we used the same estimate as per modelling by Imperial College at “two thirds of cases being sufficiently symptomatic to self-isolate” [3]. Of note is that another modelling study used a 50% value [19]. Nevertheless, some proportion of asymptomatic cases is consistent with the findings of a very large Chinese study [6], where 81% of cases of COVID-19 did not involve severe illness.
Sick people seek medical help (including telephone and internet consultations)
40% We used the default value in the CovidSIM model, which is based on medical consultations for influenza-like illness (ILI). During a pandemic there might be a shift away from face-to-face consultations with health workers, so that some of these consultations may be either telephone or internet-based. This parameter is not used for determining subsequent outcomes like hospitalisations and deaths. We further assume that cases only seek medical help once.
Sick people need hospitalisation
1% This estimate is highly uncertain. We have multiplied by 5 the percentage which has been observed for seasonal influenza and is the default setting in the CovidSIM model (ie, 0.2%), to account for the apparent increased severity of COVID-19. The high uncertainty for this parameter is due to the likely under-diagnosis of mild cases in many settings (impacting the size of the denominator). It also may vary between countries given the use of hospital facilities to isolate mild cases. Modellers in the United Kingdom (UK) have used 4.4% (of all infected cases) [3], and for modelling in the United States 3%, 5% and 12% have been proposed [20]. However, we consider these to be potential over-estimates in the NZ setting where homecare for mild to moderate pneumonia may be promoted in the community in pandemic circumstances. The length of hospitalisation was assumed to be 10 days which is similar to other modelling work eg, 10.4 days for the UK [3].
Hospitalised cases need intensive care (ICU admission)
25% We used the data from a very large Chinese study for the ratio of “critical” to “severe” cases (ie, 4.7%/(13.8% + 4.7%) = 25.4%) [6]. This is similar to the Chinese case series reported by Wang et al at 26.1% [21]. Nevertheless, it is higher than reported in a smaller case series from Singapore at 11% (2/18) [22]. A UK modelling study used a proportion of 30% “based on early reports from COVID-19 cases in the UK” [3]. Of note is that this value is also higher than the NZ experience for the 2009 influenza pandemic at 9.1% (102/1122) [23].
ICU bed capacity: We used the reported number of ICU ventilated beds in NZ at 221 and an estimate from an ICU expert that these could be doubled (ie, to 442) in “extreme circumstances” [17].
Intensive care cases requiring
50% We use the same value as per a US model of 50% [24] for additional calculations outside of CovidSIM. This proportion is around that reported in a Chinese study of 47% (17/36 ICU admissions) [21], but is less than in
18
Parameter Value/s used
Further details for inputs into the CovidSIM model and additional Excel-based analyses
mechanical ventilation
another Chinese study at 71% (37/52) [25].
Sick people die from the disease (case fatality risk)
0.45% Given the relatively high quality of the healthcare systems in NZ, we considered the lower end of the range reported by the WHO for the infection fatality risk (IFR) of 0.3% to 1% (based on 3 publications) [26]. This IFR was then adjusted by the proportion assumed to be symptomatic (at 67%, as above) to give a case fatality risk (CFR) of 0.45% (ie, 0.3% x 100%/67% = 0.45%). Nevertheless, we note that higher estimates exist, including a CFR for “China outside of Hubei Province” of 0.81% (95%CI: 0.67 to 0.98; and adjusted for the time delay in reporting deaths) [27]. Another CFR for “China outside of Hubei Province” was similar, at 0.9% (95% credible interval: 0.6-1.3%; also adjusted for the time delay in reporting deaths) [28]. A value used in UK modelling was an IFR of 0.9% [3], equivalent to a CFR of 1.3% (assuming 67% of cases are symptomatic).
Basic reproduction
number (R₀) 1.5, 2.5
and 3.5 (3 scenario analyses)
On 6 March 2020, the WHO reported that this number was likely to be in the range of 2.0 to 2.5 [29]. But given persisting uncertainty, we used the same three values as in the modelling work by Hellewell et al [2]. Of note is that an earlier review of 12 studies [30], suggested estimates that ranged from 1.4 to 6.49, with a mean of 3.28, a median of 2.79 and interquartile range of 1.16. But this review also noted that in more recent studies, R₀ estimates seem to have stabilised at around 2–3. Recent UK modelling used an estimate of 2.4 (range: 2.0 to 2.6) [3]. Of note is that in the NZ setting R₀ values may be lower than estimated in other settings. This is because relative to many other countries population density is relatively low, mass transit use is low (especially crowded mass transit such as subways), and susceptibility to respiratory viruses might also be reduced (due to relatively low smoking prevalence and low air pollution exposure in NZ).
Relative contagiousness in the prodromal period
50% There is uncertainty around this value but we used the same estimate as in recent UK modelling [3]. This has biological plausibility as while there is similarity in viral loads between asymptomatic and symptomatic COVID-19 patients [31], it would be expected that those who are fully symptomatic (with a cough etc.) would be more likely to transmit infection. Of note is an estimate from the Diamond Princess cruise ship outbreak, that 17.9% of COVID-19 infections were from asymptomatic individuals (95% credible interval 15.5-20.2%) [32]. But it is unclear how generalisable this finding is given the crowded cruise ship conditions and the typically elderly nature of the passengers.
Latency period 4 days We used an average duration of 4 days as per Read et al [33], with a standard deviation of 25% (calculated using 16 stages; Erlang distribution). This is similar to the estimate in a Chinese study which reported a median latent period of 3.69 days [34].
Prodromal period 1 day There is as yet insufficient data on this for COVID-19, so we used an assumed value for influenza (SD = 25%, Erlang distribution).
Symptomatic period
10 days The WHO-China Joint Mission report stated that “the median time from onset to clinical recovery for mild cases is approximately 2 weeks and is 3-6 weeks for patients with severe or critical disease” [12]. But given that mild cases may have been missed in this particular assessment, we used a slightly shorter time period of 10 days (SD = 25%, Erlang distribution). During this symptomatic period, cases were considered infectious. We note that there is evidence from COVID-19 cases of shedding of viral RNA from sputum that has outlasted the end of symptoms [35]. However, the significance of this for disease transmission is unknown.
Interventions
General contact reduction
Two scenarios
This variable covers the summated impact of a potentially wide variety of different interventions: people may adopt enhanced personal hygiene
19
Parameter Value/s used
Further details for inputs into the CovidSIM model and additional Excel-based analyses
(25%, 50%) and threshold analyses
measures (hand washing, cough etiquette etc); they may decide to have fewer contacts (physical distancing); and governments may close venues and schools, restrict mass transit, curtail mass gatherings, and restrict travel (within and between countries).
Scenario “25%”: This scenario is our approximation of a modest level of the above listed interventions.
Scenario “50%”: This scenario assumed an intensification of the measures being adopted (relative to the above scenario).
Threshold analyses: This was where we increased the level of “general contact reduction” to a level which pushed the epidemic peak into the following year (ie, past day 365 after the first day of assumed uncontrolled spread of COVID-19 in NZ on 1 April).
Contact reduction begins
1 April 2020
For the purposes of this modelling we assumed that the cases of COVID-19 detected in NZ during March 2020 triggered the process of contact reduction so that this was in place by the time the simulation of uncontrolled spread began on 1 April (see above). Indeed, during March 2020 there was NZ Government advice on hygiene promotion, physical distancing and constraints imposed on the upper size of mass gatherings etc. Multiple organisations also increased provision of hand sanitisers and local government closed some venues.
Contact reduction duration
6 months (9 months
and “rest of year” in scenario analyses)
This 6 month period was selected for demonstration purposes and was varied in threshold analyses (Table 1). As further discussed in the main text the feasibility of such sustained interventions for any country is highly uncertain and may not be realistic at high levels for long periods given the adverse social and economic implications.
Seasonality effect Variation in R₀ of 25%
Winter conditions are known to accelerate transmission of influenza and also the other coronaviruses which cause common cold like symptoms [36]. Enveloped viruses show strong seasonality with winter peaks [37], and SARS-Cov-2 is an enveloped virus. Even though there are many uncertainties relating to seasonality and this novel coronavirus [38], it seems prudent to assume some seasonal fluctuation so we increased the average by 25% in winter and reduced it by 25% in summer (with a sinusoidal variation throughout the simulated year), using a mid-winter peak for NZ of 15 July (ie, day 106 of the simulation).
Case isolation (only used in the threshold analyses)
Varied in threshold analyses (Table 1)
We set the following values in threshold analyses (while setting 0% for “general contact reduction” – see above):
Probability that a sick person is isolated = varied in threshold analyses
Maximum capacity of isolation wards = 3 per 10,000 population (ie, 1,500 in total in NZ, see below).
Contact reduction for cases in home isolation = 50% (this occurs when hospital isolation capacity is exceeded)
Beginning of case isolation measures = the 1 April date used for the start of the simulation (ie, assuming increased clinician awareness from the cases in NZ detected during March 2020).
Duration of case isolation measures = 6 months (183 days), or 9 months (274 days) or the rest of the simulated year.
For isolation capacity in NZ hospitals we assumed that 10% of hospital beds could be converted for this use during the pandemic, with NZ having 2.61 hospital beds per 1000 population in 2018 [39]. If 10% of these were used for isolation purposes, then this is 2.6 per 10,000 (rounded to 3 per 10,000 for use in CovidSIM, or 1,500 beds in total).
20
References
1. World Health Organization. Coronavirus disease 2019 (COVID-19) Situation Report – 59.
2020;(19 March). https://www.who.int/docs/default-source/coronaviruse/situation-
reports/20200319-sitrep-59-covid-19.pdf?sfvrsn=c3dcdef9_2.
2. Hellewell J, Abbott S, Gimma A, Bosse NI, Jarvis CI, Russell TW, et al. Feasibility of
controlling COVID-19 outbreaks by isolation of cases and contacts. Lancet Glob Health.
2020.
3. Ferguson N, Laydon D, Nedjati-Gilani G, Imai N, Ainslie K, Baguelin M, et al. Impact of
non-pharmaceutical interventions (NPIs) to reduce COVID-19 mortality and healthcare
demand. Imperial College 2020;(16 March):1-20.
4. Wang C, Liu L, Hao X, Guo H, Wang Q, Huang J, et al. Evolving epidemiology and impact
of non-pharmaceutical interventions on the outbreak of coronavirus disease 2019 in Wuhan,
China. MedRxiv 2020;(6 March).
https://www.medrxiv.org/content/10.1101/2020.03.03.20030593v1.
5. Lai S, Ruktanonchai N, Zhou L, Prosper O, Luo W, Floyd J, et al. Effect of non-
pharmaceutical interventions for containing the COVID-19 outbreak: an observational and
modelling study. MedRxiv 2020;(9 March).
https://www.medrxiv.org/content/10.1101/2020.03.03.20029843v2.full.pdf.
6. The Novel Coronavirus Pneumonia Emergency Response Epidemiology Team. The
epidemiological characteristics of an outbreak of 2019 novel coronavirus diseases (COVID-
19) — China, 2020. China CDC Weekly 2020.
http://weekly.chinacdc.cn/en/article/id/e53946e2-c6c4-41e9-9a9b-fea8db1a8f51.
7. Verrall A, Norton K, Rooker S, Dee S, Olsen L, Tan CE, et al. Hospitalizations for pandemic
(H1N1) 2009 among Maori and Pacific Islanders, New Zealand. Emerg Infect Dis.
2010;16(1):100-102.
8. Wilson N, Telfar Barnard L, Summers J, Shanks G, Baker M. Differential mortality by
ethnicity in 3 influenza pandemics over a century, New Zealand. Emerg Infect Dis.
2012;18:71-77.
9. Rice GW. Black Flu 1918: The Story of New Zealand's Worst Public Health Disaster.
Christchurch: Canterbury University Press; 2017.
10. Reynolds DL, Garay JR, Deamond SL, Moran MK, Gold W, Styra R. Understanding,
compliance and psychological impact of the SARS quarantine experience. Epidemiol Infect.
2008;136(7):997-1007.
11. Wu P, Fang Y, Guan Z, Fan B, Kong J, Yao Z, et al. The psychological impact of the SARS
epidemic on hospital employees in China: exposure, risk perception, and altruistic acceptance
of risk. Can J Psychiatry. 2009;54(5):302-311.
12. WHO-China Joint Mission. Report of the WHO-China Joint Mission on Coronavirus Disease
2019 (COVID-19). 2020;(16-24 February). https://www.who.int/docs/default-
source/coronaviruse/who-china-joint-mission-on-covid-19-final-report.pdf.
13. Kupferschmidt K, Cohen J. China’s aggressive measures have slowed the coronavirus. They
may not work in other countries. Science 2020;(2 March).
https://www.sciencemag.org/news/2020/03/china-s-aggressive-measures-have-slowed-
coronavirus-they-may-not-work-other-countries.
14. Cowling B, Lim W. They’ve contained the coronavirus. Here’s how. New York Times
2020;(13 March). https://www.nytimes.com/2020/03/13/opinion/coronavirus-best-
response.html.
15. Walker TA, Waite B, Thompson MG, McArthur C, Wong C, Baker MG, et al. Risk of Severe
Influenza Among Adults With Chronic Medical Conditions. J Infect Dis. 2020;221(2):183-
190.
21
16. Capital & Coast DHB. Capital & Coast DHB Intensive Care Unit (ICU). (Updated 11
February 2020). https://www.healthpoint.co.nz/public/intensive-care/capital-coast-dhb-
intensive-care-unit-icu/.
17. Lewis O. Coronavirus: ICU expert says NZ could double bed numbers in 'exceptional
circumstances'. Stuff 2020;(19 March).
https://i.stuff.co.nz/national/health/coronavirus/120398253/coronavirus-icu-expert-says-nz-
could-double-bed-numbers-in-exceptional-circumstances.
18. Statistics New Zealand. Population (December 2019). Statistics New Zealand.
https://www.stats.govt.nz/topics/population https://www.stats.govt.nz/topics/population.
19. Wu J, Leung K, Bushman M, Kishore N, Niehus R, de Salazar P, et al. Estimating clinical
severity of COVID-19 from the transmission dynamics in Wuhan, China. Nature Med.
2020;(E-publication 19 March).
20. Fink S. Worst-case estimates for U.S. coronavirus deaths. New York Times 2020;(Updated
14 March). https://www.nytimes.com/2020/03/13/us/coronavirus-deaths-estimate.html.
21. Wang D, Hu B, Hu C, Zhu F, Liu X, Zhang J, et al. Clinical characteristics of 138
hospitalized patients with 2019 novel coronavirus-infected pneumonia in Wuhan, China.
JAMA. 2020;(E-publication 8 February).
22. Young BE, Ong SWX, Kalimuddin S, Low JG, Tan SY, Loh J, et al. Epidemiologic Features
and Clinical Course of Patients Infected With SARS-CoV-2 in Singapore. JAMA. 2020.
23. Wilson N, Summers JA, Baker MG. The 2009 influenza pandemic: a review of the strengths
and weaknesses of the health sector response in New Zealand. N Z Med J.
2012;125(1365):54-66.
24. Predictive Healthcare team at Penn Medicine. COVID-19 Hospital Impact Model for
Epidemics. University of Pennsylvania, 2020. http://penn-chime.phl.io/.
25. Yang X, Yu Y, Xu J, Shu H, Xia J, Liu H, et al. Clinical course and outcomes of critically ill
patients with SARS-CoV-2 pneumonia in Wuhan, China: a single-centered, retrospective,
observational study. Lancet Respir Med. 2020;Published Online (21 February).
https://doi.org/10.1016/S2213-2600(20)30079-5.
26. World Health Organization. Coronavirus disease 2019 (COVID-19) Situation Report – 30.
2020;(19 February). https://www.who.int/docs/default-source/coronaviruse/situation-
reports/20200219-sitrep-30-covid-19.pdf?sfvrsn=3346b04f_2.
27. Wilson N, Kvalsvig A, Telfar Barnard L, Baker M. Case-fatality estimates for COVID-19
calculated by using a lag time for fatality. Emerg Infect Dis. 2020 [Early release 13 March].
https://doi.org/10.3201/eid2606.200320.
28. Mizumoto K, Chowell G. Estimating the risk of 2019 novel coronavirus death during the
course of the outbreak in China, 2020. MedRxiv 2020;(23 February).
https://www.medrxiv.org/content/10.1101/2020.02.19.20025163v1.
29. World Health Organization. Coronavirus disease 2019 (COVID-19) Situation Report – 46.
2020;(6 March). https://www.who.int/docs/default-source/coronaviruse/situation-
reports/20200306-sitrep-46-covid-19.pdf?sfvrsn=96b04adf_4.
30. Liu Y, Gayle AA, Wilder-Smith A, Rocklov J. The reproductive number of COVID-19 is
higher compared to SARS coronavirus. J Travel Med. 2020.
31. Zou L, Ruan F, Huang M, Liang L, Huang H, Hong Z, et al. SARS-CoV-2 Viral Load in
Upper Respiratory Specimens of Infected Patients. New Engl J Med. 2020.
32. Mizumoto K, Kagaya K, Zarebski A, Chowell G. Estimating the asymptomatic proportion of
coronavirus disease 2019 (COVID-19) cases on board the Diamond Princess cruise ship,
Yokohama, Japan, 2020. Euro Surveill. 2020;25:pii=2000180.
https://doi.org/2000110.2002807/2001560-2007917.
22
33. Read J, Bridgen J, Cummings D, Ho A, Jewell C. Novel coronavirus 2019-nCoV: early
estimation of epidemiological parameters and epidemic predictions. MedRxiv 2020. doi:
https://doi.org/10.1101/2020.01.23.20018549.
34. Li R, Pei S, Chen B, Song Y, Zhang T, Yang W, et al. Substantial undocumented infection
facilitates the rapid dissemination of novel coronavirus (SARS-CoV2). Science (New York,
NY. 2020.
35. Woelfel R, Corman V, Guggemos W, Seilmaier M, Zange S, Mueller M, et al. Clinical
presentation and virological assessment of hospitalized cases of coronavirus disease 2019 in a
travel-associated transmission cluster. MedRxiv 2020;(8 March).
https://www.medrxiv.org/content/10.1101/2020.03.05.20030502v1.
36. Killerby ME, Biggs HM, Haynes A, Dahl RM, Mustaquim D, Gerber SI, et al. Human
coronavirus circulation in the United States 2014-2017. J Clin Virol. 2018;101:52-56.
37. Price RHM, Graham C, Ramalingam S. Association between viral seasonality and
meteorological factors. Sci Rep. 2019;9:929.
38. Cohen J. Why do dozens of diseases wax and wane with the seasons—and will COVID-19?
Science 2020;(13 March). https://www.sciencemag.org/news/2020/03/why-do-dozens-
diseases-wax-and-wane-seasons-and-will-covid-19.
39. OECD.Stat. Health care resources (2017 and 2018 data for hospital beds per 1000
population). https://stats.oecd.org/index.aspx?DataSetCode=HEALTH_REAC#.