Embed Size (px)
Citation preview

Environmental Microbiology (2003)
5
(1), 36–47
© 2003 Macaulay Land Use Research Institute
Blackwell Science, LtdOxford, UKEMIEnvironmental Microbiology1462-2912Macaulay Land Use Research Institute, 20035Origi-
nal Article
Potential bias of fungal 18S rDNA and ITS primersI. C. Anderson, C. D. Campbell and J. I. Prosser
Received 2 August, 2002; revised 30 September, 2002; accepted 30September, 2002. *For correspondence at the first address. [email protected]; Tel. (
+
44) 1224 498 200; Fax (
+
44) 1224498 207.
Potential bias of fungal 18S rDNA and internal transcribed spacer polymerase chain reaction primers for estimating fungal biodiversity in soil
Ian C. Anderson,
1,2
* Colin D. Campbell
1
andJames I. Prosser
2
1
The Macaulay Institute, Craigiebuckler, Aberdeen AB15 8QH, UK.
2
Department of Molecular and Cell Biology, University of Aberdeen, Institute of Medical Sciences, Foresterhill, Aberdeen AB25 2ZD, UK.
Summary
Four fungal 18S rDNA and internal transcribed spacer(ITS) polymerase chain reaction (PCR) primer pairswere tested for their specificity towards target fungalDNA in soil DNA extracts, and their ability to assessthe diversity of fungal communities in a natural grass-land soil was compared. Amplified PCR productswere cloned, and
ªªªª
50 clones from each library weresequenced. Phylogenetic analysis and databasesearches indicated that each of the sequenced clonedDNA fragments was of fungal origin for each primerpair, with the exception of the sequences generatedusing the 18S rDNA primers nu-SSU-0817 and nu-SSU-1196, where 35 of the 50 sequenced clonesrepresented soil invertebrates. Although some of theprimers have previously been suggested to be biasedtowards certain fungal taxonomic groups, the ratio ofsequences representing each of the four main fungalphyla,
Ascomycota
,
Basidiomycota
,
Chytridiomycota
and
Zygomycota
, was similar for each of the primerpairs, suggesting that primer bias may be less sig-nificant than previously thought. Collector’s curveswere plotted to estimate the coverage obtained foreach of the clone libraries after clustering thesequences into operational taxonomic units at a levelof 99% sequence similarity. The curves indicated thatgood coverage of diversity was achieved, with theexception of the clone library constructed using prim-ers nu-SSU-0817 and nu-SSU-1196, on account of thehigh number of non-fungal sequences obtained. Thework demonstrates the usefulness of 18S rDNA andITS PCR primers for assessing fungal diversity in
environmental samples, and it also highlights somepotential limitations of the approach with respect toPCR primer specificity and bias.
Introduction
Fungi play fundamentally important and diverse roles interrestrial ecosystems, being involved in many of the keyprocesses required for ecosystem functioning. They areimportant as pathogens of plants and animals, as mycor-rhizal symbionts of plants (Smith and Read, 1997) and asthe main agents for the decomposition of organic material.Fungi therefore possess the ability to control nutrientfluxes in natural ecosystems that may be aided throughextensive below-ground mycelial networks. Despite theirimportance in terrestrial ecosystems, little is known of thediversity of natural fungal populations. Recent estimatessuggest that 1.5 million fungal species are present innatural ecosystems, but only 5–10% have been describedformally (Hawksworth, 1991; 2001; Hawksworth andRossman, 1997). The primary reason for this apparentignorance has been the dependence on cultivation-basedtechniques for the characterization of fungal diversity. Themajor limitations of these techniques are the inability toseparate biomass from particulate material and a lack ofgrowth media and cultivation conditions suitable for allmembers of the community.
The development and application of molecular tech-niques, particularly those based on the analysis of 16SrRNA genes amplified from extracted DNA, have trans-formed studies of bacterial diversity in natural environ-ments. Similar techniques, however, have only recentlybeen used to characterize fungal diversity (Kowalchuk
et al
., 1997; Kowalchuk, 1998; Smit
et al
., 1999;Borneman and Hartin, 2000; Vainio and Hantula, 2000;van Elsas
et al
., 2000; Lowell and Klein, 2001; Möhlenhoff
et al
., 2001; Pennanen
et al
., 2001; Schabereiter-Gurtner
et al
., 2001). A major challenge in applying these tech-niques to fungal communities is the design of suitablepolymerase chain reaction (PCR) primers with specificityfor fungal DNA, while reducing co-amplification of similartarget DNA from non-fungal sources. Numerous PCRprimers have been described that amplify fungal rDNAfrom a wide range of taxonomic groups (White
et al
.,1990), although few were designed for use with DNA

Potential bias of fungal 18S rDNA and ITS primers
37
© 2003 Macaulay Land Use Research Institute,
Environmental Microbiology
,
5
, 36–47
extracted from mixed communities, and their lack of selec-tivity may lead to inaccurate estimates of fungal diversitywhen applied to complex environmental samples. Gardesand Bruns (1993) designed ITS1-F and ITS4-B primersspecifically to amplify fungal internal transcribed spacer(ITS) regions, without the co-amplification of plant or othereukaryotic DNA. Furthermore, several PCR primers havebeen designed recently to amplify partial 18S rRNA genesequences from species belonging to the four major fun-gal phyla (
Ascomycota
,
Basidiomycota
,
Chytridiomycota
and
Zygomycota
) from DNA extracted directly from soil(Smit
et al
., 1999; Borneman and Hartin, 2000). Althougha critical factor in designing PCR primers to fungal 18SrRNA genes is their specificity towards the target fungalDNA, achieving that specificity may ultimately bias theview that we obtain by attempting to avoid amplification ofnon-fungal DNA. This is because some regions of fungal18S rRNA gene sequences share high similarity withother eukaryotes. This has indeed been suggested to bethe case with recently designed fungal 18S rDNA primerpairs EF4/EF3 and EF4/fung5 (Smit
et al
., 1999). Therehave also been conflicting reports about the specificity ofnewly designed fungal 18S rDNA primers (Smit
et al
.,1999; Borneman and Hartin, 2000). For example,although the PCR primer pairs EF4/EF3 and EF4/fung5were shown in one study to amplify only fungal 18S rDNAsequences from wheat rhizosphere soil (Smit
et al
., 1999),other investigators have shown that the same primers canalso amplify some non-fungal template (Borneman andHartin, 2000). In addition, 18S rRNA gene sequences aregenerally only able to resolve taxonomic groups to thelevel of genus, and the taxonomic resolution of fungal 18SrDNA and ITS sequences is limited by the current avail-ability of information held within databases. The aim of thecurrent study was to assess the specificity of previouslypublished fungal 18S rDNA and ITS primers for estimatingfungal diversity in environmental samples and to use themto characterize the diversity of fungal communities in anatural grassland soil. This was achieved by the construc-tion of clone libraries from PCR products amplified usingpublished primer sets and comparison with respect to therelative abundances of sequences falling within the majorfungal groups.
Results
Amplification of fungal 18S rDNA and ITS fragments
PCR amplification of DNA extracted from soil was suc-cessful with all four of the primer pairs tested. In eachcase, PCR products of the expected sizes appeared asintense bands on agarose gels (data not shown). Theapproximate sizes of the amplified PCR products were:400–500 bp (nu-SSU-0817 and nu-SSU-1196); 700–
800 bp (nu-SSU-0817 and nu-SSU-1536); 1.4–1.5 kb(EF4 and EF3); 500–800 bp (ITS1-F and ITS4). PCRswere performed in both the presence and the absence ofbovine serum albumin (BSA) for each primer pair. In eachcase, the PCR product yield was considerably increasedin the presence of BSA.
Identification and phylogenetic analysis of nu-SSU-0817 and nu-SSU-1196 (A) clones
A phylogenetic analysis and
FASTA
database search wereconducted for the sequences of 50 random clones fromthe nu-SSU-0817 and nu-SSU-1196 (A) clone library. Ofthe 50 clones sequenced, 35 were found to have 89–95%sequence similarity to
Crossodonthina koreana
or
Hypo-gastrura dolsana
, both of which are species of inverte-brates that are commonly found in soil. The onlyexceptions were clone A30, which is most closely relatedto
Rhinosporidium seeberi
(89% sequence similarity), anaquatic protistan parasite, and clone A1, which is mostclosely related to
Diplolaimelloides meyli
(86% sequencesimilarity), a soil arthropod. All these sequences had93.1–100% sequence similarity to each other over theentire sequence length, and they clustered together in thephylogenetic tree (Fig. 1). The remaining 15 clones clus-tered in a single clade of the phylogenetic tree and wereseparated from the non-fungal sequences by a stronglysupported branch (92% bootstrap support). Each of thesecloned sequences had a high sequence identity to fungal18S rDNA sequences in the GenBank database (Fig. 1).A further phylogenetic analysis was carried out using the15 fungal sequences to determine more accurately therelationships between sequences within this group(Fig. 2). All four major fungal phyla (
Ascomycota
,
Basidi-omycota
,
Chytridiomycota
and
Zygomycota
) were repre-sented among the 15 fungal clones.
Identification and phylogenetic analysis of nu-SSU-0817 and nu-SSU-1536 (B) clones
In contrast to the nu-SSU-0817 and nu-SSU-1196 (A)clone library, the
FASTA
results for the sequences of 48clones analysed from the nu-SSU-0817 and nu-SSU-1536(B) clone library revealed that all sequences were of fun-gal origin (Fig. 2). Thirty-two were most closely related tofungal basidiomycetes, whereas 15 were most closelyrelated to species of ascomycetes. All 32 basidiomyceteclones had 94.2–99.0% sequence similarity to basidio-mycete sequences in GenBank and EMBL over the entiresequence length. In contrast, although some of the asco-mycete sequences had high similarity to GenBanksequences (as high as 99.3%), sequence identities ofseveral were as low as 88.0%, preventing reliable identi-fication to the species and, in some instances, the genus

38
I. C. Anderson, C. D. Campbell and J. I. Prosser
© 2003 Macaulay Land Use Research Institute,
Environmental Microbiology
,
5
, 36–47
level. A single clone (B13) was most closely related to achytridiomycete (
Spizellomyces acuminatus
), whereasnone of the 48 clones sequenced in this clone libraryrepresented zygomycetes (Fig. 3). As in the A clonelibrary, the divergence between the majority of basidio-mycete sequences was low, and the sequences of sevenclones (B2, B20, B27, B35, B43, B49 and B6) wereidentical.
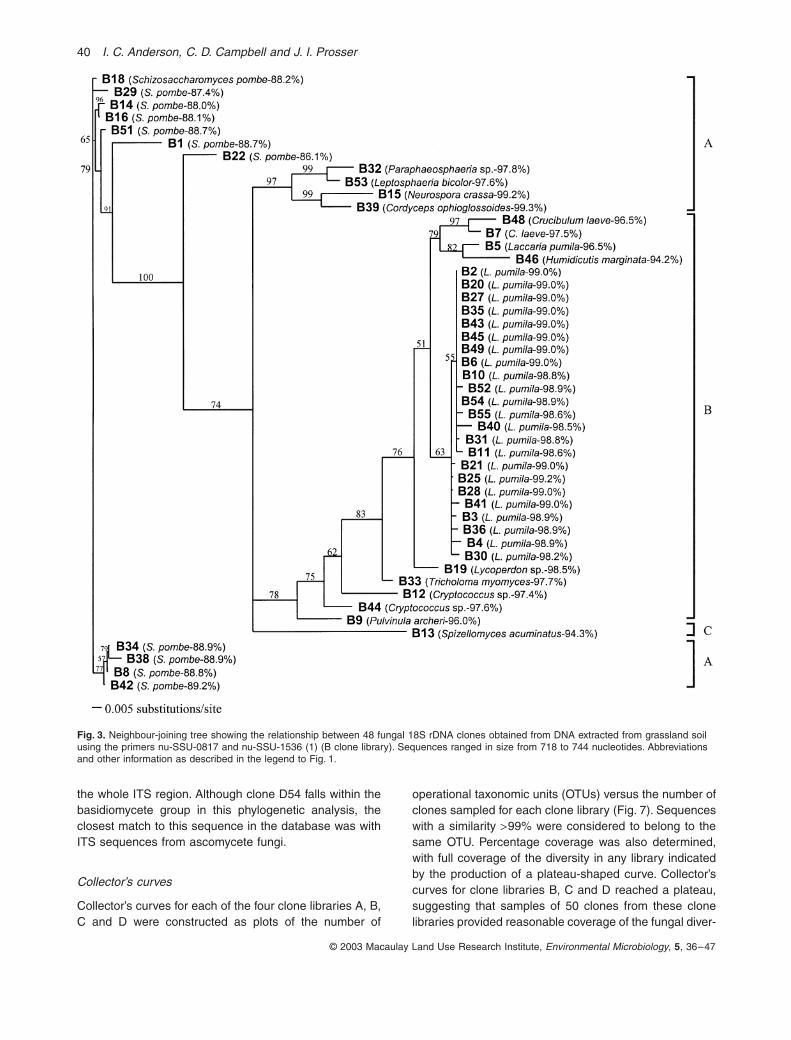
Identification and phylogenetic analysis of EF4 and EF3 (C) clones
Results using the EF4 and EF3 primer pair (clone libraryC) were similar to those observed for clone library B, inthat all 46 clones analysed were most closely related tofungal 18S rDNA sequences in the GenBank and EMBLdatabases. Thirty-five clones were most closely related to
Fig. 1.
Neighbour-joining tree showing the relationship between 50 18S rDNA clones obtained from DNA extracted from grassland soil using the primers nu-SSU-0817 and nu-SSU-1196 (1) (A clone library). A, ascomycete; B, basidiomycete; C, chytridiomycete; and Z, zygomycete sequences based on the results of a
FASTA
database search (closest sequence matches are shown in brackets). Sequences ranged in size from 376 to 385 nucleotides. The scale bar represents the number of base substitutions per site. Bootstrap values are shown for those branches that had
>
50% support in a bootstrap analysis of 1000 replicates.

Potential bias of fungal 18S rDNA and ITS primers
39
© 2003 Macaulay Land Use Research Institute,
Environmental Microbiology
,
5
, 36–47
basidiomycetes, each having 92.5–99.2% sequence sim-ilarity to basidiomycete sequences (Fig. 4). As observedfor clone library B, the divergence within the basidio-mycete sequences was low. All basidiomycete sequenceshad 98.3–100% identity over the entire sequence, whichis indicated by the short branch lengths in the basidio-mycete clade of the phylogenetic tree (Fig. 4), with theexception of clones C15, C29, C43 and C47, which weremore distantly related to other basidiomycete sequences.Of the remaining 11 clones in this library, nine were mostclosely related to ascomycete sequences and two to zygo-mycete sequences. Each of these 11 remaining cloneshad a 94.2–100% match with a fungal 18S rDNAsequence in the database. Although the ascomycete andbasidiomycete groups clustered together in a single cladeof the phylogenetic tree, the zygomycete sequences fellinto a clade separated from the ascomycete/basidio-mycete groups by a strongly supported branch (100%bootstrap support from 1000 replicates) (Fig. 4).
Identification and phylogenetic analysis of ITS1-F and ITS4 (D) clones
All 50 clones sequenced from the ITS1-F and ITS4 (D)clone library were most closely related to fungal ITSsequences within the GenBank and EMBL databases.Phylogenetic analysis of the 50 ITS sequences placedthem in two major groups representing ITS sequences ofascomycete and basidiomycete origin. These groups were
separated by a strongly supported branch of the phyloge-netic tree (100% bootstrap support from 1000 replicates)(Fig. 5).
FASTA
results and phylogenetic analysis indicatedthat none of the 50 ITS sequences generated using thisprimer pair represented a chytridiomycete or zygomyceteITS sequence. The ascomycete group consisted of 10clone sequences with high similarity (76.4–89.7%) to fun-gal ascomycete ITS sequences in the databases (Fig. 5).With the exception of clone D54, the remaining 40sequences had the highest sequence similarity to ITSsequences of basidiomycetes. These sequences clus-tered further into three smaller clades within the basidio-mycete group (Fig. 5). The level of sequence divergencebetween the clone sequences within the basidiomyceteclades I and II was relatively low, as indicated by relativelysmall branch lengths. In contrast, the remaining basidio-mycete sequences (clade III) were placed on much longerbranches in the tree, suggesting greater divergence thanthat exhibited by the other basidiomycete and ascomycetesequences analysed here (Fig. 5). A similar phylogeneticanalysis was conducted for all D clone sequences, usingthe portion of the sequence encoding the 5.8S rRNA gene(Fig. 6), as entire ITS sequences were difficult to alignbecause of significant differences in sequence length andbase composition. Clustering of the 50 cloned 5.8S rRNAgene sequences was similar to that of the ITS phyloge-netic tree, but with small rearrangements in some groups(Fig. 6). The sequences in the basidiomycete clade IIIwere as diverse over the 5.8S rRNA gene sequence as
Fig. 2.
Neighbour-joining tree showing the rela-tionship between the 15 fungal 18S rDNA clones obtained from DNA extracted from grassland soil using the primers nu-SSU-0817 and nu-SSU-1196 (1) (A clone library). Sequences ranged in size from 378 to 385 nucleotides. Abbreviations and other informa-tion as described in the legend to Fig. 1.
40
I. C. Anderson, C. D. Campbell and J. I. Prosser
© 2003 Macaulay Land Use Research Institute,
Environmental Microbiology
,
5
, 36–47
the whole ITS region. Although clone D54 falls within thebasidiomycete group in this phylogenetic analysis, theclosest match to this sequence in the database was withITS sequences from ascomycete fungi.
Collector’s curves
Collector’s curves for each of the four clone libraries A, B,C and D were constructed as plots of the number of
operational taxonomic units (OTUs) versus the number ofclones sampled for each clone library (Fig. 7). Sequenceswith a similarity
>
99% were considered to belong to thesame OTU. Percentage coverage was also determined,with full coverage of the diversity in any library indicatedby the production of a plateau-shaped curve. Collector’scurves for clone libraries B, C and D reached a plateau,suggesting that samples of 50 clones from these clonelibraries provided reasonable coverage of the fungal diver-
Fig. 3.
Neighbour-joining tree showing the relationship between 48 fungal 18S rDNA clones obtained from DNA extracted from grassland soil using the primers nu-SSU-0817 and nu-SSU-1536 (1) (B clone library). Sequences ranged in size from 718 to 744 nucleotides. Abbreviations and other information as described in the legend to Fig. 1.
Potential bias of fungal 18S rDNA and ITS primers
41
© 2003 Macaulay Land Use Research Institute,
Environmental Microbiology
,
5
, 36–47
sity. The extent of coverage varied for each of the libraries,with values for percentage coverage of 58%, 74% and46% for clone libraries B, C and D respectively. Coveragefor clone library A was 33%, and the collector’s curve forthis library did not reach a plateau, probably because only15 of the 50 clones sequenced were of a fungal origin(see Fig. 1).
A greater level of diversity was observed in thesequences from the ITS clone library (D), and this is
reflected in a larger number of OTUs observed (Fig. 7).Collector’s curves were also plotted for the ITS clonelibrary (D) for OTU sequence similarity values of
>
70%,80%, 90%, 95%, 98% and 99% (data not shown). Reduc-ing the percentage sequence similarity to 98% or 95% didnot significantly alter the collector’s curve, but furtherreductions significantly reduced the number of sampledclones required for the collector’s curve to plateau.Decreasing sequence similarity values to 90%, 80% and
Fig. 4.
Neighbour-joining tree showing the relationship between 46 fungal 18S rDNA clones obtained from DNA extracted from grassland soil using the primers EF4 and EF3 (19) (C clone library). Sequences ranged in size from 515 to 521 nucleotides. Abbreviations and other information as described in the legend to Fig. 1.

42
I. C. Anderson, C. D. Campbell and J. I. Prosser
© 2003 Macaulay Land Use Research Institute,
Environmental Microbiology
,
5
, 36–47
70% also increased the values for percentage coverageof the diversity in the clone library to 54%, 60% and 72%respectively.
Discussion
The initial aim of this study was to assess the specificityof previously published 18S rDNA and ITS PCR primersin estimating fungal biodiversity in environmental sam-ples. A major factor in designing PCR primers for environ-mental studies is the ability of the primers to amplify all
members of the fungal community without bias, whilealso excluding the co-amplification of other eukaryotesequences. This is particularly difficult when using therelatively highly conserved 18S rDNA region (Bruns
et al
.,1991; Page and Holmes, 1998). Phylogenetic analysisindicated that all sequences amplified using the primer setnu-SSU-0817 and nu-SSU-1536 (clone library B) were offungal origin. However, there is conflicting evidence for thespecificity of the other two 18S rDNA primer pairs inves-tigated. Borneman and Hartin (2000) reported the primerpair nu-SSU-0817 and nu-SSU-1196 (clone library A) to
Fig. 5.
Neighbour-joining tree showing the relationship between 50 ITS clones obtained from DNA extracted from grassland soil using the primers ITS1-F (3) and ITS4 (26) (D clone library). Sequences ranged in size from 467 to 742 nucleotides. Abbreviations and other information as described in the legend to Fig. 1.

Potential bias of fungal 18S rDNA and ITS primers
43
© 2003 Macaulay Land Use Research Institute,
Environmental Microbiology
,
5
, 36–47
be specific for fungal 18S rDNA sequences. In contrast,of the 50 clones obtained using this primer set that weresequenced in our study (clone library A), only 15 were offungal origin. The majority of the remaining 35 sequenceswere most closely related to species of soil invertebratesthat clustered together in the phylogenetic analysis. Notsurprisingly, when these non-fungal sequences wereremoved from the analysis, small changes in the topologyof the remaining fungal sequences were observed (seeFig. 2). For the EF4 and EF3 primer pair, Smit
et al
. (1999)
demonstrated selective amplification of fungal 18S rDNAsequences from wheat rhizosphere soil, whereasBorneman and Hartin (2000) reported amplification, bythe same primers, of some non-fungal templates. The 46clones sequenced from the library obtained using the EF4and EF3 primer pair in our study (clone library C) were allof fungal origin. These apparent discrepancies highlightthe need to evaluate primers carefully when amplifyinggenes from environmental samples, where much of thecommunity may be poorly represented by cultured organ-
Fig. 6.
Neighbour-joining tree showing the relationship between 50 ITS clones obtained from DNA extracted from grassland soil using the primers ITS1-F (3) and ITS4 (26) (D clone library) based on 5.8S rDNA sequences. Sequences ranged in size from 164 to 168 nucleotides. Abbreviations and other information as described in the legend to Fig. 1.

44
I. C. Anderson, C. D. Campbell and J. I. Prosser
© 2003 Macaulay Land Use Research Institute,
Environmental Microbiology
,
5
, 36–47
isms (Hawksworth and Rossman, 1997; Hawksworth,2001) and where coverage in databases may be poor. Itis possible that discrepancies in primer specificity maybecome more apparent over time as the primers aretested further, particularly with samples collected fromdifferent environments containing a diversity of eukaryoticcommunities. Recently, molecular techniques have beenused to assess fungal communities in various sampletypes including painted art objects and window surfaces(Möhlenhoff
et al
., 2001; Schabereiter-Gurtner
et al
.,2001). Therefore, although the primer pair nu-SSU-0817and nu-SSU-1196 lacks the desired specificity for charac-terizing fungal communities in soil, it may be useful foranalysing fungal communities in other sample types, par-ticularly as they appear to amplify 18S rDNA sequencesfrom each of the four main fungal phyla.
A further constraint on the design of fungal-specific 18SrDNA primers is that of potential bias towards certaintaxonomic groups, which is likely to increase with increas-ing specificity. Smit
et al
. (1999) suggested that primersEF4 and EF3 were slightly biased towards the amplifica-tion of basidiomycetes and zygomycetes after analysis ofcultured organisms and environmental samples. Indeed,35 of the 46 sequences obtained with these primers in ourstudy were of basidiomycete origin (Fig. 4). The remaining11 sequences represented nine ascomycetes and twozygomycetes. These results may be caused by primerbias, but the ratio of basidiomycete to ascomycetesequences was similar for each of the four primer pairsused, and the diversity (as indicated by branch lengths)observed within the ascomycete and basidiomycetegroups in the phylogenetic trees was similar for each
primer pair. Diversity within the ascomycete sequenceswas always greater than that within the basidiomycetesequences, the only exception being the basidiomyceteclade III in the ITS phylogenetic tree (D clones). In addi-tion, with the exception of the EF4 and EF3 (C clone)phylogenetic tree, the majority of amplified basidiomycetesequences in the clone libraries were most closely relatedto fungal species of the same family. For example, a largenumber of basidiomycete sequences had high (
>
98%)sequence similarity to
Panellus stipticus
and
Laccariapumila
in the 18S rDNA clone libraries A and B, and high(
>
75%) sequence similarity to
Termitomyces
sp. in theITS (D) clone library. Each of these three fungal basidio-mycete species belongs to the family Tricholomataceae
.
Therefore, although the findings may result from somelevel of primer bias, similar proportions of basidiomycetesequences within clone libraries targeting different regionsof the fungal genome suggest that bias may be less sig-nificant than previously considered and that the resultsprovide a true reflection of the natural fungal community.
Sequences representing chytridiomycetes were onlydetected in the A and B clone libraries, which wasexpected, as they are considered to have little importancein soil ecosystems (Smit
et al
., 1999). However, the major-ity of fungi forming arbuscular mycorrhizal symbioses withgrass roots belong to the
Zygomycota
(Smith and Read,1997) and would be expected to constitute a significantproportion of fungal biomass in pasture soils. Surprisingly,however, zygomycete sequences were only detected inthe A and C clone libraries. This may reflect primer bias,as has been suggested previously (Smit
et al
., 1999), butmay have resulted from other factors, including bias asso-ciated with the DNA extraction procedure. Although thebead beating DNA extraction procedure used in this studyhas been used previously in the analysis of both bacterialand fungal communities (Smit
et al
., 1999; Griffiths
et al
.,2000), the extent to which fungal mycelium and sporesfrom different fungal taxa are lysed by this technique isunknown.
A major limitation in investigating fungal diversity inenvironmental samples is the lack of reference sequenceinformation in databases. The majority of fungalsequences generated with the 18S rDNA primer pairs (A,B and C clone libraries) had relatively high similarity tofungal 18S rDNA database sequences. However, many ofthe clones sequenced from the ITS clone library clusteringin the basidiomycete clade III matched databasesequences over a very small stretch of the sequence(150–250 bp), with most similarity over the region ofsequence corresponding to the 5.8S rRNA gene, which isthought to be highly conserved in fungi (Hibbett, 1992).Sequences in the basidiomycete clade III of the ITS phy-logenetic tree (Fig. 5) appear to be considerably morediverse than the other groups of basidiomycetes, as indi-
Fig. 7.
Collector’s curves for the A, B, C and D clone libraries. Clones were grouped into OTUs at a level of 99% sequence similarity. The maximum level of diversity that could be observed in a clone library (i.e. each clone being a different OTU) is also shown for comparison.

Potential bias of fungal 18S rDNA and ITS primers
45
© 2003 Macaulay Land Use Research Institute,
Environmental Microbiology
,
5
, 36–47
cated by long branch lengths, but their placement withinthe basidiomycete group is well supported (100% boot-strap value). This suggests that they are more closelyrelated to basidiomycetes than to other fungal phyla,although the lack of reference ITS sequences preventsidentification of these sequences to a level higher thanphylum. The sequence of clone D54 clustered within thebasidiomycete clade III, and placement within the basidi-omycete clade was supported by phylogenetic analysis ofthe 5.8S rRNA gene sequences. However, the closestmatch using a
FASTA
search was with an ascomycete,suggesting possible placement close to the point of asco-mycete and basidiomycete divergence. Support for thishypothesis would require analysis with greater resolution.Therefore, although the limit of resolution of the ITS regionis better than that of the more conserved 18S rDNAregion, identification of sequences from previously unde-scribed fungal species, or species poorly represented inthe database, is impossible. Although the 18S rDNA data-base information is also lacking, the conserved nature ofthis region enables identification of the majority of fungalsequences from environmental samples to a higher taxo-nomic level than phylum. The ITS sequences in the basid-iomycete clade III may represent previously undescribedfungal taxa or species that do not have representativesequences in the database.
Estimating the coverage of fungal diversity wasattempted by the construction of collector’s curves foreach clone library by grouping sequences into OTUs at asimilarity of
>
99%. This similarity level was chosenbecause of the high level of conservation in fungal 18SrRNA genes, and plotted curves began to plateau foreach clone library except clone library A. As the ITSregion is not as highly conserved as the rRNA genes, thesequences from clone library D were clustered into OTUsat several levels of sequence similarity, but no changewas observed in the collector’s curve until values
<
90%were used, when curves reached a plateau more rapidly.Interestingly, even at a 99% sequence similarity, 46% ofthe diversity contained within the clone library was sam-pled in the 50 sequenced clones, although this mayreflect the low level of sequence divergence within thebasidiomycete sequences. The collector’s curve dataappear to demonstrate that reasonable coverage of thefungal diversity within the 18S rDNA and ITS clone librar-ies was detected in the 50 clones sequenced. This con-trasts with a similar analysis of bacterial 16S rDNA clonelibraries from the same soil type (McCaig
et al
., 1999), inwhich coverage was not achieved by sequencing 45clones.
The data presented here demonstrate the requirementfor rigorous testing of the specificity of PCR primersdesigned for the amplification of target organisms or taxaand the need to include DNA sequencing as a tool in this
validation process. However, it also demonstrates the use-fulness of both 18S rDNA and ITS primers in assessingthe biodiversity of fungal communities in complex environ-mental samples and indicates possible limitations of theapproach that require consideration. The lack of fungalDNA sequence information available in databases and thepossibility of primer bias towards certain fungal taxonomicgroups are likely to preclude the use of a single primerpair with universal application to studies of fungal biodi-versity, and future analyses may require a combination ofapproaches.
Experimental procedures
DNA extraction
A 3 cm diameter
¥
5 cm soil core was collected from a naturalgrassland field site at Sourhope Research Station (nationalgrid reference NT 854196) in the Borders Region of Scotland,UK. DNA was extracted from duplicate 0.5 g soil subsamplesusing the method previously described by Griffiths
et al
.(2000). Briefly, this involved the addition of 0.5 ml of hexade-cyltrimethylammonium bromide (CTAB) extraction buffer and0.5 ml of phenol–chloroform–isoamyl alcohol (25:24:1;pH 8.0) to 0.5 g of soil in a Bio-101 Multimix matrix tube. Thesample was then lysed for 30 s at a speed of 5.5 ms
-
1
in aFastPrep bead beating system (Bio-101), and the aqueousphase was separated by centrifugation. The sample wasextracted further with an equal volume of chloroform–isoamylalcohol (24:1) before precipitating the nucleic acids with twovolumes of 30% (w/v) polyethylene glycol 6000 in 1.6 M NaClfor 2 h at room temperature followed by centrifugation. Pel-leted nucleic acids were then washed with ice-cold 70% (v/v) ethanol and air dried before resuspension in 50
m
l of Tris-EDTA buffer (pH 7.4).
PCR amplification
PCR amplification of fungal 18S rDNA was carried out usingthe primer pairs: nu-SSU-0817 and nu-SSU-1196; nu-SSU-0817 and nu-SSU-1536 (Borneman and Hartin, 2000); andEF4 and EF3 (Smit
et al
., 1999), whereas fungal ITSsequences were amplified using primers ITS1-F (Gardes andBruns, 1993) and ITS4 (White et al., 1990) (Table 1). PCRswere carried out on an Omn-E thermal cycler (Hybaid) using50 ml reaction volumes containing: ª 50 ng of template DNA,20 pmol of each primer, 2.0 mM MgCl2, 250 mM each dATP,dCTP, dGTP and dTTP, 10¥ buffer [20 mM Tris-HCl (pH 7.5),100 mM KCl, 1 mM dithiothreitol (DTT), 0.1 mM EDTA, 0.5%Tween 20 (v/v), 0.5% Nonidet P40 (v/v), 50% glycerol (v/v)],1 ml of a BSA solution (20 mg ml-1) and 2.5 U of Expand HighFidelity DNA polymerase (Roche). Cycling parameters were94∞C for 5 min, followed by 35 cycles of 94∞C for 30 s, 55∞Cfor 30 s and 72∞C for 30 s with a final extension at 72∞C for5 min for each primer pair. Reactions were performed induplicate, and negative controls (containing no DNA) wereincluded in each PCR. Amplification products were electro-phoresed in 1.5% (w/v) agarose gels, stained with ethidiumbromide and visualized under UV light.

46 I. C. Anderson, C. D. Campbell and J. I. Prosser
© 2003 Macaulay Land Use Research Institute, Environmental Microbiology, 5, 36–47
Cloning and sequencing of 18S rDNA and ITS PCR products
PCR amplification products were purified using the QiaquickPCR purification kit (Qiagen) before cloning with the pGEM-T Easy vector system (Promega) using a molar vector–insertratio of 1:1. Ligations were transformed into JM109 highefficiency competent cells (Promega). Fifty white coloniesfrom each of the four clone libraries (A, nu-SSU0817 and nu-SSU1196; B, nu-SSU0817 and nu-SSU1536; C, EF4 andEF3; and D, ITS1-F and ITS4) were picked at random andscreened for positive inserts by performing colony PCR withthe M13 forward and reverse vector primers (Promega) usingthe conditions outlined above, except that BSA was omittedfrom the reactions. Positive PCR products were visualized byagarose gel electrophoresis and subsequently purified usingthe Qiaquick PCR purification kit (Qiagen). Purified DNA wasthen sequenced using the BigDye Terminator cycle sequenc-ing kit with an automated DNA sequencer (ABI model 377;Applied Biosystems). Sequencing reactions were performedwith the vector primers T7 and SP6 (Promega) in each case,except for products from the EF4 and EF3 clone library, whichwere sequenced using primers EF4 and fung5 (Smit et al.,1999).
Sequence analysis
DNA sequences were edited, and consensus sequenceswere obtained, using the SEQUENCHER software package(version 3.0; Gene Codes Corporation). All sequencedclones were analysed for the presence of chimeras using theCHIMERA CHECK program (version 2.7) from the RibosomalDatabase Project (RDP). Sequences suspected of being chi-meric were not included in further analyses. Final sequenceswere then aligned using CLUSTALW (version 1.8.2; Thompsonet al., 1994) for each of the four clone libraries. The transition/transversion ratio and the g distribution parameter were esti-mated for each data set using TREE-PUZZLE (version 5.0;Strimmer and von Haeseler, 1996) before conducting aneighbour-joining analysis using the F84 model in PAUP (ver-sion 4.0b10; Swofford, 2002) with 1000 bootstrap replicates.Additionally, all sequences were analysed using the FASTA
3.0 program (Pearson and Lipman, 1998) to determine theclosest matches in the GenBank and EMBL nucleotide data-
bases. The level of sequence similarity between clones wasalso assessed for each clone library using the HOMOLOGIES
program (within the EGCG extensions to the Wisconsin Pack-age, version 8.1.0; Rice, 1996). Clones from the three 18SrDNA clone libraries (i.e. A, B and C) were clustered intooperational taxonomic units (OTUs) at a level of >99%sequence similarity, whereas the clones from the ITS clonelibrary (D) were clustered into OTUs at levels of >70%, 80%,90%, 95%, 98% and 99% sequence similarity. Collector’scurves (number of OTUs detected versus number of clonessequenced) were plotted to compare the diversity observedin each of the clone libraries. The percentage coverage wasalso calculated for each clone library [i.e. 1–(number ofOTUs/number of clones sampled) ¥ 100].
Nucleotide sequence accession numbers
All nucleotide sequences were submitted to GenBank underaccession numbers AF504687–AF504736 for clones A1–A50, AF504737–AF504784 for clones B1–B55, AF504785–AF504830 for clones C1–C51 and AF504831–AF504880 forclones D1–D54.
Acknowledgements
This work was funded by The Macaulay Development Trustas part of The Macaulay Institute/University of Aberdeen SoilHealth Initiative. C.D.C. is funded by the Scottish ExecutiveEnvironment and Rural Affairs Department. The authorsgratefully acknowledge Martin Embley for guidance with thephylogenetic analyses.
References
Borneman, J., and Hartin, R.J. (2000) PCR primers thatamplify fungal rRNA genes from environmental samples.Appl Environ Microbiol 66: 4356–4360.
Bruns, T.D., White, T.J., and Taylor, J.W. (1991) Fungalmolecular systematics. Annu Rev Ecol Syst 22: 525–564.
van Elsas, J.D., Duarte, G.F., Keijzer-Wolters, A., and Smit,E. (2000) Analysis of the dynamics of fungal communitiesin soil via fungal-specific PCR of soil DNA followed by
Table 1. 18S rDNA and ITS PCR primers.
Primer pairTarget genomicregion Primer sequence (5¢-3¢)
Approx. fragmentsize (bp) Reference
nu-SSU-0817 18S rDNA TTAGCATGGAATAATRRAATAGGA 420 Borneman and Hartin (2000)nu-SSU-1196 TCTGGACCTGGTGAGTTTCC Borneman and Hartin (2000)nu-SSU-0817 18S rDNA TTAGCATGGAATAATRRAATAGGA 760 Borneman and Hartin (2000)nu-SSU-1536 ATTGCAATGCYCTATCCCCA Borneman and Hartin (2000)EF4 18S rDNA GGAAGGGRTGTATTTATTAG 1500 Smit et al. (1999)EF3 TCCTCTAAATGACCAAGTTTG Smit et al. (1999)EF4a 18S rDNA GGAAGGGRTGTATTTATTAG 550 Smit et al. (1999)fung5a GTAAAAGTCCTGGTTCCCC Smit et al. (1999)ITS1-F ITS CTTGGTCATTTAGAGGAAGTAA 450–750 Gardes and Bruns (1993)ITS4 TCCTCCGCTTATTGATATGC White et al. (1990)
a. Primers used for sequencing EF4 and EF3 clones.

Potential bias of fungal 18S rDNA and ITS primers 47
© 2003 Macaulay Land Use Research Institute, Environmental Microbiology, 5, 36–47
denaturing gradient gel electrophoresis. J Microbiol Meth-ods 43: 133–151.
Gardes, M., and Bruns, T.D. (1993) ITS primers withenhanced specificity for basidiomycetes: application to theidentification of mycorrhiza and rusts. Mol Ecol 2: 113–118.
Griffiths, R.I., Whiteley, A.S., O’Donnell, A.G., and Bailey,M.J. (2000) Rapid method for coextraction of DNA andRNA from natural environments for analysis of ribosomalDNA- and rRNA-based microbial community composition.Appl Environ Microbiol 66: 5488–5491.
Hawksworth, D.L. (1991) The fungal dimension of biodiver-sity: magnitude, significance, and conservation. Mycol Res95: 641–655.
Hawksworth, D.L. (2001) The magnitude of fungal diversity:the 1.5 million species estimate revisited. Mycol Res 105:1422–1432.
Hawksworth, D.L., and Rossman, A.Y. (1997) Where are allthe undescribed fungi? Phytopathology 87: 888–891.
Hibbett, D.S. (1992) Ribosomal RNA and fungal systematics.Trans Mycol Soc Japan 33: 533–556.
Kowalchuk, G.A. (1998) Fungal community analysis usingdenaturing gradient gel electrophoresis. In MolecularMicrobial Manual 3.4.6. Akkermans, A.D.L., van Elsas,J.D., and de Bruijn, F.J. (eds). Dordrecht: Kluwer, pp.1–16.
Kowalchuk, G.A., Gerards, S., and Woldendorp, J.W. (1997)Detection and characterisation of fungal infections ofAmmophila arenaria (Marram grass) roots by denaturinggradient gel electrophoresis of specifically amplified 18SrDNA. Appl Environ Microbiol 63: 3858–3865.
Lowell, J.L., and Klein, D.A. (2001) Comparative single-strand conformation polymorphism (SSCP) and micros-copy-based analysis of nitrogen cultivation interactiveeffects on the fungal community of a semiarid steppe soil.FEMS Microbiol Ecol 36: 85–92.
McCaig, A.E., Glover, L.A., and Prosser, J.I. (1999) Molecu-lar analysis of bacterial community structure and diversityin unimproved and improved upland grass pastures. ApplEnviron Microbiol 65: 1721–1730.
Möhlenhoff, P., Müller, L., Gorbushina, A.A., and Petersen,K. (2001) Molecular approach to the characterisation offungal communities: methods for DNA extraction, PCRamplification and DGGE analysis of painted art objects.FEMS Microbiol Lett 195: 169–173.
Page, R.D.M., and Holmes, E.C. (1998) Molecular Evolution:a Phylogenetic Approach. Oxford: Blackwell Science Pub-lishing.
Pearson, W.R., and Lipman, D.J. (1998) Improved tool forbiological sequence analysis. Proc Natl Acad Sci USA 85:2444–2448.
Pennanen, T., Paavolainen, L., and Hantula, J. (2001) RapidPCR-based method for the direct analysis of fungal com-munities in complex environmental samples. Soil Biol Bio-chem 33: 697–699.
Rice, P. (1996) Program Manual for the EGCG Package.Cambridge: The Sanger Centre.
Schabereiter-Gurtner, C., Piñar, G., Lubitz, W., and Rölleke,S. (2001) Analysis of fungal communities on historicalchurch window glass by denaturing gradient gel electro-phoresis and phylogenetic 18S rDNA sequence analysis.J Microbiol Methods 47: 345–354.
Smit, E., Leeflang, P., Glandorf, B., van Elsas, J.D., andWernars, K. (1999) Analysis of fungal diversity in the wheatrhizosphere by sequencing of cloned PCR-amplified genesencoding 18S rRNA and temperature gradient gel electro-phoresis. Appl Environ Microbiol 65: 2614–2621.
Smith, S.E., and Read, D.J. (1997) Mycorrhizal Symbiosis.London: Academic Press.
Strimmer, K., and von Haeseler, A. (1996) Quartet puzzling:a quartet maximum likelihood method for reconstructingtree topologies. Mol Biol Evol 13: 964–969.
Swofford, D.L. (2002) paup*. Phylogenetic Analysis UsingParsimony (*and Other Methods), Version 4. Sunderland,MA: Sinauer Associates.
Thompson, J.D., Higgins, D.G., and Gibson, T.J. (1994)CLUSTAL W: improving the sensitivity of progressive mul-tiple sequence alignment through sequence weighting,positions-specific gap penalties and weight matrix choice.Nucleic Acids Res 22: 4673–4680.
Vainio, E.J., and Hantula, J. (2000) Direct analysis ofwood-inhabiting fungi using denaturing gradient gel elec-trophoresis of amplified ribosomal DNA. Mycol Res 104:927–936.
White, T.J., Bruns, T.D., Lee, S., and Taylor, J. (1990) Anal-ysis of phylogenetic relationships by amplification anddirect sequencing of ribosomal RNA genes. In PCR Proto-cols: a Guide to Methods and Applications. Innis, M.A.,Gelfand, D.H., Sninsky, J.J., and White, T.J. (eds). NewYork: Academic Press, pp. 315–322.
insert Figure 1 near hereinsert Figure 2 near hereinsert Figure 3 near hereinsert Figure 4 near hereinsert Figure 5 near hereinsert Figure 6 near hereinsert Figure 7 near hereinsert Table 1 near here [email protected]