Embed Size (px)
Citation preview

Potassium (K)-Iron (Fe) Interactions
inMaize Growth
Hakan ÇELİK, Ali Vahap KATKAT, Barış Bülent AŞIK and Serhat GÜREL
Uludag University, Faculty of Agriculture, Department of Soil Science and Plant Nutrition, Bursa, 16059, TURKEY
Fax:+90 224 2941402, e-mail: [email protected]

Potassium (K) is essential for plant and animal life wherein ithas many vital nutritional roles.
While in animals and humans, potassium is the third mostabundant element after calcium and phosphorus,in plants, potassium and nitrogen are the two elements required ingreatest amounts.
Without sufficient plant and animal intake of potassium, life aswe know it would cease.

This nutrient plays an essential role in plant growth and metabolism.It activates enzymes, serves as an osmoticum to maintain tissue turgor pressure, regulates the opening and closing of stomata balances the charge of anions (Marchner, 1995; Mengel, 2007) .

All plants require potassium, especially crops high incarbohydrates.
Studies have shown that adequate amounts of potassium maypromote the growth of long, strong cotton fibres;
increase the size and quality of fruits, grains, and vegetables;

Increases the shelf life of fruits; Increases the stem length and quantity of roses; Enhances the green colour and growth of turf grass;

Balanced nutrition in plants is oneof the main factors affecting yieldand quality.
Although potassium (K) is regardedas one of the major nutrientelements that influence the yieldand quality,
Iron (Fe) chlorosis is an importantfactor that is responsible forsignificant decreases in the yieldand quality of plants (Mahmood et al.,1999; Mohamed and Aly, 2004).
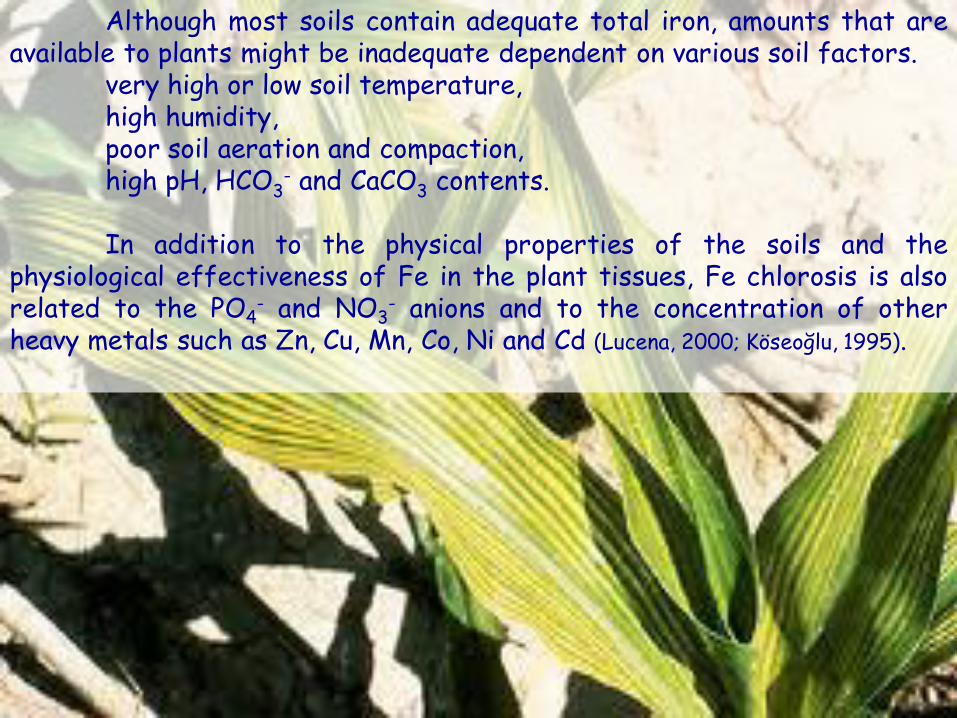
Although most soils contain adequate total iron, amounts that areavailable to plants might be inadequate dependent on various soil factors.
very high or low soil temperature,high humidity,poor soil aeration and compaction,high pH, HCO3
- and CaCO3 contents.
In addition to the physical properties of the soils and thephysiological effectiveness of Fe in the plant tissues, Fe chlorosis is alsorelated to the PO4
- and NO3- anions and to the concentration of other
heavy metals such as Zn, Cu, Mn, Co, Ni and Cd (Lucena, 2000; Köseoğlu, 1995).

Excess applications of K or increasing amounts of K releaseunder suitable soil conditions can inhibit the Fe uptake and may affectthe degree of Fe chlorosis.
Some recent studies showed that when the chlorosis symptomsoccurred, K contents of the plant were found high at this chloroticplant samples (Abadia et al., 1985; Dong, 1987; Köseoğlu, 1995; Belkhodja et al., 1998;Saatçi and Yağmur, 2000; Torres et al., 2006; Çelik and Katkat, 2007).

On the other hand Fe toxicity occurs in various rice-growingareas most frequently. This type of toxicity is especially frequent inheavy soils and is often associated with K deficiency (Tanaka et al.,1973).
When the K nutrition is inadequate, the capability of riceroots to oxidise Fe+2 to Fe+3 is impaired (Trolldenier 1973).
Increasing amounts of K reduce the Fe concentration in theleaves at least 2-fold and improve the plant growth (Li et al. 2001).
A large body of literature supports the ameliorative effectsof phosphorus, potassium and zinc fertiliser application under Fetoxic conditions (Becker and Asch, 2005).
Toxicity effects can be ameliorated or eliminated usingexcess K dressings that reduce the uptake of Fe+2 (Trolldenier, 1973;Tanaka et al., 1973; Li et al., 2001; Çakmak, 2005; Becker and Asch, 2005) .

The ameliorating effects of K may be attributed to theantagonistic effect of K on Fe absorption and translocation intothe shoots (Li et al., 2001).
Plants take K much more readily than Fe and that excessamounts of K inhibit the uptake and translocation of Fe in plants,leading to Fe deficiency (Urrestarazu et al. (1994).

This study was aimed to determine the interaction between K and Fe,
examine the effects of high amounts of K on the Fe uptake, and toshow if there is a response in the occurrence of Fe chlorosis.

Maize (Zea Mays L. cv. BSC 6661) seeds were germinated in a perlite mediumthat was moistened with half strength nutrient solution modified from Römheldand Marschner (1981), containing the following nutrients (in mM): Ca(NO3)2 , 2;K2SO4, 0.75; MgSO4, 0.65; KH2PO4, 0.5 and (in µM): KCl, 25; H3BO3, 10;FeEDDHA 10; MnSO4, 1; CuSO4 , 0.5; ZnSO4 , 0.5; (NH4)6Mo7O24 , 0.05 (Çelik etal., 2006 ).

The maize plants were transferred into re-circulated hydroponicsystems after ten days of preculture.

A hydroponic system consists of a solution tank that contains a 50-L volume of nutrient solution, a pump,

three channels parallel to each other. Each channel contained four plants.

Twenty different nutrient solutions composed of five K doses (1, 2, 4, 6 and 8 mM) and four Fe doses (30, 60, 90 and 120 µM) were administered to the plants in twenty hydroponic systems during the vegetation period.


Table 1. Nutrient elements, concentrations and their resources used in the experiment. Nutrient Resources K1(1 mM K) K2(2 mM K) K3(4 mM K) K4(6 mM K) K5(8 mM K) KH2PO4 1 mM - - - - K2HPO4 - 1 mM 1 mM 1 mM 1 mM KNO3 - - 2 mM 4 mM 6 mM Ca(NO3)2 2 mM 2 mM 2 mM 1mM - Ca(OH)2 - - - 1 mM 2 mM CaSO4.2H2O 1 mM 1 mM 1 mM 1 mM 1 mM MgSO4 .7H2O 1 mM 1 mM 1 mM 1 mM 1 mM MgO 1 mM 1 mM 1 mM 1 mM 1 mM NH4NO3 1mM 1mM - - -
H3BO3 10 µM 10 µM 10 µM 10 µM 10 µM MnSO4.4H2O 2 µM 2 µM 2 µM 2 µM 2 µM ZnSO4 .7H2O 2 µM 2 µM 2 µM 2 µM 2 µM CuSO4.5H2O 1 µM 1 µM 1 µM 1 µM 1 µM NaCl 0.1 µM 0.1 µM 0.1 µM 0.1 µM 0.1 µM (NH4)6Mo7O24 0.05 µM 0.05 µM 0.05 µM 0.05 µM 0.05 µM
Fe1 Fe2 Fe3 Fe4 FeEDDHA % 6 Fe 30 µM Fe 60µM Fe 90µM Fe 120µM Fe

pH of the nutrient solutions ranged between 6.93-8.06 and the E.C. values ranged between 982-1407µS cm-1 due to their nutrient contents. The nutrient solutions were renewed every 4-5 days.

According to the general appearance of the plant in theexperiment, the development of the maize plants was poor at thetime of the first dose of K and Fe. The plants were small andshowed both K deficiency and Fe chlorosis symptoms.

The increasing amounts of K and Fe further effected thedevelopment. The plants became taller and greener with the additionof increasing amounts of K and Fe.

As a result, the potassium deficiency symptoms disappeared. Theiron chlorosis symptoms were also fading due to the increasingamounts of Fe, but they did not completely vanish with thesubsequent K doses.

Maize plants were kept for 41 days, which was long enough forthe appearance of the effects of the treatments. The aerial parts ofthe plants were harvested on 41st day.

For the evaluation of nutrient uptake of the plants, the plantmaterials were washed once in tap water and then twice withdeionised water. After washing, the plant material was dried in aforced air oven at 70 C for 72 hours and ground. The ground plantsamples were digested using a mixture of 2 ml of HNO3 and 3 ml ofH2O2 in a microwave oven (Berghof MWS 2) (Wu et al., 1997).


Table 2: Effects of increasing amounts of potassium and iron on dry weight of maize leaves (g pot-1). Iron Doses, (Fe)
Fe1, 30µM Fe2, 60µM Fe3, 90µM Fe4, 120µM Means Potassium (K) Doses, mM Dry Weight, (g pot-1) K1, 1mM 16.79 b C 50.64 b B 81.70 b AB 86.49 c A 58.91 b K2, 2mM 30.89 b C 55.06 b BC 78.95 b B 121.18 ab A 71.52 b K3, 4mM 46.60 b C 95.53 a B 116.82 a AB 145.46 a A 101.08 a K4, 6mM 48.50 b C 93.40 a B 127.04 a A 143.67 a A 103.15 a K5, 8mM 83.10 a A 95.42 a A 83.77 b A 93.45 bc A 88.93 a Means 45.16 D 78.01 C 97.66 B 118.05 A FeLSD<0.01: 14.754 KLSD<0.01: 16.495 Fe*KLSD<0.01: 32.991 The differences between values indicated by different letters are significant. Capital letters indicate rows and small letters indicate columns.
Table 3: Effects of increasing amounts of potassium and iron on dry weight of maize roots (g pot-1). Iron Doses. (Fe)
Fe1, 30µM Fe2, 60µM Fe3, 90µM Fe4, 120µM Means Potassium (K) Doses. mM Dry Weight, (g pot-1) K1, 1mM 5.59 c B 11.75 b AB 19.86 c A 19.18 b A 14.10 b K2, 2mM 9.61 bc B 12.04 b B 24.85 bc A 30.24 a A 19.19 b K3, 4mM 15.77 b C 27.54 a B 32.14 ab AB 40.21 a A 28.91 a K4, 6mM 12.53 bc C 26.98 a B 38.82 a A 40.74 a A 29.77 a K5, 8mM 25.15 a B 29.05 a AB 29.02 b AB 35.65 a A 29.72 a Means 13.73 C 21.47 B 28.94 A 33.20 A FeLSD<0.01: 4.901 KLSD<0.01: 5.479 Fe*KLSD<0.05: 8.188 The differences between values indicated by different letters are significant. Capital letters indicate rows and small letters indicate columns.

Table 4: Effects of increasing amounts of potassium and iron on SPAD readings of maize leaves. Iron Doses, (Fe)
Fe1, 30µM Fe2, 60µM Fe3, 90µM Fe4, 120µM Means Potassium (K) Doses, mM SPAD Values K1, 1mM 8.43 b C 18.60 c B 29.83 bc A 32.53 ab A 22.50 c K2, 2mM 9.53 ab C 19.20 bc B 31.57 b A 33.83 a A 23.53 c K3, 4mM 12.53 a C 24.27 ab B 31.43 b A 33.73 a A 25.49 b K4, 6mM 12.67 a C 25.50 a B 35.80 a A 35.47 a A 27.36 a K5, 8mM 11.43 ab C 21.97 bc B 27.53 c A 30.27 b A 22.80 c Means 10.92 D 21.91 C 31.23 B 33.17 A FeLSD<0.01: 1.467 KLSD<0.01: 1.640 Fe*KLSD<0.01: 3.280 The differences between values indicated by different letters are significant. Capital letters indicate rows and small letters indicate columns.
SPAD Value MeasurementsA portable chlorophyll meter (SPAD-502, Minolta Camera Co.,
Osaka, Japan) was used to measure the leaf chlorophyll content at20, 27, 34 days after the transfer and at the time of harvest(Cordeiro et al., 1995). The upper most fully expanded leaf was selectedfrom each plant to measure and record the SPAD values. Three SPADreadings were taken around the midpoint of each leaf. Twelve SPADreadings were averaged to give the mean SPAD value of each channel.

Fe, ICP-OES (PerkinElmer Optima 2100 DV) (Isaacand Johnson, 1998).
Active Fe
In the dry plant parts by incubating for 24 h in 1 NHCl extraction solution (1:10) using the method ofOserkowsky (1933), modified by Llorente et al.(1976). The resultant amounts were measured byICP-OES.
KFlame emission (Eppendorf Elex 6361) (Horneckand Hanson 1998).

Table 5: Effects of increasing amounts of potassium and iron on potassium concentrations of maize shoots. Iron Doses, (Fe)
Fe1, 30µM Fe2, 60µM Fe3, 90µM Fe4, 120µM Means Potassium (K) Doses, mM Potassium Concentrations, % K1, 1mM 5.82 c A 3.01 d B 1.78 d C 1.77 d C 3.10 e K2, 2mM 7.88 b A 4.16 c B 3.41 c B 2.58 c C 4.51 d K3, 4mM 8.90 a A 5.12 b B 3.94 c C 3.92 b C 5.47 c K4, 6mM 8.23 ab A 6.27 a B 5.66 b B 4.51 b C 6.17 b K5, 8mM 7.51 b A 6.96 a AB 7.39 a AB 6.67 a B 7.13 a Means 7.67 A 5.11 B 4.44 C 3.89 D FeLSD<0.01: 0.336 KLSD<0.01: 0.376 Fe*KLSD<0.01: 0.752
Table 6: Effects of increasing amounts of potassium and iron on potassium concentrations of maize roots. Iron Doses, (Fe)
Fe1, 30µM Fe2, 60µM Fe3, 90µM Fe4, 120µM Means Potassium (K) Doses, mM Potassium Concentrations, % K1, 1mM 2.79 d A 1.46 d B 1.10 e B 1.09 d B 1.61 e K2, 2mM 4.41 c A 2.38 c B 1.91 d BC 1.41 d C 2.53 d K3, 4mM 5.80 b A 3.58 b B 3.54 c B 2.43 c C 3.84 c K4, 6mM 6.82 a A 5.73 a B 4.25 b C 4.08 b C 5.22 b K5, 8mM 7.08 a A 5.59 a B 6.99 a A 6.69 a A 6.59 a Means 5.38 A 3.75 B 3.56 B 3.14 C FeLSD<0.01: 0.272 KLSD<0.01: 0.304 Fe*KLSD<0.01: 0.607 The differences between values indicated by different letters are significant. Capital letters indicate rows and small letters indicate columns.

Table 7: Effects of increasing amounts of potassium and iron on potassium uptake by maize shoots (mg tdw-1). Iron Doses, (Fe)
Fe1, 30µM Fe2, 60µM Fe3, 90µM Fe4, 120µM Means Potassium (K) Doses, mM Potassium Uptake, mg tdw-1 K1, 1mM 974.63 d A 1524.66 c A 1476.46 d A 1670.72 c A 1411.62 d K2, 2mM 2423.91 c A 2285.73 c A 2669.98 c A 3115.75 b A 2623.84 c K3, 4mM 4100.45 b B 4892.27 b AB 4600.06 b AB 5687.70 a A 4820.12 b K4, 6mM 3983.82 b C 5837.39 ab B 7123.46 a A 6488.24 a AB 5858.23 a K5, 8mM 6252.97 a A 6636.34 a A 6197.07 a A 6119.18 a A 6301.39 a Means 3547.16 B 4235.28 AB 4413.41 A 4616.32 A FeLSD<0.01: 712.575 KLSD<0.01: 796.684 Fe*KLSD<0.05: 1190.593
Table 8: Effects of increasing amounts of potassium and iron on potassium uptake by maize roots (mg tdw-1). Iron Doses, (Fe)
Fe1, 30µM Fe2, 60µM Fe3, 90µM Fe4, 120µM Means Potassium (K) Doses, mM Potassium Uptake, mg tdw-1 K1, 1mM 156.61 c A 172.41 c A 220.63 c A 209.30 d A 189.74 d K2, 2mM 420.58 c A 286.62 c A 476.38 c A 429.72 d A 403.33 d K3, 4mM 919.06 b A 985.15 b A 1140.73 b A 978.78 c A 1005.93 c K4, 6mM 860.07 b B 1532.25 a A 1641.08 a A 1659.83 b A 1423.31 b K5, 8mM 1771.81 a BC 1619.67 a C 2033.23 a AB 2385.37 a A 1952.52 a Means 825.63 B 919.22 AB 1102.41 A 1132.60 A FeLSD<0.01: 239.922 KLSD<0.01: 268.241 Fe*KLSD<0.05:400.869 The differences between values indicated by different letters are significant. Capital letters indicate rows and small letters indicate columns.

Table 9: Effects of increasing amounts of potassium and iron on iron concentrations of maize shoots. Iron Doses, (Fe)
Fe1, 30µM Fe2, 60µM Fe3, 90µM Fe4, 120µM Means Potassium (K) Doses, mM Iron Concentrations, mg kg-1 K1, 1mM 33.39 a B 37.73 ab AB 33.13 b B 44.95 a A 37.30 b K2, 2mM 27.22 ab A 27.23 c A 30.59 b A 33.41 b A 29.61 c K3, 4mM 24.07 b B 32.13 bc A 34.38 b A 34.68 b A 31.32 c K4, 6mM 21.34 b C 30.39 bc B 33.78 b B 47.31 a A 33.21 c K5, 8mM 32.73 a B 44.22 a A 44.26 a A 44.71 a A 41.48 a Means 27.75 C 34.34 B 35.23 B 41.01 A FeLSD<0.01: 3.604 KLSD<0.01: 4.030 Fe*KLSD<0.01: 8.059
Table 10: Effects of increasing amounts of potassium and iron on iron concentrations of maize roots. Iron Doses, (Fe)
Fe1, 30µM Fe2, 60µM Fe3, 90µM Fe4, 120µM Means Potassium (K) Doses, mM Iron Concentrations, mg kg-1 K1, 1mM 933.77 1334.33 1831.33 1724.33 1455.94 a K2, 2mM 830.07 1086.73 1212.33 1180.03 1077.29 b K3, 4mM 593.47 626.10 1086.97 1353.67 915.05 bc K4, 6mM 451.03 794.13 1268.13 1180.73 923.51 bc K5, 8mM 435.10 888.63 907.03 896.03 781.70 c Means 648.69 C 945.99 B 1261.16 A 1266.96 A FeLSD<0.01: 212.273 KLSD<0.01: 237.328 Fe*K: ns The differences between values indicated by different letters are significant. Capital letters indicate rows and small letters indicate columns.

Table 11: Effects of increasing amounts of potassium and iron on iron uptake by shoots (mg tdw-1). Iron Doses, (Fe)
Fe1, 30µM Fe2, 60µM Fe3, 90µM Fe4, 120µM Means Potassium (K) Doses, mM Iron Uptake, mg tdw-1 K1, 1mM 0.56 b C 1.91 bc BC 2.70 bc AB 3.89 b A 2.27 b K2, 2mM 0.84 b C 1.49 c BC 2.42 c B 4.05 b A 2.20 b K3, 4mM 1.13 b C 3.07 ab B 4.00 ab AB 5.05 b A 3.31 a K4, 6mM 1.04 b D 2.83 abc C 4.28 a B 6.80 a A 3.74 a K5, 8mM 2.73 a B 4.22 a A 3.77 abc AB 4.16 b A 3.72 a Means 1.26 D 2.70 C 3.43 B 4.79 A FeLSD<0.01: 0.638 KLSD<0.01: 0.713 Fe*KLSD<0.01: 1.426
Table 12: Effects of increasing amounts of potassium and iron on iron uptake of maize roots (mg tdw-1). Iron Doses, (Fe)
Fe1, 30µM Fe2, 60µM Fe3, 90µM Fe4, 120µM Means Potassium (K) Doses, mM Iron Uptake, mg tdw-1 K1, 1mM 5.22 a B 15.54 ab B 35.98 ab A 33.04 c A 22.45 c K2, 2mM 7.93 a B 12.92 b B 29.69 b A 35.71 bc A 21.56 c K3, 4mM 9.94 a C 17.31 ab C 35.25 ab B 53.88 a A 29.10 ab K4, 6mM 5.75 a C 20.99 ab B 48.33 a A 48.48 ab A 30.89 a K5, 8mM 11.23 a B 26.01 a A 26.41 b A 32.35 c A 24.00 bc Means 8.02 C 18.55 B 35.13 A 40.69 A FeLSD<0.01: 7.829 KLSD<0.01: 6.541 Fe*KLSD<0.01: 13.081 The differences between values indicated by different letters are significant. Capital letters indicate rows and small letters indicate columns. tdw: total dry weight

Table 13: Effects of increasing amounts of potassium and iron on active iron concentrations of maize shoots. Iron Doses, (Fe)
Fe1, 30µM Fe2, 60µM Fe3, 90µM Fe4, 120µM Means Potassium (K) Doses, mM Active Iron Concentrations, mg kg-1 K1, 1mM 13.30 ab B 22.52 ab B 24.68 c B 27.12 b A 21.91 b K2, 2mM 20.06 a A 24.37 ab A 26.11 bc A 24.41 b A 23.74 b K3, 4mM 11.64 b C 20.29 b B 34.38 a A 27.30 b AB 23.40 b K4, 6mM 18.76 a C 22.47 ab C 32.97 ab B 42.01 a A 29.05 a K5, 8mM 18.28 ab B 28.65 a AB 22.06 c B 29.01 b A 24.50 b Means 16.41 C 23.66 B 28.04 A 29.97 A FeLSD<0.01: 3.180 KLSD<0.01: 3.555 Fe*KLSD<0.01: 7.110
Table 14: Effects of increasing amounts of potassium and iron on active iron uptake by shoots (mg tdw-1). Iron Doses, (Fe)
Fe1, 30µM Fe2, 60µM Fe3, 90µM Fe4, 120µM Means Potassium (K) Doses, mM Active Iron Uptake, mg tdw-1 K1, 1mM 0.23 a B 1.14 b AB 2.01 b A 2.35 c A 1.43 d K2, 2mM 0.62 a C 1.34 b BC 2.07 b AB 2.96 bc A 1.75 cd K3, 4mM 0.55 a C 1.93 ab B 4.11 a A 3.97 b A 2.64 ab K4, 6mM 0.91 a C 2.10 ab C 4.20 a B 6.02 a A 3.31 a K5, 8mM 1.53 a A 2.73 a A 1.85 b A 2.73 bc A 2.21 bc Means 0.77 D 1.85 C 2.85 B 3.61 A FeLSD<0.01: 0.602 KLSD<0.01: 0.673 Fe*KLSD<0.01: 1.346 The differences between values indicated by different letters are significant. Capital letters indicate rows and small letters indicate columns. tdw: total dry weight

DISCUSSION
Potassium (K) is unique among the essential nutrients, given thediversity of roles it plays in plant metabolic processes (Pervez et al. 2006).Numerous solution culture methods and pot experiments with K-freesubstrates have shown that plants do not grow without K. As soon asthe potassium reserves of the seed are exhausted, the plants die away(Mengel, 2007).
According to the physical appearance of the plants in ourresearch, neither the first dose of K, nor the application of additiveFe was sufficient for the healthy development of the maize plants andconfirms the findings of Mengel (2007).
We observed that the elevated concentrations of K hadpositive effects on the plant growth, however excess amounts of K atK5 level, depressed the plants growth, dry matter yield, SPAD valuesand Fe amounts of maize.
Various researchers have confirmed the direct effect of K onplant growth and development. In a pot experiment comprising gradeddoses of K and Fe, Sahu and Mitra (1992) reported that the drymatter yield of rice increased with increasing doses of K. Cheema et al.(1999) also reported that K application improved maize yield but thehighest level found uneconomical.

Potassium has an impact on the uptake of other cationicspecies and thus may affect the crop yield and the crop quality (Mengel,2007). K interacts with almost all of the essential macronutrients, thesecondary nutrients and the micronutrients (Pervez et al. 2006).
Our results also confirm this interaction with Fe. Sahu and Mitra(1992) observed that although the uptake of K increased withincreasing K doses, the ratio of Fe/K continued to decrease indicatingthat K has an antagonistic effect on Fe uptake. Potassium is absorbedrapidly, and this causes competition for the uptake of other cations(Demiral and Köseoğlu, 2005).
Demiral and Köseoğlu (2005) also reported that the application ofincreasing amounts of K lowered the Fe content of the Galia melon fromthat of a control.

If K is present in a relatively high concentration, it affects theuptake of other cations such as Na+, Mg+2 and Ca+2. If K is notpresent in the nutrient solution, the other cationic species aretaken up at higher rates (Mengel, 2007).
This situation clarifies the high contents of Fe at K1 level in bothleaves and roots of maize. The response mentioned above wasmuch more evident at the roots and tend to decrease withincreasing amounts of K dealing with the antagonistic effect. Highamounts of Fe in the roots are also the evidence that Fe mayaccumulate in the roots.

Table 9: Effects of increasing amounts of potassium and iron on iron concentrations of maize shoots. Iron Doses, (Fe)
Fe1, 30µM Fe2, 60µM Fe3, 90µM Fe4, 120µM Means Potassium (K) Doses, mM Iron Concentrations, mg kg-1 K1, 1mM 33.39 a B 37.73 ab AB 33.13 b B 44.95 a A 37.30 b K2, 2mM 27.22 ab A 27.23 c A 30.59 b A 33.41 b A 29.61 c K3, 4mM 24.07 b B 32.13 bc A 34.38 b A 34.68 b A 31.32 c K4, 6mM 21.34 b C 30.39 bc B 33.78 b B 47.31 a A 33.21 c K5, 8mM 32.73 a B 44.22 a A 44.26 a A 44.71 a A 41.48 a Means 27.75 C 34.34 B 35.23 B 41.01 A FeLSD<0.01: 3.604 KLSD<0.01: 4.030 Fe*KLSD<0.01: 8.059
Table 10: Effects of increasing amounts of potassium and iron on iron concentrations of maize roots. Iron Doses, (Fe)
Fe1, 30µM Fe2, 60µM Fe3, 90µM Fe4, 120µM Means Potassium (K) Doses, mM Iron Concentrations, mg kg-1 K1, 1mM 933.77 1334.33 1831.33 1724.33 1455.94 a K2, 2mM 830.07 1086.73 1212.33 1180.03 1077.29 b K3, 4mM 593.47 626.10 1086.97 1353.67 915.05 bc K4, 6mM 451.03 794.13 1268.13 1180.73 923.51 bc K5, 8mM 435.10 888.63 907.03 896.03 781.70 c Means 648.69 C 945.99 B 1261.16 A 1266.96 A FeLSD<0.01: 212.273 KLSD<0.01: 237.328 Fe*K: ns The differences between values indicated by different letters are significant. Capital letters indicate rows and small letters indicate columns.

CONCLUSIONS
1. Deficiency of K and Fe caused poor development and chlorosissymptoms in the maize plant,
2. Their increased amounts stimulated the plant growth andenhanced dry matter yield.
3. The highest doses had a negative effect and decreased the plantgrowth and other parameters.
4. The highest dose of potassium not only lowered the potassiumamounts in the plant but also decreased the total and active ironconcentrations in the leaves and roots of maize.
5. Thus adequate K is also required for the efficient use of Fe.However, too high a concentration of K will cause competitionwith iron and other cations.
6. To observe the competition between these nutrients and showtheir effects on yield, further researches should be done onvarious field conditions.

Thank You