Embed Size (px)
Citation preview

http://www.diva-portal.org
Postprint
This is the accepted version of a paper published in Journal of Development Effectiveness. This paper hasbeen peer-reviewed but does not include the final publisher proof-corrections or journal pagination.
Citation for the original published paper (version of record):
Beck, S., Pulkki-Brännström, A., San Sebastián, M. (2015)
Basic income – healthy outcome? Effects on health of an Indian basic income pilot project: a
cluster randomised trial.
Journal of Development Effectiveness, 7(1): 111-126
http://dx.doi.org/10.1080/19439342.2014.974200
Access to the published version may require subscription.
N.B. When citing this work, cite the original published paper.
Permanent link to this version:http://urn.kb.se/resolve?urn=urn:nbn:se:umu:diva-98655

[This is the authors' version of the published article: Beck, S., Pulkki-Brännström, A-
M. & San Sebastián, M. (2015). Basic income – healthy outcome? Effects on health
of an Indian basic income pilot project: a cluster randomised trial. Journal of
Development Effectiveness, 7:1, 111-126. DOI:10.1080/19439342.2014.974200. Please
use this reference when citing the article.]
Basic income – healthy outcome?Effects on health of an Indian basic income pilot project: a cluster randomised trial
Simon Beck1
Anni-Maria Pulkki-Brännström2
Miguel San Sebastián3
1 Corresponding author. Epidemiology and Global Health, Umeå University, SE-901 87 Umeå, Sweden.Email: [email protected]. Tel: +46 761485205.
2 Epidemiology and Global Health, Umeå University, SE-901 87 Umeå, Sweden. Email: [email protected]. Tel: +46 907851213.
3 Epidemiology and Global Health, Umeå University, SE-901 87 Umeå, Sweden. Email: [email protected]. Tel: +46 907851209.

Abstract
This article evaluates the effects on health of a basic income (BI) pilot project in
Madhya Pradesh, India, between 2011 and 2012. BI can be defined as a non-
contributory, universal, and unconditional cash transfer paid out on an individual
basis. The project was conducted as a cluster randomised trial involving 2034
households. Three health outcomes were examined: minor illnesses and injuries,
illness and injuries requiring hospitalisation, and child vaccination coverage. The
data was analysed with multiple imputation, propensity score matching, and
weighted logistic regression. BI was seen to significantly reduce the odds of minor
illnesses and injuries by 46 per cent. No effect was seen on more serious illnesses and
injuries, at least not in the time scale given, nor on child vaccination coverage which
was already exceptionally high. Policy makers are encouraged to consider BI as an
equitable policy of social protection, though further research on its impact on health
is desirable.
Keywords: basic income; cash transfer; social protection; cluster randomised trial; propensity
score.
ii

1. Introduction
1.1. Social determinants of health
The social determinants of health provide a framework with which it can be
explained how some individuals and societies attain satisfactory levels of health
while others do not. The health divide between acceptable and unacceptable health,
both within and between societies, is huge, and neither random chance nor
individual factors alone are sufficient to explain it. Health follows a social gradient
whereby socio-economic status and health are directly linked in an almost linear
relation (CSDH 2008; Burns 2012; Marmot Review 2010; MTFHI 2008). Differences in
population health are systemic. They are structurally driven by social and economic
policies, national and global, that create and influence the conditions in which people
live their lives. Consequently, detrimental daily living conditions, and the resultant ill
health, are seen to be unavoidable. Being unavoidable, they are unjust (CSDH 2008).
From a social determinants of health perspective, the goal of health equity through
social justice is therefore central (Marmot Review 2010).
Social protection, that is, the provision of services such as cash transfers, education,
minimum labour standards, and healthcare (CSDH 2008), is a means to social justice
in fulfilling the human right to an adequate standard of living (article 25(a), UN
1948). It also brings better health. It has been seen, in a high income country context,
that countries with more comprehensive social protection policies do better in
comparisons of health indicators. This is not least true with regard to income
protection - the provision of income security to individuals at times in their lives
when they are most in need and vulnerable (Lundberg et al. 2007). Since vulnerability
can occur and does occur at any stage of life (due to young age or old age,
responsibilities of caring for family members, disability, illness, or sudden loss of
earned income), access to social protection is a necessary requirement throughout the
1

course of life (CSDH 2008).
1.2. Basic income
A basic income (BI) can be defined as a regular income given unconditionally,
universally, and individually, paid out by a political establishment. It is unconditional
in not requiring labour in exchange nor being means tested, and is universal and
individual in that it is paid to every single member of society (van Parijs 2003). BI is
not necessarily enough to cover all basic needs but for most supporters of BI, the
ideal is that it would. As a result, much of the existing benefits, transfers, and tax
reductions could be replaced or simplified (Birnbaum 2013). BI, or variations thereof,
have been repeatedly suggested by a number of notable thinkers throughout the last
few centuries as a model of social and economic reform. Today, BI is once more
gaining influential ground and is the focus of a wide international grassroots
movement, partly driven by the desire to see realised an alternative to extensive
public spending cuts and austerity measures, which increasingly jeopardise social
inclusion. In Europe, support for the implementation of a BI at both national level
and across the whole union is strong, with campaigns and petitions collecting tens of
thousands of signatures (Forget, Peden, and Strobel 2013).
Basic income rests firmly on ideas of social justice according to Birnbaum (2013), both
from the standpoint of equal opportunities and of social and political equality. The
unequal distribution of opportunities in the world can be seen to be based more on
circumstance, chance or luck (being born into a certain family, class, society and
country) than individual characteristics of inclination toward work and effort. BI is a
way to offset this unfair randomness and encourage equal opportunities. Social and
political equality, it is hoped, would be fostered through economic security, a base on
which self-respect may grow. Having security, individuals may more easily remove
2

themselves from unfair power relations or authoritarian structures, thus challenging
roles of subservience and dominance, and promoting equality in social relations.
People would be able to participate in society and express themselves freely without
undue humility.
BI has only been tested on a limited scale so evidence of its effectiveness is lacking.
More generally however, cash transfer (CT) programmes, of which BI can be
considered a type, have in the past two decades increasingly been used in low and
middle income countries with promising results. A growing body of evidence
highlights successes in tackling poverty (Fiszbein and Schady 2009; Barrientos and
DeJong 2006; Barrientos and Lloyd-Sherlock 2003), improving outcomes of health,
nutrition, child development, and education (Ranganathan and Lagarde 2012;
Robertson et al., 2013 Fernald, Gertler, and Neufeld 2008; Kenya CT-OVC Evaluation
Team 2012; Baird, McIntosh, and Özler 2011), and stimulating local enterprise and
economy (Covarrubias, Davis, and Winters 2012; Haushofer and Shapiro 2013;
Yablonski and O'Donnel 2009; DeMel, McKenzie, and Woodruff 2008). It seems
plausible then that BI could also lead to beneficial outcomes.
CT programmes vary considerably in design, and many arguments for and against
various aspects of design have been discussed. Two aspects, featuring most
prominently in debates on the matter, and of particular importance to BI, are
targeting and conditionality. Most CTs aim to target the poor, or a subset of the poor,
but may be either conditional (CCT) or unconditional (UCT), where conditionality
can be defined as behavioural requirements placed on the recipient in order to
receive the cash (Forget, Peden, and Strobel 2013). BI, on the other hand, is
specifically non-targeted (that is, universal) and unconditional. A main reason for
non-targeting is to reduce costs for both provider and recipient. As explained by
3

Samson (2009), administrative costs of means assessment and continual reassessment
are removed; recipients' costs in time and money are less when there is no need to fill
in paperwork, travel to and from government offices, and spend time in queues;
social costs of stigma are avoided since a targeted approach may actually reinforce
marginalisation. Another reason for non-targeting is that it is free of the potential
poverty or unemployment trap of means-tested benefit programmes, whereby it is
not economically advantageous to take low-paid employment and risk losing the
benefit (van Parijs 2003). Targeting relies on a defined poverty-line which is always
arbitrary to some degree, leading unavoidably to inclusion and exclusion errors, and
those at risk of falling into poverty are not protected. Non-targeting circumvents
these issues and works preventively (Standing 2012). Lastly, non-targeting may be
politically strategic if a social protection programme is to be sustainable in the long
term: in including not only the poor but all of a society, the support of a broader
majority can be expected (Samson 2009).
The case for unconditionality relates closely to ideas of social justice: the poor know
best what their needs are and can prioritise and allocate funds as they themselves see
fit (Hulme, Hanlon, and Barrientos 2010), thus promoting social equality. Conditions
on the other hand, paternalistic by definition (Standing 2012), reinforce social roles of
inferiority. Unconditionality is also more in line with a rights based approach to
social protection (Forget, Peden, and Strobel 2013); indeed, the right to an adequate
standard of living, cited above, is unconditional and applies to all. When conditions
are enforced, recipients who do not fulfil them are denied transfers. Often these are
those most in need and vulnerable, defeating the very purpose of poverty reduction
(Samson 2009). Since they focus on behaviour, conditions can be seen to apportion
blame on the poor for their predicament (Hulme, Hanlon, and Barrientos 2010), and
while there certainly exists association between poverty and many types of harmful
4

behaviour (Forget, Peden, and Strobel 2013), poverty is less dependent on behaviour
than on the structural factors that lie behind it (Samson 2009). In addition,
conditional programmes can be expensive and inefficient with regard to compliance
monitoring (Standing 2012; Samson 2009) and introduce the risk of corruption (which
has been documented) when administrators have considerable powers in assessing
whether conditions are met (Hulme, Hanlon, and Barrientos 2010).
1.3. The Indian context
India has seen high economic growth in the last six decades, with gross domestic
product (GDP) growing annually by 6.9 per cent in the last two. Concurrently,
income per capita has increased fivefold, poverty has declined along with infant
mortality, life expectancy has risen and educational status improved. In spite of this,
poverty levels are still incredibly high (42% of the total Indian population measured
with a poverty line of US$ 1.25/day, or 75% with US$ 2/day, in 2005), and education
and skills levels generally low. Nutritional status, in particular among children and
women, is poor, and inequalities between regions, and groups and classes in society
are wide. Considering the economic growth rate, improvements seen in human
development have taken place painstakingly slowly (Srivastava 2013). In not utilising
its powers of redistribution to accelerate poverty reduction and human development,
the Indian government is under criticism (Drèze and Sen 2013; Kohli 2012).
The workforce in India is made up of a predominant informal sector (mostly in
agriculture) and a smaller formal sector. A high degree of informality means that
social protection for workers is low and providing it difficult (Srivastava 2013); in this
context, contributory social insurance schemes are not applicable (Standing 2012).
India does have numerous social protection programmes, however, covering a wide
scope: health, education, housing, employment security, and food security (Srivastava
5

2013), but they have not had the impact on poverty reduction as hoped. Programmes
have been riddled with problems, such as frequent redesign and adjustment, poor
implementation, lack of flexibility in meeting recipients varying needs, and limited
coherence between programmes (World Bank 2010). In order to evaluate the potential
of BI as a complementary form of social protection and in reducing poverty, a BI pilot
project was conducted in rural India between 2011 and 2012. Using data collected
from the project, the present study aims to examine the effect on health outcomes of
BI.
6

2. Methods
2.1. Design
The BI pilot project was conducted by SEWA (Self Employed Women's Association,
an Indian trade union that represents poor women in self employment) and funded
by UNICEF. The project was carried out in the Indore district of the state of Madhya
Pradesh, India, where SEWA is active. A cluster random sampling design was
adopted with villages as primary sampling units and households secondary (SEWA
2013). The sample size was calculated based on the formula given by Kelsey,
Whittemore, Evans and Thompson (1996) and multiplied by a design effect of 2.5.
This design effect was chosen so as to be on the safe side considering the lack of
information about the intra-cluster correlation. Assuming a 95 per cent significant
level, 80 per cent power, and a 10 per cent reduction in health outcome (50%
prevalence in the intervention group), 389 households per group were required.
Considering also a five per cent loss to follow-up, a total sample of 2042 households
was obtained. Eight villages randomly selected as intervention and 12 villages as
control gave a total of 2034 households. In total, 11,688 individuals were involved. All
villagers from the intervention villages received a monthly BI, while no one in the
control villages did (SEWA 2013).
The intervention lasted 12 months, from June 2011 to May 2012. During this time,
every adult received 200 Indian rupees (INR) per month and every child below 18
years of age 100 INR per month. Money for the children was transferred to the
mother. The amounts were calculated to equal approximately 25-30 per cent of a poor
family's income: a supplement large enough to assist in covering basic needs and
improve living standards although not enough to provide total security (Davala,
Jhabvala, Kapoor, and Standing 2014). Cash was paid to a bank account and
assistance given to those who needed in opening one. During the first three months
7

some transfers were given cash-in-hand, until such time that everyone had a personal
account. No instructions or recommendations on what to spend the money were
given, nor were any conditions imposed. Only individuals actually residing in the
villages were included. Those who moved into the intervention villages after start
were not included, although babies born during the project period were. Those who
permanently left their village of residence were excluded (SEWA 2013).
Surveys were carried out at three different times: before the start of intervention
(baseline survey – BLS); approximately eight months into the intervention (interim
evaluation survey – IES); and after the end of the intervention (final evaluation
survey – FES). The surveys contained questions on a wide range of issues: health,
sanitation, schooling, labour, financial inclusion, income and expenditure,
obligations, organisational involvement, and attitudes on social protection in India.
The surveys were conducted at household level, but individual data for some
variables were also collected (SEWA 2013). The BLS was carried out by a contracted
third party which unfortunately led to unsatisfactory results. Lack of formal training
and supervision of the enumerators led to missing values in the data as well as the
misplacement of approximately 25 per cent of the filled-in questionnaires.
Subsequent surveys were carried out more stringently, organised by researchers
within the project, and the enumerators were given proper training (Davala, Jhabvala,
Kapoor, and Standing 2014). Two respondents for each household, one female and
one male, were interviewed together when answering the survey (Standing 2013).
Ethical considerations were discussed at a series of workshops during the year prior
to the launch of the project. Discussions focused on informed consent, the ethics of
the project design, and appropriate exit strategy. In addition to UNICEF and SEWA,
external organisations present at these workshops included: Department for
8

International Development (DFID), World Bank, Planning Commission of India,
National Advisory Council of India, and Ministry of Finance. Informed consent was
collected in a number of steps: while still in the planning stages of the project,
meetings were held in the villages to assess support for the idea; just prior to the
project's implementation, so called 'awareness days' were held in each village, during
which details were explained and questions answered; and finally, before answering
surveys, respondents were informed of their freedom to participate or not (Davala,
Jhabvala, Kapoor, and Standing 2014). Trials should only be conducted where there
exists a state of equipoise, that is, inconclusive knowledge about the benefits and
risks of a treatment (Aschengrau and Seage 2014). While there exists evidence of the
beneficial effects of cash transfers schemes, concerns remain about unexpected
harmful consequences, such as reducing labour market participation, increasing the
consumption of bads, or increasing intimate partner violence. Therefore the design of
giving money to some and withholding from others was considered ethically
acceptable. Villagers had been made aware that the money would stop after one year,
but most wanted to proceed anyway. In actual fact, more money became available at
the end of the project year and payments continued for another five months. SEWA
made a commitment to increase its efforts in the project villages where it was already
established and to enter into and start providing support in all other project villages
post-intervention. Follow-up focus group discussions were held to assess how
villagers felt about the project in retrospect and how they were coping after it had
ended (Davala, Jhabvala, Kapoor, and Standing 2014). The present authors were not
involved in the project.
2.2. Data
Data from both BLS and FES were used, but due to the BLS dataset being incomplete
the majority of covariates were taken from FES. For clarity, the few covariates from
9

BLS are here labelled so.
Three dichotomous health outcome variables were created from the FES dataset: any
case or cases of illness or injury in the household that lasted more than 24 hours and
needed treatment but not hospitalisation in the preceding three months; any case or
cases of illness or injury in the household that required hospitalisation in the
preceding twelve months; and complete child vaccination coverage, that is, whether
all children in the household between the age of six months and five years had been
vaccinated, receiving all vaccination doses, against bacillus calmittee guerin (BCG),
diphtheria, pertussis, and tetanus (DPT), oral polio, and measles, mumps, and
rubella (MMR). Immunisation cards were checked when there was uncertainty. These
variables are hereafter named illness/injury, hospitalisation and complete child
vaccination coverage respectively.
Covariates were related to either general demographics, income, or health. General
demographic covariates (all from FES) included: gender of household head, education
level of household head, number of household members, adults over fifty, children under
fifteen, children under five, caste, and religion. The first two were considered suitable
measures of gender and education level respectively for household level analysis.
Education level comprised four categories: none/pre-primary, primary, secondary,
and university/vocational. Number of household members represented the number of
individuals living in the household. Adults over fifty, children under fifteen, and children
under five represented the number of individuals in the household in each respective
age category. Caste comprised four categories: scheduled tribe, scheduled caste, other
backward class (OBC), and general, which are the official categories used by public
authorities in India. Religion referred to the main religion in the household, and in
this trial amounted to only two categories: hindu and muslim.
10

Variables of income from FES included: household monetary income, income sufficient for
food needs, income sufficient for other needs, other financial assistance, possession of above
poverty line (APL) ration card, possession of below poverty line (BPL) ration card, possession
of antyodaya anna yogana (AAY) ration card, and income sharing. Household monetary
income was the total amount of money in Indian Rupees (INR) the household
received from all sources in the preceding calendar month, grouped into six
categories: <1000, 1000<2000, 2000<5000, 5000<10,000, ≥10,000, and not known. The
two variables on income sufficiency were subjective measures of whether the
previous month's income was firstly, sufficient for food needs and secondly, sufficient
for other needs such as clothing, housing, and healthcare after food had been bought.
Other financial assistance referred to whether households received financial assistance
from local authorities, religious bodies or non-governmental organisations (NGO).
Ration card possession was represented by three separate variables since it is possible
to own more than one type. Those eligible for AAY (for those most poor) can also
possess the more general BPL (below poverty line). Income sharing, also a subjective
measure, represented whether income was shared equally or if one or more members
received and spent more than others. Since the intervention itself was a manipulation
of income, and because income sufficiency may be subject to seasonal variations,
income variables from baseline were also included: household monetary income (BLS),
income sufficient for food needs (BLS), and income sufficient for other needs (BLS). These
were identical in description to the similarly named variables from FES.
Health covariates (all from BLS) included: illness/injury (BLS), hospitalisation (BLS),
disability (BLS), and chronic illness (BLS). The first two were identical in description to
the similarly named health outcome variables described above with the exception
that illness/injury (BLS) had as its time period of reference the previous one month,
not three. Disability and chronic illness represented respectively any case or cases in
11

the household of disability or chronic illness that interferes with activities of daily
living.
2.3. Analysis
The data were analysed with STATA version 12. Cross-tabulation and chi-square tests
were performed on all covariates against the study arm variable to check for
association and balance of distribution between the arms. Since the BLS dataset was
incomplete, which could lead to biased results particularly if confounding variables
have missing data, multiple imputation was carried out. Multiple imputation is a
method of estimating and filling in missing values of multiple variables in a dataset,
and which preserves the correlations between these variables (de Waal, Pannekoek,
and Scholtus 2011). Five sets of imputed BLS variables were created and the resulting
distributions of these covariates compared with the distributions in the original
dataset.
To minimise potential bias due to imbalance in distributions of covariates between
study arms (a consequence of cluster randomisation), propensity score matching
(PSM) was performed. In this analysis, intervention cases are matched to control
cases by way of their propensity score such that they share similar values on all
covariates, and differ only with respect to study arm variable, thus effectively
mimicking a randomised control trial (Oakes and Johnson 2006). Propensity scores
were calculated for all five imputed datasets, using mutivariable logistic regression
on all covariates (except religion, since there were only two Muslim households in the
intervention group). Average propensity scores from the propensity scores of each
dataset were then calculated. Termed the across approach of calculating propensity
scores with multiply imputed datasets, this was found to be the preferred method in
a statistical simulation study by Mitra and Reiter (2012). The distributions of
12

propensity scores between the study arms were assessed to check matching
suitability. Matching was done with a specified caliper of 0.01, meaning that matched
pairs would not differ by more than 0.01 in propensity score (a value between zero
and one). Replacement of controls was allowed, therefore some control cases were
used more than once in matching. Each case was assigned a weight according to the
number of times it had been matched; for intervention cases this was always one. The
matched data were then pooled into intervention and control groups and a weighted
logistic regression of each of the three health outcomes carried out; cases were
counted in the regression as many times as their assigned weight. Stuart (2010)
recommends using matching and regression methods in combination, and explains
that pooling of matched data as opposed to using individual matched pairs is a
relevant strategy. By way of sensitivity analyses, PSM was also carried out on the
original unimputed dataset, first excluding any baseline variables and then with all
covariates minus the cases with missing data. Weighted logistic regressions were
then done on the matched subsets.
13

3. Results
Of 23 demographic characteristics tested, 8 showed significant differences between
the study arms (Table 1). These were caste, religion, household monetary income, income
sufficient for food needs, income sufficient for food needs (BLS), income sufficient for other
needs, possession of APL ration card, and income sharing. Most anomalous was the
variable religion with 16.6 per cent Muslim households in the control group and only
0.2 per cent Muslim households in the intervention.
Table 1 Demographic characteristics of households in intervention and control groups
Intervention Controln % n %
Number of households 938 100 1096 100
Number of household members
2-4 122 13.0 174 15.95 188 20.0 196 17.96 174 18.6 226 20.67 159 17.0 176 16.18 95 10.1 123 10.7≥9 200 21.3 201 18.3
Adults over 50 None 387 41.3 506 46.21 255 27.2 285 26.02 254 27.1 273 24.9≥3 42 4.5 32 2.9
Children under 5 None 594 63.3 680 62.01 218 23.2 250 22.82 95 10.1 132 12.0≥3 31 3.3 34 3.1
Children under 15 None 210 22.4 268 24.51 198 21.1 210 19.22 280 29.9 282 25.73 139 14.8 172 15.7≥4 111 11.8 164 15.0
Gender of HH Female 121 12.9 115 10.5Male 817 87.1 981 89.5
Education level of HH None / pre-primary 463 49.4 555 50.6Primary 339 36.1 394 35.9Secondary 114 12.2 121 11.0University / Vocational 22 2.3 26 2.4
Caste ** Scheduled caste 176 18.8 321 29.3Scheduled tribe 111 11.8 124 11.3OBC 562 59.9 378 34.5General 89 9.5 273 24.9
Religion ** Hindu 936 99.8 914 83.4Muslim 2 0.2 182 16.6
HH = household head; OBC = other backward class; * = p-value < 0.05; ** = p-value < 0.01;
14

Table 1 (cont.) Demographic characteristics of households in intervention and control groups
Intervention Controln % n %
Household monetary income(INR / month) **
<1000 56 6.0 78 7.11000<2000 70 7.5 100 9.12000<5000 241 25.7 286 26.15000<10,000 327 34.9 304 27.7≥10,000 219 23.3 307 28.0Not known 25 2.7 21 1.9
Income sufficient for food needs (BLS) *
More than sufficient 115 16.9 101 14.3About sufficient 431 63.2 428 60.6Insufficient 108 15.8 127 18.0Don't know 28 4.1 50 7.1
Income sufficient for other needs *
More than sufficient 23 2.5 25 2.28About sufficient 662 70.6 771 70.4Insufficient 131 14.0 113 10.3Don't know 122 13.0 187 17.1
Income sufficient for other needs (BLS)
More than sufficient 78 11.7 66 9.9About sufficient 360 54.2 345 51.7Insufficient 150 22.6 164 24.6Don't know 76 11.4 92 13.8
Other financial assistance
Yes, from local authority 3 0.3 7 0.6Yes, from religious body 31 3.3 40 3.6Yes, from NGO 5 0.5 0 0.0No 856 91.3 1009 92.1Don't know 43 4.6 40 3.6
Possession of Ration Card
AAY (Antyodaya Anna Yogana) 41 4.4 57 5.2BPL (Below Poverty Line) 240 25.6 28.7 26.2APL (Above Poverty Line) ** 599 63.9 637 58.1
Income sharing ** Shared equally 500 53.3 418 38.2Men take more 333 35.5 500 45.7Women take more 74 7.9 137 12.5Other 20 2.1 28 2.6Don't know 11 1.2 12 1.1
Illness / injury (BLS) Yes 229 30.6 201 26.2No 519 69.4 567 73.8
Hospitalisation (BLS) Yes 233 31.1 261 34.0No 515 68.9 507 66.0
Disability (BLS) Yes 101 15.8 86 13.5No 537 84.2 553 86.5
Chronic illness (BLS) Yes 205 33.2 178 28.9No 412 66.8 438 71.1
* = p-value < 0.05; ** = p-value < 0.01;

The baseline covariates before and after imputation shared similar distributions
(Table 2).
Table 2 Characteristics of baseline variables before and after imputation
Original dataset Imputed datasets (n=5)% 1 Average %
Household monetary income (BLS) (INR / month)
<1000 63.4 63.51000<2000 9.2 9.02000<5000 16.9 17.05000<10000 4.5 4.5≥10,000 6.0 6.0
Income sufficient for food needs (BLS)
More than sufficient 15.6 15.6About sufficient 61.9 61.2Insufficient 16.9 17.0
Income sufficient for other needs (BLS)
More than sufficient 10.8 11.7About sufficient 53.0 51.5Insufficient 23.6 23.7
Illness / injury (BLS) Yes 28.4 28.2
Hospitalisation (BLS) Yes 32.6 33.0
Disability (BLS) Yes 14.6 15.4
Chronic illness (BLS) Yes 31.1 30.41 Percentages calculated after removal of missing values

The mirror-like distributions of propensity scores for the two study arms (Figure 1)
indicated good possibilities for matching.
Figure 1 Distributions of propensity score for intervention and control groups.

The odds of any case of illness or injury in the household, needing treatment but not
hospitalisation, was 46 per cent less in the intervention arm than in the control arm.
No statistical significance was seen for health outcomes related to hospitalisation and
complete child vaccination coverage (Table 3). The sensitivity analyses returned
similar odds ratios to the main results with overlapping confidence intervals (see
Appendix 1).
Table 3 Odds ratios of health outcomes in study arms
Intervention Control
Households with cases of illness or injury in household in last 3 months lasting more than 24 hours and needing treatment but not hospitalisationOR (95 % CI) 0.54 (0.44-0.65) ** 1
Households with cases of illness or injury in household in last 3 months requiring hospitalisationOR (95 % CI) 1.07 (0.89-1.29) 1
Households with complete vaccination coverage (BCG, DPT, Oral Polio, MMR) of all children in household between 6 monthsand 5 yearsOR (95 % CI) 1.04 (0.60-1.82) 1
OR = Odds Ratio; CI = Confidence Interval; * = p-value < 0.05; ** = p-value < 0.01;
18

4. Discussion
BI was seen to have a significant health protective effect with regard to minor
illnesses and injuries, while no effect was measured with regard to more serious
illnesses and injuries or child vaccination. A study by Forget (2011) which re-
examined data from a pilot programme of a guaranteed annual income (similar to a
basic income but means tested) in Canada in the 1970's showed a significant
reduction in accidents and injuries requiring hospitalisation in the intervention
group relative to the control group. Although accidents and injuries not requiring
hospitalisation were not studied in the Canadian experiment, it is feasible that a
reduction in serious accidents and injuries is an indication of a reduction in accidents
and injuries in general. In Namibia in 2008, the basic income project there led the
local health clinic nurse to conclude that there was a large reduction in cases of severe
diarrhoea since the introduction of BI, likely due to improvements in nutrition
(Haarmann et al. 2009). Although this statement is anecdotal in nature, it gives an
indication that BI positively affected illness outcomes. Unfortunately, more
scientifically rigorous evidence from this project seems unavailable. In Kenya
between 2011 and 2012, a UCT project revealed no significant differences between
control and intervention groups with regard to illness or injury in the household in
one month (Haushofer and Shapiro 2013). Randomisation in this study however was
at household level. In any one village half of the households received the intervention
and half did not: transfers were not universal. This could possibly have disrupted any
potential community level pathways (for example, involving social cohesion and
social interaction) from cash transfer to illness/injury outcome. The same study did
record increased psychological well-being, increased spending on food and medical
expenses, as well as reductions in hunger among those who received the transfers but
for whatever reason, this did not translate to lower levels of illness/injury, at least not
in the time scale given. The CCT programme in Mexico, oportunidades, observed a 12
19
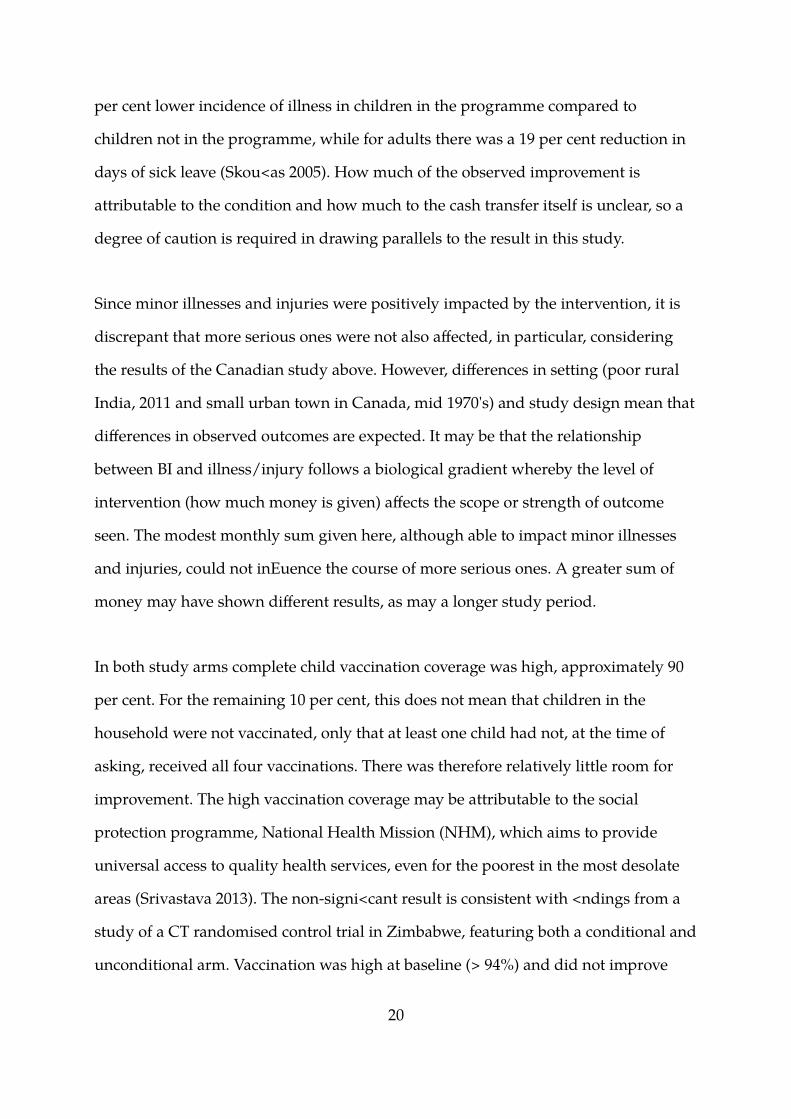
per cent lower incidence of illness in children in the programme compared to
children not in the programme, while for adults there was a 19 per cent reduction in
days of sick leave (Skoufias 2005). How much of the observed improvement is
attributable to the condition and how much to the cash transfer itself is unclear, so a
degree of caution is required in drawing parallels to the result in this study.
Since minor illnesses and injuries were positively impacted by the intervention, it is
discrepant that more serious ones were not also affected, in particular, considering
the results of the Canadian study above. However, differences in setting (poor rural
India, 2011 and small urban town in Canada, mid 1970's) and study design mean that
differences in observed outcomes are expected. It may be that the relationship
between BI and illness/injury follows a biological gradient whereby the level of
intervention (how much money is given) affects the scope or strength of outcome
seen. The modest monthly sum given here, although able to impact minor illnesses
and injuries, could not influence the course of more serious ones. A greater sum of
money may have shown different results, as may a longer study period.
In both study arms complete child vaccination coverage was high, approximately 90
per cent. For the remaining 10 per cent, this does not mean that children in the
household were not vaccinated, only that at least one child had not, at the time of
asking, received all four vaccinations. There was therefore relatively little room for
improvement. The high vaccination coverage may be attributable to the social
protection programme, National Health Mission (NHM), which aims to provide
universal access to quality health services, even for the poorest in the most desolate
areas (Srivastava 2013). The non-significant result is consistent with findings from a
study of a CT randomised control trial in Zimbabwe, featuring both a conditional and
unconditional arm. Vaccination was high at baseline (> 94%) and did not improve
20

further due to the introduction of CTs. Vaccination services were provided through
mobile outreach, and the transfers were not believed to influence access to these
(Robertson et al. 2013).
Pathways between BI and health likely operate at individual and social level. On an
individual level, Lundberg et al. (2007) describe two pathways: neo-material and
psychosocial. Neo-material refers to the increase in material standard (for example,
more nutritious food, housing improvements, higher health service consumption)
stimulated by an increase in income (such as a BI). Psychosocial refers to the direct
effect of income on social status which can negatively affect health. When
individuals, in making comparisons of personal income and material standards with
others in their social group, regard their situation as one of deprivation, stress
reactions in becoming chronic can lead to ill health. Similarly, Wilkinson (2006) claims
that relative income lays the ground for social position such that large income
inequality becomes reflected in society as a wide span of social positioning, and
harms (primarily) those with low status. BI, in redressing income inequalities to some
degree, lifts the social status of those vulnerable, and removes the worse health risks
associated with status. On a social level, BI may foster social cohesion (as social
protection policies in general do (OECD 2009)), by levelling out income inequality,
which is associated with poorer social relations and social division (Wilkinson 2006).
Communities with higher levels of social cohesion are known to enjoy better health
(Stansfield 2006). Another social level pathway involves the everyday, social
interactions that take place between people in a community, and that can lead to
what is called a social multiplier effect, that is, stronger than expected observed
outcomes of an intervention because of peer-influenced behavioural changes
(Scheinkman 2005). In other words, an intervention will not only have a direct effect
on an individual's behaviour, but also an indirect effect since the behavioural change
21

will influence the behaviour of those with whom the person interacts. The benefits
(or harm) accrued to one spread also to others in the community (Forget, Peden and
Strobel 2013). BI provides income security, removing the stress associated with
income insecurity. This may result in less harmful behaviours (for example, less
aggressive or violent reactivity; causing less accidents because able to take time off to
recuperate when ill; more likely to seek early treatment for an infectious disease) and
thereby reduce the risk for others in the community. These pathways are not
mutually exclusive nor contradictory, and all may be at work simultaneously. This is
in agreement with a social determinants of health perspective that highlights
multiple and multi-leveled causal pathways.
The BI pilot project was conducted as a cluster randomised trial. That randomisation
was at village level and not individual or household level was a necessary
prerequisite for it to be a study of basic income at all since BI is a transfer given
universally: for each intervention village involved in the trial every village member
(or as close to every member as possible) had to receive the monthly payments. Had a
significant portion of the village population not received the transfers, any possible
effects of the intervention working through community level mechanisms would
potentially have been distorted. This said, cluster randomisation has potential
shortcomings, in particular in trying to draw conclusions of causality between
associated variables. Since the units of randomisation and analysis are different (here,
villages and households), effective randomisation at the level of analysis is less likely
because the clusters randomised are too few, and because individuals within the
clusters may share similarities with each other more than with individuals from
other clusters (Cochrane Collaboration 2002). This means that covariates in the study
arms will not necessarily share similar distributions, making it less clear that
differences in observed outcomes are due to the intervention itself. Here, it was seen
22

that cluster randomisation had sufficiently good randomisation effect at household
level for 15 of the 23 variables chosen, but for eight of the variables the differences
between intervention and control were significant. PSM was used to get around this
problem and effectually recreate the conditions of a randomised control trial. While
PSM is also limited in that characteristics not brought in to the model, both observed
and unobserved, may lead to hidden bias (Oakes and Johnson 2006), the 46 per cent
reduction of odds seen is a fairly strong association not likely explained by bias alone.
The pilot project aimed to observe a wide range of outcomes, not only health. In
striving for breadth and comprehensiveness some specific areas may have suffered a
lack of depth or more appropriate outcome measures. Regarding health, other
information gathered could have given a fuller picture of the BI-health relationship,
for example: quality of life (QoL), self-rated health, body mass index (BMI), incidence
of diarrhoea, blood samples to measure, for example, haemoglobin (indicating
anaemia) or cortisol (stress hormone), and cross-checking with clinical records.
BLS and FES were conducted at household level, but health may have been better
assessed if each individual was questioned. For parameters of income however,
household level data is likely the most suitable, particularly in low and middle
income countries where finances are often pooled and decided upon within the
household as a unit. BLS contained missing data raising questions of utility and
validity, but the sensitivity analysis without BLS covariates did not affect the results.
Other limitations concern the survey questions themselves whereby some are
subjective by nature (for example, income sufficiency and income sharing) allowing
for more bias. Considering income only in monetary terms may also be misleading if
a proportionately large amount of household income is received in-kind.
23

5. Conclusions
Cash transfer programmes around the globe have proved their usefulness in
alleviating poverty and achieving favourable health and social outcomes. Basic
income, as a specific type of cash transfer, is also likely to contribute positively to the
growing evidence base as and when it is introduced. With a solid foundation in
social justice, BI is a social protection model highly congruent with the ideals of a
social determinants of health perspective. This study has shown how basic income in
a rural Indian context led to a reduction in the incidence of illnesses and injuries not
requiring hospitalisation, although no significant effect was seen on more serious
illnesses and injuries nor on vaccination coverage. Further studies providing a more
complete picture of the health effects of BI are desirable. Nevertheless, the evidence
thus far is promising and policy makers looking to implement cash transfers
programmes, or more generally seeking models of social protection to improve
people's lives, living conditions, and health, are advised to seriously consider BI as a
viable and worthy alternative.
Conflicts of interests
None declared.
Acknowledgements
Many thanks to Professor Guy Standing, School of African and Asian Studies (SOAS),
University of London, who kindly gave access to the basic income pilot project data.
László Zsoldos and Sarath Davala, also involved with the project, were very helpful
in giving their time answering questions. This article is based on a master thesis
which can be retrieved at http://www.diva-portal.org.
24

References
Aschengrau, A., and G.R. Seage. 2014. Epidemiology in public health. 3rd edition. Burlington, MA: Jones
& Barnett Learning.
Baird, S., C. McIntosh, and B. Özler. 2011. “Cash or Condition? Evidence from a Cash Transfer
Experiment.” The Quarterly Journal of Economics 126: 1709-1753.
Barrientos, A., and J. DeJong. 2006. “Reducing Child Poverty with Cash Transfers: A Sure Thing?”
Development Policy Review 24: 537-552.
Barrientos, A., and P. Lloyd-Sherlock. 2003. Non-Contributory Pensions and Social Protection. Issues in
Social Protection Series. Geneva: International Labour Organisation. http://www.ilo.org.
Birnbaum, S. 2013. “Basinkomst – ett instrument för rättvisa och hållbarhet?” [Basic Income – An
Instrument for Justice and Sustainability?] Ekonomisk debatt 41(6): 17-27.
Burns, H. 2012. Annual report of the Chief Medical Officer. Health in Scotland 2011. Transforming Scotland's
health. Edinburgh: The Scottish Government.
Cochrane Collaboration. 2002. Issues related to the unit of analysis. Accessed May 5, 2014.
http://www.cochrane-net.org/openlearning/HTML/modA2-4.htm.
Covarrubias, K., B. Davis, and P. Winters. 2012. “From Protection to Production: Productive Impacts of
the Malawi Social Cash Transfer Scheme.” Journal of Development Effectiveness 4: 50-77.
CSDH (Commission on Social Determinants of Health). 2008. Closing the Gap in a Generation: Health
Equity through Action on the Social Determinants of Health. Geneva: World Health Organisation.
Davala, S., R. Jhabvala, S. Kapoor, and G. Standing. 2014 – in press. A Little More, How Much it is...:
Piloting Basic Income in Madhya Pradesh, India. New Delhi, UNICEF India.
De Mel, S., D. McKenzie, and C. Woodruff. 2008. “Returns to Capital in Microenterprises: Evidence
from a Field Experiment.” The Quarterly Journal of Economics 123: 1329–1372.
de Waal, T., J. Pannekoek, and S. Scholtus. 2011. Handbook of Statistical Data Editing and Imputation.
25

Hoboken, NJ: Wiley.
Drèze, J., and A. Sen. 2013. An Uncertain Glory. India and Its Contradictions. London: Allen Lane.
Fernald, L.C.H., P.J. Gertler, and L.M. Neufeld. 2008. “Role of Cash in Conditional Cash Transfer
Programmes for Child Health, Growth, and Development: An Analysis of Mexico's Oportunidades.”
The Lancet 371: 828-837.
Fiszbein, A., and N. Schady. 2009. Conditional Cash Transfers: Reducing Present and Future Poverty. A
World Bank Policy Research Report. Washington, DC: The World Bank.
Forget, E.L., A.D. Peden, and S.B. Strobel. 2013. “Cash Transfers, Basic Income and Community
Building.” Social Inclusion 1: 84-91
Forget, E.L. 2011. The Town with No Poverty. Using Health Administration Data to Revisit Outcomes of a
Canadian Guaranteed Annual Income Field Experiment. University of Manitoba. Accessed April 30, 2014.
http://public.econ.duke.edu/~erw/197/forget-cea%20%282%29.pdf.
Haarmann, C., D. Haarmann, H. Jauch, H. Shindonola-Mote, N. Nattrass, I. van Niekerk, and M.
Samson. 2009. Making the Difference! The BIG in Namibia. Basic Income Grant Pilot Project Assessment
Report. Basic Income Grant Coalition.
Haushofer, J., and J. Shapiro. 2013. Policy brief: Impacts of unconditional cash transfers. Massachusetts
Institute of Technology.
http://web.mit.edu/joha/www/publications/Haushofer_Shapiro_Policy_Brief_UCT_2013.10.22.pdf.
Hulme, D., J. Hanlon, and A. Barrientos. 2010. Just Give Money to the Poor: The Development Revolution
from the Global South. Sterling, VA: Kumarian Press.
Kelsey, J.L., A.S. Whittemore, A.S. Evans, and W.D. Thompson. 1996. Methods in Observational
Epidemiology. Oxford: Oxford University Press.
Kenya CT-OVC Evaluation Team. 2012. “The Impact of Kenya's Cash Transfer for Orphans and
Vulnerable Children on Human Capital.” Journal of Development Effectiveness 4: 38-49.
Kohli, A. 2012. “State and Redistributive Development in India.” In Growth, Inequality and Social
26

Development in India. Is Inclusive Growth Possible? edited by R. Nagaral, 194-226. Houndmills: Palgrave
MacMillan.
Lundberg, O., M. Åberg Yngwe, M., M. Kölegård Stjärne, L. Björk, and J. Fritzell. 2007. The Nordic
Experience: Welfare States and Public Health (NEWS). Stockholm: Centre for Health Equity Studies.
Marmot Review. 2010. Fair Society, Healthy Lives. London: Marmot Review.
Mitra, R., and J.P. Reiter. 2012. “A Comparison of Two Methods of Estimating Propensity Scores after
Multiple Imputation.” Statistical Methods in Medical Research 0: 1-17.
MTFHI (Ministerial Task Force on Health Inequalities). 2008. Equally Well. Report of the Ministerial Task
Force on Health Inequalities. Volume 2. Edinburgh: The Scottish Government.
Oakes, J.M., and P.J. Johnson. 2006. “Propensity Score Matching for Social Epidemiology.” In Methods
in Social Epidemiology, edited by J.M. Oakes and J.S.Kaufman, 364-386. San Francisco, CA: Jossey-Bass.
OECD (Organisation for Economic Co-operation and Development). 2009. Promoting Pro-Poor Growth:
Social Protection. Paris: Organisation for Economic Co-operation and Development.
Ranganathan, M., and M. Lagarde. 2012. “Promoting Healthy Behaviours and Improving Health
Outcomes in Low and Middle Income Countries: A Review of the Impact of Conditional Cash Transfer
Programmes.” Preventive Medicine 55: 95-105.
Robertson, L., P. Mushati, J.W. Eaton, L. Dumba, G. Mavise, J. Makoni, C. Schumacher, et al. 2013.
“Effects of Unconditional and Conditional Cash Transfers on Child Health and Development in
Zimbabwe: A Cluster-Randomised Trial.” The Lancet 381: 1283-92.
Samson, M. 2009. “Social Cash Transfers and Pro-Poor Growth.” In Promoting pro-poor growth: Social
protection, edited by OECD, 43-59. Paris: Organisation for Economic Co-operation and Development.
Scheinkman, J. 2005. Social Interactions. Princeton University.
http://www.princeton.edu/~joses/wp/socialinteractions.pdf.
SEWA (Self Employed Women's Association). 2013. Basic Income in India: Piloting Unconditional Cash
Transfers 2010-2013. A SEWA Project, Funded by UNICEF, New Delhi. Accessed May 8, 2014.
27

http://www.sewabharat.org/news/presentation.pdf.
Skoufias, E. 2005. PROGRESA and Its Impacts on the Welfare of Rural Households in Mexico. Research report
139. Washington, DC: International Food Policy Research Institute
Srivastava, R.S. 2013. A Social Protection Floor for India. New Delhi: International Labour Organisation.
Standing, G. 2012. Cash Transfers: A Review of the Issues in India. New Delhi: UNICEF India.
Standing, G. 2013. Unconditional Basic Income: Two Pilots in Madhya Pradesh. Accessed May 8, 2014.
http://www.guystanding.com/files/documents/Basic_Income_Pilots_in_India_note_for_inaugural.p
df.
Stansfield, S.A. 2006. “Social Support and Social Cohesion.” In Social Determinants of Health, 2nd
Edition, edited by M. Marmot and R.G. Wilkinson, 148-171. Oxford: Oxford University Press.
Stuart, E.A. 2010. “Matching Methods for Casual Inference: A Review and a Look Forward.” Statistical
Science 25: 1–21.
UN (United Nations). 1948. Universal Declaration of Human Rights. Accessed April 15, 2014.
http://www.un.org/en/documents/udhr/index.shtml#a25.
van Parijs, P. 2003. “Basic Income: A Simple and Powerful Idea for the 21st Century.” In Redisigning
Distribution: Basic Income and Stakeholder Grants as Alternative Cornerstones for a More Egalitarian
Capitalism, edited by E.O.Wright, 4-39. The Real Utopias Project.
Wilkinson, R.G. 2006. “Ourselves and Others – For Better or Worse: Social Vulnerability and
Inequality.” In Social Determinants of Health, 2nd Edition, edited by M. Marmot and R.G. Wilkinson, 341-
358. Oxford: Oxford University Press.
World Bank. 2010. Social Protection in India: Overview. Accessed April 24, 2014.
http://web.worldbank.org/WBSITE/EXTERNAL/COUNTRIES/SOUTHASIAEXT/0,,contentMDK:2
2182349~pagePK:146736~piPK:146830~theSitePK:223547,00.html.
Yablonski, J., and M. O'Donnell. 2009. Lasting Benefits. The Role of Cash Transfers in Child Mortality.
London: Save the Children.
28
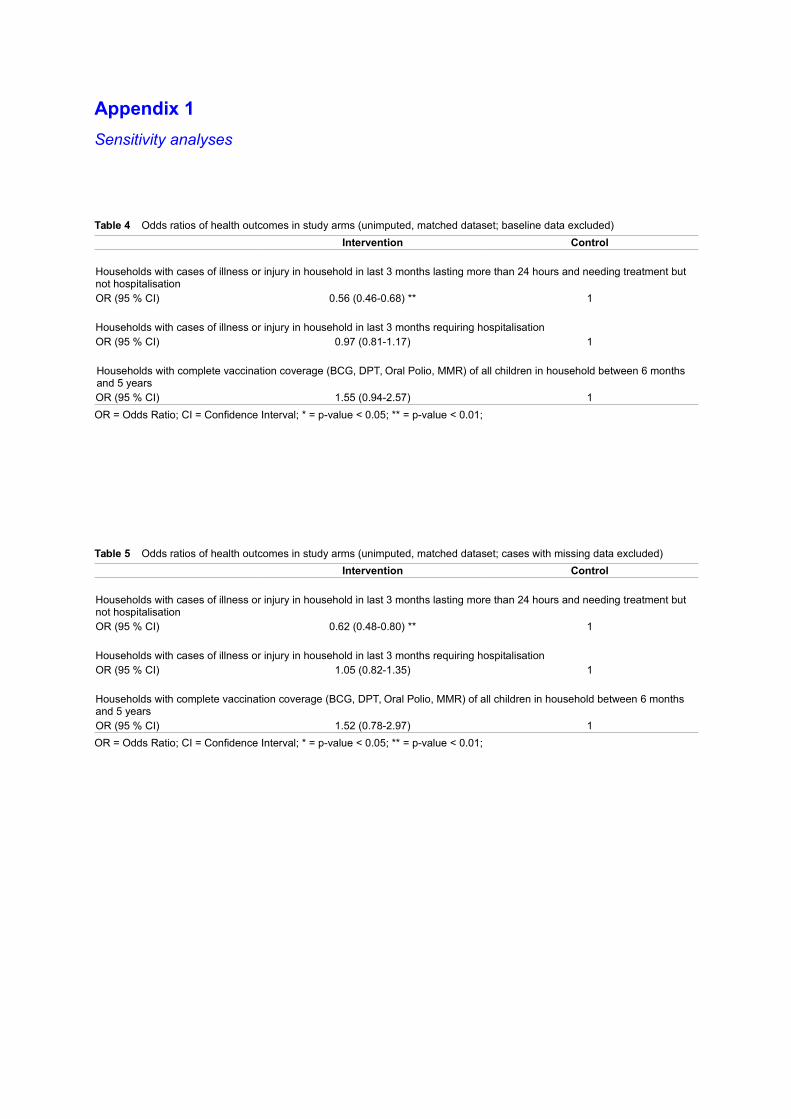
Appendix 1
Sensitivity analyses
Table 4 Odds ratios of health outcomes in study arms (unimputed, matched dataset; baseline data excluded)
Intervention Control
Households with cases of illness or injury in household in last 3 months lasting more than 24 hours and needing treatment but not hospitalisationOR (95 % CI) 0.56 (0.46-0.68) ** 1
Households with cases of illness or injury in household in last 3 months requiring hospitalisationOR (95 % CI) 0.97 (0.81-1.17) 1
Households with complete vaccination coverage (BCG, DPT, Oral Polio, MMR) of all children in household between 6 monthsand 5 yearsOR (95 % CI) 1.55 (0.94-2.57) 1
OR = Odds Ratio; CI = Confidence Interval; * = p-value < 0.05; ** = p-value < 0.01;
Table 5 Odds ratios of health outcomes in study arms (unimputed, matched dataset; cases with missing data excluded)
Intervention Control
Households with cases of illness or injury in household in last 3 months lasting more than 24 hours and needing treatment but not hospitalisationOR (95 % CI) 0.62 (0.48-0.80) ** 1
Households with cases of illness or injury in household in last 3 months requiring hospitalisationOR (95 % CI) 1.05 (0.82-1.35) 1
Households with complete vaccination coverage (BCG, DPT, Oral Polio, MMR) of all children in household between 6 months and 5 yearsOR (95 % CI) 1.52 (0.78-2.97) 1
OR = Odds Ratio; CI = Confidence Interval; * = p-value < 0.05; ** = p-value < 0.01;