Embed Size (px)
Citation preview
Economic and Financial Affairs
ISSN 2443-8014 (online)
Post-Programme Surveillance Report
Portugal, Autumn 2017
INSTITUTIONAL PAPER 070 | JANUARY 2018
EUROPEAN ECONOMY

European Economy Institutional Papers are important reports analysing the economic situation and economic developments prepared by the European Commission's Directorate-General for Economic and Financial Affairs, which serve to underpin economic policy-making by the European Commission, the Council of the European Union and the European Parliament. Views expressed in unofficial documents do not necessarily represent the views of the European Commission.
LEGAL NOTICE Neither the European Commission nor any person acting on behalf of the European Commission is responsible for the use that might be made of the information contained in this publication. This paper exists in English only and can be downloaded from https://ec.europa.eu/info/publications/economic-and-financial-affairs-publications_en. Luxembourg: Publications Office of the European Union, 2018 PDF ISBN 978-92-79-77451-5 ISSN 2443-8014 doi:10.2765/60084 KC-BC-18-002-EN-N
© European Union, 2018 Reuse is authorised provided the source is acknowledged. The reuse policy of European Commission documents is regulated by Decision 2011/833/EU (OJ L 330, 14.12.2011, p. 39). For any use or reproduction of material that is not under the EU copyright, permission must be sought directly from the copyright holders.

European Commission Directorate-General for Economic and Financial Affairs
Post-Programme Surveillance Report Portugal, Autumn 2017
EUROPEAN ECONOMY Institutional Paper 070

ACKNOWLEDGEMENTS
2
The report was prepared in the Directorate General Economic and Financial Affairs under the direction of
Servaas Deroose, Deputy Director General, Carlos Martínez Mongay, Director, and Christian Weise,
Head of Unit for Portugal.
Contributors:
Stefan Bohner, Violeta Klyviene, Radoslav Krastev, Leonor Pires, Michal Strojwas (FISMA), Rainer
Wichern (FISMA) and Markus Wintersteller (FISMA), Clement Reinvaldt. Assistance was provided by
Anastasia Kouskouni.
The Post-Programme Surveillance assessment of the report was prepared in liaison with the ECB.
This report reflects information available up until [18th
December 2017].
ABBREVIATIONS
iii
BFL Budget Framework Law
CET1 Common Equity Tier 1
CGD Caixa Geral de Depósitos
CIT Corporate Income Tax
DBP Draft Budgetary Plan
DGO Directorate-General for Budget
DMO Debt Management Office
DSA Debt Sustainability Analysis
EC European Commission
ECB European Central Bank
EPC Economic Policy Committee
ESM European Stability Mechanism
EU European Union
FDI Foreign Direct Investment
GDP Gross Domestic Product
HICP Harmonised Index of Consumer
Prices
IGCP Agência de Gestão da Tesouraria e
da Dívida Pública
IMF International Monetary Fund
IMI Immovable Property Tax
INE National Statistical Office
MIP Macroeconomic imbalance
procedure
MREL Minimum Requirement for own
funds and Eligible Liabilities
MTO Medium term Objective
NFCs Non-financial Corporations
NHS National Health Service
NPLs Non-performing loans
PER Processo Especial de Revitalização
de Empresas
PIT Personal Income Tax
PPS Post-programme surveillance
PPP public-private partnership
q-o-q Quarter on quarter
SGP Stability and Growth Pact
SMEs Small and Medium-sized Enterprises
SOEs State-owned Enterprises
UTAM Unidade Técnica de
Acompanhamento e Monitorização
do Setor Público Empresarial
VAT Value Added Tax
y-o-y Year on year


EXECUTIVE SUMMARY
5
This report presents the findings of the seventh post-programme surveillance (PPS) mission of
Commission staff, in liaison with ECB staff, which took place in Lisbon between 28 November and 6
December 2017. This visit also served as specific monitoring in the framework of the EU Macroeconomic
Imbalance Procedure (Annex 2). Since the conclusion of the sixth post-programme surveillance mission
in July 2017, growth has further accelerated. The short-term economic and financial situation of
Portugal has improved and important progress has been made in addressing near-term risks. Overall,
Portugal’s economic rebalancing building on the basis of reforms implemented during and after the
macroeconomic adjustment programme has made good progress. Going forward, the challenge is to
further strengthen the reform momentum. In this regard, ambitious growth-enhancing reforms and
sustained fiscal structural consolidation are essential to improve the economy’s resilience to shocks and
the medium-term growth prospects.
GDP and employment are set to increase significantly in 2017 driven by exports and investment.
Economic growth in 2017 picked up to 2.8% up to September due to a rebound in investment,
acceleration in foreign trade and a moderate increase in private consumption. Employment grew faster
than GDP until October 2017, particularly related to tourism, construction and manufacturing. Wage
growth remained subdued at the aggregate level, as most of the job openings were in sectors with low
skill profiles and lower-than-average salaries. The job-rich recovery reduced substantially both the
headline and long-term unemployment rates and supported economic activity as the labour force
increased despite a drop in the working age population. Economic performance is expected to slow down
but to remain strong in 2018 and 2019 amid further export growth and lower unemployment.
Higher revenue and lower interest expenditure are set to allow for a further reduction of the headline
deficit in 2017. The 2017 headline deficit is projected to decrease to 1.4% of GDP by both the
Commission autumn forecast and the authorities 2018 DBP mainly based on the improved
macroeconomic outlook and lower interest expenditure. Due to better than expected budgetary execution
in recent months, the 2017 deficit might turn out lower than the 1.4% of GDP estimated in autumn,
excluding any potential deficit-increasing impact of 2017 banking support measures. For 2018, the DBP
foresees an improvement of the headline deficit to 1.0% of GDP while the Commission forecasts it to
remain stable at 1.4% of GDP. The 0.4% of GDP difference stems from 0.1% of GDP lower indirect
taxes revenue and 0.3% of GDP stronger expenditure pressures (mostly from compensation of employees
and social transfers) in the autumn forecast. During the parliamentary approval process of the 2018
budget, a number of amendments have been accepted that, overall, are expected to have a deficit-
increasing effect.
The structural adjustment in 2017 and 2018 is at risk of significant deviation from the recommended
substantial effort. According to the commonly agreed adjustment matrix under the Stability and Growth
Pact, Portugal has been recommended to pursue an annual structural adjustment of at least 0.6% of GDP
in both years. The structural balance is projected to improve slightly by 0.1% of GDP in 2017 by both the
Commission autumn forecast and the DBP. For 2018, mostly due to the 0.4% of GDP difference in the
headline projection, the autumn forecast projects the structural balance to remain unchanged whereas
the DBP plans a (recalculated) improvement by 0.4% of GDP. The structural primary balance is
projected to evolve 0.3% of GDP less favourably in both the DBP and the Commission autumn forecast
given the corresponding decrease in interest expenditure.
Structural fiscal consolidation will be important for ensuring a steady decline in the still high public
debt level. Following stabilisation at around 130% from 2013 to 2016, the debt-to-GDP ratio is forecast
to decrease by an average 3pps in 2017 and 2018 according to both the DBP and the Commission
autumn forecast. The Commission projects Portugal’s gross public debt-to-GDP ratio to decline to
126.4% in 2017, 124.1% in 2018 and 121.1% in 2019. The latest Commission Debt Sustainability
Analysis (DSA), which uses the Commission 2017 autumn forecast as a starting point, puts the debt-to-
GDP ratio at around 115% by 2028 under a no-policy-change scenario, but at 95% under full
compliance with the requirements under the Stability and Growth Pact.

6
Fiscal-structural reforms are progressing while indebtedness of State Owned Enterprises remains
high. The scope of the expenditure review is broadening. Efficiency-enhancing initiatives have been taken
in the health sector; it remains unclear to what extent these will contribute to stem the flow of hospital
arrears. As regards the pension system, the Government has committed to duly factor in sustainability in
any new initiatives Net results of state-owned enterprises continue to improve and new measures are
planned for 2018 while debt levels are still high. A systematic approach to budgetary transfers to State
Owned Enterprises remains needed.
The sovereign's upgrade and continued economic recovery with the euro area have impacted the
Portuguese banking system positively. Banks have continued to strengthen capital ratios, partly through
capital injections and partly through further deleveraging. Cost reduction progressed as well. Yet, despite
tangible progress observable, the sector continues to be weighed down by low profitability, limited
capital buffers as well as still high, yet decreasing, ratios of non-performing loans. In this context, the
momentum built-up in NPL reduction as well as corporate loan restructurings should be maintained. The
platform to enhance coordination regarding non-performing loans management is a welcome initiative in
this regard. Likewise, Portuguese lenders need to continue to improve their profitability in an
environment of low interest rates and increasing digitisation.
Sovereign financing and the capacity to repay are currently not a reason for concern. However, yields
remain vulnerable to financial market conditions and the private and public debt overhang. Active debt
management is smoothing the debt redemption profile, with an accelerated early IMF repayment
schedule also contributing to lower interest costs. State financing needs are projected to remain broadly
stable until 2020, with the Debt Management Office planning to keep a significant cash buffer in the
future. After episodes of higher and volatile interest rates, yields on Portuguese bonds have fallen steadily
over the last 6 months, a development accelerated by Standard & Poor's and Fitch's decision to upgrade
Portugal's rating to investment grade, as well as by the ECB's decision to continue its asset purchasing
programme, even if with only a reduction in its scale.
Further strengthened structural reforms can support competitiveness. Active labour market policies are
becoming more effective. Administrative burden on firms is being reduced through simplified procedures
in their relation with the public administration, more business friendly legislation and decreasing case
backlog in courts. While these are steps in the right direction, competitiveness improvements require
further efforts such as an overall improvement in the judicial system namely through shorter procedures
in court or a reduction in restrictions in business services. Measures to improve the qualifications of the
adult population could also help with skill upgrading if they are broad in coverage and have a strong
training component. Segmentation in the labour market remains high and measures being put forward by
the authorities might not be enough to give significant incentives to hiring on open-ended contracts.
The next PPS mission will most likely take place in Spring 2018.

7
1. Introduction 9
2. Recent economic developments 11
2.1. Macroeconomic situation and outlook 11
2.2. Public Finances 12
2.3. Financial stability 14
2.4. Private debt 16
3. Policy issues 21
3.1. Public Finance 21
3.2. Fiscal-structural issues 22
3.3. Financial and corporate sectors 25
4. Sovereign financing and capacity to repay 27
A1. European Commission Debt sustainability analysis 29
A2. MIP specific monitoring 31
A2.1. Outlook and evolution of imbalances 31
A2.2. Policy measures taken to address macroeconomic imbalances 32
A2.3. Conclusion 39
A3. European Commission macroeconomic and fiscal projections (2017 autumn
forecast) 42
LIST OF TABLES
3.1. Fiscal adjustment 2010-2019 22
A2.1. State of Play of the implementation of MIP relevant reforms 40
LIST OF GRAPHS
2.1. Main factors contributing to GDP growth 11
2.2. Supplementary indicators to unemployment 12
2.3. Decomposition of the change in the annualised current account balance relative to GDP 12
2.4. Budget execution (General government) 13
2.5. Budget execution (State) 14
2.6. Budget execution (Social security) 14
2.7. Budget execution (Central administration) 14
2.8. New lending per month (domestic business) 15
2.9. Recent economic developments 18

8
2.10. Recent financial developments 19
4.1. 10-year government bond yields 28
4.2. Redemption profile 28
A1.1. Macroeconomic risks: growth and interest rate 29
A1.2. Fiscal consolidation and ageing costs 30
LIST OF BOXES
A2.1. Strategy for NPL reduction 34

1. INTRODUCTION
9
Staff from the European Commission (EC), in
liaison with the European Central Bank (ECB),
undertook the seventh post-programme
surveillance (PPS) mission to Portugal between
29 November and 6 December 2017. The mission
was coordinated with the IMF’s post-programme
monitoring (PPM) mission. The European Stability
Mechanism (ESM) participated in the meetings on
aspects related to its own Early Warning System.
PPS aims at a broad monitoring of economic,
fiscal and financial conditions with a view to
assessing the repayment capacity of a country that
has received financial assistance(1). While there is
no policy conditionality under PPS, the Council
can issue recommendations for corrective actions
if necessary and where appropriate. PPS is
biannual in terms of reporting and missions.
The PPS mission included specific monitoring
under the MIP. The 2017 in-depth review (IDR)
carried out under the macroeconomic imbalance
procedure (MIP) for Portugal concluded that
remaining excessive imbalances require decisive
policy action and specific monitoring. Annex 1
presents the results in the context of the specific
monitoring under the MIP and the European
Semester.
The autumn PPS reporting is now more
focussed on the most relevant macro, financial
and fiscal updates. Structural reforms are only
covered in the MIP section inasmuch as they are
MIP-relevant. An extensive assessment of these
policies will be done in the European Semester
Country Report. The objective is to minimise
overlaps with work and reporting in the framework
of the European Semester. The spring PPS
reporting cycle will remain as usual.
(1) PPS is foreseen by Article 14 of the two-pack Regulation
(EU) N°472/2013. It started after the expiry of the EU/IMF
financial assistance programme and lasts at least until 75%
of the financial assistance has been repaid.

2. RECENT ECONOMIC DEVELOPMENTS
11
2.1. MACROECONOMIC SITUATION AND
OUTLOOK
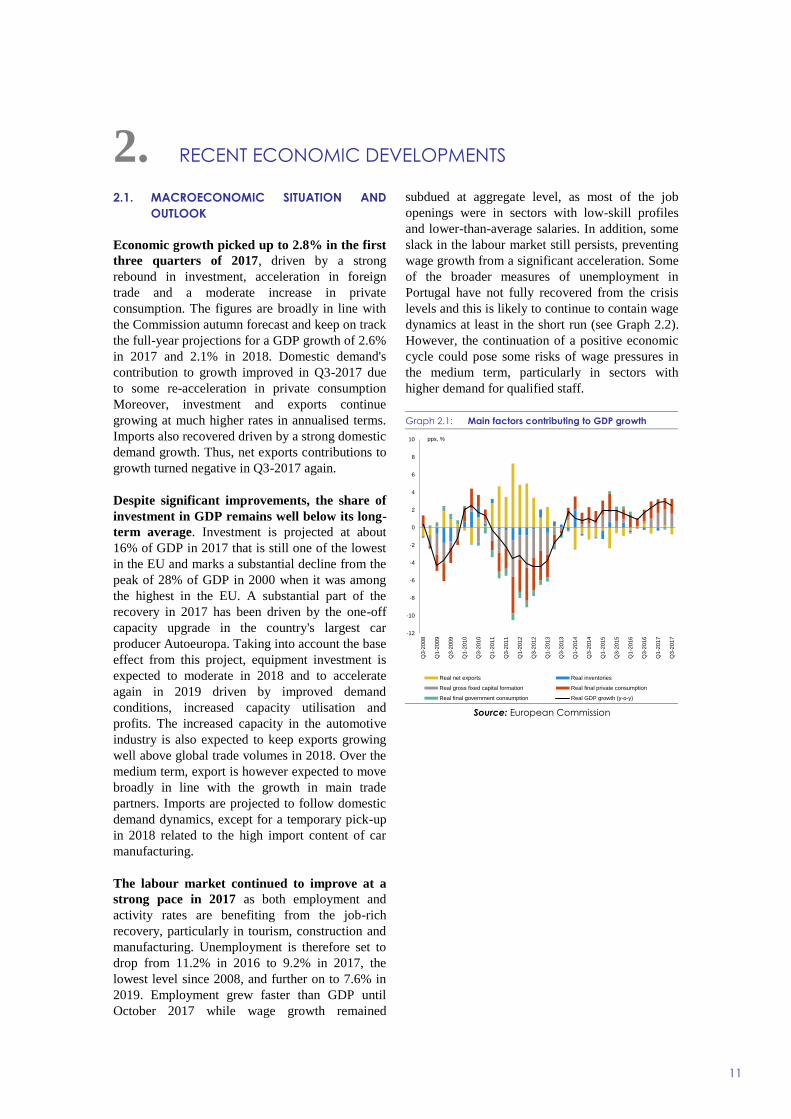
Economic growth picked up to 2.8% in the first
three quarters of 2017, driven by a strong
rebound in investment, acceleration in foreign
trade and a moderate increase in private
consumption. The figures are broadly in line with
the Commission autumn forecast and keep on track
the full-year projections for a GDP growth of 2.6%
in 2017 and 2.1% in 2018. Domestic demand's
contribution to growth improved in Q3-2017 due
to some re-acceleration in private consumption
Moreover, investment and exports continue
growing at much higher rates in annualised terms.
Imports also recovered driven by a strong domestic
demand growth. Thus, net exports contributions to
growth turned negative in Q3-2017 again.
Despite significant improvements, the share of
investment in GDP remains well below its long-
term average. Investment is projected at about
16% of GDP in 2017 that is still one of the lowest
in the EU and marks a substantial decline from the
peak of 28% of GDP in 2000 when it was among
the highest in the EU. A substantial part of the
recovery in 2017 has been driven by the one-off
capacity upgrade in the country's largest car
producer Autoeuropa. Taking into account the base
effect from this project, equipment investment is
expected to moderate in 2018 and to accelerate
again in 2019 driven by improved demand
conditions, increased capacity utilisation and
profits. The increased capacity in the automotive
industry is also expected to keep exports growing
well above global trade volumes in 2018. Over the
medium term, export is however expected to move
broadly in line with the growth in main trade
partners. Imports are projected to follow domestic
demand dynamics, except for a temporary pick-up
in 2018 related to the high import content of car
manufacturing.
The labour market continued to improve at a
strong pace in 2017 as both employment and
activity rates are benefiting from the job-rich
recovery, particularly in tourism, construction and
manufacturing. Unemployment is therefore set to
drop from 11.2% in 2016 to 9.2% in 2017, the
lowest level since 2008, and further on to 7.6% in
2019. Employment grew faster than GDP until
October 2017 while wage growth remained
subdued at aggregate level, as most of the job
openings were in sectors with low-skill profiles
and lower-than-average salaries. In addition, some
slack in the labour market still persists, preventing
wage growth from a significant acceleration. Some
of the broader measures of unemployment in
Portugal have not fully recovered from the crisis
levels and this is likely to continue to contain wage
dynamics at least in the short run (see Graph 2.2).
However, the continuation of a positive economic
cycle could pose some risks of wage pressures in
the medium term, particularly in sectors with
higher demand for qualified staff.
Graph 2.1: Main factors contributing to GDP growth
Source: European Commission
-12
-10
-8
-6
-4
-2
0
2
4
6
8
10
Q3-
2008
Q1-
2009
Q3-
2009
Q1-
2010
Q3-
2010
Q1-
2011
Q3-
2011
Q1-
2012
Q3-
2012
Q1-
2013
Q3-
2013
Q1-
2014
Q3-
2014
Q1-
2015
Q3-
2015
Q1-
2016
Q3-
2016
Q1-
2017
Q3-
2017
Real net exports Real inventories
Real gross fixed capital formation Real final private consumption
Real final government consumption Real GDP growth (y-o-y)
pps, %

2. Recent economic developments
12
Graph 2.2: Supplementary indicators to unemployment
Source: European Commission
HICP inflation moderated in the summer. It is
projected to remain relatively stable at 1.5% in
2017, 1.4% in 2018 and 1.5% in 2019. However,
accommodation prices remained elevated after the
end of the peak summer tourism season, raising the
HICP inflation above expectations at 1.8% in
November and thus bringing some upward risks to
the short-term projections. Core inflation is
expected to fluctuate slightly above the headline
rate, reflecting the impact of accommodation
services and moderate wage dynamics. House
price inflation rose from 7.1% in 2016 to 8.0%
year-on-year in Q2-2017, along with a significant
increase in property transactions. Demand for real
estate is expected to remain strong but the impact
on prices is likely to be at least partly offset by
growing supply from new construction.
Construction of buildings increased by 23.2% y-o-
y in Q3-2017 accelerating from 12.7% y-o-y in the
first half of the year. In addition, the stock of
mortgage loans is still declining, which dampens
the upward pressure on house prices and shows
that the price rebound is not generated by debt
accumulation. At this stage, the major driver of
house price increases is external demand and
tourism-related investments, which is evident from
the concentration of price hikes in tourist areas,
including also projects for transformation of
residential properties into accommodation
facilities.
Graph 2.3: Decomposition of the change in the
annualised current account balance relative
to GDP
Source: European Commission
The current account improved only marginally.
It moved to a small surplus in Q3-2017, in
annualised terms, reflecting a decline in the deficit
of trade with goods and an increase in the surplus
of services by 0.3 pps of GDP vis-à-vis Q2-2017.
Export of services continued benefiting from the
strong performance in tourism and transport. The
secondary income surplus also increased in Q3-
2017 reflecting a higher inflow from EU funds (see
Graph 2.3). In addition, a reversal in terms of
trade, which is mostly linked to oil price changes
relative to the first half of 2017, also had some
positive contribution to the current-account
balance.
2.2. PUBLIC FINANCES
In cash terms, budget execution through end-
October 2017 was marked by substantial
revenue increases combined with temporary
expenditure containment. Up to October, the
general government cash balance improved by
EUR 2.7 billion relative to the same period last
year due to an increase in revenue by 4.2% while
expenditure remained stable mostly due to a
change in the payment schedule of Christmas
supplement expenditure (2).
(2) While in 2016 the Christmas supplements for salaries and
pensions were entirely paid in twelve monthly payments, in
2017 only 50% of the Christmas supplements continue to
0
5
10
15
20
25
30
2008 2009 2010 2011 2012 2013 2014 2015 2016
Unemployed persons
Persons available to work but not seeking
Persons seeking work but not immediately available
Underemployed part-time workers
% of active
-0.8
-0.6
-0.4
-0.2
0.0
0.2
0.4
0.6
Q1-
2014
Q2-
2014
Q3-
2014
Q4-
2014
Q1-
2015
Q2-
2015
Q3-
2015
Q4-
2015
Q1-
2016
Q2-
2016
Q3-
2016
Q4-
2016
Q1-
2017
Q2-
2017
Q3-
2017
Contribution of secondary income balanceContribution of primary income balanceContribution of services balanceContribution of goods balanceChange in the current account balance
change in pps

2. Recent economic developments
13
On the revenue side, the overall increase by
October of 4.2% slightly exceeds to the 3.9%
increase projected in the 2017 budget for the
whole year. While personal income tax (PIT)
came in clearly lower than planned (-0.8% as
compared to the full-year budget target of +1.8%),
this was more than compensated by corporate
income tax (CIT) collection (+20.9%) being far
above the full year budget target of +0.9%. As
regards indirect taxes, the overall growth of
revenue by 4.9% compares to a budget target of
2.1%. Overall indirect tax execution by October
was in particular supported by the high increase in
VAT revenue by 5.8%, clearly exceeding the full-
year target of 1.4% in spite of higher VAT
reimbursements. While the increase of social
contributions also exceeded the annual target
(+0.9% compared to -0.6%), other current revenue
and capital revenue fell significantly short of the
annual budget targets up to October.
On the expenditure side, there was an overall
stabilisation up to October (0.0% variation as
compared to the full-year increase of 4.4% planned
in the budget) largely due to the temporary effect
of the postponement of payment of 50% of the
Christmas supplement for salaries and pensions to
November and December respectively and lower
than budgeted investment (+8.2% vs a full-year
budget increase of +26.9%). As regards acquisition
of goods and services, higher arrears in the health
sector contributed to the moderate overall increase
of +1.5% by October (below the budget target of
2.0%).
Public sector arrears are on the rise due to the
health sector. Following a broad stabilisation in
2016 as compared to end-2015 at EUR 0.9 billion
due to significant clearance payments in
December, public sector arrears have again
increased by a total EUR 416 million in 2017 to
EUR 1.3 billion up to the end of October. The
overall increase is entirely due to an increase by
EUR 480 million for state-owned hospitals
bringing the stock of arrears of the National Health
Service above EUR 1.0 billion at the end of
October 2017. Budgetary planning and control in
state-owned hospitals remains a challenge.
be paid in twelve monthly payments whereas the other 50%
are paid in November and December, respectively.
Risks to cash based budget execution appear to
be tilted to the positive side. On one hand the
payment of the remaining 50% of Christmas
supplements for salaries and pensions in
November and December and the planned
clearance of arrears in the health sector should lead
to a significant increase in the growth of
expenditure by year-end, which can at least
partially be accommodated under the expenditure
ceilings and by using the provisional allocations.
On the other hand, the higher expenditure growth
should continue to be compensated by overall
strong revenue collection in particular from
indirect taxes, allowing to reach or outperform the
budgetary targets in cash terms as adopted in the
2017 Budget.
Graph 2.4: Budget execution (General government)
Source: DGO
-5
0
5
10
15
20
25
30
35
40
45
-8
-6
-4
-2
0
2
4
6
8
10
Jan
-15
Mar
-15
May
-15
Jul-1
5
Se
p-15
Nov
-15
Jan
-16
Mar
-16
May
-16
Jul-1
6
Se
p-16
Nov
-16
Jan
-17
Mar
-17
May
-17
Jul-1
7
Se
p-17
Effective Revenue Primary Expenditure
Interests (rhs)
y-o-y % change y-o-y % change

2. Recent economic developments
14
Graph 2.5: Budget execution (State)
Source: DGO
Graph 2.6: Budget execution (Social security)
Source: DGO
Graph 2.7: Budget execution (Central administration)
Source: DGO
2.3. FINANCIAL STABILITY
Stronger economic performance helps banks to
progress with their capital levels and asset
quality. Portuguese lenders have benefitted from
the economic recovery to improve capital levels
and gradually restructure their business, mainly
through resizing distribution networks (mostly
local branches) and selling non-core business
activities. Recent capital increases in four of the
six largest banks are expected to support the clean-
up of the banks' balance sheets. Novo Banco's sale
should help further accelerate the process of
reducing the legacy non-performing loans. The
willingness of new and existing shareholders to
provide additional capital to the Portuguese
banking system is a positive sign. Nevertheless,
the vulnerabilities accumulated before and during
the crisis remain well present in the system and
continue to affect daily business. Banks should
seize the positive momentum to tackle them.
Namely, banks remain burdened by unresolved
balance sheet weaknesses including still high non-
performing loan levels, relatively poor profitability
and, overall, still weak capital buffers compared to
European peers. Portuguese lenders need to
continue to adjust to the low interest environment
and reduce costs.
Credit to businesses is improving for the lower
risk firms while deleveraging continues for
higher risk ones. Loans and securities to the non-
financial private sector slightly declined by 0.3%
between June 2016 and June 2017. Resident banks'
-20-18-16-14-12-10-8-6-4-202468
101214
Jan
-201
5
Mar
-201
5
May
-201
5
Jul-2
015
Se
p-20
15
Nov
-201
5
Jan
-201
6
Mar
-201
6
May
-201
6
Jul-2
016
Se
p-20
16
Nov
-201
6
Jan
-201
7
Mar
-201
7
May
-201
7
Jul-2
017
Se
p-20
17
State Direct Taxes State Indirect Taxes
Source: DGO and own calculations
y-o-y % change
-25
-20
-15
-10
-5
0
5
10
15
20
25
-6
-5
-4
-3
-2
-1
0
1
2
3
4
5
6
7
Jan
-201
5
Mar
-201
5
May
-201
5
Jul-2
015
Se
p-20
15
Nov
-201
5
Jan
-201
6
Mar
-201
6
May
-201
6
Jul-2
016
Se
p-20
16
Nov
-201
6
Jan
-201
7
Mar
-201
7
May
-201
7
Jul-2
017
Se
p-20
17
social security contribution social transfers
unemployment benefits (rhs)
Source: DGO and own calculations
y-o-y % change
y-o-y % change
-75
-25
25
75
125
175
225
275
-10
-5
0
5
10
15
20
Jan
-15
Mar
-15
May
-15
Jul-1
5
Se
p-15
Nov
-15
Jan
-16
Mar
-16
May
-16
Jul-1
6
Se
p-16
Nov
-16
Jan
-17
Mar
-17
May
-17
Jul-1
7
Se
p-17
Cost of Employees Acquisition of goods and services Investment (rhs)
y-o-y % change y-o-y % change
2. Recent economic developments
15
exposure shrank by 2.4% whereas foreign
institutions increased their loans by 2.2%, albeit on
a smaller total volume. High NPLs do not seem to
impact much the loan supply to healthy firms with
good business models. Quite to the contrary, small
business loans' interest rates are broadly in line
with euro area averages. Already since mid-2015
corporate loans up to EUR 250 000 cost only
marginally more in Portugal than in other euro area
countries. As competition amongst banks for the
best risks has become very intense, corporate loan
interest rates have halved since 2012 together with
a decrease in risk premium. The median interest
rate for the best risk quartile of corporate
borrowers was below 2% in September 2017.
Banks increased their lending to the best risk
quartile by 5% y-o-y. Loan stocks vis-à-vis the
second best quartile stayed flat whereas they
decreased for the two worst quartile, partially
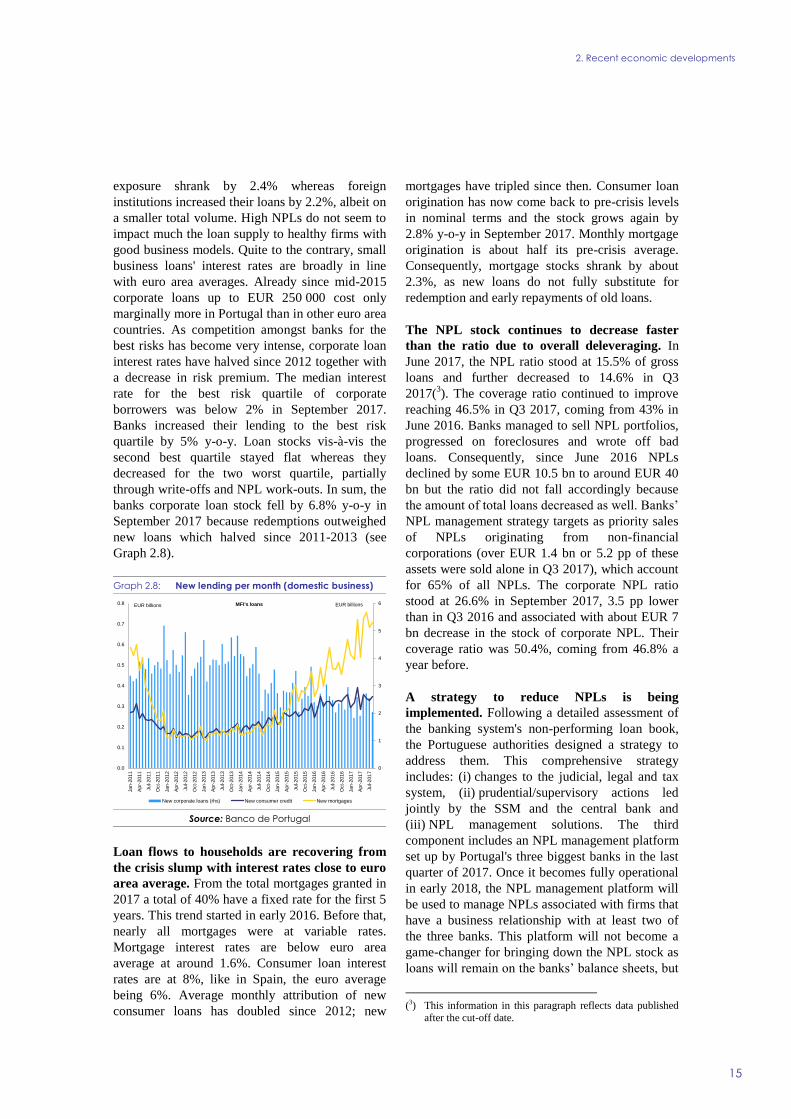
through write-offs and NPL work-outs. In sum, the
banks corporate loan stock fell by 6.8% y-o-y in
September 2017 because redemptions outweighed
new loans which halved since 2011-2013 (see
Graph 2.8).
Graph 2.8: New lending per month (domestic business)
Source: Banco de Portugal
Loan flows to households are recovering from
the crisis slump with interest rates close to euro
area average. From the total mortgages granted in
2017 a total of 40% have a fixed rate for the first 5
years. This trend started in early 2016. Before that,
nearly all mortgages were at variable rates.
Mortgage interest rates are below euro area
average at around 1.6%. Consumer loan interest
rates are at 8%, like in Spain, the euro average
being 6%. Average monthly attribution of new
consumer loans has doubled since 2012; new
mortgages have tripled since then. Consumer loan
origination has now come back to pre-crisis levels
in nominal terms and the stock grows again by
2.8% y-o-y in September 2017. Monthly mortgage
origination is about half its pre-crisis average.
Consequently, mortgage stocks shrank by about
2.3%, as new loans do not fully substitute for
redemption and early repayments of old loans.
The NPL stock continues to decrease faster
than the ratio due to overall deleveraging. In
June 2017, the NPL ratio stood at 15.5% of gross
loans and further decreased to 14.6% in Q3
2017(3). The coverage ratio continued to improve
reaching 46.5% in Q3 2017, coming from 43% in
June 2016. Banks managed to sell NPL portfolios,
progressed on foreclosures and wrote off bad
loans. Consequently, since June 2016 NPLs
declined by some EUR 10.5 bn to around EUR 40
bn but the ratio did not fall accordingly because
the amount of total loans decreased as well. Banks’
NPL management strategy targets as priority sales
of NPLs originating from non-financial
corporations (over EUR 1.4 bn or 5.2 pp of these
assets were sold alone in Q3 2017), which account
for 65% of all NPLs. The corporate NPL ratio
stood at 26.6% in September 2017, 3.5 pp lower
than in Q3 2016 and associated with about EUR 7
bn decrease in the stock of corporate NPL. Their
coverage ratio was 50.4%, coming from 46.8% a
year before.
A strategy to reduce NPLs is being
implemented. Following a detailed assessment of
the banking system's non-performing loan book,
the Portuguese authorities designed a strategy to
address them. This comprehensive strategy
includes: (i) changes to the judicial, legal and tax
system, (ii) prudential/supervisory actions led
jointly by the SSM and the central bank and
(iii) NPL management solutions. The third
component includes an NPL management platform
set up by Portugal's three biggest banks in the last
quarter of 2017. Once it becomes fully operational
in early 2018, the NPL management platform will
be used to manage NPLs associated with firms that
have a business relationship with at least two of
the three banks. This platform will not become a
game-changer for bringing down the NPL stock as
loans will remain on the banks’ balance sheets, but
(3) This information in this paragraph reflects data published
after the cut-off date.
0
1
2
3
4
5
6
0.0
0.1
0.2
0.3
0.4
0.5
0.6
0.7
0.8
Jan
-201
1
Ap
r-20
11
Jul-2
011
Oct
-201
1
Jan
-201
2
Ap
r-20
12
Jul-2
012
Oct
-201
2
Jan
-201
3
Ap
r-20
13
Jul-2
013
Oct
-201
3
Jan
-201
4
Ap
r-20
14
Jul-2
014
Oct
-201
4
Jan
-201
5
Ap
r-20
15
Jul-2
015
Oct
-201
5
Jan
-201
6
Ap
r-20
16
Jul-2
016
Oct
-201
6
Jan
-201
7
Ap
r-20
17
Jul-2
017
MFI's loans
New corporate loans (rhs) New consumer credit New mortgages
EUR billions EUR billions

2. Recent economic developments
16
will be helpful in the medium term for more
challenging cases by expediting credit
restructuring and/or NPL sales and by fostering the
restructuring of viable firms.
Savings still grow despite the lowest deposit
remuneration on record. Households' savings
have shrunk since summer 2016; they fell 1.4%
between September 2016 and September 2017. But
aggregate deposits still grew by 0.5% as corporate
savings increased by 8.3% and confidence in the
banking system strengthened. Contrary to other
EU-jurisdictions, Portuguese banks are by law
forbidden to charge negative interest rates, not
even for large companies. In a context of negative
interest rates, this restriction increases the
incentives for multinationals to deposit excess
liquidity in Portugal. In July 2017, aggregate
deposits reached a new all-time high transgressing
the EUR 175 bn mark.
Portuguese banks have returned to the market
in 2017. In 2017 banks issued 10 different covered
bonds benefitting from the positive momentum
created by rating upgrades. Banks issued to remain
active in the market as investors would consider
them as newcomers again after 2 years of absence.
Borrowing from the ECB is predominantly through
the targeted longer-term refinancing operations
(TLTROs) mostly redeemable from 2020 onward
and remains stable around EUR 23 bn mark,
around 6% of banks' total liabilities.
Capitalisation of the Portuguese banking
system has improved recently. The average
CET1 ratio of the banking system rose by 1.1 pp
since June 2016 to 13.2% in June 2017, not only
thanks to capital increases but also due to falling
risk-weighted assets. Since the last quarter of
2016, four out of Portugal's six biggest banks have
seen capital injections adding up to EUR 7
bn(4).Novo Banco will issue EUR 400 m in
subordinated debt by the end of 2018. CGD also
plans another EUR 430 m Additional Tier 1 bond
issue in 2018. Portugal's aggregate bank capital
and reserves amount to EUR 60 bn in September
2017 coming from a level of EUR 34 bn in
September 2007. Despite improving the ratio
between own funds and assets, the sector's capital
(4) During the past 12 months CGD, BCP, Novo Banco, and
Montepio strengthened their capital by EUR 4.5, 1.5, 1 and
0.25 bn respectively.
adequacy ratios are in general still very low in
European comparison..
Banks profitability recovered in 2017. In June
2017 Return on Assets stood at 0.32% and Return
on Equity at 3.9% with both coming from basically
0% one year earlier. Improved profitability stems
from a diminished flow of impairments and better
net intermediation margins helped by lower
deposit remuneration. As Portuguese sovereign
bonds increased in value, banks' trading results
benefitted commensurately. The real estate market
rebound also helps banks when disposing of
foreclosed properties. Still, important differences
across banks persist. While some bigger banks still
post losses, others break barely even in 2017,
whereas some banks earn double digit Return on
Equity.
Cost to income ratios fell during the first half of
2017 by 1.4pp to 61%. Operating costs of
Portuguese banks have been notoriously high,
driven by an excessive number of bank outlets
(among the highest in the EU in relation to
population) and relatively high staffing costs.
Nonetheless, over 2017 operating costs of banks
have been decreasing faster than the revenue
originated by net interest income and net
commissions. Almost all banks are presently
engaged in the process of restructuring their
operations in Portugal. End 2016 the number of
branches fell to below 50 per 100 000 habitants,
slightly less than twice the European average
whereas the number of employees per inhabitant is
more in line with European average. Despite
tangible cost reduction progress being already
observable, pressure to continue reducing costs
will remain high. Banks face increasing pressure to
move their business online and need to invest more
heavily in new digital technologies. This in turn
implies higher investments in IT architecture
supporting credit institutions’ business model
changes.
2.4. PRIVATE DEBT
Private debt is on a steady downward trend
since 2012 though the distance to the MIP
threshold is still significant. In consolidated

2. Recent economic developments
17
terms(5), the share of private debt in GDP fell from
210.3% at end-2012 to 171.4% at end-2016. Both
the corporate and household sectors contributed to
the deleveraging process. At the end of 2016, the
consolidated corporate debt(6) accounted for
98.9% of GDP compared to 119.9% four years
earlier. For the same period, the household debt
ratio dropped from 90.4% to 72.5%.
The latest available debt statistics show that the
process of deleveraging continued in 2017. Apart
from the banking statistics described in the
previous section, this is also supported by the data
of Banco de Portugal on the stock of non-
consolidated debt, which dropped from a peak of
264.7% of GDP at the end of 2012 to 217.5% at
the end of 2016 and further on to 212.0% at the
end of September 2017. In the private corporate
sector, the debt ratio dropped from 170.8% at the
end of 2012 to 140.8% at end-2016 and 137.6% at
the end of September 2017. The largest debt ratios
as of September 2017 are reported in trade (22.8%
of GDP), manufacturing (22.2%), and utilities
(17.8%) The ratios for construction and real estate
stand at 12.9% in each sector. Since 2012, the debt
ratios have declined in virtually all sectors while
the steepest drop is recorded in construction.
Despite the ongoing deleveraging, private
investments increased from 12.0% of GDP in
2013 to 13.9% in 2016, helped by improved
corporate profits and increased inflow of FDI.
From January to September 2017, private
investments increased substantially and are now
expected to reach 14.5% of GDP for the whole
year, according to the 2017 Commission autumn
forecast, reflecting also a temporary impact from
the capacity upgrade in the automotive industry
financed primarily through external sources.
Nevertheless, the level of investments remains
among the lowest in the EU and continues to be
restrained by the large stock of indebtedness.
(5) Consolidated debt comprises loans and securities at market
value while non-consolidated data cover loans, securities at face value and trade credits.
(6) Corporate debt refers to non-financial entities, including
public ones outside the general government.

2. Recent economic developments
18
Graph 2.9: Recent economic developments
Source: European Commission, INE and Banco de Portugal
70
75
80
85
90
95
100
105
110
115
120
-5
-4
-3
-2
-1
0
1
2
3
4
Q3-
2010
Q1-
2011
Q3-
2011
Q1-
2012
Q3-
2012
Q1-
2013
Q3-
2013
Q1-
2014
Q3-
2014
Q1-
2015
Q3-
2015
Q1-
2016
Q3-
2016
Q1-
2017
Q3-
2017
GDP accellerates supported by strong economic sentiments and external demand
Real GDP (quarterly, national accounts, q-o-q % change), Q3-2017
Real GDP (quarterly, national accounts, y-o-y % change), Q3-2017
DG ECFIN, Economic sentiment indicator (monthly, 3mma) (rhs), Nov-2017
Source: INE and DG ECFIN
Index
%
2
3
4
5
6
7
8
9
10
11
12
-8
-6
-4
-2
0
2
4
Q3-
2010
Q1-
2011
Q3-
2011
Q1-
2012
Q3-
2012
Q1-
2013
Q3-
2013
Q1-
2014
Q3-
2014
Q1-
2015
Q3-
2015
Q1-
2016
Q3-
2016
Q1-
2017
Q3-
2017
Private consumption retains steady growth amid low saving rates and subdued income growth ...
Private consumption (quarterly, national accounts, y-o-y % change, SA), Q3-2017
Gross household saving rate (4qma) (rhs), Q2-2017
% %
Source: INE and Eurostat
-40
-30
-20
-10
0
10
20
30
Q3-
2010
Q1-
2011
Q3-
2011
Q1-
2012
Q3-
2012
Q1-
2013
Q3-
2013
Q1-
2014
Q3-
2014
Q1-
2015
Q3-
2015
Q1-
2016
Q3-
2016
Q1-
2017
Q3-
2017
...investment in both equipment and construction increase strongly but from a low base.
Construction investment (quarterly, national accounts, y-o-y % change, SA), Q3-2017
Equipment investment (quarterly, national accounts, y-o-y % volume change, SA), Q3-2017
Source: INE and Banco de Portugal
%
-15
-10
-5
0
5
10
15
20
25
Oct
-201
0
Ap
r-20
11
Oct
-201
1
Ap
r-20
12
Oct
-201
2
Ap
r-20
13
Oct
-201
3
Ap
r-20
14
Oct
-201
4
Ap
r-20
15
Oct
-201
5
Ap
r-20
16
Oct
-201
6
Ap
r-20
17
Oct
-201
7
Imports of goods rise faster than exports paced by higher invetsment demand
Exports of goods (BoP data, y-o-y % nominal change, 3mma, SA), Oct-2017
Imports of goods (BoP data, y-o-y % nominal change, 3mma, SA), Oct-2017
Source: Banco de Portugal
%
-15
-10
-5
0
5
10
15
20
25
Oct
-201
0
Ap
r-20
11
Oct
-201
1
Ap
r-20
12
Oct
-201
2
Ap
r-20
13
Oct
-201
3
Ap
r-20
14
Oct
-201
4
Ap
r-20
15
Oct
-201
5
Ap
r-20
16
Oct
-201
6
Ap
r-20
17
Oct
-201
7
... while strong growth in tourism continues to support net exports of services.
Exports of services (BoP data, y-o-y % nominal change, 3mma, SA), Oct-2017
Imports of services (BoP data, y-o-y % nominal change, 3mma, SA), Oct-2017
Source: Banco de Portugal
%
-6
-4
-2
0
2
4
6
8
10
12
8
9
10
11
12
13
14
15
16
17
18
Q3-
2010
Q1-
2011
Q3-
2011
Q1-
2012
Q3-
2012
Q1-
2013
Q3-
2013
Q1-
2014
Q3-
2014
Q1-
2015
Q3-
2015
Q1-
2016
Q3-
2016
Q1-
2017
Q3-
2017
Employment also accellerates bringing significant reduction in unemployment amid higher activity rate.
Unemployment rate (quarterly, LFS, % of active population, SA), Q3-2017
Employment (quarterly, LFS, y-o-y % change) (rhs), Q3-2017
Long-term unemployment rate (quarterly, LFS, % of active population, NSA), Q2-2017
%%
Source: INE

2. Recent economic developments
19
Graph 2.10: Recent financial developments
Source: Banco de Portugal and European Banking Authority (EBA)
100
110
120
130
140
150
160
0
50
100
150
200
250
300
Jan
-201
3
Jul-2
013
Jan
-201
4
Jul-2
014
Jan
-201
5
Jul-2
015
Jan
-201
6
Jul-2
016
Jan
-201
7
Jul-2
017
While the banks keep reducing their loan books ...
Aggregate loans Total deposits LTD ratio (rhs)
EUR billion %
-0.4
-0.3
-0.2
-0.1
0.0
0.1
0.2
0.3
0.4
0
2
4
6
8
10
12
Jan
-13
Jul-1
3
Jan
-14
Jul-1
4
Jan
-15
Jul-1
5
Jan
-16
Jul-1
6
Jan
-17
Jul-1
7
The continuous decline in average interest rates for corporates ...
NFCs < 1m NFCs >1m HHs - housing
HHs - consumer credit HHs - other purposes EURIBOR 3M (rhs)
% %
0
50
100
150
200
250
300
0
1
2
3
4
5
6
Jan
-201
3
Jul-2
013
Jan
-201
4
Jul-2
014
Jan
-201
5
Jul-2
015
Jan
-201
6
Jul-2
016
Jan
-201
7
Jul-2
017
... has not yet reversed the decrease in new lending.
Consumer loan stock (rhs) Mortgages stock (rhs)
Corporate credit stock (rhs) New consumer credit
New mortgages New corporate loans
EUR billion
EUR billion
30
32
34
36
38
40
42
44
46
48
50
0
5
10
15
20
25
30
35
Q4-
2015
Q1-
2016
Q2-
2016
Q3-
2016
Q4-
2016
Q1-
2017
Q2-
2017
... non-performing loans are also declining, albeit at a modest pace.
Housing Consumption & other purposes
Non-financial corporations NPLs - Total
NPL coverage ratio (rhs)
% of Total %
50
55
60
65
70
75
80
0
2
4
6
8
10
12
14
Q1-
2015
Q2-
2015
Q3-
2015
Q4-
2015
Q1-
2016
Q2-
2016
Q3-
2016
Q4-
2016
Q1-
2017
Q2-
2017
Pressure to continue reducing costs remains high ...
Operational costs Total Gross Income Cost-to-income ratio (rhs)
EUR billion %
-0.8
-0.6
-0.4
-0.2
0.0
0.2
0.4
0.6
-10
-8
-6
-4
-2
0
2
4
6
8
Q1-
2015
Q2-
2015
Q3-
2015
Q4-
2015
Q1-
2016
Q2-
2016
Q3-
2016
Q4-
2016
Q1-
2017
Q2-
2017
... which is reflected in their profitability indicators, that remain below the EU average.
Portugal - ROE EU - RoE
Portugal - ROA (rhs) EU - RoA (rhs)
%%


3. POLICY ISSUES
21
3.1. PUBLIC FINANCE
The Commission autumn forecast projects the
headline deficit to decrease to 1.4% of GDP in
2017, mainly due to the accelerated economic
recovery, decreasing interest expenditure and
lower-than-budgeted public investment. The DBP
2018 also projects a slight improvement of the
2017 general government balance to -1.4% of
GDP. While tax revenue projections have been
revised upwards by a nominal amount worth 0.5%
of GDP as compared to the Stability Programme
and interest expenditure downwards by an amount
worth 0.2% of GDP, this positive impact has been
almost offset by an upward revision by 0.6% of
GDP in current primary expenditure (in particular
other current expenditure, social transfers and
compensation of employees). Capital expenditure
has remained broadly stable with a downward
revision by 0.3% of GDP in gross fixed capital
formation almost offset by an upward revision of
similar size in other capital expenditure. The
Commission autumn forecast projects only small
divergences with the DBP 2018 in the breakdown
by revenue and expenditure item; these concern
the tax revenue breakdown and slightly higher
current expenditure compensated by slightly lower
capital expenditure. In the PPS meetings at the end
of November the authorities pointed to positive
risks as compared to the common DBP and
Commission autumn forecast headline deficit
projection of 1.4% of GDP for 2017, mainly linked
to a more positive estimate for Local Government.
For 2018, the Commission autumn forecast
projects the headline deficit to remain at 1.4%
of GDP. The DBP 2018 maintains the headline
deficit target for 2018 at 1.0% of GDP as the
deficit-improving impact from mostly macro-
related upward revisions of revenue and downward
revisions of interest expenditure is broadly offset
by increases in current expenditure. The 0.4% of
GDP higher headline deficit in the autumn forecast
projection stems from 0.1% of GDP lower indirect
taxes (more conservative assumptions based on
private consumption standard elasticity trends) and
stronger expenditure pressures from compensation
of employees (0.2% of GDP based on the track
record of rising public employment in 2016 and
2017 as opposed to planned decreases) and social
transfers (0.1% of GDP based on track record in
2016 and 2017). In the PPS meetings at the end of
November the authorities did not yet see
themselves in a position to fully quantify the
impact of the amendments included in the 2018
budget finally approved by Parliament on 27
November. They however expected a deteriorating
impact of 0.1% of GDP on the headline deficit
from new measures against wildfires worth EUR
124 million added in the parliamentary discussions
following the October fires.
The Commission forecasts the structural
balance to improve slightly in 2017 and remain
broadly stable in 2018 with the Government
being more optimistic for 2018. For 2017 the
Commission forecast projects the structural
balance to improve by some 0.1pp of GDP
to -1.8% of GDP, broadly in line with the DBP.
For 2018 the DBP plans an improvement of the
(recalculated) structural balance by 0.4pps
to -1.4% of GDP. For 2018 the Commission
projects the structural balance to remain broadly
unchanged at -1.8% of GDP, resulting in a
difference of 0.4pps with the DBP. The structural
primary balance in both the DBP and the
Commission forecast is projected to evolve less
favourably given the falling interest expenditure
(-0.3% of GDP in both years). Thus, for 2018 the
Commission projects the stabilisation of the
structural balance (0.0% of GDP change) to be
accompanied by a deterioration of the structural
primary balance by 0.3% of GDP. As highlighted
in the Commission's DBP assessment, the growth
of primary government expenditure, net of
discretionary revenue measures and one-offs, is
expected to substantially exceed the recommended
benchmark rates in both 2017 and 2018 according
to the DBP and the Commission autumn forecast.
The table of fiscal measures included in the
2018 DBP shows structural fiscal measures
decreasing expenditure (0.3% of GDP) more
than offsetting the structural fiscal measures
decreasing revenue (0.1% of GDP). On the
revenue side, a 0.25% of GDP decrease in PIT
(carry-over impact of the surcharge reversal plus
change in brackets) is only partially compensated
by a 0.1% of GDP increase in indirect taxes and
revenue collection improvements. On the
expenditure side, a 0.25% of GDP discretionary
increase in public wages and social transfers
(unfreezing of career progressions, extraordinary
increases of pensions and social benefits) is

3. Policy issues
22
planned to be more than compensated by 0.4% of
GDP of expenditure-containment measures
(nominal freeze of intermediate consumption and
other current expenditure, spending review) and
0.15% of GDP in interest expenditure savings. In
addition to fiscal policy measures of a structural
nature, the 2018 budget balance is set to be
impacted by a 0.1% of GDP one-off CIT revenue
decrease, by 0.1% of GDP in estimated higher
dividends from Banco de Portugal, by 0.1% of
GDP in one-off capital transfer expenditure and by
some EUR 50 million wildfire emergency costs
(which had already been included in the DBP
following the June wildfires).
The table of fiscal measures in the 2018 DBP
reports a balanced budgetary impact of revenue
and expenditure measures on the headline
balance. The Commission autumn forecast takes
into account most measures at their yield specified
in the DBP(7). However, the Commission forecast
does not factor in ¼% of GDP nominal freezing of
intermediate consumption and other current
expenditure based on insufficient specification and
the recent track record of these measures. The
corresponding freezing measures do however not
seem to have been taken into account in the DBP's
own overall revenue and expenditure target table
either as the corresponding expenditure items, in
particular intermediate consumption show nominal
increases above nominal GDP growth in 2018.
Public debt is set to decline as from 2017 and
the headline deficit to improve slightly in 2019.
After reaching 130.1% of GDP at the end of 2016,
the Commission autumn forecast projects
Portugal’s gross public debt-to-GDP ratio to
decline to 126.4% in 2017, 124.1% in 2018 and
(7) While not considering them discretionary fiscal measures,
the forecast also factors in the higher estimates for Banco
de Portugal dividends and interest expenditure savings.
121.1% in 2019, due to primary budget surpluses
and higher nominal GDP growth. Under a no-
policy-change assumption, the autumn forecast
projects the headline deficit to improve slightly in
2019 to 1.2% of GDP. Risks to the fiscal outlook
are overall tilted to the downside: while there
appear to be some positive risks in the short-term
related to budgetary execution in recent months,
there are downside risks linked to uncertainties
surrounding the macroeconomic outlook, potential
additional spending slippages (in particular as
regards the unfreezing of career progressions) and
the potential deficit-increasing impact of the 2017
banking support measures (in particular the
recapitalisation of Caixa Geral de Depósitos and
the contingent capital mechanism included in the
Novo Banco sales agreement).
3.2. FISCAL-STRUCTURAL ISSUES
The spending review is gradually being
expanded into new sectors. Justice and internal
affairs have been added to the already covered
areas of education, healthcare, SOEs, public sector
real estate management and centralised public
procurement. Some progress has already been
made in the justice sector, such as the introduction
of efficiency-enhancing reforms in the courts,
while plans to reduce the costs associated with the
legal treatment of seized vehicles are under
development, although the extent of estimated
savings from the latter are unclear. A series of
reforms in the internal affairs sector are being
planned but have not yet reached the stage of
implementation (See Annex 1 Section 2 for more
details). Human resource management more
generally (including recruitment procedures,
incentives for staff to innovate) is being presented
as a cross-sectorial area for savings, with a
particular focus on reducing absenteeism. A range
of new tools will be deployed to address the latter,
Table 3.1: Fiscal adjustment 2010-2019
(1) Fiscal adjustment is measured as the change in the structural primary balance; fiscal effort defined as the change in the
structural balance.
Source: European Commission Services 2017 Autumn Forecast
2010 2011 2012 2013 2014 2015 2016 2017 2018 2019
Budget balance -11.2 -7.4 -5.7 -4.8 -7.2 -4.4 -2.0 -1.4 -1.4 -1.2
Budget balance, net of one-offs -8.5 -7.3 -5.6 -5.1 -3.3 -3.2 -2.4 -1.6 -1.2 -1.2
Structural balance -8.5 -6.6 -3.6 -3.0 -1.7 -2.3 -2.0 -1.8 -1.8 -1.9
Primary balance -8.2 -3.1 -0.8 0.0 -2.3 0.2 2.2 2.5 2.2 2.3
Structural primary balance -5.6 -2.3 1.3 1.9 3.2 2.3 2.2 2.1 1.8 1.6
Fiscal adjustment 0.1 3.3 3.6 0.6 1.3 -0.9 0.0 -0.1 -0.3 -0.2
Fiscal effort 0.1 1.9 3.1 0.6 1.3 -0.6 0.3 0.1 0.0 -0.1

3. Policy issues
23
including a review of medical panels as well as the
roll-out of a new monitoring system, both of which
should support the authorities in identifying
unnecessary sick leaves. These tools will initially
be implemented in the education sector, but will
then gradually be extended to the rest of public
administration should the measures be successful.
The more ambitious savings targets from the
spending review in 2018 represent a positive
development. According to the DBP, total
projected savings from the spending review
exercise in 2018 amount to around EUR 290
million (around 0.14% of GDP) in a single year,
considerably higher compared to the planned
cumulative savings of 0.1% of GDP over three
years that were announced in the 2017 budget.
Overall, while the inclusion of additional sectors
and the introduction of more ambitious savings
targets are welcome improvements, a broadening
of the exercise to cover an even more significant
share of public administration would represent
another positive step forward.
A range of reforms have improved the long-
term sustainability of the pension system in
recent years. While a number of recent
measures contribute to increase pension
expenditure the government has expressed its
commitment to duly factor in sustainability in
any new initiatives. A new early retirement
scheme without penalty for very long careers
entered into force in October 2017. While it is
estimated to result in 11500 early pensioners in
2018 that had been waiting to retire, the impact on
subsequent years should be smaller. In addition to
the regular pension update, an extraordinary
update was implemented in 2017 for low pensions,
in particular those which had not been updated
between 2011 and 2015. Another extraordinary
pension update for low pensions is planned for
1 August 2018. The lowest bracket of pensioners
was expanded for indexation purposes, while the
indexation of the index itself (The Social Support
Index), which is used for a range of social transfers
beyond pensions, was also unfrozen in 2017.
Extraordinary budget transfers to the Social
Security system are set to end in 2018. The
budget transfers to finance the Social Security
deficit are projected to end in 2018. This positive
development is being supported by the economic
upswing through a large projected increase
(+5.6%) in social contributions. A substantial
increase in pension expenditure (+5.1%) is also
foreseen; however, which combined with the
ending of the extraordinary transfers will lower the
surplus of the Social Security system from around
EUR 1.5 bn in 2017 to around EUR 1 bn in 2018.
Some specific tax revenue is being earmarked to
the sustainability of the pension system. In 2017,
the Portuguese authorities earmarked the revenue
deducted from the additional real estate tax
(Adicional ao IMI – Imposto Municipal sobre
Imóveis) to the reinforcement of the Financial
Stability Fund, which is expected to result in a net
amount of EUR 50 m. In 2018, 0.5% of the
corporate income tax revenue is set to be
earmarked to the Financial Stabilisation Fund. This
earmarking is planned to increase in a progressive
way by 0.5 pps. per year until it reaches 2% in
2021. This is projected to transfer EUR 70 m to the
Fund in 2018. The Fund will start financing
current expenditure in the Social Security system
in the mid-2020s.
Hospital arrears continued to increase during
2017, and the impact of proposed measures
remains unclear. Hospital arrears grew by EUR
480 m to October 2017. While the authorities have
highlighted growing personnel expenses and
increased demand as factors, the continued
accumulation of arrears also unveils a problem of
under-budgeting, monitoring and enforcement
practices in certain hospitals. The authorities have
announced the release of around EUR 400 m to
hospitals for the clearance of arrears before the end
of 2017. This will be complemented by capital
injections into hospitals of EUR 500 m in both
2017 and 2018, which should allow for a
substantial decrease in the stock of arrears. The
repeated injection of funds to clear arrears does
not, however, address the underlying reasons that
keep leading to their accumulation. Integrated
Responsibility Centres, which seek to give more
autonomy to hospital teams as a way of promoting
organisational innovation and efficiency, will
begin to be implemented in 2018. A joint Budget
Analysis Unit by the Ministry of Health and the
Ministry of Finance is also planned to be set up to
tackle the hospitals arrears problem and to increase
the quality of budget planning. Overall, it remains
uncertain to what extent planned measures will be
sufficient to stem the flow of arrears.

3. Policy issues
24
A series of cost saving measures are, however,
being introduced in the NHS as a whole. The
scope of centralised purchasing in the health sector
has increased significantly, rising from EUR 167
m in 2016 to EUR 654 m in 2017, and is projected
to reach EUR 702 m in 2018. This development is
supporting cost reduction, with EUR 35 m of
savings associated with the centralisation of NHS
purchasing in the first quarter of 2017. Regarding
medicines, the market share of biosimilars has seen
a large growth in the last two years due to
minimum-market share objectives and enhanced
information about both generics and biosimilars to
prescribers. More generally, annual medicine price
revisions and agreements with suppliers continue
to yield savings. The efficiency of hospital use has
also been increased by the setting up of a shared
resource management platform so as to facilitate
the use of NHS facilities and reduce reliance on
the private sector. In a similar vein, the enhanced
use of centralised digital platforms appears to
promote efficiency in some areas like vaccines,
medical exams, e-prescriptions and appointments.
While SOE operational results continue to
improve, debt levels remain elevated. The DBP
estimates a total net income of non-financial public
companies of EUR -461 m in 2017, which it
projects to fall to EUR -118 m in 2018, down from
EUR -1293 m in 2014. Although the unfreezing of
wages is putting pressure on operational
expenditures, operational results (EBITDA) of
SOEs generally improved between Q1-2016 and
Q1-2017, particularly in the transport sector,
although the results for the health sector are
worsening. While the DBP committed to limit the
overall growth of public company debt to 2% per
year(8) (net of capital increases and the financing
of new investments), total non-consolidated debt
of public corporations included in general
government remains high, at 19.0% of GDP
(approximately EUR 36 bn) in September 2017.
This represents a fall of 1.3 pp of GDP relative to
September 2016, while the debt of private
corporations fell by around 3.5 pps of GDP in the
same period(9)
Public recapitalisations of SOEs are ongoing
while a systematic approach to budgetary
(8) According to UTAM, the debt target limit for individual
SOEs is of 3% per year.
(9) Bank of Portugal, Statistical Bulletin, December 2017
transfers to SOEs remains essential. SOEs are
being recapitalised to reduce indebtedness and
improve financial results. To minimise moral
hazard, promote the right incentives and underpin
a solid, long-term improvement in SOE
sustainability, the current ad-hoc practice of
budgetary transfers to SOEs needs to be made
more predictable. The reviews of the public service
contracts in 2018 of Metro de Lisboa and Transtejo
and Soflusa, for instance, represent opportunities
to strike more stable and transparent agreements
on the procedures for state transfers.
Net Public-Private Partnership (PPP) payments
peaked in 2016, and the PPP framework law is
being applied. Net PPP payments from the
government amounted to around EUR 1.7 bn in
2016, and are projected to decrease slightly in
2017. Several new PPP contracts (up to four
healthcare provision services, Hospital Lisboa
Oriental) are foreseen but new potential payments
arising from these contracts are not included in the
net PPP payments forecast. The Metro de Porto
operation and maintenance contract(10
), set to be
signed in 2018, was the first new contract launched
within the framework of the 2012 PPP law, which
is projected to have resulted in savings. The health
contracts mentioned above should also be
structured according to the 2012 framework.
Renegotiations of existing PPPs are also ongoing,
particularly for motorways with the renegotiation
of Baixo Alentejo motorway already concluded..
Measures to improve monitoring and reporting
of SOE performance have been in the pipeline
for some time and are expected for 2018. The
implementation of an upgraded monitoring
mechanism is not set to be complete until 2018.
The evaluation of Activity and Budget Plans
(PAO) submitted by SOEs to UTAM (the Ministry
of Finance's task force on SOE monitoring) is set
to be made more comprehensive. In 2018, the
analysis of the impact of these plans on the balance
of public accounts will be carried out in a more
systematic way. Instruments ensuring the proper
implementation of the Activity and Budget Plans
will be put in place. In addition, a risk assessment
methodology is being set up and, if necessary, a
(10) The sub-concession contract of Metro do Porto was
attributed to Barraqueiro for seven years from 2018 onwards, giving the company the responsibility for all
regular metro operations as well as major revisions of the
fleet of rolling stock.

3. Policy issues
25
detailed cost reduction programme put in place for
at-risk SOEs. Accountability will also be improved
through the introduction of incentives for good
governance and for reaching objectives. SOE
investments will also be evaluated more closely on
a case-by-case basis.
The implementation of the reformed Budget
Framework Law (BFL) that entered into force
in September 2015 is experiencing delays. The
Law is designed to make budget units more
accountable and strengthen the medium- to long-
term focus of public finances and allowed for a
three-year transitional period for applying most
new features. The BFL's implementation unit has
convened several times and preparatory work
mostly in terms of IT systems setup has been
progressing, in particular as regards the state
accounting entity project (11
). In terms of
regulatory preparation a series of decree laws will
require adjustment and consolidation and the
decree law on the setup of the new budgetary
programmes will need to be prepared. The
effective application of the new accrual-based
public accounting framework is set to start in
January 2018. Given the cumulative delays in BFL
implementation, in particular the absence of
historical financial statements established in the
new accounting system, the 2019 budget will not
yet be prepared under the new framework. As full
completion by the 2018 target is not achievable,
the BFL will have to be amended to extend the
three-year transition period.
3.3. FINANCIAL AND CORPORATE SECTORS
Portugal plans to overhaul its supervisory
architecture in 2018. A working group was set up
to put forward proposals on a new financial
supervisory framework. Following four bank
failures over the past decade, the Portuguese
government is taking steps to revamp financial
oversight. The government invited a large and
diversified group of experts to present their
contributions on the evaluation of the current
Portuguese system of financial supervision and
their ideas for the changes needed. Following these
contributions, in January 2017, an independent
Working Group was commissioned to draft a
report with an assessment of the current system of
(11) A first opening balance sheet is planned to be established
for 1 January 2019.
financial supervision and to present a proposal for
the corresponding changes. This Working Group’s
report underwent a public consultation process in
October. The Ministry of Finance together with the
3 supervisors will table a law to the Council of
Ministers who will subsequently submit it to
Parliament. Supervisors will be officially invited to
further comment on the law in between these
different steps.
Preparations for achieving the mandated stock
of "bail-inable" instruments are on the horizon.
Although the exact amounts of the minimum
requirement for own funds and eligible liabilities
(MREL) are yet to be determined, most banks have
an estimate of their magnitude. Achieving the
mandated amounts by the end of the transition
period will in most cases imply a combination of
risk weighted assets reduction and wholesale
funding issuance. Domestic and foreign banks will
be operating on a similar timeline, and the
aggregate impact on the market is as of now
unclear. For Portuguese banks, most of which
aimed to decrease over the past years their
wholesale funding dependency, MREL may
represent a potential challenge, implying the need
for adequate timely strategies and a possible cost
increase.
The authorities and banks should keep up the
NPL reduction momentum. The legal framework
addressing the treatment of distressed corporate
debtors in difficulties has been revamped. Changes
include both out-of-court mechanisms (comprising
options for loans to equity swaps and the
replacement of the out-of-court regime for
corporate recovery) and judicial mechanisms such
as the pre-insolvency PER and the insolvency
procedure itself. The supervisory authorities also
facilitate the solution for NPLs through guidance
on best practices, NPL reductions plans and
acknowledgment of the NPL reduction effort in the
supervisory review and evaluation process.
Various NPL management solutions are being
implemented including a creditors' coordination
platform. With the new legal framework and
supervisory guidance in place, swift
implementation is now key to help accelerate NPL
resolution.
3. Policy issues
26
Identification of firms that are viable and those
that should be liquidated is crucial. The riskier
enterprises are deleveraging the fastest, but still
account for most of the corporate debt stock. A
third of all SME NPLs is over three years past due.
The recovery process of viable firms is being
facilitated but the proceedings for insolvent firms
remain long. The new set of rules for the judicial
restructuring of firms (PER) are meant to prevent
insolvent firms from misusing it. This will be
ensured through new requirements including a
declaration issued by an accountant or auditor
certifying that the company is not insolvent and
resulting in a first proposal of the recovery plan
with the agreement of at least 10% of creditors.
This should allow the distinction between solvent
firms recurring to PER and court insolvency
processes being used for insolvent firms. Besides,
an out-of-court regime for companies’ recovery
(RERE) has been developed. Whether it will
incentivise the use of faster out-of-court
proceedings, remains to be seen: while PER and
judicial liquidation result in a "judge-stamped"
document enforceable towards everyone, currently
out-of-court arrangements are only binding
towards participating creditors. Other new
instruments such as a Business Recovery Mediator
providing assistance to SMEs and a legal
framework for out-of-court collateral repossession
could further contribute to facilitate firms'
restructuring. Most difficulties remain on the side
of the proceedings for insolvent firms. Their
average duration is still high (around 40 months in
2016) with complex proceedings and the resulting
credit recovery rates are lower than European
averages.

4. SOVEREIGN FINANCING AND CAPACITY TO REPAY
27
Active debt management, in particular via
accelerated early repayments of IMF debt, is
smoothing the debt redemption profile. In
parallel to the buy-back of EUR 1.6 bn in debt
with short maturity as well as repeated bond
exchanges in 2017, a further EUR 4.7 bn in early
IMF repayment has been added to the EUR 5.3 bn
that were planned for 2017 at the time of the 6th
PPS report. This results in a total IMF early
repayment of around EUR 10.0 bn for the year.
The IMF repurchasing schedule has been moved
forward in view of above-target budget execution.
Given the acceleration in IMF repayment in 2017,
the planned amount for 2018 has been revised
downwards from EUR 5 bn to EUR 0.8 bn. Both
the IMF early repayments, the buy-backs and the
bond exchanges, thus also contribute to a
substantial smoothing of the redemption profile, in
particular as regards the redemption peak in 2021.
While higher in 2017 and 2018, state financing
needs are projected to remain broadly stable at
around EUR 14 bn per year until 2020. The
particularly high financing needs of EUR 27.2 bn
for 2017 can largely be attributed to the front-
loading of IMF early repayments. While lower
than 2017, financing needs for 2018 are still high
compared to those of 2019 and 2020. This can
primarily be explained by a higher cash deficit and
a higher acquisition of financial assets. Both the
deficit and the net acquisition of financial assets
are set to fall strongly in 2019 (by EUR 4.0 bn and
EUR 1.6 bn, respectively), and by an additional
EUR 1.1 bn and EUR 1.3 bn in 2020. The cash
buffer is projected to decrease from EUR 7.8 bn in
2017(12
) to EUR 6.8 bn for 2018 and EUR 6.5 bn
for 2019, before rising to EUR 10 bn in 2020
ahead of the high redemptions in 2021 (where a
EUR 6 bn draw-down will bring the cash position
to EUR 4 bn by year-end). Overall, in line with the
expected broadening of the investor base following
the improved credit ratings from Standard & Poor
in September and Fitch in December, the cash
buffer is thus planned to be decreased from around
50% to around 40% of yearly medium-to-long-
term financing needs. The Debt Management
Office (DMO) has indicated that it has no plans to
further reduce this buffer at this stage.
(12) As of early January 2018, the authorities expect the final
2017 cash buffer to have significantly exceeded the
estimate presented in early December 2017 (by around
EUR 2bn).
Despite past interest rate volatility, yields on
Portuguese bonds have fallen steadily
throughout most of 2017. After peaking at 4.3%
in mid-March, yields on Portuguese 10-year bonds
hovered slightly below 1.8% by mid-December
(18 December). The decreasing trend of the yields
preceded Standard & Poor's decision on 15
September to upgrade Portugal's rating to BBB-
investment grade, although the latter clearly had an
additional impact as Portuguese yields dropped by
around 0.4 pps in the immediate days that
followed. Fitch announced an upgrade to
Portugal's credit rating on 15 December by two
notches from BB+ (positive outlook) to BBB
(stable outlook). The upgrade from a second major
ratings agency allows Portuguese debt to re-join
big bond indices and thus for a broadening of the
investor base and lower funding costs. Portuguese
yields have now fallen below those of Italy,
although they remain somewhat higher than those
of Spain (1.44%) (18 December).
According to the Portuguese Ministry of
Finance, public debt is projected to fall by 3.9
pps to 126.2% of GDP in 2017, 2.8 pps to 123.5%
in 2018 and by 4.3 pps to 119.2% of GDP in 2019.
The Commission autumn forecast projects a
similar downward path expecting Portugal’s gross
public debt-to-GDP ratio to decline to 126.4% in
2017, 124.1% in 2018 and 121.1% in 2019. It
should be noted, however, that the latest
Commission DSA (Autumn Forecast 2017)
showed that the Portuguese debt trajectory
remained highly sensitive to growth and interest
rate volatility.
Sovereign financing and the capacity to repay
are currently not a reason for concern but
yields remain vulnerable to financial market
conditions and the private and public debt
overhang. The capacity to repay remains sound in
the short-term with falling yields facilitating
funding conditions. The IMF repayments have
helped to smooth the debt redemption profile and
reduce interest rate costs. In the medium term, the
redemption profile is expected to improve and
gross financing needs to decline. Further efforts in
fiscal consolidation and structural reforms would,
however, be key in ensuring a sound capacity to
repay in the long-term.

4. Sovereign financing and capacity to repay
28
Graph 4.1: 10-year government bond yields
Source: European Commission
Graph 4.2: Redemption profile
(1) Last update: 16 November 2017
Source: IGCP
-0.5
0.0
0.5
1.0
1.5
2.0
2.5
3.0
3.5
4.0
4.5
5.0
Dec
-14
Feb
-15
Ap
r-15
Jun
-15
Au
g-15
Oct
-15
Dec
-15
Feb
-16
Ap
r-16
Jun
-16
Au
g-16
Oct
-16
Dec
-16
Feb
-17
Ap
r-17
Jun
-17
Au
g-17
Oct
-17
Dec
-17
Italy Portugal Germany Spain
%
0
3
6
9
12
15
18
21
24
2017 2021 2025 2029 2033 2037 2041 2045
EUR billions
Tbills
EFSF
EFSM
EFSM (final maturity to be confirmed)
IMF
Other medium and long term debt
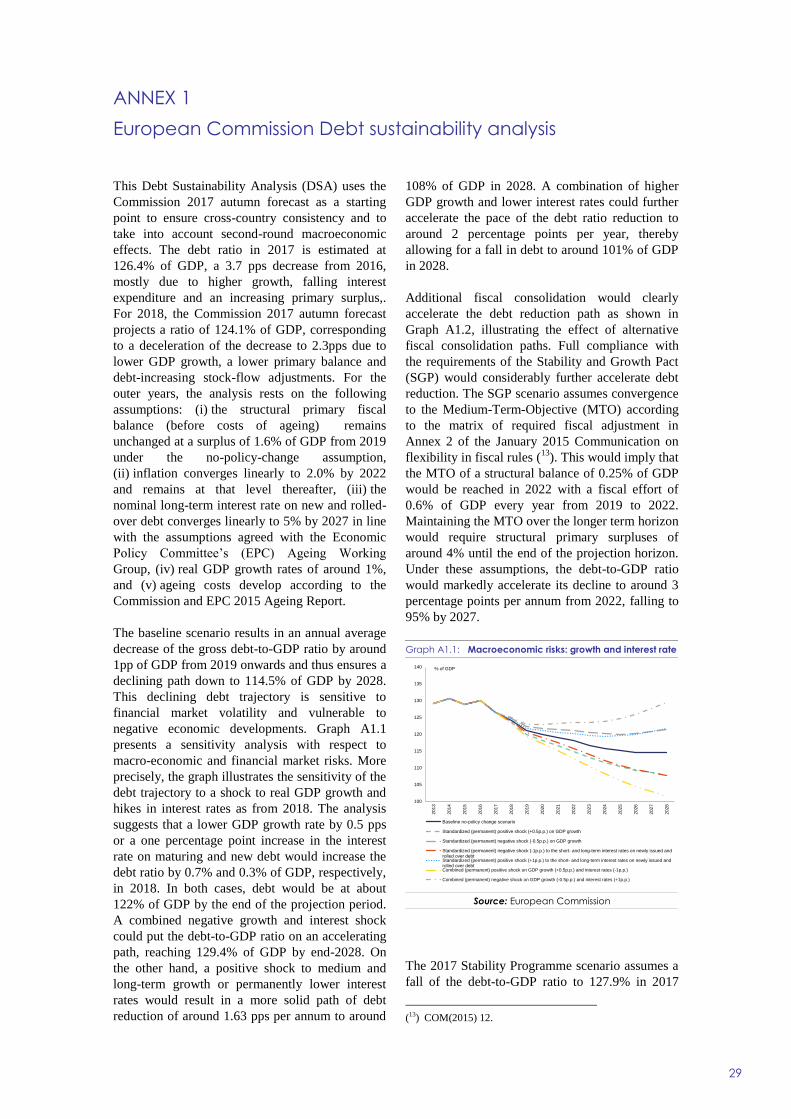
ANNEX 1
European Commission Debt sustainability analysis
29
This Debt Sustainability Analysis (DSA) uses the
Commission 2017 autumn forecast as a starting
point to ensure cross-country consistency and to
take into account second-round macroeconomic
effects. The debt ratio in 2017 is estimated at
126.4% of GDP, a 3.7 pps decrease from 2016,
mostly due to higher growth, falling interest
expenditure and an increasing primary surplus,.
For 2018, the Commission 2017 autumn forecast
projects a ratio of 124.1% of GDP, corresponding
to a deceleration of the decrease to 2.3pps due to
lower GDP growth, a lower primary balance and
debt-increasing stock-flow adjustments. For the
outer years, the analysis rests on the following
assumptions: (i) the structural primary fiscal
balance (before costs of ageing) remains
unchanged at a surplus of 1.6% of GDP from 2019
under the no-policy-change assumption,
(ii) inflation converges linearly to 2.0% by 2022
and remains at that level thereafter, (iii) the
nominal long-term interest rate on new and rolled-
over debt converges linearly to 5% by 2027 in line
with the assumptions agreed with the Economic
Policy Committee’s (EPC) Ageing Working
Group, (iv) real GDP growth rates of around 1%,
and (v) ageing costs develop according to the
Commission and EPC 2015 Ageing Report.
The baseline scenario results in an annual average
decrease of the gross debt-to-GDP ratio by around
1pp of GDP from 2019 onwards and thus ensures a
declining path down to 114.5% of GDP by 2028.
This declining debt trajectory is sensitive to
financial market volatility and vulnerable to
negative economic developments. Graph A1.1
presents a sensitivity analysis with respect to
macro-economic and financial market risks. More
precisely, the graph illustrates the sensitivity of the
debt trajectory to a shock to real GDP growth and
hikes in interest rates as from 2018. The analysis
suggests that a lower GDP growth rate by 0.5 pps
or a one percentage point increase in the interest
rate on maturing and new debt would increase the
debt ratio by 0.7% and 0.3% of GDP, respectively,
in 2018. In both cases, debt would be at about
122% of GDP by the end of the projection period.
A combined negative growth and interest shock
could put the debt-to-GDP ratio on an accelerating
path, reaching 129.4% of GDP by end-2028. On
the other hand, a positive shock to medium and
long-term growth or permanently lower interest
rates would result in a more solid path of debt
reduction of around 1.63 pps per annum to around
108% of GDP in 2028. A combination of higher
GDP growth and lower interest rates could further
accelerate the pace of the debt ratio reduction to
around 2 percentage points per year, thereby
allowing for a fall in debt to around 101% of GDP
in 2028.
Additional fiscal consolidation would clearly
accelerate the debt reduction path as shown in
Graph A1.2, illustrating the effect of alternative
fiscal consolidation paths. Full compliance with
the requirements of the Stability and Growth Pact
(SGP) would considerably further accelerate debt
reduction. The SGP scenario assumes convergence
to the Medium-Term-Objective (MTO) according
to the matrix of required fiscal adjustment in
Annex 2 of the January 2015 Communication on
flexibility in fiscal rules (13
). This would imply that
the MTO of a structural balance of 0.25% of GDP
would be reached in 2022 with a fiscal effort of
0.6% of GDP every year from 2019 to 2022.
Maintaining the MTO over the longer term horizon
would require structural primary surpluses of
around 4% until the end of the projection horizon.
Under these assumptions, the debt-to-GDP ratio
would markedly accelerate its decline to around 3
percentage points per annum from 2022, falling to
95% by 2027.
Graph A1.1: Macroeconomic risks: growth and interest rate
Source: European Commission
The 2017 Stability Programme scenario assumes a
fall of the debt-to-GDP ratio to 127.9% in 2017
(13) COM(2015) 12.
100
105
110
115
120
125
130
135
140
2013
2014
2015
2016
2017
2018
2019
2020
2021
2022
2023
2024
2025
2026
2027
2028
Baseline no-policy change scenario
Standardized (permanent) positive shock (+0.5p.p.) on GDP growth
Standardized (permanent) negative shock (-0.5p.p.) on GDP growth
Standardized (permanent) negative shock (-1p.p.) to the short- and long-term interest rates on newly issued androlled over debtStandardized (permanent) positive shock (+1p.p.) to the short- and long-term interest rates on newly issued androlled over debtCombined (permanent) positive shock on GDP growth (+0.5p.p.) and interest rates (-1p.p.)
Combined (permanent) negative shock on GDP growth (-0.5p.p.) and interest rates (+1p.p.)
% of GDP

1. European Commission Debt sustainability analysis
30
and 124.2% for 2018. Based on the assumptions of
increasing primary surpluses, a context of low
interest rates and real GDP growth at around 2%
from 2019 onwards, the debt-to-GDP ratio in the
Stability Programme is projected to decrease
rapidly to 120.0% at end-2019 and 117.6% at end-
2020. Such a scenario would be consistent with
around 0.5% of GDP improvement in the structural
balance for 2017-2020. From 2021 onwards, the
primary structural surplus has been projected to
remain at around 4% over the entire forecast
period, which would contribute to a significant fall
in the debt ratio to reach 86% of GDP by 2028.
Graph A1.2: Fiscal consolidation and ageing costs
Source: European Commission
Overall, the debt sustainability analysis shows that
in the baseline scenario the debt-to-GDP ratio
declines substantially in the short-term and
moderately in the medium-term. However, it
would still be at a high level and remain vulnerable
to macro-economic and financial-market shocks.
On the other hand, a solidly declining trajectory of
the debt-to-GDP ratio can be achieved by
maintaining fiscal discipline over the medium to
long-term horizon. In addition, the solid reduction
path crucially hinges on medium and long-term
economic growth, which points to the necessity of
persevering with the implementation of structural
reforms.
80
90
100
110
120
130
140
2013
2014
2015
2016
2017
2018
2019
2020
2021
2022
2023
2024
2025
2026
2027
2028
Baseline no-policy change scenario No-policy change scenario without ageing costs
Stability and Growth Pact (SGP) scenario Stability Programme (SP) scenario
% of GDP

ANNEX 2
MIP specific monitoring
31
A2.1. OUTLOOK AND EVOLUTION OF
IMBALANCES
In February 2017, Portugal was identified as
experiencing excessive macroeconomic
imbalances in the context of the MIP. The
identified imbalances mainly relate to the large
stock of external liabilities, public and private
debt, and the labour market adjustment process in
a context of low productivity growth. Important
vulnerabilities were also identified in the banking
sector, particularly in regard to the high share of
non-performing loans (NPLs). The Country-
Specific Recommendations (CSRs) under the
European semester provided guidance for the
policy follow-up. These recommendations concern
a wide range of policy domains: (CSR1) public
finances, including state-owned enterprises;
(CSR2) labour market; (CSR3) financial sector,
particularly non-performing loans; and (CSR4)
administrative burden and business environment.
All CSRs are considered MIP relevant.
Portugal's economic growth picked up to 2.9% in
the first half of 2017 and moderated to 2.5% in the
third quarter of the year, mainly driven by
investment and exports. Employment grew even
faster than GDP, particularly in labour-intensive
services related to tourism, while wage growth
remained subdued. Despite some slowdown,
economic performance is expected to remain
strong in 2018 and 2019 amid further export
growth and lower unemployment. HICP inflation
is projected to remain relatively stable at around
1.5% over the forecast horizon with a slightly
higher increase in service prices.
The current account (CA) has retained a small
surplus over the past years contributing to a
reduction in the negative international investment
position (NIIP). The share of NIIP in GDP
improved from 112.0% at the end of 2015 to
104.7% at the end of 2016 but reversed to -105.2%
as of September 2017. This reversal in 2017 is due
to valuation changes from the increased price of
Portuguese government bonds held by non-
residents, accounting for about 3% of GDP. The
pace of adjustment is expected to remain
insufficient to achieve a substantial improvement
in the external position, as the CA is forecast at a
surplus of 0.1% of GDP in 2017 and 0.2% in both
2018 and 2019. The structure of external liabilities
improved in the past years due to the shift from
debt to FDI instruments. The FDI component in
NIIP widened to 33.0% as of September 2017
relative to 29.9% at the end of 2016 and 26.3% at
the end of 2015. The share of net external debt to
GDP meanwhile contracted from 100.8% at the
end of 2015 to 94.5% at the end of 2016 and
92.3% as of September 2017.
Private debt is on a steady downward path since its
peak in 2012 and the outlook remains favourable.
In consolidated terms, the private debt–to-GDP
ratio fell from 210.3% at end-2012 to 171.4% at
end-2016, declining in both the corporate and the
household sectors. Data for 2017 is available only
in non-consolidated terms but confirms that the
process of deleveraging continues with a slight
decrease in the absolute value of household debt
stock (active deleveraging), a relatively stable
value of corporate debt, as well as passive
deleveraging linked to the accelerated economic
growth, resulting in reduced debt ratios in both the
household and corporate sectors.
The high stock of NPLs remains a key
vulnerability of the financial system. While the
aggregate NPL ratio dropped from 17.9% in June
2016 to 15.5% in June 2017 (Banco de Portugal
data), it remains among the highest in the EU.
Corporate NPLs are a particular concern as they
account for 65% of the total NPL stock.
Following stabilisation at around 130% from 2013
to 2016, the debt-to-GDP ratio is forecast to follow
a clear downward path by an average of 3pps in
2017 and 2018. Some limited risk to the debt
reduction profile could arise from the contingent
capital mechanism included in the Novo Banco
sales agreement. The recent improvement in
macroeconomic variables, in particular nominal
and potential GDP growth, has made the structural
adjustment needed to ensure compliance with the
transitional debt rule less demanding.
The labour market continued to improve at a
strong pace. Unemployment dropped to
seasonally-adjusted 8.5% in September 2017 and
the year-average unemployment is projected to
decline from 11.2% in 2016 to 9.2% in 2017,
supported by strong employment growth. The
activity rate also improved and while the share of
long-term unemployed is still more than half of
total unemployment, it is decreasing in absolute
terms. Labour productivity declined slightly in

2. MIP specific monitoring
32
2016 as job creation outpaced economic growth.
Productivity is expected to drop further in 2017
due mainly to the high rate of job creation in
labour intensive sectors such as tourism-related
services and residential constructions. Unit labour
costs (ULC) increased broadly in line with main
trading partners as wage growth remained
subdued.
The deflated house price index increased to 6% in
2016. The growth rate rose further to 6.9% y-o-y
in the second quarter of 2017, along with a steep
rise in property transactions. The hikes are
concentrated in tourist areas, particularly in
Lisbon. Demand for real estate is expected to
remain strong but the impact on prices is likely to
be at least partly offset by growing supply from
new construction. In addition, the stock of
mortgage loans is still declining, which dampens
the upward pressure on house prices.
A2.2. POLICY MEASURES TAKEN TO ADDRESS
MACROECONOMIC IMBALANCES
External balance and competitiveness
Policy measures aimed at improving the business
environment would be important for both cost and
non-cost competitiveness. Measures in this
direction are being taken by the Portuguese
authorities namely by further increasing
administrative simplification, identifying ways to
further reduce restrictions in business services and
regulated professions and improving the judicial
system. More details are provided further below in
the section on the administrative burden and
business environment. Measures directed at
attracting FDI include the review of the Golden
Residence Permit Programme to incentivise
foreign business investment, simplification of the
VAT system on imports or increasing the number
of agreements for avoidance of double taxation
and their effective implementation.
Measures to improve the value-added of
Portuguese exports could further contribute to
improve non-cost competitiveness. This would
allow for larger CA surpluses and speeding-up the
NIIP reduction. In this context, Portugal has
launched an ambitious package of measures
(Industry 4.0, Start-up Portugal, Capacitar a
Indústria and Programme Interface) that target the
main concerns regarding business competitiveness:
internationalisation, improving business
environment, skills and innovation. All initiatives
are however at a very early stage of
implementation and the size of the competitiveness
impact is unclear.
The Qualifica Programme aims at upgrading the
skills of the labour force which could further
contribute to improve non-cost competitiveness.
Since 2011 there was a remarkable progress in
improving the skills level of the labour force. From
61% in 2011, the percentage of low skilled (i.e.
individuals with lower secondary education or
below) decreased to 48% in 2016 according to
Eurostat. However, the low skill level remains an
important barrier to productivity increases which is
evident when compared with the EU average
where only 18% of the labour force is low-skilled.
The new Qualifica Programme being implemented
by the government is an improvement compared
with previous qualification recognition
programmes since it includes a stronger training
component for participants. It has also a broad
coverage, through an expanded network of
qualification centres, expecting to reach half a
million participants up to 2019 focusing on low-
skilled workers.
Private indebtedness and access to finance
In order to improve access to finance, the
government has launched in 2016 the Capitalizar
programme. The programme is composed of a
broad range of measures and is being implemented
in different phases. A new measure being rolled
out is the creation of a new type of listed
companies (SIMFE) holding shares in unlisted
firms (SMEs and Mid-Caps) and a new type of
short term debt securities available to SMEs and
Midcaps in which Investment Funds and Pension
Funds may invest; the scope of the allowance for
corporate equity system is being broadened to
include capital increases through incorporation of
reserves. The regime for applying to the reversal of
tax liabilities on company directors is being
revised to incentivise the changing in companies
management by limiting the risk of reversal of past
tax liabilities.
Following an exhaustive analysis of the banks' bad
loans by type, vintage, size and sector of activity,
the issue of corporate NPLs is being addressed by
a three-pronged strategy: changes to the judicial,
2. MIP specific monitoring
33
legal and tax systems; prudential/supervisory
actions led by the central bank following SSM
guidance and NPL management solutions. The
strategy is comprehensive in terms of the issues
(see an overview in Box 1) being tackled and is
already being rolled out as many of the measures
announced have been either approved or are in an
early stage of implementation. Therefore, it is still
too soon to assess the strategy's effectiveness in
decreasing NPLs. This can only be done once all
of the measures are in implementation stage and
start producing effects.

2. MIP specific monitoring
34
(Continued on the next page)
Box A2.1: Strategy for NPL reduction
The judicial pillar of the strategy focuses on facilitating early restructurings of firms and speeding up
insolvency proceedings. In doing this it tries to ensure that non-viable companies are prevented from
applying for various pre-insolvency proceedings and thus benefitting creditors' protection – often used as a
strategy to delay the inevitable liquidation. This strategy is also focused on expediting insolvency
proceedings. A pre-condition for many of the measures is an efficient identification of firms that are viable
and those that should be liquidated. Measures include:
1) an early warning mechanism whereby managers of Portuguese firms receive user friendly
information about the economic and financial health of their companies, together with actionable
suggestions to deal with possible financial issues;
2) creation of a new group of insolvency practitioners–mediators assisting debtors in making a
diagnosis of their firm's situation, preparing restructuring plans and mediating deals with creditors;
3) a new legal framework to allow majority creditors to convert their credits into share capital
without the consent of shareholders and outside of an insolvency proceeding;
4) a new legal framework for voluntary out-of-court restructurings (RERE), which will benefit from
the same insolvency protection and tax treatment which currently is only available for court
sanctioned proceedings;
5) restricting access to the pre-insolvency proceedings (PER) to viable companies, preventing abuse
by non-viable firms (PER is based on the UK's best practice allowing for cross class cram downs
with a voting of a minimum of 50% of non-subordinated creditors);
6) expediting insolvency proceedings, through allowing creditors and insolvency administrators to
claim and rank credits electronically to allow rapid payment of undisputed claims thereby
reducing the cycle of cash-in-court;
7) flexibility for tax credits to be restructured and a common decision body between social security
and the tax authority to participate in restructuring negotiations;
8) simplification of the transfer of NPL portfolios by allowing bulk registration of transferred
collateral.
The supervisory pillar of the strategy focuses primarily on providing guidance to banks on how to efficiently
deal with NPLs. The set of measures/guidelines include:
1) NPL reduction plans – the 6 Portuguese banks with the highest NPL ratios submitted 5 year NPL
reduction plans (to Banco de Portugal/SSM). These banks have an average NPL ratio of 22% as of
end-2016 and are planning to reduce it to 10% by 2021. The main measures comprise sales of
NPLs and write-offs as well as cash recoveries and foreclosures. Banco de Portugal and SSM
assess the plans as ambitious but realistic and the implementation so far is considered on track;
2) SSM Guidance on NPLs – leveraging on the best practices/processes currently followed by several
member states;
3) improvements in data collection by Banco de Portugal supervision including for the purpose of
IFRS9 implementation.

2. MIP specific monitoring
35
Public debt: fiscal structural measures and
long-term sustainability of public finances
The public spending review in place since March
2016 is slowly being translated into implemented
measures. The review was originally focused on
education, healthcare, SOEs, public sector real
estate and centralised public procurement, to
which the government has since committed to add
the justice and internal affairs sectors. For the
Justice sector, a 'Closer Justice' Plan, announced
on 1 March 2016, has so far implemented 47
measures out of a planned 150, with a final
conclusion scheduled for 2019. It is estimated to
save EUR 4.1 m per year. Additionally, the
'Tribunal+' project, which seeks to optimise the
working time of the Officers of Justice, was
expanded in 2017 from a single pilot area to more
districts in Lisbon. Once it has expanded to 25
large and medium-sized courts by 2018, the
projected savings in working hours would amount
to about EUR 5.17 m per year. Furthermore, plans
are currently being developed to better deal with
the large amount of confiscated vehicles under
public management. A range of measures are also
planned for the internal affairs sector but still not
in implementation phase. The planned reforms
include the outsourcing of support functions to free
up resources for operations, the elimination of
redundancies and replicated administrative tasks
and an increase in efficiency through a more
strategic use of public investments for the security
forces within a multi-annual framework. Dealing
with the costs associated with absenteeism is also
being presented as a cross-cutting priority, in
particular in the education sector via review of
medical panels supplemented by the introduction
of a new monitoring model flagging potential
cases of false sick leaves. Following successful
implementation in the education sector, the
intention is to apply the use of these new tools
across the remaining sectors of public
administration. A performance-related scheme
with the aim of incentivising civil servants to
develop new ways of reducing expenditure without
compromising public service provision has also
been enacted. This scheme does not apply to
SOEs, however, and therefore not to hospitals
either.
Hospital arrears continue to increase while the
implementation of cost-reducing measures is still
outstanding. Hospital arrears increased by EUR
480 m in 2017 until October. The accumulation of
arrears unveils a problem of under-budgeting,
monitoring and enforcement practices. It should be
Box (continued)
Lastly, various NPL management solutions are part of the third pillar of the comprehensive strategy. The
key measures are mostly system-wide proposals being put forward by private entities:
1) ‘bulk transfer’ of assets away from the system – it has limited potential given the heterogeneity of
the NPL stock and constraints such as capital level, public finances and the EU regulatory
framework (BRRD, State Aid). Nonetheless, targeted asset transfers may merit consideration for
specific asset types and selected banks;
2) "coordination platform" – a specific approach initiated by the banks with most significant NPL
levels to deal with NPLs from non-financial companies which are viable but under financial stress.
The goal is to promote enhanced creditor coordination to expedite credit restructuring and/or NPL
sales, while also attracting some public and private funds and technical assistance for the
restructuring of viable firms;
3) steps have also been taken to tackle constraints to the recovery of NPLs:
a. the ability for banks to recognise for tax purposes write-offs once these are required from an
accounting and regulatory perspective;
b. the incentive to the creation of a secondary market for NPLs, by facilitating the entry into the
market of new servicing companies.

2. MIP specific monitoring
36
noted that the arrears are caused by a select
number of underperforming hospitals and not by
the National Health Service (NHS) as a whole. The
announced release of around EUR 400 m to
hospitals for the clearance of arrears before year-
end, accompanied by capital injections into
hospitals of EUR 500 m in both 2017 and 2018,
should allow for a substantial decrease of arrears in
the coming months. However, the pattern of
periodic injections of funds for clearance of arrears
appears to leave unaddressed the underlying
reasons for the general trend of arrears
accumulation. A joint Budget Analysis Unit by the
Ministry of Health and the Ministry of Finance is
planned to be set up to tackle the hospitals arrears
problem. The implementation of the so-called
Integrated Responsibility Centres, with the aim of
increasing efficiency through enhanced autonomy
to hospital teams, is also in preparation for 2018.
A series of reforms have, however, been
implemented with the aim of reducing costs in the
NHS. In the case of medicine, a series of measures
including further incentives for the use of generics,
continuation of paybacks, clawbacks and further
renegotiations with the pharmaceutical industry
have partly counterbalanced expenditure increases
from innovations and thus allowed for a
stabilisation of expenditure in percentage of GDP.
An independent evaluation of the data for the first
quarter of 2017 estimated EUR 35 m of savings
associated with the centralisation of NHS
purchasing. In 2017, new agreements were also
negotiated in the areas of clinical analysis,
Haemodialysis, Radiology, Pathological Anatomy
and Nuclear Medicine with an annual projected
cost-reduction of EUR 14.6 m. The financial
management of the regional health administrations,
which in the past had led to delayed payments and
sometimes heavy financial penalties, has been
centralised for a range of areas in order to reduce
the creation of new arrears. The shared services
have also increased efficiency of hospital use by
setting up a shared resource management platform
so as to facilitate the use of NHS facilities and
reduce reliance on the private sector. Enhanced use
of further centralised digital platforms tends to
increase efficiency in a series of areas including
vaccines, medical exams, e-prescriptions and
appointments. Finally, steps have been taken in the
fight against fraud through the creation of the
Control and Monitoring Centre of the NHS, where
virtually all payments will be verified. A newly
established Group on Prevention and Fight against
Fraud has already identified and transmitted a set
of cases worth EUR 21 m euros to the public
prosecutor in the first half of 2017. The on-going
process of digitalisation is also facilitating the
detection of fraud. The earmarking of the
extension of alcoholic drinks tax (IABA) to
sweetened drinks (levy on drinks with added sugar
that is expected to yield EUR 70 m in 2017) is
intended to address the sustainability of the
National Health Service.
A new early retirement scheme without penalty for
very long careers entered into force in 2017. It
allows citizens that are now 60 years or more and
that have made contributions to the social security
for 48 years or more to retire without penalty
before the general retirement age of (in 2018) 66
years and 4 months. This new regime applies to
both pensioners of the general social security
scheme and pensioners of the public sector legacy
regime (Caixa Geral de Aposentações) and will be
fully operational from 2018. In 2017, the lowest
bracket for pension indexation was expanded from
1.5 to 2 times the Social Support Index (the Social
Support Index has been unfrozen reaching EUR
421.32 in 2017 and is set to be updated annually).
In 2017, in addition to the regular pension update
in January there was an extraordinary update in
August. The extraordinary update was intended to
compensate for the loss of purchasing power of the
lowest pensions in particular those which had not
been updated at all between 2011 and 2015, a
measure that benefited around 2 million
pensioners. A new extraordinary increase of lower
pensions is planned for 1 August 2018, and is
expected to cover again around 2 million
pensioners. In the non-contributory part of the
social security system, the reference value of the
Solidarity Supplement for the Elderly (CSI)
increased in line with the level of observed
inflation in 2017, after having already been
increased by EUR 150 per year in 2016. On the
revenue side, in 2017 the Portuguese authorities
earmarked the revenue deducted from the
additional real estate tax (Adicional ao IMI –
Imposto Municipal sobre Imóveis) to the
reinforcement of the Social Security Financial
Stabilisation Fund. A portion of the Corporate
Income Tax is also planned to be progressively
earmarked to the Financial Stabilisation Fund
starting in 2018. According to the authorities,
higher contributions, lower unemployment and a
2. MIP specific monitoring
37
more efficient system will entail that no more
extraordinary transfers to the social security
system will need to be made in 2018.
While the financial position of SOEs is improving,
the implementation of new reporting mechanisms
has been slow. A new data gathering system based
on SIRIEF, which automatically draws information
from the accounting systems of public companies,
was in a pilot phase in 2017 and will be widely
applied in 2018. Activity and Budget Plans (PAO),
which are submitted by SOEs to UTAM (the
Ministry of Finance's task force on SOE
monitoring), are beginning to be evaluated more
comprehensively and with a longer time horizon (3
years). In 2018 the analysis of the impact of these
plans on the balance of public accounts will no
longer be limited to larger companies or groups
and will be carried out in a more systematic way.
Beginning in 2018, instruments ensuring the
proper implementation of the Activity and Budget
Plans will be put in place. These include early
warning mechanisms, which will enable a faster
identification of deviations from the PAO and the
adoption of corrective strategies. In addition, a risk
assessment methodology is being set up, allowing
public companies to be ranked by their degree of
risk so as to prioritise the follow-up effort. If it is
considered necessary, a detailed cost reduction
programme could be required by at-risk SOEs,
which should include measures to generate savings
and improve efficiency. These savings must be
quantified and explained. Accountability will also
be improved through the introduction of incentives
for good governance and for reaching objectives,
such as financial rewards for successful managers.
SOE investments will also be evaluated more
closely on a case-by-case basis, with due attention
being paid to the return on investment from the
perspective of the provision of public goods and
services, the timing of investments and their
financial details, and the financing structure and
results to be achieved. A debt management plan
and recapitalisation is ongoing to reduce
indebtedness and lower interest costs with the
central government taking over SOEs debt. In
some cases the credit given to the company by the
central government is then converted into capital
reducing the indebtedness. This creates moral
hazard risks as enterprises are less motivated to
improve efficiency and financial performance. A
series of reforms have been put forward, however,
to improve the monitoring and efficiency of SOEs
as explained in the above paragraph.
Labour market: segmentation, long-term
unemployment and wage setting
The government's strategy to reduce segmentation
has relied mainly on changes in temporary
contracts rules and its effectiveness remains
limited. Discussions with social partners are
ongoing regarding the possibility to revoke the
Labour Code norm that allows hiring long-term
unemployed and people looking for their first job
on fixed-term contracts without further
justifications. A reinforcement of labour
inspectorates, aimed to prevent abuse of temporary
contracts and "bogus" self-employment, is
ongoing. Hiring support measures are increasingly
restricting support if the employer offers a
temporary contract. The authorities are considering
differentiating firms' social security contributions
according to the type of employment contract used
and making hiring under temporary contracts
relatively more expensive. Such a measure would
need to take into account that some job positions
are inherently of a temporary nature.
Implementation will not be earlier than 2019.
While changes in temporary contract rules can be
useful, they are not providing enough incentives to
hire more on open-ended contracts. Changes in
temporary contract rules do not tackle the
underlying problem of remaining rigidities
concerning individual dismissals of permanent
workers. This includes for example the uncertainty
in terms of firing costs highlighted in the 2017
Country Report, the lack of clarity concerning
conditions under which employers can dismiss
individual workers for economic reasons, or the
still complex procedural requirements highlighted
by the OECD 2017 report on labour market
reforms in Portugal. Measures to tackle labour
market segmentation are currently under
discussion with social partners, based on the Green
Paper on Labour Relations presented in March
2017. However, the issues for discussion being put
forward by the government to the social partners
are still focused on changing the framework for
temporary contracts and not on tackling rigidities
in permanent ones.
Active labour market policies are increasingly
focused on long-term unemployed and other

2. MIP specific monitoring
38
vulnerable groups. The planned one-stop-shops for
employment will provide integrated services to
individuals and employers giving different options
depending on their profile and ensure coordination
with other public services, notably social services.
Implementation is planned for Q1-2018 and the
goal is to improve the effectiveness of activation
measures focusing on the long-term unemployed,
younger and older workers.
In a context of moderate wage growth, wage floors
are increasingly binding with the rise in the
minimum wage. The government has initiated
discussions with social partners in view of an
agreement for the level of minimum wage in 2018.
The government's proposal is to increase the
minimum wage in 2018 but there is still no
agreement on the amount. The final decision needs
to account for the possible impact on employment
of lower skilled workers and on competitiveness in
particular given the fact that the minimum wage
increased already by 15% since 2014. The
quarterly reports on the impact of the minimum
wage produced by the government provide a good
basis for the discussions. According to the latest
publication, 22.7% of workers were covered by the
minimum wage at the end of the first semester of
2017.
The reinstatement in June 2018 of the expiry rule
should create the right incentives for a dynamic
collective bargaining system. According to a rule
introduced in 2009, if a collective agreement is not
renewed it will expire following a legally set
period after its end date. This expiry rule gave
parties in new negotiations, and in particular
workers, the incentive to reach an agreement given
the risk of not being covered by a collective
agreement. It prevented therefore the perpetuation
of collective contracts allowing wage setting to be
more responsive to productivity developments.
Even though the number of collective agreements
is steadily increasing since 2012, in January 2017
the government and the majority of social partners
agreed not to use the expiry rule for collective
agreements for a period of 18 months until June
2018. The objective of the government was to give
an incentive to conclude negotiations which were
stalling due to some pressure by employers.
Discussions with social partners are ongoing to
redesign the expiry rule by June 2018 in order to
give workers and employers the incentives to
engage in collective bargaining.
Quasi-automatic administrative extensions of
collective agreements to the entire economic sector
are increasing in a context of overall increase in
collective bargaining. In the first half of 2017 an
increase in the number of administrative
extensions of collective agreements was recorded
(31), amounting to more extensions as in the entire
2016. The quasi-automatic extensions of
agreements with low coverage rates of both
employer organisations and trade unions can lead
to the imposition of a large number of
sector/occupation wage floors which do not
necessarily represent the economic realities of non-
signatory firms. However, a government resolution
of June 2017 (82/2017) revokes the proportionality
criteria for extensions (at least 30% of the
signatories of the agreement should be SMEs) and
introduces the possibility of the issuance of
administrative extensions by government initiative.
The impact of these new rules will need to be
monitored in the following quarters.
Administrative burden and business
environment
Administrative simplification is ongoing and can
improve the business environment. The measures
being implemented under the SIMPLEX+
programme are set to decrease the administrative
burden on citizens and companies. The programme
covers a broad range of areas in the public
administration and focuses mainly on horizontal
aspects of business activity. An assessment of the
impact of selected measures has been concluded
with positive results. Further simplification
measures are expected in 2018, in particular
improved interoperability between the one-stop-
shop for entrepreneurs and relevant competent
authorities. An ex-ante legislative impact
assessment started to be carried out as a pilot in
March 2017 (Custa Quanto). The aim is to reduce
the burden on businesses caused by new legislative
acts. First results are positive; a more structured
evaluation of the pilot project will be done in
January 2018.
While there is still room to decrease construction
fees, access to finance is reportedly the most
significant barrier to construction. Licensing costs
are not a significant barrier for construction firms.
According to the companies in the sector, the lack
of credit and difficulties in access to finance are a
more important hurdle for new projects. The recent
2. MIP specific monitoring
39
rebound of construction activities as well as the
steep increase in newly issued building permits is
also largely influenced by the boom in the tourism
sector.
Barriers to competition in business services remain
but authorities are looking for ways to further
reduce them. The by-laws of certain regulated
professions are less ambitious than the framework
law in terms of opening up to competition. This is
particularly true for the most restrictive sectors
such as accountants, architects and lawyers. A
study undertaken by the Portuguese authorities
with the OECD and the European Commission is
ongoing to assess remaining restrictions in these
sectors. Once the final results are ready, in April
2018, the authorities will assess the need for
further action on this matter. Licensing has been
further streamlined, particularly in tourism, land
and environment, but its implementation across the
country is heterogeneous.
The capacity of the justice system to reduce the
length of proceedings and cases backlog is
improving gradually but the number of pending
cases is still high. In 2017 the European Council
recommended Portugal to increase the efficiency
of insolvency and tax proceedings. The clearance
rate in judicial and tax courts was above 120% of
new cases during 2016 allowing for an overall
decrease in the number of pending cases. A
decrease in the disposition time was also observed
in the tax courts. While results are improving, the
large backlog of cases requires efforts to continue
in this domain. The "Tribunal +" programme aims
at administrative simplification so that court clerks
spend less time doing general administrative work
and can focus more on their core tasks. In the
pilot-project, 1/3 of the office clerks were able to
drop completely administrative functions. The
increased efficiency of the administrative services
will allow further decrease the case backlog and
lower disposition time. In May a Government
Ordinance (178/2017) created the “one-stop” court
services for the Administrative and Fiscal Courts
which should help make internal procedures more
efficient.
A2.3. CONCLUSION
Since spring 2017, measures were rolled out to
stimulate the reduction in NPLs and improve some
elements of the business environment. The
banking sector has started implementing a
comprehensive strategy for the reduction of NPLs,
including measures for improving the legal
framework and speeding up insolvency
proceedings as well as concrete reduction targets
by banks. As most measures are still in an early
stage of implementation it is still not possible to
assess their effective capacity in reducing the level
of NPLs. Simplification measures and an impact
assessment (Custa Quanto) to reduce
administrative burden together with improvements
in the judicial system are being put in place to
improve the business environment.
There is however uncertainty regarding the
adoption and implementation of several key reform
initiatives. Some important policy measures
remain incomplete or are still at an early stage of
their legislative approval. These include fiscal-
structural reforms to improve the sustainability of
public finances or measures to tackle labour
market segmentation. In terms of labour market
segmentation, measures taken have mostly covered
changing rules to temporary contracts. To
effectively reduce segmentation more direct legal
incentives are likely to be needed to hire on open-
ended contracts. There is also considerable scope
to improve the sustainability of public finances, for
example by implementing better expenditure
control for state-owned enterprises, in particular in
the health sector and ensuring medium- and long-
term sustainability of the pension system. Portugal
has requested technical support from the Structural
Reform Support Service (SRSS) to implement
reforms in the areas of budget framework and
administrative burden.

2. MIP specific monitoring
40
Table A2.1: State of Play of the implementation of MIP relevant reforms
(Continued on the next page)
Announced measures Adopted measures Implemented measures Sources of commitment
According to the authorities, some EUR 75 m
have been saved by the expenditure review in
2017.
The 'Closer Justice' Plan has, since March 2016,
implemented 47 out of 150 measures.
Conclusion is scheduled for 2019. It is
estimated to save EUR 4.1 m per year.
The 'Tribunal +' project, which seeks to
optimise the working time of the Officers of
Justice, was expanded in 2017 from one pilot
area to several Lisbon districts.
For SOEs with a negative EBITDA establish the
objective of an EBITDA near zero for 2018.
Upgrade to an automatic reporting mechanism
is still in a pilot phase, and will not be fully
implemented until 2018.
Reducing the weight of operating expenses in
turnover by continuing a policy of optimisation.Continuous recapitalisation of SOEs.
Review of economic and financial efficiency
metrics per company.Increase monitoring and reporting of SOEs.
Review of public service contracts of a range of
SOEs, particularly in the transport sector.
Announced measures Adopted measures Implemented measures Sources of commitment
Savings of EUR 166 m are expected to be made
in the health sector in the context of the
expenditure review in 2018 through, inter alia,
a review of prices and contributions; review of
the NHS technology assessment system;
medical devices; reinforcement of budget
monitoring and savings associated with debt
repayment.
Centralisation of NHS purchasing;
renegotiation of agreements in a range of
medical sectors; centralisation of financial
management to reduce flow of arrears; shared
resource management platform set up so as to
facilitate the use of NHS facilities and reduce
reliance on private sector; Control and
Monitoring Centre of the NHS established to
combat fraud; creation of Group on Prevention
and Fight against Fraud.
Strengthening of the monitoring mechanisms
of the budgetary execution of NHS entities. To
be achieved primarily through the creation of a
Budget Analysis Unit designed for this purpose,
in a joint initiative between the Ministries of
Health and Finance.
The earmarking of the extension of alcoholic
drinks tax (IABA) to sweetened drinks is
intended to address NHS sustainability.
The State budget is envisaging the earmarking
of up to 2 % of the Corporate Income Tax
revenue to the social security system in a
progressive way in 2018.
The Portuguese authorities earmarked the
revenue deducted from the additional real
estate tax to the reinforcement of the Financial
Stability Fund.
Recent reforms to the pension system, such as
the extraordinary increases to pensions and
particularly the changes to the early retirement
rules for long careers, risk deteriorating the
long-term sustainability of the pension system.
Announced measures Adopted measures Implemented measures Sources of commitment
Revoke the Labour Code norm that allows
hiring long-term unemployed and people
looking for their first job on fixed-term
contracts without further justifications.
Differentiate firms' social security contributions
by type of employment contract used making
temporary contracts more expensive. To be
implemented only in 2019.
Announced measures Adopted measures Implemented measures Sources of commitment
Support to the creation of entrepreneurial
projects and self-employment will be evaluated
and the re-evaluation of the Contratos
Emprego-Inserção will be implemented to
bring them back to their original goal in
activating the unemployed and the inactive.
One-stop-shops integrating social and
employment services with a stronger focus on
activation of self-employment.
CSR 2 – 2017: Ensure the effective activation of
the long-term unemployed.
Announced measures Adopted measures Implemented measures Sources of commitment
Suspension of use of the expiry rule for
collective agreements for a period of 18
months until July 2018.
Revoking the proportionality criteria for
administrative extensions of collective
agreements.
CSR 2 – 2017: Together with social partners,
ensure that minimum wage developments do
not harm employment of the low-skilled.
MIP objective: improving the functioning of the labour market
MIP objective: Public debt
Public finances
Fiscal policy and fiscal governance
Broaden the expenditure review to also include
Justice and Internal Affairs. A special focus
from 2018 onwards will be the management of
human resources with the aim of reducing
public sector absenteeism. The legal treatment
of seized vehicles also constitutes an additional
focus for 2018. In total, around EUR 290 m of
savings from the expenditure review are
estimated for 2018.
A performance-related pay scheme rewarding
civil servants who contribute with ideas leading
to lower expenditure without compromising
public service delivery.
CSR 1 – 2017: Step up efforts to broaden the
expenditure review to cover a significant share
of general government spending across several
policies.
CSR 1 – 2017: To increase the financial
sustainability of state-owned enterprises set
sector-specific efficiency targets in time for the
2018 budget, improving state-owned
enterprises overall net income and decreasing
the burden on the state budget.
Long-term sustainability of public finances
CSR 1 – 2017: Strengthen expenditure control,
cost effectiveness and adequate budgeting, in
particular in the health sector with a focus on
the reduction of arrears in hospitals and ensure
the sustainability of the pension system.
Labour market
Employment protection legislation & framework for labour contracts
CSR 2 – 2017: Promote hiring on open-ended
contracts, including by reviewing the legal
framework.
Active labour market policies
Wages & wage setting

2. MIP specific monitoring
41
Table (continued)
Source: European Commission
Announced measures Adopted measures Implemented measures Sources of commitment
The issue of corporate NPLs is being addressed
by a three-pronged strategy:
Fiscal incentives for individuals investing in
firms which are undercapitalised.
Facilitate early restructurings; prevent
nonviable companies from recurring to pre-
insolvency proceedings and benefitting from
their standstill protections (NRP 2017).
CSR 3: Step up efforts to clean up the balance
sheets of credit institutions by implementing a
comprehensive strategy addressing non-
performing loans, including by enhancing the
secondary market for bad assets.
changes to the judicial, legal and tax
systems;
Setting up of a "coordination platform" by the
main banks to deal with corporate NPL.
The six largest banks with the highest NPL
ratios submitted plans to reduce NPLs to 10%
by 2021.
Reduce the private debt overhang (MIP Matrix
2017).
prudential and supervisory actions led by
the central bank following SSM guidance;
A new legal framework to allow majority
creditors to convert their credits into share
capital without the consent of shareholders
and outside of an insolvency proceeding.
Creation of a new group of insolvency
practitioners–mediators assisting debtors in
making a diagnosis of their firm's situation,
preparing restructuring plans and mediating
deals with creditors.
NPL management solutions.A new legal framework for voluntary out-of-
court restructurings (RERE).Capitalizar, a strategic plan to support firm
capitalisation is being implemented since 2016.
For 2018 measures aim at promoting capital
investment in SMEs.
Announced measures Adopted measures Implemented measures Sources of commitment
Facilitate access of SMEs to capital funds.
The conversion into capital of third party
credits has now the same tax regime as firm
capitalisation.
CSR 3: Improve the access to capital, in
particular for start-ups and small and medium-
sized enterprises.
Announced measures Adopted measures Implemented measures Sources of commitment
The SIMPLEX programme is being implemented
to reduce administrative burden to citizens and
businesses. An ex-ante assessment of legislation (Custa
Quanto ) has started in 2017 with the aim of
reducing the administrative burden on firms of
new measures.
Announced measures Adopted measures Implemented measures Sources of commitment
A study is ongoing to assess measures to
reduce restrictions in business services.
Implementation is expected for 2018.
CSR 4: tackle regulatory barriers in construction
and business services by the end of 2017.
Announced measures Adopted measures Implemented measures Sources of commitment
Expediting insolvency proceedings, including
reducing the cycle of cash-in-court.
"Tribunal +" is a measure that aims at reducing
the time court clerks spend on administrative
tasks so that more time is dedicated to their
core functions.
CSR 4: Increase the efficiency of insolvency and
tax proceedings.
Announced measures Adopted measures Implemented measures Sources of commitment
Acceleration of the processes related to public
investments to speed up project
implementation.
Increase in public investment of 40% in 2018 to
EUR 4.5 billion.
Acceleration in the execution of the European
Structural funds (NRP 2017).
Weak productivity dynamics weighs on
competitiveness and GDP growth (MIP Matrix
2017).
Announced measures Adopted measures Implemented measures Sources of commitment
Launch the Qualifica AP initiative, responding
to the needs of public administration staff
through the establishment of protocols with
the Qualifica Centers.
Qualifica Program specialising in adult
education and training and aimed at providing
counselling, guidance and referral to learning
pathways (NRP 2017).
Bottlenecks to productivity growth also remain
related to innovation performance and the low
skill level of the labour force (MIP Matrix 2017).
Announced measures Adopted measures Implemented measures Sources of commitment
An ambitious package of measures (Industry
4.0, Start-up Portugal, Capacitar a Indústria
and Programme Interface) was launched
targeting the main concerns regarding business
competitiveness: internationalisation,
improving business environment, skills and
innovation.
Improving competitiveness and decreasing
external debt (MIP Matrix 2017).
MIP objective: improving the external balance and productivity
Judicial system
Investment
Skills
Innovation performance
Business environment
Administrative burden
CSR 4: Implement a roadmap to further reduce
the administrative burden.
Regulatory barriers
MIP objective: reducing the debt levels of the private sector
Financial sector
Private indebtedness
Access to finance

ANNEX 3
European Commission macroeconomic and fiscal projections
(2017 autumn forecast)
42
Table 1: Use and supply of goods and services (volume)
Annual % change 2016 2017 2018 2019
1. Private consumption expenditure 2.1 1.9 1.6 1.6
2. Government consumption expenditure 0.6 0.4 0.5 0.5
3. Gross fixed capital formation 1.6 8.1 5.3 4.9
4. Final domestic demand 1.7 2.6 2.0 2.0
5. Change in inventories -- -- -- --
6. Domestic demand 1.5 2.6 2.0 2.0
7. Exports of goods and services 4.1 8.0 7.3 4.9
7a. - of which goods 4.3 7.5 8.4 5.1
7b. - of which services 3.4 9.3 4.5 4.3
8. Final demand 2.3 4.1 3.6 2.9
9. Imports of goods and services 4.1 8.0 7.2 5.2
9a. - of which goods 4.5 8.4 7.7 5.3
9b. - of which services 1.6 6.1 4.6 4.3
10. Gross domestic product at market prices 1.5 2.6 2.1 1.8
Contribution to change in GDP
11. Final domestic demand 1.7 2.6 2.0 1.9
12. Change in inventories + net acq. of valuables -0.2 0.0 0.0 0.0
13. External balance of goods and services 0.0 0.1 0.1 -0.1
Table 2: Use and supply of goods and services (value)
Annual % change 2016 2017 2018 2019
1. Private consumption expenditure 3.1 3.5 3.2 3.1
2. Government consumption expenditure 2.4 1.7 1.7 1.7
3. Gross fixed capital formation 1.7 9.9 6.5 5.9
4. Final domestic demand 2.7 4.1 3.4 3.3
5. Change in inventories -- -- -- --
6. Domestic demand 2.6 4.1 3.4 3.3
7. Exports of goods and services 1.8 10.6 8.7 6.3
8. Final demand 2.4 6.0 5.0 4.3
9. Imports of goods and services 0.9 11.1 8.6 6.7
10. Gross national income at market prices 3.6 4.1 3.6 3.3
11. Gross value added at basic prices 2.6 3.8 3.4 3.6
12. Gross domestic product at market prices 3.0 4.0 3.5 3.2
Nominal GDP, EUR bn 185.2 192.6 199.4 205.8
Table 3: Implicit price deflators
% change in implicit price deflator 2016 2017 2018 2019
1. Private consumption expenditure 1.0 1.5 1.5 1.5
2. Government consumption expenditure 1.8 1.3 1.2 1.2
3. Gross fixed capital formation 0.2 1.6 1.2 0.9
4. Domestic demand 1.0 1.5 1.4 1.4
5. Exports of goods and services -2.2 2.4 1.4 1.4
6. Final demand 0.1 1.8 1.4 1.4
7. Imports of goods and services -3.1 2.8 1.3 1.4
8. Gross domestic product at market prices 1.4 1.3 1.4 1.4
HICP 0.6 1.5 1.4 1.5

3. European Commission macroeconomic and fiscal projections (2017 autumn forecast)
43
Table 4: Labour market and cost
Annual % change 2016 2017 2018 2019
1. Labour productivity (real GDP per employee) -0.1 -0.3 0.9 0.9
2. Compensation of employees per head 2.1 1.6 1.7 1.8
3. Unit labour costs 2.2 1.9 0.8 0.9
4. Total population -0.3 -0.2 -0.1 0.0
5. Population of working age (15-74 years) -0.3 -0.2 -0.2 -0.1
6. Total employment (fulltime equivalent) 1.6 2.9 1.2 0.9
7. Calculated unemployment rate - Eurostat definition (%) 11.2 9.2 8.3 7.6
Table 5: External balance
levels, EUR bn 2016 2017 2018 2019
1. Exports of goods (fob) 52.7 58.2 63.9 68.1
2. Imports of goods (fob) 60.8 67.9 74.0 79.1
3. Trade balance (goods, fob/fob) (1-2) -8.1 -9.7 -10.2 -11.0
3a. p.m. (3) as % of GDP -4.4 -5.0 -5.1 -5.4
4. Exports of services 21.3 23.7 25.1 26.5
5. Imports of services 11.5 12.4 13.1 13.9
6. Services balance (4-5) 9.8 11.3 12.0 12.6
6a. p.m. 6 as % of GDP 5.3 5.9 6.0 6.1
7. External balance of goods & services (3+6) 1.7 1.6 1.8 1.6
7a. p.m. 7 as % of GDP 0.9 0.8 0.9 0.8
8. Balance of primary incomes and current transfers -1.5 -1.4 -1.3 -1.2
8a. - of which, balance of primary income -4.0 -4.0 -4.0 -4.0
8b. - of which, net current Transfers 2.5 2.6 2.7 2.8
8c. p.m. 8 as % of GDP -0.8 -0.7 -0.7 -0.6
9. Current external balance (7+8) 0.2 0.1 0.4 0.4
9a. p.m. 9 as % of GDP 0.1 0.1 0.2 0.2
10. Net capital transactions 1.7 1.8 1.8 1.9
11. Net lending (+)/ net borrowing (-) (9+10) 1.9 1.9 2.3 2.3
11a. p.m. 11 as % of GDP 1.0 1.0 1.1 1.1

3. European Commission macroeconomic and fiscal projections (2017 autumn forecast)
44
Table 6: Fiscal accounts
2016 2017 2018 2019
Taxes on production and imports 14.8 14.9 15.0 15.0
Current taxes on income, wealth, etc. 10.3 10.3 9.8 9.9
Social contributions 11.7 11.7 11.7 11.6
Sales and other current revenue 5.9 5.8 6.0 6.0
Total current revenue 42.6 42.7 42.5 42.5
Capital transfers received 0.4 0.7 0.7 0.7
Total revenue 43.0 43.4 43.2 43.2
Compensation of employees 11.3 11.2 11.0 10.9
Intermediate consumption 5.6 5.6 5.7 5.6
Social transfers in kind via market producers 1.8 1.8 1.8 1.8
Social transfers other than in kind 17.1 16.9 16.8 16.8
Interest paid 4.2 3.9 3.6 3.5
Subsidies 0.5 0.5 0.5 0.5
Other current expenditure 2.5 2.5 2.6 2.6
Total current expenditure 43.1 42.5 42.1 41.8
Gross fixed capital formation 1.5 1.6 2.1 2.1
Other capital expenditure 0.4 0.6 0.5 0.5
Other (residual) 3.0 3.2 3.1 3.1
Interest expenditure 4.2 3.9 3.6 3.5
Total expenditure 45.0 44.8 44.6 44.4
General Government balance (ESA2010) -2.0 -1.4 -1.4 -1.2
Primary balance 2.2 2.5 2.2 2.3
Taxes on production and imports 4.9 5.0 4.3 3.0
Current taxes on income, wealth, etc. -2.3 3.5 -0.8 3.8
Social contributions 4.0 4.6 3.1 2.9
Sales and other current revenue -0.9 2.5 7.1 3.3
Total current revenue 2.0 4.2 3.1 3.2
Capital transfers received -43.1 64.5 -0.3 3.6
Total revenue 1.2 4.8 3.1 3.2
Compensation of employees 2.6 3.1 2.0 2.2
Intermediate consumption 4.2 3.8 4.4 2.1
Social transfers in kind via market producers 0.3 4.6 3.4 3.4
Social transfers other than in kind 1.2 2.7 3.0 3.0
Interest paid -5.5 -2.5 -5.7 1.0
Subsidies -13.2 1.2 8.3 4.0
Other current expenditure 1.2 4.4 6.4 3.1
Total current expenditure 1.0 2.6 2.4 2.5
Gross fixed capital formation -32.4 16.1 30.7 6.0
Other capital expenditure -77.4 51.8 -25.9 0.9
Total expenditure -3.8 3.5 3.0 2.7
Nominal GDP, EUR bn 185.2 192.6 199.4 205.8
% of GDP
% change

3. European Commission macroeconomic and fiscal projections (2017 autumn forecast)
45
Table 7: Government debt developments
2016 2017 2018 2019
ESA2010 deficit (% of GDP) -2.0 -1.4 -1.4 -1.2
ESA2010 gross debt (% of GDP) 130.1 126.4 124.1 121.1
ESA2010 deficit -3.7 -2.8 -2.8 -2.5
Gross debt 241.0 243.5 247.5 249.3
Change in gross debt 9.4 2.5 4.0 1.8
Nominal GDP 185.2 192.6 199.4 205.8
Real GDP growth (% change) 1.5 2.6 2.1 1.8
Change in gross debt (% of GDP) 5.1 1.3 2.0 0.9
Stock-flow adjustments (% of GDP) 3.1 -0.1 0.6 -0.3
Gross debt ratio 130.1 126.4 124.1 121.1
Change in gross debt ratio 1.3 -3.7 -2.3 -3.0
Primary balance 2.2 2.5 2.2 2.3
"Snow-ball" effect 0.5 -1.0 -0.7 -0.3
of which
Interest expenditure 4.2 3.9 3.6 3.5
Real growth effect -1.9 -3.3 -2.5 -2.2
Inflation effect -1.8 -1.7 -1.7 -1.6
Stock-flow adjustments 3.1 -0.1 0.6 -0.3
Implicit interest rate 3.4 3.1 2.9 2.9


EUROPEAN ECONOMY INSTITUTIONAL SERIES European Economy Institutional series can be accessed and downloaded free of charge from the following address: https://ec.europa.eu/info/publications/economic-and-financial-affairs-publications_en?field_eurovoc_taxonomy_target_id_selective=All&field_core_nal_countries_tid_selective=All&field_core_date_published_value[value][year]=All&field_core_tags_tid_i18n=22621. Titles published before July 2015 can be accessed and downloaded free of charge from: • http://ec.europa.eu/economy_finance/publications/european_economy/index_en.htm
(the main reports, e.g. Economic Forecasts) • http://ec.europa.eu/economy_finance/publications/occasional_paper/index_en.htm
(the Occasional Papers) • http://ec.europa.eu/economy_finance/publications/qr_euro_area/index_en.htm
(the Quarterly Reports on the Euro Area)


GETTING IN TOUCH WITH THE EU In person All over the European Union there are hundreds of Europe Direct Information Centres. You can find the address of the centre nearest you at: http://europa.eu/contact. On the phone or by e-mail Europe Direct is a service that answers your questions about the European Union. You can contact this service:
• by freephone: 00 800 6 7 8 9 10 11 (certain operators may charge for these calls),
• at the following standard number: +32 22999696 or • by electronic mail via: http://europa.eu/contact.
FINDING INFORMATION ABOUT THE EU Online Information about the European Union in all the official languages of the EU is available on the Europa website at: http://europa.eu. EU Publications You can download or order free and priced EU publications from EU Bookshop at: http://publications.europa.eu/bookshop. Multiple copies of free publications may be obtained by contacting Europe Direct or your local information centre (see http://europa.eu/contact). EU law and related documents For access to legal information from the EU, including all EU law since 1951 in all the official language versions, go to EUR-Lex at: http://eur-lex.europa.eu. Open data from the EU The EU Open Data Portal (http://data.europa.eu/euodp/en/data) provides access to datasets from the EU. Data can be downloaded and reused for free, both for commercial and non-commercial purposes.