Embed Size (px)
Citation preview
POST MARKETING SURVEILLANCE OF ACTIVE PHARMACEUTICAL
INGREDIENTS (API) IN ANTIMALARIAL DRUGS USED IN MALAWI
THIS THESIS IS SUBMITTED TO THE
UNIVERSITY OF GHANA, LEGON
IN PARTIAL FULFILLMENT OF THE REQUIREMENT FOR
THE AWARD OF
MPHIL CHEMISTRY DEGREE
BY
IBRAHIM CHIKOWE, BSc (Ed).
(10361119)
DEPARTMENT OF CHEMISTRY
UNIVERSITY OF GHANA,
LEGON
JULY 2013
University of Ghana http://ugspace.ug.edu.gh
i
DECLARATION
I, Ibrahim Chikowe, declare that the work contained in this thesis has been undertaken at the
University of Ghana-Legon campus in the Chemistry Department under supervision and has
never been presented for any other degree elsewhere.
……………………………………….
Ibrahim Chikowe
(Student)
………………………….. ……………………………...
Prof. Ivan Addae-Mensah Dr. (Mrs.) Dorcas Osei-Safo
(Supervisor) (Supervisor)
University of Ghana http://ugspace.ug.edu.gh
ii
ACKNOWLEDGEMENT
This research project has been made possible with the support of the Almighty God through
countless populace. Specifically, a vote of thanks is given to my supervisors; Prof. Ivan Addae-
Mensah, Dr. (Mrs.) Dorcas Osei-Safo and Mr. J.J.E.K. Harrison. Other members of staff are
equally thanked for their bountiful and precious help and support, although special thanks are
poured to; the HoD, Prof. R. Kingsford-Adaboh, Dr. I.V. Oppong, Prof Akpabli, Prof.
Asomaning, Dr. Mary Anti Chama, Dr. Klake and the department secretary, for the support and
advice they gave me during my study period.
I extend my vote of thanks to Deedat Chikowe a.k.a. Dida, Calista Chabwera Chikowe, Daniel
Yeboah Konadu, Mr Bob Essien, Leornard Peter Masanja (Tanzanian), Prisca Mai-Mai Kanjere
(Malawian) and my classmates Kojo Sekyi-Acquah (My Ghanaian Brother), Alhaji Mahama
Appiah, Anita Adjowa Oppong, Godwin Akpeko Dziwornu, Cephas Ziwu, Eric Asiedu, Horatio
Egbo Akpoviri (Nigerian), MacDonald Quansah, Samuel Offei-Dwamena and Mercy Ami
Addoh for their hand in my work whenever need arose for their assistance.
My distinguished acknowledgements go to the Department for International Development
(DFID) / Wellcome Trust / National Commission for Science and Technology of Malawi
(NCST) for funding my studies and the project.
Finally, I express my love and gratitude to my Beloved family members for their prayers, help
and best wishes in the course of my work and studies. To my treasured sister and second mother,
Farida Saplana Bunaya Chikowe Nkhoma, Only Almighty God knows how best to reward you.
May Almighty God Bless You All.
University of Ghana http://ugspace.ug.edu.gh
iii
DEDICATION
This project is dedicated to Me, My Father and My Mother.
University of Ghana http://ugspace.ug.edu.gh

iv
TABLE OF CONTENTS
DECLARATION ........................................................................................................................ i
ACKNOWLEDGEMENT .......................................................................................................... ii
DEDICATION .......................................................................................................................... iii
LIST OF TABLES .................................................................................................................... ix
LIST OF FIGURES ................................................................................................................ xiii
LIST OF ABBREVIATIONS.................................................................................................... xv
CHAPTER ONE .........................................................................................................................1
1 INTRODUCTION ............................................................................................................1
1.1 WHAT IS MALARIA? .............................................................................................1
1.2 OVERVIEW OF THE MALARIA SITUATION .......................................................2
1.3 MALARIA IN MALAWI ..........................................................................................3
1.4 PREVENTION OF ANTIMALARIAL DRUG RESISTANCE .................................5
1.5 STATEMENT OF THE PROBLEM .............................................................................5
1.6 AIM AND OBJECTIVES OF THE PROJECT .............................................................6
CHAPTER TWO ........................................................................................................................7
2 LITERATURE REVIEW .....................................................................................................7
2.1 LIFE CYCLE OF THE MALARIA PARASITE - PLASMODIUM ............................7
2.2 BRIEF HISTORY OF ANTIMALARIAL DRUGS ...................................................8
2.3 FORMS OF ANTIMALARIAL DRUGS ................................................................ 15
2.4 MEDICINAL CHEMISTRY OF ANTIMALARIAL DRUGS ................................. 15
2.5 PLASMODIA RESISTANCE TO ANTIMALARIAL DRUGS ............................... 23
2.6 POOR QUALITY DRUGS...................................................................................... 25
2.7 QUALITY CONTROL PARAMETERS IN POST-MARKETING SURVEILLANCE
(PMS)...……………………………………………………………………………………..29
2.8 CASE STUDIES ON QUALITY CONTROL.......................................................... 30
2.9 QUALITY ASSESSMENT METHODS .................................................................. 41
CHAPTER THREE ................................................................................................................... 54
3 CURRENT INVESTIGATION .......................................................................................... 54
3.1 SAMPLING ................................................................................................................ 54
University of Ghana http://ugspace.ug.edu.gh
v
3.1.1 STUDY AREA .................................................................................................... 54
3.1.2 SAMPLE SIZE .................................................................................................... 54
3.1.3 SAMPLING STRATEGY .................................................................................... 57
3.2 PRE-LABORATORY ANALYSIS ............................................................................. 58
3.2.1 REGISTRATION STATUS OF SAMPLES ......................................................... 58
3.2.2 ORIGIN OF THE COLLECTED DRUG SAMPLES ........................................... 59
3.2.3 VISUAL INSPECTION OF DOSAGE FORM AND PACKAGING .................... 59
3.3 LABORATORY ANALYSIS ..................................................................................... 60
3.3.1 QUALITATIVE COLOUR REACTIONS ........................................................... 60
3.3.3 HIGH PERFORMANCE LIQUID CHROMATOGRAPHY (HPLC) ASSAYS ... 75
3.4 DISCUSSION ............................................................................................................. 82
3.4.1 SQ-TLC AND HPLC RESULTS ......................................................................... 82
3.4.2 COMBINED HPLC AND SQ-TLC RESULTS .................................................. 100
3.4.3 REGISTRATION STATUS AND QUALITY OF THE SAMPLES ................... 103
3.4.4 SAMPLES WITH THE SAME BATCH NUMBER........................................... 104
3.4.5 OVERALL RESULTS ....................................................................................... 105
3.4.6 COMPARISON OF RESULTS WITH OTHER AFRICAN COUNTRIES ........ 109
3.4.7 CONCLUSIONS ............................................................................................... 110
CHAPTER FOUR ................................................................................................................... 113
4 EXPERIMENTAL ........................................................................................................... 113
4.1 THIN LAYER CHROMATOGRAPHY .................................................................... 113
4.1.1 EXPERIMENTAL CONDITIONS .................................................................... 113
4.1.2 PREPARATION OF DOSAGE FORM SOLUTIONS ....................................... 114
4.2 HPLC METHODS FOR THE ASSAY OF THE SELECTED ANTIMALARIALS .. 115
4.2.1 HPLC ASSAY OF ARTESUNATE ................................................................... 115
4.2.2 HPLC ASSAY OF ARTEMETHER / LUMEFANTRINE FDC FORMULATIONS
……………………………………………………………………………………118
4.2.3 HPLC ASSAY OF DIHYDROARTEMISININ ................................................. 122
4.2.4 HPLC ASSAY OF QUININE ............................................................................ 124
4.2.5 HPLC ASSAY OF SULPHADOXINE/SULPHAMETHOXYPYRIDAZINE/ ... 128
University of Ghana http://ugspace.ug.edu.gh
vi
PYRIMETHAMINE FORMULATIONS ......................................................................... 128
5 REFERENCES ................................................................................................................ 132
APPENDICES ....................................................................................................................... 148
University of Ghana http://ugspace.ug.edu.gh

vii
ABSTRACT
The use of poor quality antimalarials causes low bioavailability of the active pharmaceutical
ingredients (APIs) to the drug targets resulting in treatment ineffectiveness or failure and parasite
resistance over a short period of drug usage. Resistance has rendered the hitherto cheap and
effective drugs like chloroquine and sulphadoxine/pyrimethamine ineffective, resulting in their
replacement with the more expensive artemisinin-based combination therapy (ACT) for malaria
treatment. The high cost of the ACTs has made them attractive to counterfeiters leading to the
proliferation of poor quality antimalarials on the drug markets. One hundred and twelve (112)
samples of antimalarial drugs were purchased from licensed and unlicensed markets in all parts
of Malawi. Samples were subjected to visual inspection of dosage form and packaging,
registration verification with the Pharmacy, Medicines and Poisons Board of Malawi, basic tests
and semi-quantitative thin layer chromatography (SQ-TLC) and HPLC tests to quantify the APIs
in the samples and compare with pharmacopoeial specifications and the manufacturers’ claims.
The results showed an 85 % registration status with all samples purported to be imported and
100% compliance with visual inspection requirements and basic tests confirming the presence of
requisite APIs. The results of the SQ-TLC showed that 4.88% of artemether/lumefantrine
(Atm/Lum) FDC samples were compliant with pharmacopoeial specifications, 2.44% were
borderline compliant and a further 92.68% were non-compliant (48.15% of Atm component was
overdose and 51.85% under dose; 57.14% of Lum component was overdose and the remaining
42.86% under dose). The HPLC results confirmed this result with 4.88% found to be compliant
and 95.12% non-compliant (48.15% overdose and 51.85% under dose for Atm component; 50%
overdose and 50% under dose for Lum component). SQ-TLC tests on
artesunate/sulphadoxine/pyrimethamine (Ats/SP) samples showed that 77.78% were non-
University of Ghana http://ugspace.ug.edu.gh
viii
compliant all of which were under dose, while 22.22% were borderline compliant. However, the
HPLC results showed a compliant percentage of 11.10% and 88.90% non-compliance (under
dose). The dihydroartemisinin/piperaquine phosphate (Dha/Pp) samples recorded SQ-TLC
percentage of 42.86% being compliant, 14.29% borderline compliant and 42.86% non-compliant
with all the non-compliant quantities of the components found under dose. With HPLC, they
were found to be 28.57% compliant, 7.14% borderline compliant and 64.29% non-compliant
(under dosed components). Dihydroartemisinin/sulphadoxine/pyrimethamine (Dha/SP) samples
were found to be 100% non-compliant for both SQ-TLC and HPLC tests. The quantities of the
APIs in the non-compliant Dha/S/P samples fell within the range of 51% and 84%. Samples
containing sulphadoxine/pyrimethamine (SP) were found to be 4.35% compliant, 8.70%
borderline compliant and 86.95% non-compliant using SQ-TLC method (25.00% of the non-
compliant pyrimethamine component overdose, 75.00% under dose and 100.00% of
sulphadoxine under dose). With HPLC, half (50.00%) of the samples that were borderline
compliant were found to be non-compliant with the remaining half being compliant giving rise to
the following results: 8.70% and 91.30% compliant and non-compliant respectively with all non-
compliant sulphadoxine and 72.73% of pyrimethamine being under dose and 27.27% of the
quantities of pyrimethamine being overdose. None of the quinine samples were compliant with
SQ-TLC (28.57% borderline compliant, 71.43% non-compliant and overdose). HPLC analysis
found 30.77%, 15.38% and 53.85% to be compliant, borderline compliant and non-compliant
(85.71% overdosed) respectively. Generally, 85.71% failure rate was found arising from
Atm/Lum (95.12%), Dha/P (64.30%), Dha/SP (100.00%), SP (91.30%), Ats/SP (88.90%) and
quinine (53.80%) failure rates indicating wide spread circulation of poor quality antimalarial
drugs in Malawi.
University of Ghana http://ugspace.ug.edu.gh
ix
LIST OF TABLES
TABLE 1: EXAMPLES OF ACTS AND NON-ACTS .......................................................................... 15
TABLE 2: COMBINED COUNTRY RESULTS: PERCENTAGE FAILURE OF SAMPLES .............................. 37
TABLE 3: KINDS OF CHROMATOGRAPHIC COLUMNS AND THEIR MODES OF SEPARATION ................ 51
TABLE 4: COLUMNS AND THEIR RESPECTIVE STATIONARY AND MOBILE PHASES AS FUNCTIONS OF
POLARITY ........................................................................................................................... 52
TABLE 5: NUMBER OF SAMPLES BY ZONE OF COLLECTION............................................................ 56
TABLE 6: CATEGORIES OF COLLECTED ANTIMALARIAL DRUG SAMPLES ........................................ 57
TABLE 7: NUMBER OF SAMPLES COLLECTED IN EACH ZONE AND THEIR REGISTRATION STATUS ..... 58
TABLE 8: RESULTS FOR BASIC TESTS OF ARTESUNATE CONTAINING DRUG SAMPLES ..................... 64
TABLE 9: RESULTS FOR BASIC TESTS OF ARTEMETHER CONTAINING DRUG SAMPLES ..................... 66
TABLE 10: RESULTS FOR BASIC TESTS OF DIHYDROARTEMISININ CONTAINING DRUG SAMPLES ...... 68
TABLE 11: RESULTS FOR BASIC TESTS OF QUININE CONTAINING DRUG SAMPLES ........................... 69
TABLE 12: RESULTS FOR BASIC TESTS OF SULPHADOXINE AND PYRIMETHAMINE DRUG SAMPLES. . 70
TABLE 13: SOLVENT SYSTEMS FOR ARTEMISININ DERIVED ACTIVE PHARMACEUTICAL INGREDIENTS
.......................................................................................................................................... 71
TABLE 14: SOLVENT SYSTEMS FOR NON-ARTEMISININ DERIVED ACTIVE PHARMACEUTICAL
INGREDIENTS ...................................................................................................................... 72
TABLE 15 : COMPARATIVE STUDY OF DRUG API COMPLIANCE/NON-COMPLIANCE WITH REGARD TO
COUNTRY OF ORIGIN (BASED ON HPLC) .............................................................................. 93
TABLE 16: COMPARATIVE STUDY OF COMPLIANCE/NON-COMPLIANCE OF DRUGS AS A WHOLE WITH
REGARD TO COUNTRY OF ORIGIN.......................................................................................... 93
TABLE 17: OVERALL RESULTS OF THE STUDY ............................................................................ 105
University of Ghana http://ugspace.ug.edu.gh
x
TABLE 18: DISSOLUTION SOLVENTS OF APIS FOR TLC TESTS .................................................... 113
TABLE 19: CHROMATOGRAPHIC AND INSTRUMENTAL CONDITIONS FOR ARTESUNATE ASSAY ...... 115
TABLE 20: CONCENTRATIONS OF ARTESUNATE RS SOLUTIONS AND THEIR CORRESPONDING AUCS
........................................................................................................................................ 117
TABLE 21: CHROMATOGRAPHIC AND INSTRUMENTAL CONDITIONS OF ARTEMETHER/LUMEFANTRINE
ASSAY .............................................................................................................................. 118
TABLE 22: CONCENTRATIONS OF ARTEMETHER RS SOLUTIONS AND THEIR AUCS ...................... 120
TABLE 23: CONCENTRATIONS OF LUMEFANTRINE RS SOLUTIONS AND THEIR AUCS ................... 121
TABLE 24: CHROMATOGRAPHIC AND INSTRUMENTAL CONDITIONS OF DIHYDROARTEMISININ ASSAY
........................................................................................................................................ 122
TABLE 25: CONCENTRATIONS OF DIHYDROARTEMISININ RS SOLUTIONS AND THE CORRESPONDING
AUCS............................................................................................................................... 124
TABLE 26: CHROMATOGRAPHIC AND INSTRUMENTAL CONDITIONS FOR QUININE ASSAY ............. 125
TABLE 27: CONCENTRATIONS OF QUININE RS SOLUTIONS AND THEIR CORRESPONDING AUCS ... 127
TABLE 28: CHROMATOGRAPHIC CONDITIONS OF SULPHADOXINE / PYRIMETHAMINE ASSAY ........ 128
TABLE 29: CONCENTRATIONS OF SULPHADOXINE RS SOLUTIONS AND THEIR CORRESPONDING
AUCS............................................................................................................................... 130
TABLE 30: CONCENTRATIONS OF PYRIMETHAMINE RS SOLUTIONS AND THEIR CORRESPONDING
AUCS............................................................................................................................... 131
TABLE 31: LIST OF ARTEMISININ-BASED AND NON-ARTEMISININ BASED ANTIMALARIAL DRUGS
PURCHASED FROM VARIOUS ZONES IN MALAWI .................................................................. 148
TABLE 32: PERCENTAGE (%) AND MASS (MG) QUANTITIES OF RESULTS OF ARTESUNATE ACTIVE
PHARMACEUTICAL INGREDIENT (API) BY TLC AND HPLC METHODS AND THEIR COMPARISONS
University of Ghana http://ugspace.ug.edu.gh
xi
WITH THE MANUFACTURER’S CLAIM AND PHARMACOPOEIAL REQUIREMENTS. ARTESUNATE
TABLETS MUST CONTAIN AT LEAST 90.0% AND AT MOST 110.0% OF THE LABELLED AMOUNT
OF ARTESUNATE ON THE PACK. .......................................................................................... 161
TABLE 33: PERCENTAGE (%) AND MASS (MG) QUANTITIES OF RESULTS OF ARTEMETHER ACTIVE
PHARMACEUTICAL INGREDIENT (API) BY TLC AND HPLC METHODS AND THEIR COMPARISONS
WITH THE MANUFACTURER’S CLAIM AND PHARMACOPOEIAL REQUIREMENTS. ARTEMETHER
TABLETS MUST CONTAIN AT LEAST 90.0% AND AT MOST 110.0% OF THE LABELLED AMOUNT
OF ARTEMETHER ON THE PACK........................................................................................... 162
TABLE 34: PERCENTAGE (%) AND MASS (MG) QUANTITIES OF RESULTS OF LUMEFANTRINE ACTIVE
PHARMACEUTICAL INGREDIENT (API) BY TLC AND HPLC METHODS AND THEIR COMPARISONS
WITH THE MANUFACTURER’S CLAIM AND PHARMACOPOEIAL REQUIREMENTS. LUMEFANTRINE
TABLETS MUST CONTAIN AT LEAST 90.0% AND AT MOST 110.0% OF THE LABELLED AMOUNT
OF LUMEFANTRINE ON THE PACK ....................................................................................... 165
TABLE 35: PERCENTAGE (%) AND MASS (MG) QUANTITIES OF RESULTS OF DIHYDROARTEMISININ
(ARTENIMOL) ACTIVE PHARMACEUTICAL INGREDIENT (API) BY TLC AND HPLC METHODS
AND THEIR COMPARISONS WITH THE MANUFACTURER’S CLAIM AND PHARMACOPOEIAL
REQUIREMENTS. DIHYDROARTEMISININ TABLETS MUST CONTAIN AT LEAST 90.0% AND AT
MOST 110.0% OF THE LABELLED AMOUNT OF DIHYDROARTEMISININ ON THE PACK ............. 168
TABLE 36: PERCENTAGE (%) AND MASS (MG) QUANTITIES OF RESULTS OF SULPHADOXINE ACTIVE
PHARMACEUTICAL INGREDIENT (API) BY TLC AND HPLC METHODS AND THEIR COMPARISONS
WITH THE MANUFACTURER’S CLAIM AND PHARMACOPOEIAL REQUIREMENTS. SULPHADOXINE
TABLETS MUST CONTAIN AT LEAST 90.0% AND AT MOST 110.0% OF THE LABELLED AMOUNT
OF SULPHADOXINE ON THE PACK ....................................................................................... 170
University of Ghana http://ugspace.ug.edu.gh
xii
TABLE 37: PERCENTAGE (%) AND MASS (MG) QUANTITIES OF RESULTS OF PYRIMETHAMINE ACTIVE
PHARMACEUTICAL INGREDIENT (API) BY TLC AND HPLC METHODS AND THEIR COMPARISONS
WITH THE MANUFACTURER’S CLAIM AND PHARMACOPOEIAL REQUIREMENTS. PYRIMETHAMINE
TABLETS MUST CONTAIN AT LEAST 90.0% AND AT MOST 110.0% OF THE LABELLED AMOUNT
OF PYRIMETHAMINE ON THE PACK ..................................................................................... 173
TABLE 38: PERCENTAGE (%) AND MASS (MG) QUANTITIES OF RESULTS OF QUININE ACTIVE
PHARMACEUTICAL INGREDIENT (API) BY TLC AND HPLC METHODS AND THEIR COMPARISONS
WITH THE MANUFACTURER’S CLAIM AND PHARMACOPOEIAL REQUIREMENTS. QUININE
TABLETS MUST CONTAIN AT LEAST 90.0% AND AT MOST 110.0% OF THE LABELLED AMOUNT
OF QUININE ON THE PACK .................................................................................................. 176
TABLE 39: SAMPLES WITH THE SAME BATCH NUMBER AND THEIR RESPECTIVE MASSES (MG) ...... 178
University of Ghana http://ugspace.ug.edu.gh
xiii
LIST OF FIGURES
FIGURE 1: LIFE CYCLE OF PLASMODIUM .........................................................................................7
FIGURE 2: STRUCTURES OF THE FIRST PURE COMPOUNDS FOR MALARIA TREATMENT ......................9
FIGURE 3: DEVELOPMENT OF VARIOUS ANTIMALARIAL DRUGS FROM METHYLENE BLUE. .............. 11
FIGURE 4: CONVERSION OF ARTEMISININ TO ITS DERIVATIVES ..................................................... 14
FIGURE 5: CHEMICAL STRUCTURES OF SOME QUINOLINES ............................................................ 16
FIGURE 6: CHEMICAL STRUCTURES OF SOME SELECTED EXAMPLES OF ANTIFOLATES .................... 19
FIGURE 7: PROPOSED MECHANISM OF ARTEMISININ DEGRADATION BY IRON TO FORM TWO
RADICALS ........................................................................................................................... 21
FIGURE 8: REACTION MECHANISM OF THE FERROUS HAEME WITH THE ENDOPEROXIDE BRIDGE ..... 22
FIGURE 9: BASIC TEST PROPOSED REACTION OF ARTEMISININ DECOMPOSITION PRODUCTS WITH
VANILLIN ............................................................................................................................ 47
FIGURE 10. REACTION OF HYDROGEN PEROXIDE WITH POTASSIUM IODIDE ................................... 47
FIGURE 11: BASIC TEST PROPOSED REACTION FOR LUMEFANTRINE............................................... 48
FIGURE 13: MAP OF MALAWI SHOWING SAMPLING SITES ............................................................. 55
FIGURE 13: SOURCES OF THE COLLECTED DRUG SAMPLES ............................................................ 59
FIGURE 14: A SAMPLE OF DEVELOPED TLC PLATE OF AN ARTEMETHER CONTAINING DRUG .......... 73
FIGURE 15: CHROMATOGRAM OF A SAMPLE SOLUTION CONTAINING ARTESUNATE........................ 76
FIGURE 16: CHROMATOGRAM OF A SAMPLE SOLUTION CONTAINING ARTEMETHER AND
LUMEFANTRINE ................................................................................................................... 77
FIGURE 17: CHROMATOGRAM OF A SAMPLE SOLUTION CONTAINING DIHYDROARTEMISININ .......... 78
FIGURE 18: CHROMATOGRAM OF A SAMPLE CONTAINING SULPHADOXINE AND PYRIMETHAMINE .. 80
FIGURE 19: CHROMATOGRAM OF A SAMPLE SOLUTION CONTAINING QUININE ............................... 82
University of Ghana http://ugspace.ug.edu.gh
xiv
FIGURE 20: SQ-TLC RESULTS OF INDIVIDUAL APIS IN THE ANTIMALARIAL DRUG SAMPLES ......... 84
FIGURE 21: SQ-TLC RESULTS OF DRUG SAMPLES WHEN ALL COMPONENTS ARE CONSIDERED ....... 88
FIGURE 22: HPLC RESULTS OF INDIVIDUAL APIS OF THE ANTIMALARIAL DRUG SAMPLES ............ 89
FIGURE 23: HPLC RESULTS OF DRUG SAMPLES WHEN ALL COMPONENTS ARE CONSIDERED .......... 92
FIGURE 24: COMPARISON OF HPLC AND SQ-TLC RESULTS ........................................................ 98
FIGURE 25: CORRELATION CURVE OF HPLC AND SQ-TLC RESULTS ............................................ 99
FIGURE 26: A COMPARISON OF FAILURE RATES FOR REGISTERED AND UNREGISTERED SAMPLES .. 103
FIGURE 27: FAILURE RATES OF THE DRUG SAMPLES BY ZONE .................................................... 106
FIGURE 28: CALIBRATION CURVE FOR ARTESUNATE RS CONC. AS A FUNCTION OF AUC ............ 117
FIGURE 29: CALIBRATION CURVE FOR ARTEMETHER RS CONC. AS A FUNCTION OF AUC ............ 121
FIGURE 30: CALIBRATION CURVE FOR LUMEFANTRINE RS CONC. AS A FUNCTION OF AUC ......... 122
FIGURE 31: CALIBRATION CURVE FOR DIHYDROARTEMISININ RS CONC. AS A FUNCTION OF AUC
........................................................................................................................................ 124
FIGURE 32: CALIBRATION CURVE FOR QUININE RS CONC. AS A FUNCTION OF AUC .................... 127
FIGURE 33: CALIBRATION CURVE FOR SULPHADOXINE RS CONC. AS A FUNCTION OF AUC ......... 130
FIGURE 34: CALIBRATION CURVE FOR PYRIMETHAMINE RS CONC. AS A FUNCTION OF AUC ....... 131
University of Ghana http://ugspace.ug.edu.gh

xv
LIST OF ABBREVIATIONS
AA Artesunate-Amodiaquine
ABC Artemisinin-Based Combination
ACTs Artemisinin-Based Combination Therapies
AD Anno Domini
API Active Pharmaceutical Ingredient
ATM Artemether
ATS Artesunate
CHAM Christian Health Association of Malawi
DESI Desorption Electro Spray Ionization
DHA Dihydroartemisinin
2, 4-DNPH 2, 4-Dinitrophenylhydrazine
EDCTP European and Developing Countries Clinical Trials Partnership
FDC Fixed dose combination
GMP Good Manufacturing Practice
GPHF Global Pharma Health Fund
HCl Hydrochloric acid
HIV Human Immunodeficiency Virus
HoD Head of Department
HPLC High Pressure Liquid Chromatography
INN International Non-proprietary Name
IPTp Intermittent Preventive Treatment of Pregnant women
IRS Indoor Residual Spraying
University of Ghana http://ugspace.ug.edu.gh
xvi
ITN Insecticide Treated Net
KI Potassium Iodide
LC-MS Liquid Chromatography-Mass Spectroscopy
LUM Lumefantrine
NABC Non-Artemisinin -Based Combination
NMCP National Malaria Control Programme
Ph. Int. International Pharmacopoeia
PPQ/PP Piperaquine
QAMSA Quality of selected Antimalarial Medicines circulating in Six
countries of Sub-saharan Africa
Rf Retardation Factor
RS Reference Standard
SP Sulphadoxine-Pyrimethamine
SQ-TLC Semi-Quantitative Thin-Layer Chromatography
TLC Thin-Layer Chromatography
TS Test Solution
USAID United States Agency for International Development
USP United States Pharmacopoeia
UV Ultraviolet
VS Volumetric Solution
WHO World Health Organization
University of Ghana http://ugspace.ug.edu.gh
1
CHAPTER ONE
1 INTRODUCTION
1.1 WHAT IS MALARIA?
Malaria was alleged to be caused by bad air (mal’aria in Italian) from which its name was
derived. This allegation was held until the 1880s and 1890s when its cause was associated with a
parasite and its transmission linked to mosquitoes by Alphonse Laveran, Battista, Ronald Ross
and others [1]
.
Malaria is an infectious disease caused by a protozoon of the subphylum sporozoa of the genus
Plasmodium and the species falciparum, malariae, vivax and ovale [2]
. Molecular evidence has
further shown two subspecies in P. ovale and one of them, P. knowlesi, is also capable of
infecting humans through zoonosis, but it is mostly misdiagnosed as P. malariae [3, 4]
. The
Plasmodia are spread by an infected female anopheles mosquito that bites late at night and early
morning [4]
. Nevertheless, most malaria associated deaths are caused by P. falciparum and P.
vivax, with the former accounting for 1 million deaths per annum; about 90% of all malarial
deaths and approximately 250 million morbidity rates per year [3]
.
Malaria infection has several devastating physiological effects like anaemia and jaundice. P.
falciparum infection causes many dangerous malaria cases and may further cause kidney failure,
acidosis, cerebral malaria, kidney damage, multifunction failure, severe anaemia, spleen rupture,
coma and death if not treated quickly and effectively [4, 5]
.
University of Ghana http://ugspace.ug.edu.gh

2
1.2 OVERVIEW OF THE MALARIA SITUATION
Malaria is a disease that is still claiming millions of lives worldwide. Approximately 3.3 billion
people were affected by the disease worldwide in 2010. Out of 216 million clinical episodes due
to malaria reported in that year, 655,000 resulted in deaths. More deaths were recorded in Africa
(~91%) compared to South–East Asia region (6%) and the East Mediterranean region (3%).
Children accounted for up to 86% of these deaths globally, most probably due to their relatively
low level of immunity which makes them easily overwhelmed by the infection if not promptly
treated [3, 6]
. These results indicate that the disease remains the main killer in Africa and its
children are the most vulnerable [4]
.
This stunning death rate has been attributed mainly to the rapid development of resistance by
malaria parasites to the conventional antimalarial drugs such as chloroquine, quinine and
sulphadoxine/pyrimethamine FDC [7]
. Currently, a new drug regimen called the artemisinin-
based antimalarials has been developed, introduced and deployed to counterattack this resistance.
That has seen the subsequent introduction of the new, more potent and prevalent artemisinin-
based combination therapies (ACTs) in which an artemisinin-based compound is formulated in
combination with a non-artemisinin antimalarial. These newly WHO-recommended first line
therapy antimalarial drugs for uncomplicated and unconfirmed malaria have given such a good
hope to the fight against malaria due to their ability to affect the Plasmodia at several stages of
their life cycle, which affects their gametocyte presence and infection [8]
. Since the ACTs are
mainly aimed at uncomplicated malaria, the other drug types are still used for other serious and
special cases of malaria [6]
. However, the effective use of these newly introduced drugs is mainly
hampered by the presence and use of substandard and fake drugs such that even this therapeutic
University of Ghana http://ugspace.ug.edu.gh
3
line is equally threatened by parasite resistance. It is disappointing and frightening to note that
some of these substandard drugs are produced even by the certified companies believed to be
committed to good manufacturing practices (GMP) [9]
.
1.3 MALARIA IN MALAWI
1.3.1 Malaria Situation
In the Malawi Ministry of Health World Malaria Day communiqué of 2012, it was reported that
for every 1000 people, 325 have a medical condition of malaria [10]
. An estimated 30% of the
outpatients treated at health facilities have malaria-related infections and it is estimated that 40%
of children die of diseases related to malaria [11, 12]
. Malaria suspected cases in Malawi have been
on the increase since 2005. As a matter of illustration, 3.7 million cases were registered in 2005
and the number almost doubled to 6.1 million cases in 2009 of which 50% of these cases were
reported in children alone [13]
.
In a 2010 Malawi National Malaria Indicator Survey in which Slide microscopy was used, a
national parasite occurrence rate of 43.3% was found with vulnerability to parasite being found
to be increasing with aging. In addition, severe anaemia study conducted simultaneously showed
that it was prevalent in 12.3% of children under 5 years with an average HB concentration of less
than 8g/dL, with vulnerability to severe anaemia found to be diminishing with aging. In addition,
the study found that children who did not sleep under the ITN were more prone to severe
anaemia and malaria parasite, with the poor contributing much to the parasite and anaemia
prevalence [14]
. In a related study, Harms and Feldmeier in Kabuluzi et al. reported that 66% of
pregnant women were found anaemic and this condition was mainly attributed to malaria.
University of Ghana http://ugspace.ug.edu.gh
4
Furthermore, the results showed that malaria parasitaemia contributed significantly to the
rampant vitamin A deficiency in 44% and 70% of pregnant women and pre-school children
respectively (MOH/CDC/UNICEF, 2001 in Kabuluzi et al., 2004) [15]
.
Malaria in Malawi is controlled by chemotherapy for infection prevention and treatment, with
artemether-lumefantrine being the first line treatment for uncomplicated and unconfirmed cases
since 2007 after replacing SP that also replaced chloroquine due to parasite resistance. However,
antimalarial drugs like quinine, SP and others are still being used for special cases. Sleeping
under insecticide treated net (ITN) or long lasting insecticide-treated nets (LLITN) and indoor
residual spraying (IRS) are used for vector control [13, 16]
. However, failure to significantly adhere
to treatment and policies has been an area of concern in an effort to implement malaria
interventions effectively [14]
.
1.3.2 Distribution of Malaria
Inhabitants are infected throughout the year in all parts of the country with highest transmission
cases recorded in the low-lying areas during the rainy season. The areas with repeated high
infection rates are those with high temperatures notably the lower Shire valley and lakeshore
areas except mountainous parts of the North and South [13]
. Malaria is amongst the diseases that
are commonest amongst the poor people [14]
, who constitute 54% of the population and 65% of
the population living on less than a dollar per day [13]
and this makes most Malawians not able to
access prompt malaria treatment within 24 hours of observing the infection symptoms as
reported by UNICEF, which worsens the burden of this preventable and treatable disease [10]
.
University of Ghana http://ugspace.ug.edu.gh
5
1.4 PREVENTION OF ANTIMALARIAL DRUG RESISTANCE
After a thorough understanding of available malaria treatment, most of the drugs have faced
significant rates of resistance and the only hope for future malaria treatment currently rests on
artemisinins even though other regimens are still in use. Therefore, it is imperative to protect
these drugs from any impending drug resistance and this can be achieved by among others,
proper use of good and effective quality ACTs and a relentless combat against the use of poor
quality drugs as well as strict patient compliance to treatment regimen [17]
.
1.5 STATEMENT OF THE PROBLEM
No other disease has killed more human kind than malaria [18]
. With the widespread development
of resistant malarial parasites to widely used antimalarial drugs, various efforts have been
suggested by WHO and its partners for malaria control. These recommendations have been duly
adopted by governments and one such measure is the use of artemisinin-based combination
drugs as first-line prescription for the treatment of malaria. However, most countries including
Malawi import most of these drugs. With the high demand, cost of production and prices of these
drugs, a significant number of fake and sub-standard drugs have been imported and/or produced
locally. This has called for routine quality control activities to check this malpractice.
However, national drug regulatory authorities in most developing countries like Malawi have not
been able to conduct these crucial routine quality assessment activities to curb this rapid inflow
of these unwanted drugs, due to the lack of the necessary state-of-the-art tools and qualified
personnel. The National Malaria Control Programme (NMCP) points out that the quality control
system for laboratories in Malawi is weak and it is an area of concern that needs a prompt
University of Ghana http://ugspace.ug.edu.gh
6
attention. Therefore, this research was aimed at fulfilling and supplementing the drug regulatory
efforts as outlined by the WHO Expert Committee on Quality Assurance of Medicines [13]
.
1.6 AIM AND OBJECTIVES OF THE PROJECT
The research was aimed at finding out if the antimalarial drugs used in Malawi comply with the
WHO accepted standards for active pharmaceutical ingredients (APIs) in ACTs and Non-ACTs.
To achieve this aim, the following specific objectives were set:
i. To find out the registration status of the antimalarial drugs available on the markets.
ii. To visually inspect dosage forms and packaging using the guidelines outlined in the
WHO pharmacopoeia and the literature or otherwise.
iii. To carry out a qualitative determination to establish the presence or otherwise of the
active pharmaceutical ingredients using the authenticated rapid tests outlined in WHO
publications.
iv. To carry out a quantitative determination of the API content using SQ-TLC and
HPLC.
v. To further validate the newly developed methods and their adoption for analyzing
antimalarial drugs used in Malawi.
University of Ghana http://ugspace.ug.edu.gh
7
CHAPTER TWO
2 LITERATURE REVIEW
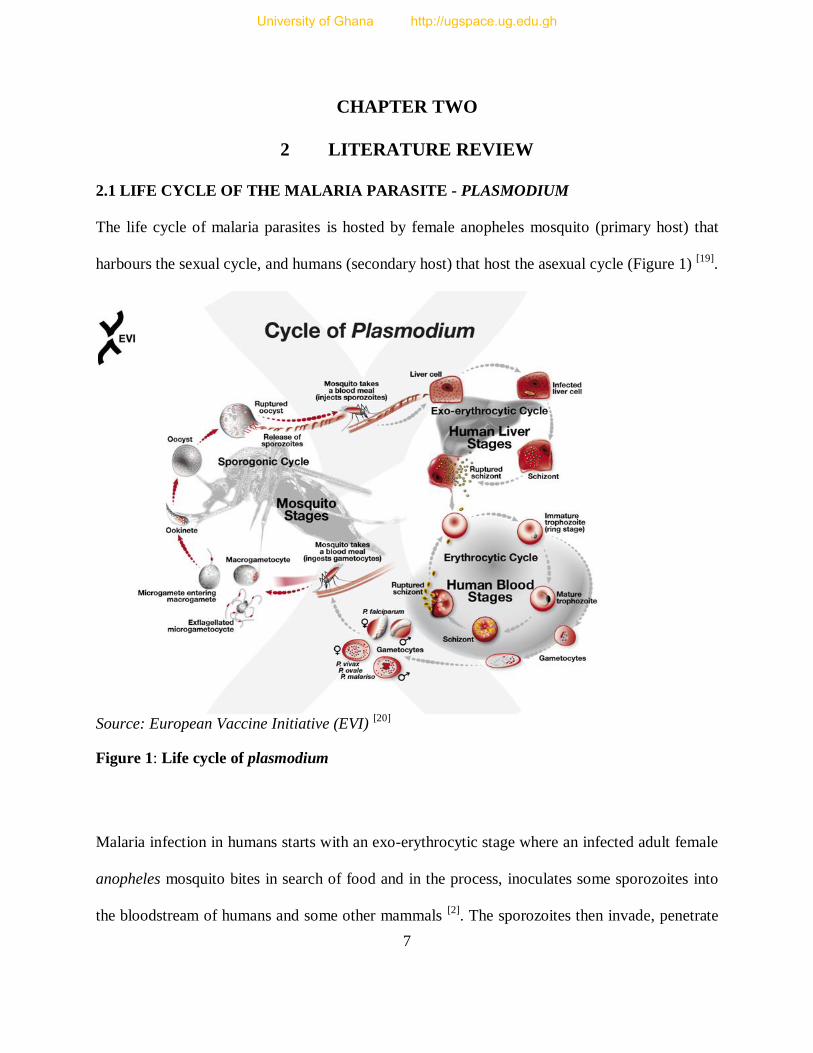
2.1 LIFE CYCLE OF THE MALARIA PARASITE - PLASMODIUM
The life cycle of malaria parasites is hosted by female anopheles mosquito (primary host) that
harbours the sexual cycle, and humans (secondary host) that host the asexual cycle (Figure 1) [19]
.
Source: European Vaccine Initiative (EVI)
[20]
Figure 1: Life cycle of plasmodium
Malaria infection in humans starts with an exo-erythrocytic stage where an infected adult female
anopheles mosquito bites in search of food and in the process, inoculates some sporozoites into
the bloodstream of humans and some other mammals [2]
. The sporozoites then invade, penetrate
University of Ghana http://ugspace.ug.edu.gh

8
and localize in the liver tissues and subsequently infect the liver cells. The sporozoites start
growing in the liver followed by asexual reproduction, budding into schizonts (tissue schizonts)
that contain merozoites. Upon maturity, the schizonts burst open releasing the matured
merozoites [19]
. Some merozoites enter the bloodstream to start the erythrocytic stage while
others may re-infect the liver initiating the secondary tissue stage [2]
, where they evolve to
dormant hypnozoites in the liver especially in infections by P. vivax and P. ovale species leading
to long incubations and late relapses [3, 4]
.
The merozoites in the bloodstream attack the erythrocytes (red blood cells) to consume some of
the haemoglobin and develop into immature trophozoites. When the trophozoites mature, they
form blood schizonts within which merozoites develop through asexual reproduction. A burst of
the schizonts releases more merozoites into the bloodstream repeating the infection and
multiplication cycle. Recurrence of the cycle persists unless it is sorted out by either the immune
system or an antimalarial drug [21]
and this is responsible for the malarial symptoms like fever
and chills [2, 3]
. This process also accounts for anaemia and HB concentration decrease. While
some merozoites repeat the erythrocyte invasions, others differentiate to male and female
gametocytes. When a female anopheles mosquito bites, it is infected with the gametocytes from
the bloodstream that evolve into sporozoites which discharge into the salivary glands of the
mosquito; a subsequent bite by the mosquito re-starts the cycle [2, 4]
.
2.2 BRIEF HISTORY OF ANTIMALARIAL DRUGS
Cinchona bark and Wormwood (Qinghao) had been used effectively as herbs in treating fevers
several hundred years prior to the discovery of the mosquito cycle in the early 20th century. The
University of Ghana http://ugspace.ug.edu.gh
9
mosquito cycle breakthrough brought novel methods in vector control. Later, pure chemical
compounds and subsequent synthetic drugs overshadowed herbal materials. These two ancient
natural treasures still live today as quinine and artemisinin extracted from cinchona bark and
qinghao respectively and are still the prime antimalarials in use today [1]
.
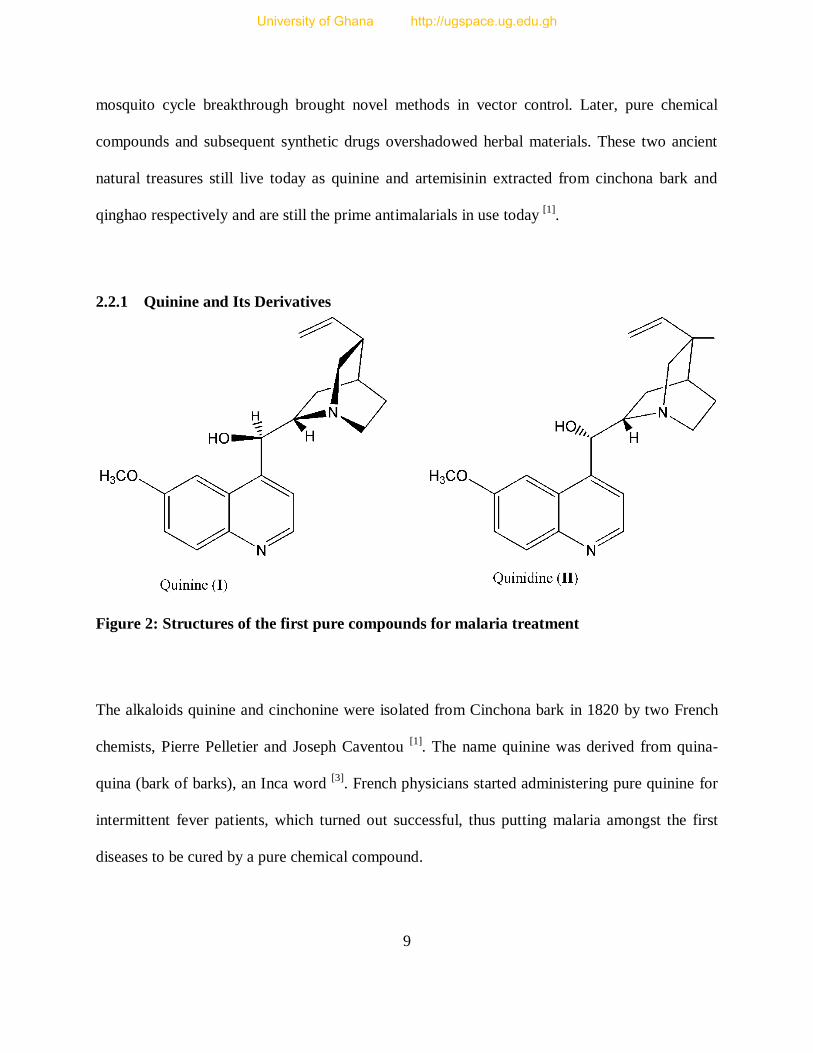
2.2.1 Quinine and Its Derivatives
Figure 2: Structures of the first pure compounds for malaria treatment
The alkaloids quinine and cinchonine were isolated from Cinchona bark in 1820 by two French
chemists, Pierre Pelletier and Joseph Caventou [1]
. The name quinine was derived from quina-
quina (bark of barks), an Inca word [3]
. French physicians started administering pure quinine for
intermittent fever patients, which turned out successful, thus putting malaria amongst the first
diseases to be cured by a pure chemical compound.
University of Ghana http://ugspace.ug.edu.gh
10
William Henry Perkins, an English chemist aged 18 had the first but unsuccessful attempt to
synthesize quinine and the successful synthesis of quinine was eventually achieved in 1944,
though not commercially viable. Perkins’ failed attempt to synthesize quinine led to yet another
important product, the first artificial textile dye called Mauveine (Methylene blue) that could not
be washed by water, which later promoted the development of medicine. It had research
application in microbiology and enabled microbiologists see microbial pathogens under
microscope after staining them with the dye, a phenomenon that was not possible prior to the dye
discovery [1]
.
Later, a German scientist, Paul Ehrlich found that malaria parasites were also successfully
stained by the dye, also known as methylene blue and reasoned that it would eventually poison
the parasites in vivo. In 1891, Ehrlich used synthetic drugs in humans for the first time in history
when he used methylene blue to cure two patients of malaria based on his reasoning, making
malaria the first disease to be treated by a synthetic compound. Methylene blue was later used as
a prototype for the development of novel synthetic antimalarial drugs [1]
. Mepacrine was
produced for P. falciparum in 1932 by the Germans for their combat soldiers who were affected
by malaria in earlier battles in Europe. Later, mepacrine (atebrine) manufacturing was extended
to the USA, with chemical intermediates from Germany [18]
. In 1925, the first 8-aminoquinoline
plasmoquine (pamaquine) was developed for the prevention of P. vivax malaria relapses [1]
. In
1934, chloroquine synthesis began indirectly by H. Andersag and by 1946, US clinical trials
proved the superiority of chloroquine to atebrine (mepacrine). Eventually, chloroquine was
recognized as a powerful antimalarial drug and was extensively used worldwide. In the 1950s
and 1960s, WHO recommended chloroquine as the main choice for its Global Eradication
University of Ghana http://ugspace.ug.edu.gh
11
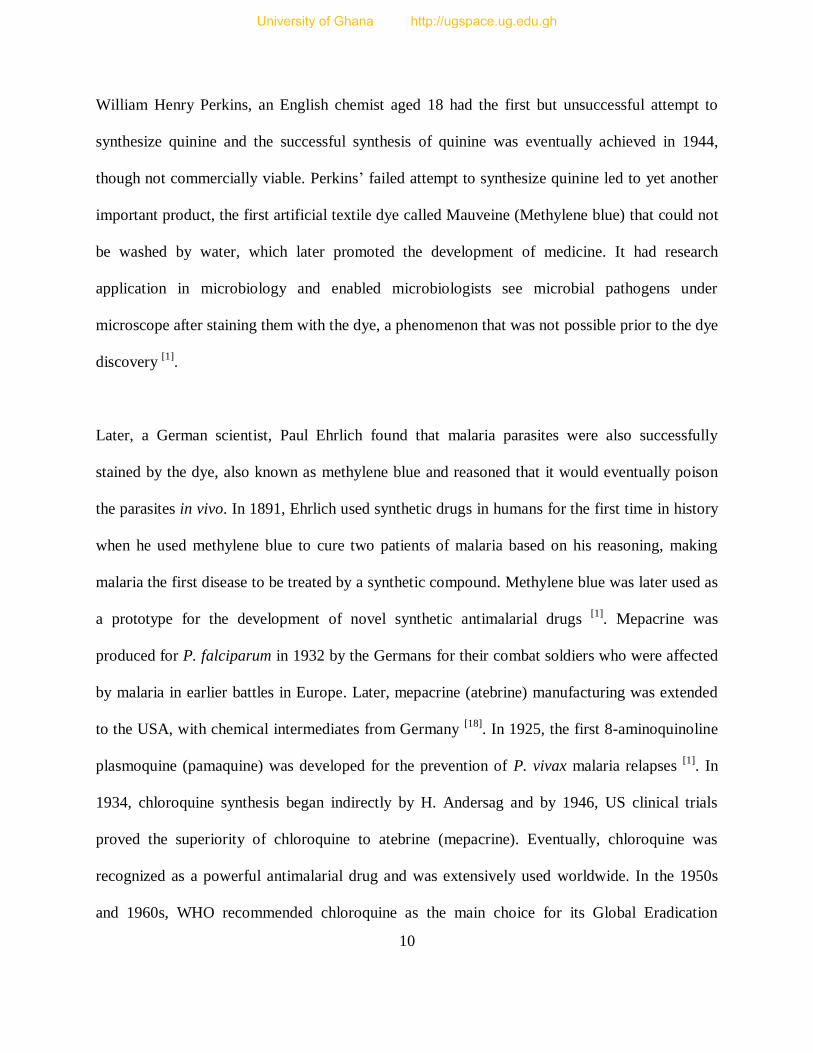
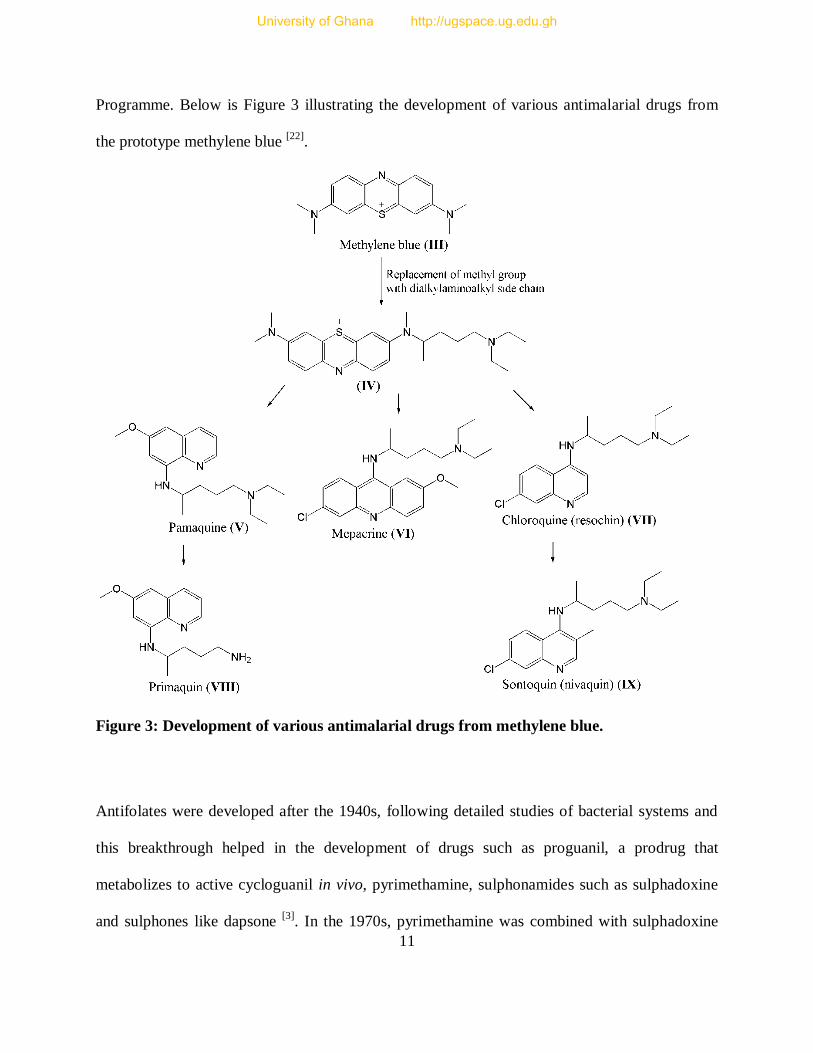
Programme. Below is Figure 3 illustrating the development of various antimalarial drugs from
the prototype methylene blue [22]
.
Figure 3: Development of various antimalarial drugs from methylene blue.
Antifolates were developed after the 1940s, following detailed studies of bacterial systems and
this breakthrough helped in the development of drugs such as proguanil, a prodrug that
metabolizes to active cycloguanil in vivo, pyrimethamine, sulphonamides such as sulphadoxine
and sulphones like dapsone [3]
. In the 1970s, pyrimethamine was combined with sulphadoxine
University of Ghana http://ugspace.ug.edu.gh
12
for synergistic purpose, commercially available as Fansidar and it is still in use today in some
parts of Africa [1]
.
Post-war efforts by American scientists have led to improvement of plasmoquine to the more
effective primaquine as a standard drug for P. vivax malaria relapse prevention. Some drugs have
been used as prototypes, such as SN10275 for mefloquine and 2-hydroxynaphthoquinones for
atovaquone. Other drugs include WR 238605 and tafenoquine [1]
. Since 1980, several drugs have
been developed, while others are still underway all for purposes of malaria control and most
notable ones are dapsone, mefloquine, halofantrine, doxycycline, primaquine and the
artemisinins [23]
.
2.2.2 Artemisinin and Derivatives
The Chinese herbal medicine practitioners originally used Artemisia annua (Qinghao) for
treating haemorrhoid over at least 2000 years [1]
. Qinghao therapy dates back to two prominent
ancient physicians; Ge Hong and Li Shizhen who used it separately within 283-343 AD and
1518-1593 AD periods respectively [24, 25]
. Ge Hong assembled and studied various herbal
prescriptions and went further to author a book titled Zhou Hou Bei Ji Fang (Handy Therapies
for Emergencies) where his prescriptions were coded. Li Shizhen also authored a book that had
monographs of each herb or medicinal matter called Bencao Gangmu (Great Compendium of
Herbs) that was published after his death [24]
.
In 1967, the Mao-led Chinese government decided to professionalize traditional medicine in a
multi-disciplinary programme called Project 523. In the early 1970s, colourless pure crystals that
University of Ghana http://ugspace.ug.edu.gh

13
were active against plasmodia in animal models were extracted from A. annua. The extract was
called Qinghaosu or artemisinin [18]
. Later, clinical trials of artemisinin showed that artemisinin
was effective against chloroquine-resistant P. falciparum coupled with quick action and low
toxicity. Structure elucidation of artemisinin revealed that it was a sesquiterpene lactone with the
formula C15H23O5 and the chemical structure was found to have features uncommon to natural
products, i.e. three fused rings; one ring having seven atoms and one ring spanned by a peroxide
bridge (-O-O-) that could be broken easily (Figure 4) [24]
.
Artemisinin has rapid action, short half-life (1-3hrs), low toxicity and effective against antifolate
and quinoline-resistant P. falciparum [24]
. It is this rapid action that causes a prompt treatment for
severe infections [26]
. However, it has low solubility in water and oil coupled with poor
availability and these properties limit its therapeutic value along with effectiveness [24]
. Thus,
artemisinin extract has poor pharmacological properties and this is improved by modifying the
sesquiterpene lactone endoperoxide, which increases cost of production [3]
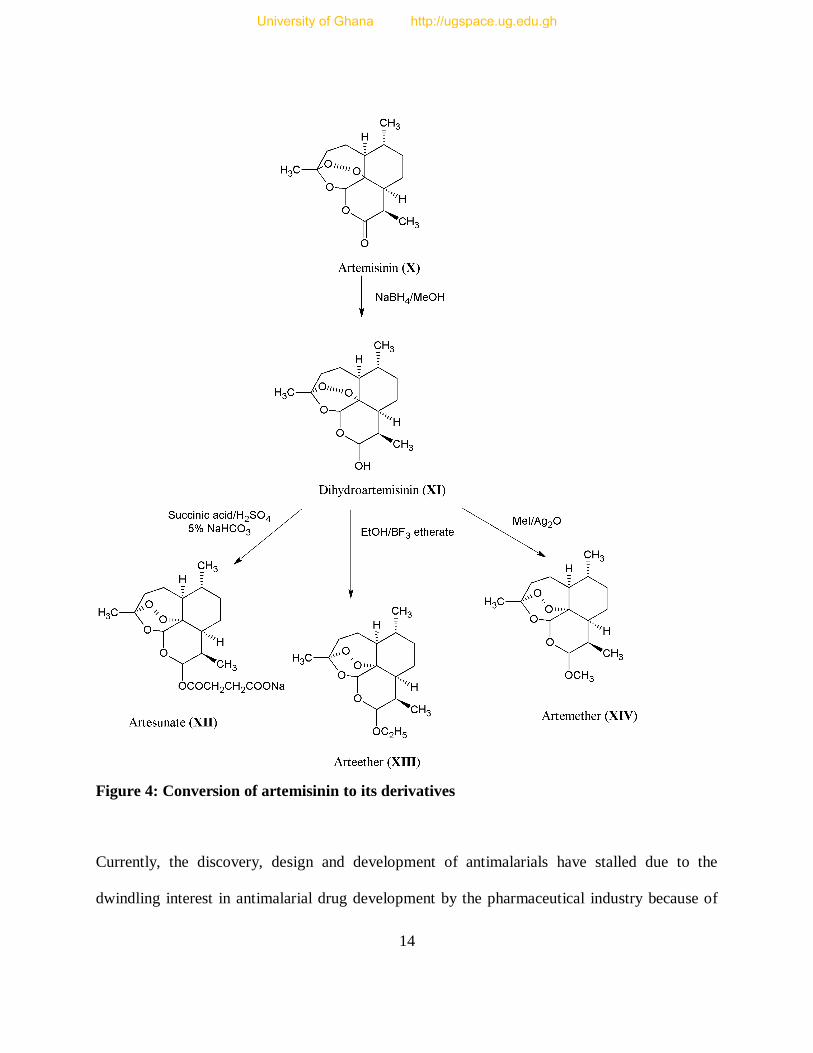
. In this process,
artemisinin is chemically converted to dihydroartemisinin, followed by partly synthetic
derivatives that are more effective such as artesunate, artemether and arteether, also known as
first generation derivatives of artemisinin [24]
. Firstly, artemisinin is reduced with sodium
borohydride (NaBH4) in the presence of methanol to produce dihydroartemisinin. Secondly, the
derivatives are produced by other reactions as illustrated in Figure 4 below.
University of Ghana http://ugspace.ug.edu.gh
14
Figure 4: Conversion of artemisinin to its derivatives
Currently, the discovery, design and development of antimalarials have stalled due to the
dwindling interest in antimalarial drug development by the pharmaceutical industry because of
University of Ghana http://ugspace.ug.edu.gh

15
the high risk and low investment returns associated with antimalarials. Any persistence in the
current P. falciparum resistance development will see malaria incurable in some parts of the
malarious areas [27]
. Hence, there is a great need to safeguard the present drugs against resistance
through proper drug use, handling and checking against poor quality drugs.
2.3 FORMS OF ANTIMALARIAL DRUG COMBINATIONS
There are two forms of antimalarial drugs: artemisinin-based combination therapies (ACTs) and
Non-artemisinin based combination therapies [28]
. Table 1 below shows few examples of
antimalarial drug combinations.
Table 1: Examples of ACTs and non-ACTs
Artemisinin-based combination therapy
(ACTs) Non-ACTS
Artesunate-amodiaquine Sulphadoxine-pyrimethamine (SP)
Artesunate-mefloquine SP-chloroquine
Artemether-lumefantrine SP-amodiaquine
Artesunate-sulphadoxine-pyrimethamine SP-mefloquine
Dihydroartemisinin-piperaquine+derivatives Quinine-tetracycline-doxycycline
Dihydroartemisinin-sulphadoxine-pyrimethamine
Artesunate-sulphamethoxypyridazine-
pyrimethamine
2.4 MEDICINAL CHEMISTRY OF ANTIMALARIAL DRUGS
2.4.1 Quinolines and Related Compounds
These compounds have a basic quinoline ring system and several compounds such as
chloroquine, amodiaquine, primaquine, piperaquine, quinine, quinidine and mefloquine have
been synthesized from the basic quinoline moiety of quinine (see Figure 5 for chemical
University of Ghana http://ugspace.ug.edu.gh

16
structures of some quinolines). Related to the under listed drugs are halofantrine derived from
phenanthrene ring system and lumefantrine from the fluorene ring [3]
.
Figure 5: Chemical structures of some quinolines
University of Ghana http://ugspace.ug.edu.gh
17
2.4.1.1 Chloroquine
It is a synthetic derivative of 4-aminoquinoline, a blood schizonticide and one of the longest
serving synthetic antimalarials. The exact mode of action of chloroquine is not known, but
several mechanisms have been proposed. Plasmodium survives on amino acids obtained from the
digestion of haemoglobin and this process produces β-hematin dimer haeme that is toxic to the
parasite. So a bio-mineralization process is conducted by the parasite to form a non-toxic
complex called Hemozoin. Chloroquine and other quinolines are used to block this haeme
elimination process by producing complexes with the haeme, thus depriving the parasites of
dimerization and crystallization processes for detoxification, thereby causing accumulation of
toxic haeme within them and subsequently poisoning to death. In addition, the creation of drug-
haeme complex hampers the formation of peptides and this also reduces necessary amino acid
supply to the parasites, threatening their capability [3]
. Moreover, chloroquine interferes with the
biosynthesis of nucleic acids thereby inhibiting the DNA and the RNA of the parasite [29]
.
However, chloroquine has faced widespread P. falciparum parasite resistance due to the
mutation of its transporter (PfCRT), with only North Africa, Carribean region and Central
America still using it. This resistance dates back to 1957 when it was first discovered along the
Venezuelan-Colombian border and spread across sub-saharan Africa in the late 1970s and 1980s
[3]. In Africa, the resistance started in the Eastern African region (e.g. Kenya, Tanzania, Uganda,
Rwanda), but took quite a long time to spread to the West Coast. Chloroquine resistance in West
Africa therefore became a major problem only during the latter years of the 20th century
[30, 31, 32].
University of Ghana http://ugspace.ug.edu.gh
18
2.4.2 Antifolates
These are antimalarial chemotherapeutic agents that act by competing with a natural substrate to
suppress unpleasant body chemical reactions and they are called competitive (reversible)
inhibitors. They are mostly structural analogues of their substrates. The Figure 6 below shows
structures of some of these drugs. As competitive inhibitors, pyrimethamine and chloroguanil
inhibit dihydrofolate reductase (DHFR) responsible for critical activities of bifunctional DHFR-
thymidylate synthatase (TS) protein. This averts the biosynthesis of purines plus pyrimidines and
eventually DNA synthesis, cell division as well as reproduction [3]
.
Sulphonamides like sulphadoxine and sulphamethoxypyridazine as well as sulpha drugs inhibit
dihydropteroate synthase (DHPS) that is involved in the folate synthesis pathway and it is also
crucial for the synthetic pathway of amino acids needed for parasite growth, thus preventing p-
aminobenzoic acid (PABA) from converting to dihydrofolic acid and eventually tetrahydrofolate
synthesis. For optimum efficacy against susceptible strains of malaria, sulphadoxine is combined
with pyrimethamine in a product called Fansidar and many others for synergistic effect.
However, the effectiveness of antifolates has been compromised by the emergence of the point
mutation of the essential genes of the parasites; a form of mutation that occurs when a single
base nucleotide is replaced by another nucleotide of a genetic matter, RNA or DNA [3]
.
University of Ghana http://ugspace.ug.edu.gh

19
Figure 6: Chemical structures of some selected examples of antifolates
2.4.3 Mechanism of Action of Artemisinins
A clear mechanism of action of these compounds is yet to be fully determined. However, various
studies have proposed that the activity comes from the endoperoxide bridge through a two-step
process of haemoglobin iron activation and alkylation [3, 33]
.
University of Ghana http://ugspace.ug.edu.gh
20
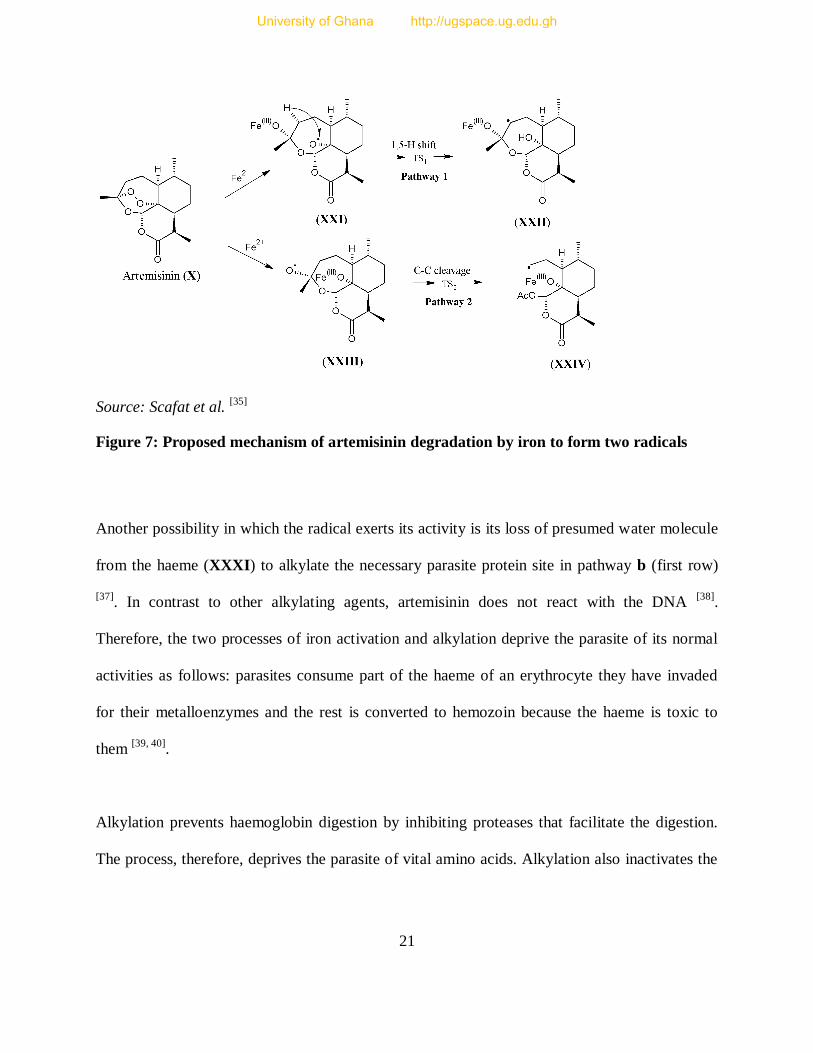
The haemoglobin iron activation starts when the haeme moiety containing a reduced iron, ferrous
iron (Fe2+
) (derived from the food vacuole’s haemoglobin digestion) interacts with the
endoperoxide bridge [3]
. The ferrous iron (Fe2+
) is oxidised to ferric iron (Fe3+
), releasing an
electron to the endoperoxide bridge of the artemisinins, causing the drug activation; but the Fe2+
cation acts as a catalyst because it is regenerated after the process. The peroxide bond breaks
forming carbon-centred alkoxyl radicals, which are believed to be the source of the drug activity,
because all the derivatives that cannot produce this radical (those without endoperoxide bridge
like deoxyartemisinin) are devoid of biological activity [34]
. This proposed mechanism of
artemisinin degradation by iron is shown in Figure 7 below. Apart from acting as a catalyst for
artemisinin breakdown, haeme also forms complexes with artemisinin producing specific
radicals that are neither in artemisinin nor haemin products alone as shown in Figure 7 below,
which are believed to act at a specific target that has not yet been discovered [36]
.
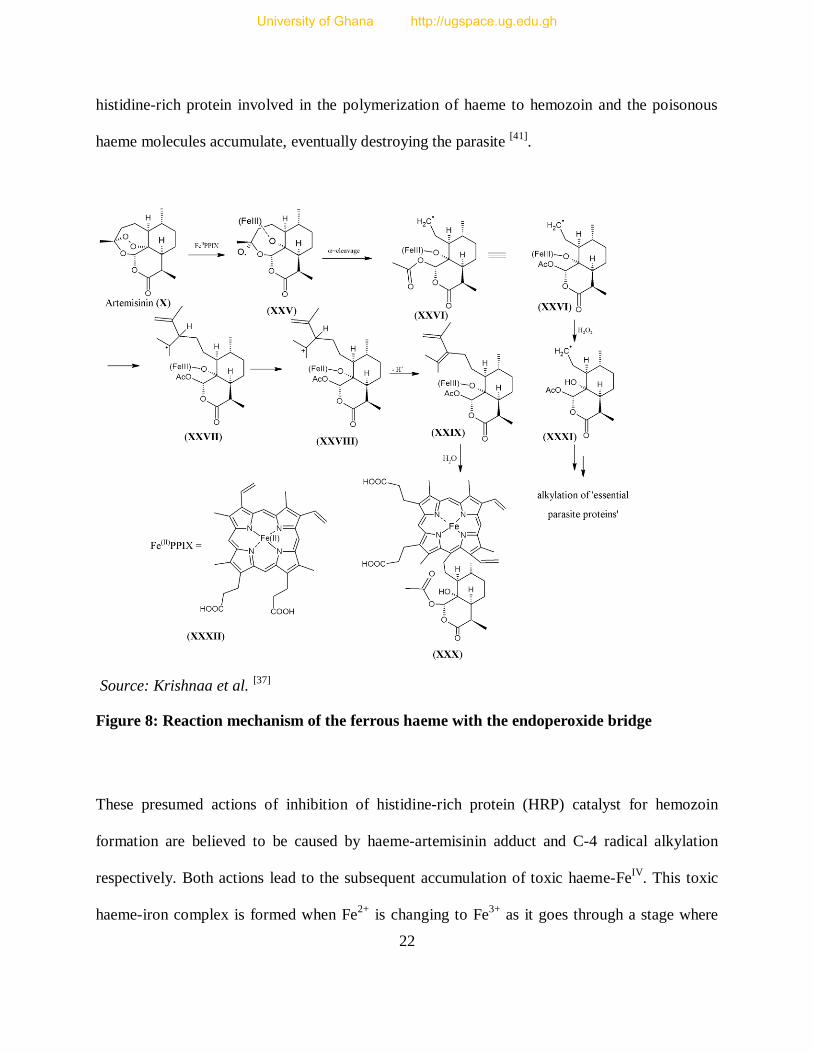
Furthermore, the artemisinin derivatives are alleged to act by alkylating particular proteins
comprising iron-sulphur protein, transporters and translationally controlled tumour protein
(TCTP) homologue [3]
. Figure 8 shows a proposed reaction between the generated radicals and
the bio molecules and it also shows a ferrous haeme (Fe (II) protoporphyrin IX) activating an
artemisinin to form a seco C-4 radical (XXVI) and alkylated adduct (XXX) through pathway a
(second row).
University of Ghana http://ugspace.ug.edu.gh
21
Source: Scafat et al. [35]
Figure 7: Proposed mechanism of artemisinin degradation by iron to form two radicals
Another possibility in which the radical exerts its activity is its loss of presumed water molecule
from the haeme (XXXI) to alkylate the necessary parasite protein site in pathway b (first row)
[37]. In contrast to other alkylating agents, artemisinin does not react with the DNA
[38].
Therefore, the two processes of iron activation and alkylation deprive the parasite of its normal
activities as follows: parasites consume part of the haeme of an erythrocyte they have invaded
for their metalloenzymes and the rest is converted to hemozoin because the haeme is toxic to
them [39, 40]
.
Alkylation prevents haemoglobin digestion by inhibiting proteases that facilitate the digestion.
The process, therefore, deprives the parasite of vital amino acids. Alkylation also inactivates the
University of Ghana http://ugspace.ug.edu.gh
22
histidine-rich protein involved in the polymerization of haeme to hemozoin and the poisonous
haeme molecules accumulate, eventually destroying the parasite [41]
.
Source: Krishnaa et al. [37]
Figure 8: Reaction mechanism of the ferrous haeme with the endoperoxide bridge
These presumed actions of inhibition of histidine-rich protein (HRP) catalyst for hemozoin
formation are believed to be caused by haeme-artemisinin adduct and C-4 radical alkylation
respectively. Both actions lead to the subsequent accumulation of toxic haeme-FeIV
. This toxic
haeme-iron complex is formed when Fe2+
is changing to Fe3+
as it goes through a stage where
University of Ghana http://ugspace.ug.edu.gh
23
FeIV
is formed. This paralyses parasite activities through interaction with its proteins of the food
vacuole and pro-oxidant activities [37]
. However, evidence-based results have shown some traces
of resistance reported to have been caused by the ability of the parasite to resist artemisinin,
refuting earlier suggestions that it might be due to the host and pharmacokinetic factors [3]
.
2.5 PLASMODIA RESISTANCE TO ANTIMALARIAL DRUGS
Drug resistance of a parasite is confirmed when the effectiveness of a drug declines in either
disease cure or symptoms recovery in a patient. The word ‘drug resistance’ is suitably used when
referring to pathogen-caused diseases, whereby the drug is intended to destroy the pathogens.
However, a drug is not always aimed at destroying or inhibiting pathogens; in such other case,
drug ineffectiveness (resistance) is suitably called drug tolerance or dosage failure. Some
pathogens are tagged as multidrug resistant when they can defend themselves against more than
one type of drug and/or approaches concomitantly administered [42]
.
Bruce-Chwatt et al. ( in Bloland, 2001: 12) define resistance to antimalarials as the “ability of a
parasite to survive and/or multiply despite administration and absorption of a drug given in
doses equal to or higher than those usually recommended, but within tolerance of the subject.
The drug in question must gain access to the parasite or the infected red blood cell for the
duration of the time necessary for its normal action.” Recent studies have established that
resistance is caused by host and parasite factors. The host factors include prophylaxis drugs over
use, use of poor quality drugs and non-compliance as well as haphazard use of drugs by patients
leading to unfinished therapeutic treatments, which in turn, cause a decrease in drug build up to a
recommended level necessary for an effective physiological response . The parasite factors
University of Ghana http://ugspace.ug.edu.gh
24
include change-flexibility in target genes and metabolic pathway, increase in concentration of
target, abnormal rates of reproduction, sexual reproduction (in mosquitoes); which in turn cause
the multiplication of resistant genes and drug deactivation [3, 43]
.
2.5.1 Remedy for Drug Resistance
There are basically three ways of dealing with drug resistance and these are; prevention of drug
resistance emergence, containment of the emerged resistance and drug efficacy scrutiny. Firstly,
drug resistance can be prevented by controlling the parasite transmission, use of good quality
antimalarials and adoption of combination therapy. Transmission of parasite can be prevented by
the use of vaccines, vector control and decrease in infection reservoir; which has been blamed for
spread of resistance and hence its decrease can be achieved by early diagnosis, efficient
treatment and using gametocytocidal drugs. Furthermore, drug resistance emergence can be
prevented by the use of combination therapy like ACTs and non-ACTs [17]
.
Besides, good quality ACTs are predictive of a successful parasite clearance as well as fight
against resistance and this can be reinforced by easy access to ACTs, improved disease
diagnosis, correct use of drugs especially in the private sector. This can be achieved by proper
and updated education for the practitioners, increased compliance and supervising drug
administration. Good quality drugs administration can also be achieved by routine quality
assessment of drugs to fish out poor quality drugs from the market. Secondly, recommended
drugs in the treatment guidelines are supposed to be routinely monitored for efficacy to detect
any occurrence of resistance of the parasite quickly. This would help in establishing the extent of
University of Ghana http://ugspace.ug.edu.gh
25
resistance and call for a prompt change of drug policy if necessary to prevent multi-drug
resistance [17]
.
2.5.2 EFFECTS OF ANTIMALARIAL DRUG RESISTANCE
Parasite resistance to malaria treatment has had several devastating effects in the fight against
malaria disease. This has led to an increase in morbidity and mortality rate (inclusive of anaemia
and low birth weight), parasite transmission, rate and severity of pandemic, change in malaria
distribution. In turn, this has caused pressure on the economy (government and individuals) due
to increase in health services cost arising from prevalent treatment failures and death. These
effects have made people resort to the informal private sector, thereby exposing themselves to
poor quality drugs mostly blamed for escalation of drug resistance [17]
. Specifically, some
pockets of parasite resistance to artemisinin resistance have been attributed to the sub-therapeutic
doses derived from fake and substandard drugs [8]
.
2.6 POOR QUALITY DRUGS
These are drugs that have either wrong ingredient, incorrectly formulated APIs, insufficient
amount of APIs or dosage forms contaminated with other exogenous substances that may render
the drugs harmful, ineffective or cause death. Poor quality drugs are classified into three types:
counterfeit, substandard and degraded [44]
. WHO classifies monotherapy of artemisinins as
substandard even when they have enough requisite API [45]
.
Drugs are classified as counterfeit if they are fraudulently and deliberately mislabelled to depict
one ingredient when they contain another (harmless or toxic). The ingredient might be either
University of Ghana http://ugspace.ug.edu.gh
26
active or inactive against the disease they are intended for or contain the correct requisite API,
but manufacturer or packaging is faked or mislabelled. The drug might also contain insufficient
active ingredients, or without active ingredient. These drugs might be generic products,
prescription medicines, over the counter medication or traditional remedies. In addition, it
includes drugs that contain misleading information with respect to name, composition, strength,
and manufacturer, country of manufacturing, and country of origin, marketing authorization
holder or steps of distribution [46]
. Small amounts of active ingredients are added sometimes
aimed at just passing the rapid tests at entry points [47]
.
Substandard drugs are those drugs that are manufactured by well-known and established licensed
companies with all the requirements, but deviate significantly from the accepted limits of API
and other chemical additives’ contents as well as falling outside the recommended range of
dissolution times. This is attributed to poor manufacturing practices, lack of technical know-how
and unsatisfactory infrastructure. Degraded drugs on the other hand are those that contain
inadequate amount of API and other unwanted compounds resulting from decomposition of the
well manufactured drugs that have been exposed to adverse conditions such as humidity, light
and heat. Nevertheless, it is challenging to know whether a drug falls outside accepted limits due
to poor manufacturing practices or exposure to adverse effects. Besides, it is also challenging to
decide between counterfeit and substandard drugs as the latter might be due to poor
manufacturing practices or deliberate move by a manufacturer [48]
. However, Bate et al. state that
determination of a drug as counterfeit or substandard requires a forensic examination of the
trademarks, product designs and holograms [45]
.
University of Ghana http://ugspace.ug.edu.gh
27
Research has shown that poor quality drugs are more widely found in Asia than Africa but the
situation is rapidly deteriorating in the latter. This has been attributed to poor regulatory
capabilities for manufacturing and importation activities [45]
. It is estimated that 15% of the drugs
used globally are counterfeit and 50% of the drugs used in some parts of Africa as well as Asia
are counterfeit [49]
. The fake drugs look almost the same as the original ones in both the packing
materials and the barcodes, to a layman [50]
. This situation has increased rapidly recently
especially in Asia because most of these new drugs are very expensive as compared to the old
ones. Market prices have shown that the current cost of ACTs is 10 to 20 times higher than the
cost of SP and chloroquine. However, there is an expectation that the prices will decrease when
the forces of demand and supply play their part [44]
. An estimated US$20 billion, representing 7%
of the pharmaceutical industry’s total revenue, is lost to counterfeiters annually [51]
.
Most counterfeit drugs have been found to contain incorrect ingredients and this can cause
adverse effects especially on HIV treated patients due to a possible drug-drug interaction [47]
. It is
also alleged that since other ingredients in the counterfeited drugs are sometimes not known,
they create a toxicity threat due to unilateral activity, by-products effects or combined effects
with other body contents [52]
. In addition, some of these drugs contain zero active ingredients and
others contain insufficient doses of the active ingredients that are too low to eradicate the
available pathogens, while others contain too much of active ingredients that might have various
adverse effects especially for the drugs that have low therapeutic indices [48]
.
These poor quality drugs result in low bioavailability of drugs; hence sub-therapeutic blood
concentrations [48]
. This, in turn, can cause preferential selection for the drug sensitive parasites,
University of Ghana http://ugspace.ug.edu.gh
28
leaving the drug resistant parasites unaffected. When using a long half-life drug that stays in the
body for a long time like SP, it is later encountered with new infections that are then exposed to
sub-therapeutic residual drug that is below the least required inhibitory concentration [53, 54]
. The
result of these sub-therapeutic concentrations is cross-resistance; a situation in which
microorganisms are conditioned to tolerate toxic levels of a drug due to the previous experience
to similar medicine or mode of action. This can arise by either deoxyribonucleic acid (DNA)
shift or spontaneous metamorphosis [42]
. These factors contribute greatly to drug resistance either
collectively or autonomously [48]
. Serious cases lead to treatment failure and death especially for
vulnerable groups like children who have a rapid evolution of malaria from mild to severe
infection [49]
.
Therefore, artemisinin-based treatment is equally threatened by the proliferation of resistant
strains and no other hope is foreseen to surpass this remedy in case of full resistance in the near
future. It is, therefore, recommended that the best way is to safeguard good manufacturing
practices to minimize or eradicate the inflow of substandard drugs by strengthening the
pharmacovigilance tools specifically in this case, post-marketing surveillance of the drugs
already on the market to flush out such dangerous drugs and perpetrators [55]
. There is also a need
for careful implementation of universal medicine availability whilst safeguarding the quality of
the drugs at the same time, because any compromise means resistance and subsequent change of
treatment regimen to newer and more costly drugs [49]
, which are not yet even available.
Thus, it is recommended that regulatory authorities in various countries should invest in modern
facilities to enable them carry out their routine quality control activities well so that people can
University of Ghana http://ugspace.ug.edu.gh
29
access best quality drugs. This would help in fighting against the inflow of these unwanted drugs
that are already threatening to escalate the spread of resistance in Africa. This is very important
as any ability of this resistance to infiltrate Africa would roll back malarial control initiative to
zero [47]
.
In view of this widespread distribution of poor quality drugs most of which are counterfeit and/or
substandard and the consequent growing public health crisis, an official World Health
Organisation (WHO) body called the International Medical Products Anti-Counterfeiting
Taskforce (IMPACT) was set up in 2006 by WHO and other stakeholders to coordinate the fight
against the production and distribution of counterfeit drugs worldwide [56]
.
2.7 QUALITY CONTROL PARAMETERS IN POST-MARKETING SURVEILLANCE
(PMS)
A drug product is mostly tested for safety, efficacy and quality to qualify it as suitable for human
treatment or consumption. Quality control is the oldest parameter that has been in place for
assessment of drug products, while safety and efficacy came into force towards the end of the
1950s after the Thalidomide tragedy. Drug product quality continues to be a very important
assessment criterion and the procedures are performed in a wide range of infrastructure from
simple to state-of-the-art facilities. For antimalarials, quality control involves physical methods
done on liquids, solids and semi-solids. It entails chemical methods analyzing the API content,
excipients and impurities, in vitro disintegration and dissolution tests as well as in vivo
bioavailability tests [49]
.
University of Ghana http://ugspace.ug.edu.gh

30
Post marketing surveillance (PMS) involves the assessment of drug products when they are
ready for market or at the market. Lucas et al. explain that a drug quality may involve
assessment of the drug for stability and shelf life under specific moisture and temperature
conditions. A resolution was passed by the International Conference on Harmonization (ICH), to
standardize methods for medicine stability tests. In addition, stability of drugs was divided into
three operational classes of long term, intermediate and accelerated stability studies [57]
. Other
quality control tests reported in the literature are residue analysis, excipients and binding
materials status, degradation products and unidentifiable materials analysis, expiry status and
content analysis, uniformity of weight, friability, tablet hardness, product shelf life under specific
conditions, bioavailability and bioequivalence for generic drugs especially those with limited
solubility and development of new analytical procedures that are cost effective and rapid [49]
.
2.8 CASE STUDIES ON QUALITY CONTROL
Several studies have been conducted in malaria endemic areas of the world on poor quality
drugs. Such poor quality drugs have contributed to the abandonment of once effective
antimalarial drugs and such poor quality drugs still pose a threat to the new artemisinin-based
combination therapies that have been recommended and widely used as first line treatment for
uncomplicated Malaria cases. Various studies have confirmed the widespread existence of these
substandard and counterfeit antimalarial drugs. A few of these case studies are discussed.
2.8.1 Reports from Outside Africa
In eastern Burma, following the death of a male patient diagnosed of uncomplicated
hyperparasitaemic P. falciparum malaria and treated with an artesunate drug, quality analysis
University of Ghana http://ugspace.ug.edu.gh
31
was conducted on the purported artesunate antimalarial drugs. The drugs were labelled as
manufactured in China by Guilin pharmaceuticals. Tests (or analyses) showed that the drugs
contained only 10mg out of the required 50 mg indicated on the packaging material and mainly
contained paracetamol. The paracetamol addition may have been aimed at fever reduction to give
a false impression of the drug’s efficacy, to cover up its failure to cure malaria [58]
.
In the Mekong region covering Cambodia, Burma (Myanmar), Laos, Thailand and Vietnam, a
study conducted in 2001 to assess the quality of drugs using 104 samples collected from shops
showed that 38% of the samples had zero artesunate. In 2004, a follow up study assessed 188
artesunate and 44 mefloquine tablet samples and results demonstrated a deteriorating situation as
53% had zero artesunate. In addition, out of the 44 mefloquine samples, 9% had amounts less
than 10% of the claimed amount labelled on the pack [59]
.
Abdo-Rabbo et al. reported a study conducted in Yemen. Samples of antimalarials containing
chloroquine and SP were investigated for content and dissolution compliance using validated
methods (HPLC) in the pharmacopoeia. Chloroquine syrup samples registered a 6.7% failure
rate, while tablets had 20% failure rate on content analysis. For dissolution analysis, 8% of the
chloroquine tablets failed. In addition, 100% of the SP tablets passed the content analysis, but
80% failed the dissolution tests, with pyrimethamine having extremely poor results [60]
.
In 2007, a study carried out in Vientiane, Laos using visual and chemical analysis showed that
53% of the samples were falsified. Most of the fake artesunate pills had a deceptive visual look
for an ordinary eye due to their sophiscated packaging, holograms and logos that could be
University of Ghana http://ugspace.ug.edu.gh
32
detected as fake only when a UV light was used. Some of the samples were found with
inappropriate materials such as flour, starch, chalk, acetaminophen (paracetamol) or chloroquine
as well as fatal sulpha drugs for those allergic to them. Some samples also had a trace of
artemisinin that showed positive result for Fast-Red dye test, yet insufficient to cure malaria [61]
.
Newton et al. analyzed 391 artesunate samples collected from the Thai-Myanmar border (16),
Cambodia (48), Vietnam (75), Lao PDR (115) and Myanmar (137). Results showed that there
were 16 different fake holograms within the samples. In addition, some samples had wrong and
banned ingredients, carcinogens and raw materials of the narcotic drug, Ecstasy. Overall, 195 of
391 drugs had little or no artesunate representing 49.9% failure rate; a genuine drug was
supposed to have 50mg of the API, but instead, majority of the samples had only 12mg. Those
samples that were counterfeit were also found with some pollen, calcite as well as charcoal and
further investigations traced these face medicines to South-East China [62]
.
Nayyar et al. reviewed published and unpublished study data from 7 countries of Southeast Asia
and sub-Saharan African regions to establish the extent of distribution of poor quality
antimalarials between 1999 and 2010. Data for five classes of antimalarial drugs consisting of
artemether, artesunate, chloroquine, mefloquine, quinine, sulphadoxine–pyrimethamine and
tetracycline were collected from Southeast Asia. For southeast Asia, multinational surveys of
seven countries showed that while 497 out of 1437 (35%) of the drug samples had failed
chemical tests, 46% (423/919) of the samples had failed packaging analyses and assessments,
while 36% (450/1260) were found to be counterfeit. However, due to the lack of enough data,
they could not establish the frequency of substandard antimalarials [63]
.
University of Ghana http://ugspace.ug.edu.gh
33
2.8.2 Reports from Africa
In Tanzania, a sample of an antimalarial drug purported to contain dihydroartemisinin (60
mg/tablet, cotecxin) was found on analysis using both TLC and HPLC to contain none of the
active ingredients [64]
. In another study also conducted in the same country in 2005, 1080
samples consisting of 679 antifolates (SP, 394 and sulphamethoxypyrazine/pyrimethamine, 285),
260 amodiaquine, 63 quinine and 51 artemisinin derivatives were collected from retail shops in
21 districts. Out of the total number of the samples, 304 samples were selected for the laboratory
analysis during which US pharmacopoeia monographs were used when available for dissolution
and HPLC tests. The HPLC and dissolution test results showed that 13% of the antifolate
samples had poor quality, while 23.8% and 7.5% of quinine and amodiaquine samples
respectively were found to be of poor quality, with all the artemisinin derivative samples being
found compliant [65]
.
In Cameroun, a study conducted in 2004 to investigate the quality of 284 samples comprising
chloroquine, quinine and sulphadoxine-pyrimethamine components collected from 132 different
unauthorised retailers and distributors of the rural and urban areas, in which simple colour
reaction tests and SQ-TLC methods were used reported that 38% (50/133), 74% (52/70) and
12% (10/81) of the drug tablets had failed the quality tests due to the presence of either
unsatisfactory, wrong, unknown or inactive pharmaceutical ingredient(s) [66]
.
In Ghana, a study was conducted by Osei-Safo et al. in 2009 on various samples of antimalarial
drugs collected from selected parts of Accra. The results showed that out of 49 samples
comprising single tablet artemisinin-based fixed-dose combination drugs, separately formulated
University of Ghana http://ugspace.ug.edu.gh
34
artemisinin-based combination drugs packaged on the same blister to be taken concomitantly
(ACTs) and artemisinin-based monotherapy formulations, only 28.6% (14/49) fulfilled the
pharmacopoeia standards based on SQ-TLC. When these samples were further subjected to
HPLC test, only 8.0% (4/49) of the samples complied with pharmacopoeia standards [67]
. In
2012, a related study was conducted in Ghana by Addae-Mensah et al. as part of a joint Ghana-
Togo study. 86 antimalarial drug samples consisting of 50 ACTs, 8 artemisinin monotherapy and
28 non-ACTs were collected from the major cities and border towns. The samples were analysed
using basic tests, SQ-TLC and HPLC tests. The results showed that there was a widespread
circulation of poor quality drugs, whereby 6 out of 7 zones of the collection exercise had samples
that failed the tests, with one zone recording an 85% failure rate and more than 60% failure rate
by the others. Out of the 50 ACTs, 8 (17%) were compliant with the Ph. Int. requirements, with
39 (83%) being non-compliant. In addition, out of the 8 artemisinin monotherapy samples, 1
(12.5%) was compliant, whereas a further 1 (12.5%) and 6 (75%) were marginally compliant and
non-compliant respectively. While 12 (43%) of the non-ACTs passed the tests, 16 (57%) failed
the tests. Majority of the samples failed due to the inadequacy of API amounts [68]
In Kenya and DR Congo, a survey on the quality of artemisinin-based drugs conducted on 24
samples collected and analyzed using European Pharmacopoeia guidelines showed that 9 did not
comply with the quantity requirement of 95-105% of the labelled content, but all the failed
samples had some traces of the API [69]
. Separately, another study was conducted in East DR
Congo using European Pharmacopoeia guidelines on chloroquine syrup and injection batches,
quinine injection batches, SP tablet batches and proguanil batches. Outcomes showed that
samples from one batch out of the two chloroquine injection batches investigated using UV-
University of Ghana http://ugspace.ug.edu.gh

35
spectrophotometry and HPLC-UV were overdose by 14% and samples from one out of the four
selected quinine injection batches were overdose by 8%, whereas chloroquine syrup was
compliant with the European Pharmacopoeia limits of 95-105%. Samples containing
sulphadoxine-pyrimethamine components that were analysed using HPLC-UV only showed that
sulphadoxine component of the samples were under dosed (91-94%) with respect to European
Pharmacopoeia (95-105%), but within the compliance limits according to the United States
Pharmacopoeia (90-110%) requirements in all the batches. However, samples from two of the
sulphadoxine-pyrimethamine batches had pyrimethamine components that were overdose by
106% and 108% respectively and one batch had its samples found without any of the requisite
ingredients. In addition, proguanil also passed after registering 98.7% of the label claim [70]
.
In Nigeria, a survey was conducted in 2001, in which 581 drug samples were collected from
pharmacies. Two hundred and eighty-six (286) of the drug samples were antimalarials while the
rest were antibacterial, antifungal and antituberculosis drugs. They collected drug samples that
were on the WHO model list of essential drugs only. The samples were analyzed for API
content using a corroborated HPLC method in accordance with British Pharmacopoeia (BP)
specifications. The validated HPLC methods were used in this survey and the results compared
with pharmacopoeia requirements. Out of the 286 antimalarial drug samples were 82 chloroquine
phosphate (29 capsules, 20 syrups, 18 tablets and 15 injections), 31 chloroquine sulphate (11
syrups, 19 tablets and 1 capsule), 19 proguanil hydrochloride tablets, 10 quinine hydrochloride
injection, 18 quinine sulphate (1 syrup and 17 tablets) and 126 sulphadoxine-pyrimethamine (SP)
(100 SP tablets and 26 syrups). The results of chloroquine phosphate showed that 70% (20),
100% (20), 94% (17) and 93% (14) of the capsules, syrups, tablets and injections respectively
University of Ghana http://ugspace.ug.edu.gh
36
fell outside the BP limits, while the failure rates in chloroquine sulphate samples were as
follows; syrups (73%; 8/11), tablets (79%; 15/19) and 0% for the capsules. Out of the 17 quinine
sulphate tablets, 24% (4) failed the tests. Of the 100 SP tablets and the 26 syrup samples, 13%
(13) and 30.79% (8) respectively failed the tests. All proguanil hydrochloride, quinine
hydrochloride injections and quinine sulphate syrup registered compliance with the BP
specifications [71]
.
In 2003, WHO carried out a pilot study on samples of SP, chloroquine tablets and syrups
collected from Ghana, Sudan, Gabon, Zimbabwe, Mali, Mozambique, Kenya and Tanzania. The
samples were analyzed for quality in terms of API content and dissolution. Table 2 below shows
the combined percentage results from all countries with the results of the samples failing
pharmacopoeial standards out of the total number of samples analysed. Samples from Tanzania
were not analyzed because their collection was delayed and samples from Gabon were not
analysed for dissolution tests because they were too few. Therefore, the results showed a
widespread circulation of poor quality antimalarial drugs throughout the study countries. The
report also showed that most samples failed the tests due to insufficient amount of the APIs for
chloroquine samples, but for SP samples, dissolution rather than API content accounted for an
unusually high failure rate. Such poor results were attributed to poverty which in turn gave rise
to poorly equipped laboratories, under-funded regulatory bodies and poor handling and
manufacturing practices [72, 73]
. However, the undesirable quality of the drugs might also have
been caused by greed on the part of certain manufacturers.
University of Ghana http://ugspace.ug.edu.gh

37
In Uganda, a market survey in May, 2007 identified a quinine BP 300mg tablet as fake. The
general public was then notified of this drug by the National Drug Authority. The drugs were
identified as having batch number 0908, manufactured in 2006 with 2009 as expiry date. It was
found that the drugs were not manufactured by the sole licensed pharmaceutical producer of
quinine in Uganda, the Kampala Pharmaceutical Industries Ltd as claimed on the package [74]
.
Table 2: Combined country results: percentage failure of samples
Country Chloroquine
syrups
Chloroquine tablets Sulphadoxine/pyrimethamine
Tablets
API Content
(%)
API Content
(%)
Dissolution
(%)
API Content
(%)
Dissolution (%)
Gabon 0, (0/8) 29.0, (5/17) 14.29, (1/7) 0, (0/10) -
Ghana 5.0, (1/20) 66.7, (12/18) 20.0, (3/15) 37.5, (3/8) 75.0, (3/4)
Mali 66.7, (4/6) 47.3, (9/19) 5.2, (1/19) 0, (0/7) 100, (7/7)
Kenya 25.0, (2/8) 42.8, (3/7) 28.6, (2/7) 0, (0/12) 91.7, (11/12)
Mozambique 25.0, (3/12) 20.0, (3/15) 6.7, (1/15) 5.5, (1/18) 100, (18/18)
Sudan 26.6, (4/15) 5.2, (1/19) 12.5, (2/16) 0, (0/20) 80.0, (12/15)
Zimbabwe 13.3, (2/15) 57.1, (8/14) 7.1, (1/14) 10.0, (1/10) 100, (10/10)
Average failure 23.0 38.3 12.2 7.6 91.1, (n= 6)
Range 0-66.7% 20-66.7% 5.2-28.6% 0-37.5% 75-100%,(n= 6)
In Kumasi (Ghana), a study was also conducted on artesunate containing samples to assess the
content of the API and the uniformity test on tablets in accordance with European
Pharmacopoeia and International Pharmacopoeia specifications. Results showed that content
analysis gave API content range of 47.9-99.9% for all samples. Specifically, 11 (47.1%) failed
the content uniformity test, while 6 (35.3%) passed the tests with respect to International
Pharmacopoeia specifications. Additionally, 3 samples (17.6%) conformed to European
Pharmacopoeia conditions for API content [75]
. In 2009, fake Coartem tablets were reported to be
University of Ghana http://ugspace.ug.edu.gh
38
circulating on the Ghanaian market. Analysis of the samples found them to contain none of the
requisite APIs labelled on the pack [76]
.
In 2008, another study was carried out in 6 countries from the most malarious regions of Africa
and the selected countries were Kenya, Rwanda, Uganda, Tanzania, Ghana and Nigeria. A total
of 210 antimalarial drugs consisting of artemether-lumefantrine, artesunate, artemether,
dihydroartemisinin, mefloquine and amodiaquine were selected and the semi-quantitative thin
layer chromatography method coupled with dissolution tests were used for analysis. It was
reported that dihydroartemisinin had the highest failure rate of 55% followed by amodiaquine
(48%), SP (38%), artesunate (31%), artemether (27%), mefloquine (24%) and artemether-
lumefantrine (19%). Furthermore, the country drug failure rates were Ghana (35%), Kenya
(38%), Nigeria (32%), Rwanda (33%), Tanzania (32%) and Uganda (35%) [45]
.
In South East Nigeria, Onwujekwe et al. (2009) conducted a survey on artesunate,
dihydroartemisinin, SP, quinine and chloroquine to assess their dissolution efficiency and
content in some 4 artesunate samples as well as some 24 dihydroartemisinin samples using an
uncertified HPLC method. All the Artesunate samples passed the tests, while 46% of the quinine
as well as 39% of SP failed and were found to be substandard. Generally, 37% of the samples did
not comply with the pharmacopoeia requirements [77]
.
In Tanzania, following the detection of a fake Metakelfin by the Tanzania Food and Drug
Authority (TFDA) in 2009 on the markets through an inspection of some 40 pharmacies, the
Drugs Board suspended the drugs’ importation, distribution, sale and use. The study revealed
University of Ghana http://ugspace.ug.edu.gh
39
that the fake drugs had batch numbers that were not approved at the time of importation and
some had low API content inconsistent with the 90-110% pharmacopoeia requirement [78]
. A
separate survey in the same country found some wheat flour instead of the labelled APIs [79]
.
Between 2001 and 2005, Thoithi et al., sampled 41 packs of antimalarials in Kenya comprising
Artemisinin derivatives, SP, Quinine and Amodiaquine to assess them for content and
dissolution compliance using pharmacopoeia guidelines. Many SP drugs failed especially the
dissolution tests. In addition, half (50%) of the 20 SP samples and one-third (33.33%) of
artemisinin-based drugs did not comply with the pharmacopoeial requirements [80]
.
A WHO (2011) report outlined the status of the quality for antimalarials in six sub-saharan
countries. The six selected countries were Cameroon, Tanzania, Ghana, Kenya, Nigeria and
Ethiopia and the samples collected were ACTs and SP. Out of the six countries, Nigeria had the
highest failure rate of 64%, followed by Ghana (39%), Cameroon (37%), Tanzania (11%),
Kenya (5%), and Ethiopia (0%). However, Ethiopia registered 41% of non-registered drugs,
making the country vulnerable to fake drugs. Most of the poor drug results were attributed to low
API content, degradation products and poor dissolution. For example, 62.5% of ACTs failed due
to the low API content and dissolution failure. Samples containing SP also had a failure rate of
66.7%. The overall assessment showed that 33% of the drugs were non-compliant. Most of the
countries with high failure rates had their antimalarial products sourced from many different
manufacturers. Imported drugs had similar failure rate results for both registered and non-
registered. The results analysis led to the speculation that the non-compliance might have come
from poor manufacturing practices [55]
.
University of Ghana http://ugspace.ug.edu.gh
40
In Malawi, a national survey was conducted in 2007 to assess the quality of antimalarial drugs
upon request from USAID-funded Strengthening Pharmaceutical System (SPS) programme, after
being neglected in several WHO QAMSA multinational surveys. A total of 199 antimalarial drug
samples consisting of 57.8% and 42.2% of ACTs and SP respectively were collected throughout
the country from all the pharmaceutical outlets. After rejecting 26 (13%) monotherapies the
remaining 173 samples were analysed. The samples were analyzed using the Minilab physical
and basic tests in Malawi and confirmed later in Kenya. Results showed that all samples tested
positive for disintegration and basic tests and 4% (8) failed the physical examination. In addition,
16% (8/50) of the samples failed confirmatory tests and out of the 8 samples that failed the
confirmatory tests, 37.5% (3/8) were SP and 62.5% were ACTs (branded and generic); 12.5%
(1/8) was not compliant with uniformity tests and a further 87.5% (7/8) failed dissolution test.
This study helped the country to have an insight into establishing a national antimalarial drug
monitoring system [81]
.
Several programmes and studies have been conducted in Malawi and some are still ongoing to
kick out malaria. The options being employed include treatment modalities and diagnostic
techniques, epidemiology, community and public health education, pharmacological and clinical
efficacy and genetic diversity, intermittent preventive treatment of pregnant women (IPTp),
insecticide treated net (ITNs) and indoor residual spraying (IRS) [82]
, with little or no attention
being paid to quality control studies. In addition, reported cases of the surveillance of drug
quality by the national drug regulatory authority on the required capacity, scale and frequency or
their occurrence is not well documented in the published literature. This declaration of the
capacity of the regulatory body is made following an ACT Consortium report by Staedke in 2009
University of Ghana http://ugspace.ug.edu.gh

41
[83] which recommended the establishment of drug safety register and systematic surveillance to
monitor the quality, influx of poor quality drugs, their sources and the extent of the effects of
transportation and storage on the quality of genuine drugs in Malawi. In addition, SPS in its 2011
report following a survey also categorised Malawi as one of the countries that had no or minimal
capacity for pharmacovigilance (PV) due to the lack of legal or structural frameworks for PV
systems, no coordinated passive/active surveillance and lack of national coordination in any
ongoing PV activity [84]
. Unconfirmed reports from the regulatory authority in 2012 revealed that
such activities are being undertaken with specific activities and extent not mentioned. However,
the Ministry of Health and the Drug Regulatory Board issued a statement that all drugs that are
distributed in government and Christian Health Association of Malawi (CHAM) health centres
are tested for efficacy, safety and quality [85]
, with no mention of drugs accessed from the private
drug stores or pharmacies as well as the parameters assessed.
In a nutshell, there has been widespread circulation of poor quality drugs in some parts of Asia
and Africa. Most of them contain sub-therapeutic amounts of the APIs or no API at all or even
toxic compounds and if this is not checked, it can lead to emergence of drug resistance.
2.9 QUALITY ASSESSMENT METHODS
There is ample evidence that circulation of poor quality drugs in Africa is increasing at an
alarming rate due to poor regulatory capabilities in most regulatory authorities in terms of
manufacturing and import regulations [45]
. As one of the ways of moving towards a counterfeit
drugs-free society, the WHO Roll Back Malaria Initiative urges all those that have adopted its
University of Ghana http://ugspace.ug.edu.gh
42
initiative into malaria programmes to implement one of its goals that stipulates that at least 80%
of antimalarial products in a country should satisfy acceptable international quality standards [49]
.
So many mitigating factors have been employed to solve this problem of substandard and bogus
drugs inflow. These include consistent monitoring of drugs quality to ensure the purchase,
supply, import, manufacture and distribution of quality drugs. Guidelines and methodologies for
the quality assurance surveillance are outlined in the pharmacopoeias for this exercise [86]
.
2.9.1 Pharmacopoeia Methods
There are several pharmacopoeias by individual countries, territories, regions and many more.
However, few have been adopted, then widely used and these are United States Pharmacopoeia
(USP), British Pharmacopoeia (BP), Japanese Pharmacopoeia (JP), European Pharmacopoeia
(Ph. Eur.), Pharmacopoeia of the People's Republic of China (PPRC) and International
Pharmacopoeia (Ph. Int.). These pharmacopoeias have common features outlining recommended
methods from published monographs with information such as procedures for analysis,
determination of active pharmaceutical ingredients (APIs), excipients and dosage forms.
Most of the pharmacopoeia guidelines are very expensive and difficult to organize for many
programmes in developing countries. Therefore, to minimize this cost burden, the Directorate of
Quality Assurance and Safety: Medicines of the WHO introduced a programme aimed at
developing cost effective reliable methods of chemical analysis to be adopted by national drug
regulatory authorities in standard noncompliance screening prior to drug’s use. Therefore, cost
effective methods have been developed suitable for the screening of artesunate, artemether and
University of Ghana http://ugspace.ug.edu.gh
43
other derivatives’ quality [87]
. Some of these innovated methods are used together with those
pharmacopoeia methods that are cheaper and easy to use. Indeed, the WHO developed the
International Pharmacopoeia as a means of providing simple inexpensive but accurate methods
that can be used in any less well-endowed analytical laboratory.
2.9.2 Case Studies on Method Developments
Green et al. developed and validated colorimetric [ARTS-Fast red TR (FRTR)] method. It was
initially developed for the detection of fake artesunate, which was later extended to artemisinin,
dihydroartemisinin and other derivatives. For artesunate analysis, artesunate is decomposed to an
alkaline product which reacts with fast red TR salt giving a yellow colour. The absorbance of the
yellow colour is then measured. Furthermore, Green et al. went on to find out the efficiency of
using colorimetric and refractometric methods alone and together by comparing them with the
HPLC assay results. Effectiveness of refractometry and colorimetry combined was observed in
the assessment of artesunate, chloroquine injection, quinine and sulphadoxine with an accuracy
of 0.96-1.00, while the accuracy was lower for enteric-coated chloroquine with an accuracy of
0.78 [88]
.
In 2004, German pharmaceutical companies involved in research set up a charitable trust called
German Pharma Health Fund (GPHF), which developed a mini-laboratory tool called GPHF-
Minilab containing consistent, cheap and simple methods for the prompt verification of drug
quality for tuberculosis, malaria and HIV/AIDS, antibiotics and many more important drugs in
low income or developing countries. This was aimed at detecting fake and substandard drugs [89]
.
University of Ghana http://ugspace.ug.edu.gh
44
An easy thin-layer chromatography (TLC) method was also developed and reported by Ioset and
Kaur in 2009. The method was developed for artemisinin and its derivatives detection in
antimalarial drugs, using 2,4-dinitrophenylhydrazine or 4-benzoylamino-2, 5-
dimethoxybenzenediazonium chloride hemi (zinc chloride) salt as a spraying agent. The presence
of artemisinin and derivatives is shown by a pink colour for the former reagent and blue colour
for the latter reagent. However, the method cannot detect artemisinin and derivatives of contents
10% or less [90]
.
At the request of the WHO, Addae-Mensah and Osei-Safo in 2006 also developed and validated
a user-friendly semi-quantitative thin layer chromatography method for artemisinin and non-
artemisinin antimalarials with two suitable solvent systems for each API and
anisaldehyde/methanol as a spraying reagent for the artemisinins. This method gives a valid
estimation of the API in a drug which can then be more accurately verified by an HPLC method.
The method is useful for rapid field estimation of the quality of all antimalarial drugs [91]
. This
method has subsequently been successfully used in two major World Health Organisation
(WHO) and West African Health Organisation (WAHO)-sponsored surveys [67, 68, 92]
. This
method has also been used in the current study and the procedure has been articulated in the
subsequent chapters.
2.9.3 Other Analytical Methods
Most of the methods developed above are mostly for rapid tests in areas that are economically
challenged and they are partially accurate, although some accurate but expensive methods have
also been developed the same way. Therefore, it is recommended that confirmatory tests using
University of Ghana http://ugspace.ug.edu.gh
45
other more accurate, specific and precise though expensive expertise-technology dependent
methods such as High Performance Liquid Chromatography (HPLC) and Dissolution tests
should be used to complement the TLC and basic disintegration results respectively. TLC and
basic disintegration tests are tentative or approximate hence can be easily challenged [48, 55]
. Other
tools that have been used in this course include GPHF Minilab, HPLC (coupled with either of the
following; fluorescence, single wavelength ultraviolet/visible absorbance, photodiode array
(PDA), electrochemical or refractive index), HPLC-Mass spectroscopy hyphenated method (LC-
MS), Open air ionization-mass spectroscopy, desorption electro spray ionization (DESI)-mass
spectroscopy and many more [48]
.
2.9.4 Selected Quality Control Tools for the Present Study
Following the recommendations by WHO and other players reported in the literature for post-
market surveillance of antimalarial drugs, the following methods have been selected for the
current study:
2.9.4.1 Visual Inspection
A drug sample can be subjected to visual inspection which among others involves the
verification of tablets’ mass uniformity, size, colour, crimping, weight, printing, bar codes and
holograms in comparison to the authentic genuine drugs. However, this method has suffered a lot
due to an overwhelming response by counterfeiting entities such that counter-mechanisms have
been applied to beat this trap. The features used under this method are also difficult to determine,
i.e. difficult to differentiate between a genuine and counterfeit drug. However, it is still suitable
and widely used in surveillance in resource constrained poor developing countries [52]
.
University of Ghana http://ugspace.ug.edu.gh

46
2.9.4.2 Basic Tests
These are simple and readily applicable methods used to confirm the identity of APIs [93]
. Due to
the success and challenges the visual inspection method has met, there are some methods that are
supposed to be done in addition to it such as basic or colorimetric tests. The literature and
International pharmacopeia (Ph. Int.) have reported several methods of basic tests that are mainly
based on the functional group of a drug [93, 94, 95, 96]
.
For example, artemisinins have been analyzed as follows: heating of a drug sample extract with
potassium iodide producing a yellow colour; reaction of potassium iodide (KI) / starch with
sample extract to produce a violet colour; reaction of Hydroxylamine HCl with a sample
producing reddish violet colour. The colour change in each case indicates the presence of an
API. The Figures 9 and 10 below show the reaction mechanisms of artemisinins reacting with
KI / starch and vanillin / sulphuric acid (H2SO4) as examples [94]
.
Firstly, Figure 9 below shows an artemisinin derivative reacting at room temperature in the
presence of glacial acetic acid and concentrated sulphuric acid mixture (10:1), producing a
combination of α, β-unsaturated ketones (ketone-lactones). These products, therefore, react with
an aromatic aldehydic vanillin whose product gives the observed corresponding pink colour in
artemisinin derivatives basic tests [94]
. Secondly, Figure 10 shows an alternative path a reaction
can take; after an artemisinin derivative has reacted in the presence of an acid to produce many
products, amongst them hydrogen peroxide (H2O2), i.e. from step XXXIII to XXXIV in Figure
9; the peroxide can be involved in a chemical reaction instead. Addition of KI at that stage
results in the oxidation of iodide to iodine. Addition of starch reagent gives a colour reaction [94]
.
University of Ghana http://ugspace.ug.edu.gh
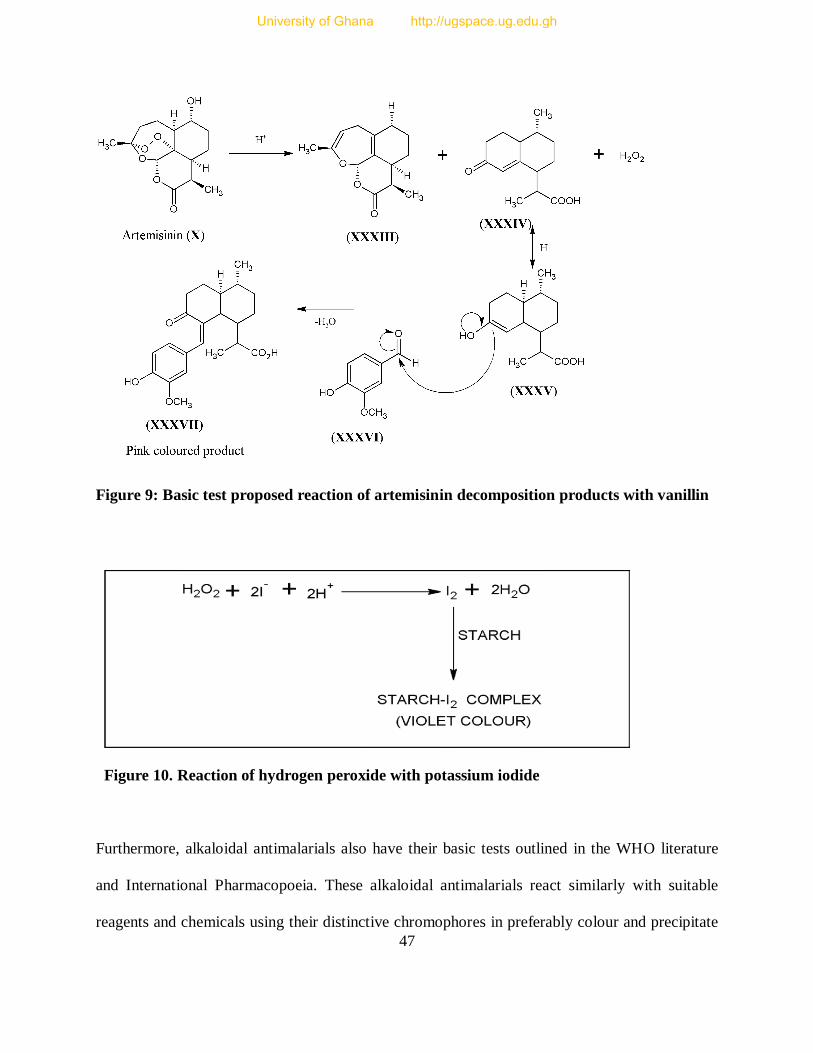
47
Figure 9: Basic test proposed reaction of artemisinin decomposition products with vanillin
Figure 10. Reaction of hydrogen peroxide with potassium iodide
Furthermore, alkaloidal antimalarials also have their basic tests outlined in the WHO literature
and International Pharmacopoeia. These alkaloidal antimalarials react similarly with suitable
reagents and chemicals using their distinctive chromophores in preferably colour and precipitate
University of Ghana http://ugspace.ug.edu.gh
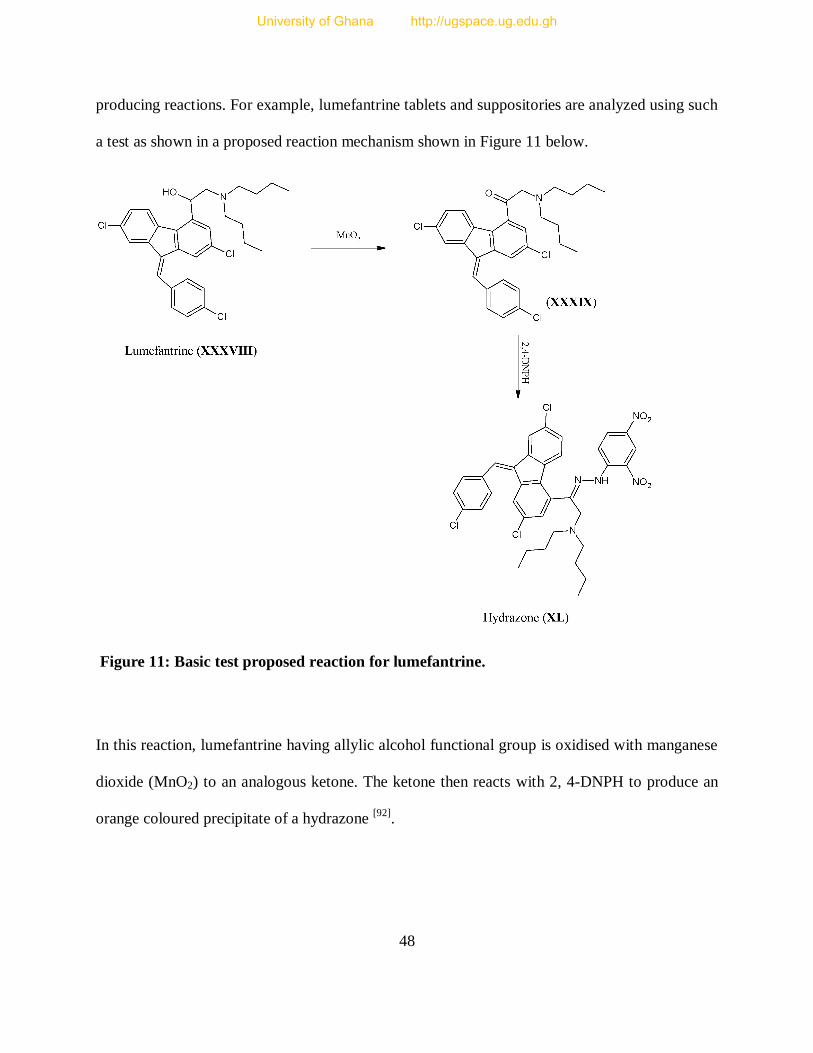
48
producing reactions. For example, lumefantrine tablets and suppositories are analyzed using such
a test as shown in a proposed reaction mechanism shown in Figure 11 below.
Figure 11: Basic test proposed reaction for lumefantrine.
In this reaction, lumefantrine having allylic alcohol functional group is oxidised with manganese
dioxide (MnO2) to an analogous ketone. The ketone then reacts with 2, 4-DNPH to produce an
orange coloured precipitate of a hydrazone [92]
.
University of Ghana http://ugspace.ug.edu.gh
49
Basic tests are simple and readily available methods to confirm the presence of API using easily
available reagents. It would also serve to inform if significant degradation has occurred in
substances under unfavourable conditions [95]
. However, this method cannot give quantity of an
API and compounds with functional group similar to the required API can react similarly giving
a false impression. For example, any compound with a similar allylic alcohol in Figure 11 can
react similarly [92]
.
2.9.4.3 Semi-Quantitative Thin Layer Chromatography (SQ-TLC)
There has been a wide call to use semi quantitative TLC, and basic disintegration test in addition
to the basic tests in pharmaceutical analysis, whereby the latter serves as a basic predictor of the
time taken for the drug to break up for body absorption [49]
. A TLC method, apart from its
primary purpose, can also expose the impurities and substances resulting from degradation if
they are in significant proportions [48]
. This method is relatively easy, inexpensive, selective and
cost effective. Results based on this method can be used to qualify a product as satisfying label
specifications and legal for use [97]
. In addition, it uses inexpensive and affordable technology,
hence suitable for resource-limited communities and institutions [98]
. Nevertheless, this method
cannot detect the counterfeits containing incorrect inactive or active ingredients if they cannot be
eluted by the solvent system and visually seen by the reagents employed for the correct API [97]
.
2.9.4.4 High Performance Liquid Chromatography (HPLC)
It is a chromatographic technique that separates a mixture of compounds for further activities
such as identification, purification or quantification of compounds in a mixture. It is used for
medical, legal, research and manufacturing purposes [99]
. For example, it is generally used for the
University of Ghana http://ugspace.ug.edu.gh
50
analysis of impurities of volatile and non-volatile compounds. It is also used for isolation,
separation and purification of compounds, determination of ionic, zwitterionic and neutral
molecules, preparative and process-scale separation ultra-tracing as well as qualitative and
quantitative purposes [100]
. It is a non-destructive method and can separate closely related
compounds and a large variety of compounds such as organic, inorganic, biological, chiral and
thermally labile compounds, polymers, small ions as well as macromolecules. HPLC has had a
wide variety of applications such as measuring levels of active drugs, synthetic by-products,
degradation products in medicines, hazardous compounds (like pesticides) as well as some
compounds (amino acids, nucleic acids, and proteins) in physiological samples. In addition, it is
used for monitoring environmental samples, purification of compounds, separation of polymers
and determination of their weight distribution in mixtures, tracking synthetic reactions and
quality control [100]
.
It works based on the basic principles of chromatography, where the components carried by a
mobile phase interact with a stationary phase (sorbent) subsequently causing separation [100, 101]
.
The principle is the same as TLC, with the difference being the use of a pump in HPLC to pass
the mobile phase and sample mixture with an operational pressure through a column, as opposed
to TLC which depends on gravitational force for the mobile phase mobility. In addition, the
sorbent materials in HPLC are smaller (average 2-5 micrometer), giving it a better resolving
power. The typical solvents used are water, acetonitrile and/or methanol. The separation process
is controlled by the temperature and composition of mobile phase, which influence the
interaction between sample components and sorbent, which could be in the form of dipole-
dipole, ionic and dispersive (hydrophobic) forces [99]
.
University of Ghana http://ugspace.ug.edu.gh

51
A typical HPLC system has a mobile phase reservoir, degasser, pump (50-350 bars), injector,
column compartment, detector, data processor and waste collector. Using an HPLC requires
suitable column, mobile phase solvents/reagents, standard solvent, analytical instruments (pH
meter and balance), reference standard (for quantification), glassware and many more [102]
. There
are different kinds of detectors such as UV/Vis absorbance detector, fluorescence detector,
electrochemical detector, conductivity detector, refractive index detectors, mass spectrometer
[100], and photo diode array (PDA)
[99].
There are different kinds of columns with different modes of separation as shown in Table 3
below [101]
.
Table 3: Kinds of chromatographic columns and their modes of separation
Type of Column Mode of Separation
Normal / reversed phase Hydrophobicity (polarity) differences
Gel filtration Size (molecular weight) differences
Ion exchange Charge difference at particular pH
(Bio-) affinity Interaction difference with ligand
HPLC is widely used for pharmaceutical analysis in drug discovery, development,
manufacturing and post-marketing quality control routine tests due to its sensitivity and
accuracy. In pharmaceutical analysis, the widely used columns are reversed and normal phase
columns [102]
, with the former preferentially used often [101]
. The two columns differ due to the
polarity of mobile and stationary phases as illustrated in Table 4 below.
University of Ghana http://ugspace.ug.edu.gh
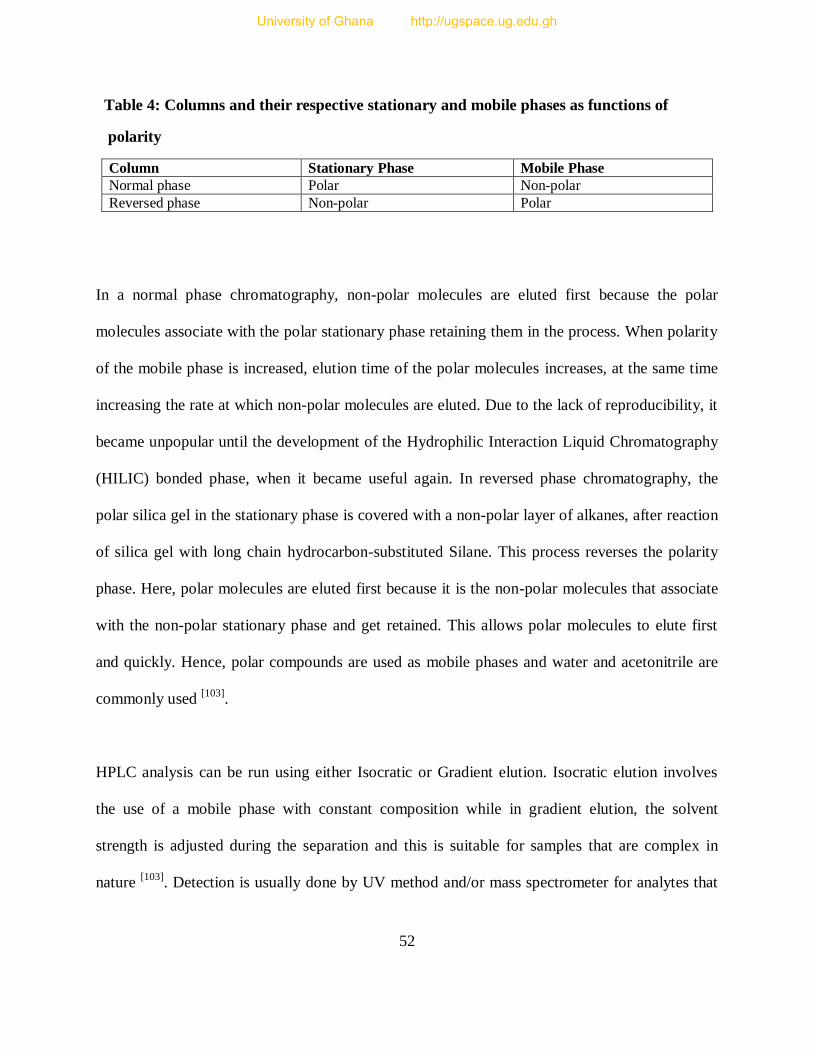
52
Table 4: Columns and their respective stationary and mobile phases as functions of
polarity
Column Stationary Phase Mobile Phase
Normal phase Polar Non-polar
Reversed phase Non-polar Polar
In a normal phase chromatography, non-polar molecules are eluted first because the polar
molecules associate with the polar stationary phase retaining them in the process. When polarity
of the mobile phase is increased, elution time of the polar molecules increases, at the same time
increasing the rate at which non-polar molecules are eluted. Due to the lack of reproducibility, it
became unpopular until the development of the Hydrophilic Interaction Liquid Chromatography
(HILIC) bonded phase, when it became useful again. In reversed phase chromatography, the
polar silica gel in the stationary phase is covered with a non-polar layer of alkanes, after reaction
of silica gel with long chain hydrocarbon-substituted Silane. This process reverses the polarity
phase. Here, polar molecules are eluted first because it is the non-polar molecules that associate
with the non-polar stationary phase and get retained. This allows polar molecules to elute first
and quickly. Hence, polar compounds are used as mobile phases and water and acetonitrile are
commonly used [103]
.
HPLC analysis can be run using either Isocratic or Gradient elution. Isocratic elution involves
the use of a mobile phase with constant composition while in gradient elution, the solvent
strength is adjusted during the separation and this is suitable for samples that are complex in
nature [103]
. Detection is usually done by UV method and/or mass spectrometer for analytes that
University of Ghana http://ugspace.ug.edu.gh
53
do not show UV absorption. Therefore, to get a desirable well resolved peak, detector, column
type and mobile phase are manipulated [103]
.
When used for quantification, the amount/concentration of the analyte is equivalent to the peak
area of the chromatogram or area under the curve (AUC). The first step involves the creation of a
calibration curve that is produced by generating various chromatographs from different known
concentrations of a reference standard. The peak or curve areas are calculated and equated to
their respective known concentrations and this data is used to plot a graph of area under the
curve/peak (AUC) against the known concentration of the reference standard, to obtain a
calibration curve. The second step involves the determination of the unknown analyte
concentration. A measured amount of the sample of unknown concentration is injected into the
HPLC system and the peak area of its chromatograph is calculated and its concentration is
interpolated from the calibration curve automatically by a computer connected to the HPLC
system.
Like most analytical methods, HPLC also has some limitations like difficult resolution for
complex samples, one sample analysis at a time, training needed for optimum separation,
relatively long analysis times, sample preparation and need for complementary techniques like
MS, NMR and IRS sometimes [100]
as well as the high cost of columns, reference samples and
the HPLC grade solvents.
University of Ghana http://ugspace.ug.edu.gh
54
CHAPTER THREE
3 CURRENT INVESTIGATION
3.1 SAMPLING
3.1.1 Study Area
The selection of study areas was based on the conventional random sampling in all the country’s
3 regions; north, central and south. The country was divided into 4 zones with each zone
consisting of 5-7 districts based on the National Malaria Control Programme (NMCP) strategy
partitions; giving the south west (1), south east (2), central (3) and north (4) zones. In each zone,
the chosen districts were randomly selected based on the prevalence of Malaria, geographical
position and economic activities. These are factors that are deemed to influence the demand and
inflow of drugs. Therefore, the districts that were selected for the survey were Lilongwe,
Blantyre, Zomba, Mzuzu (in Mzimba), Karonga, Dedza, Ntcheu, Mangochi, Mulanje, Thyolo,
Mwanza, Kasungu, Mchinji and Nkhota-kota out of the 28 districts. Figure 12 below is a map of
Malawi showing the zones and the districts in which sampling took place and Table 5 shows the
number of samples that were collected in each zone.
3.1.2 Sample Size
A total of 112 samples was purchased in all the zones based on their availability regardless of
size, company name, brand, product name, dosage form and strength, though not more than one
sample of the same name, batch number and characteristics was bought at one outlet. Some
strategically designated areas were left out due to the lack of antimalarial drug outlets.
University of Ghana http://ugspace.ug.edu.gh
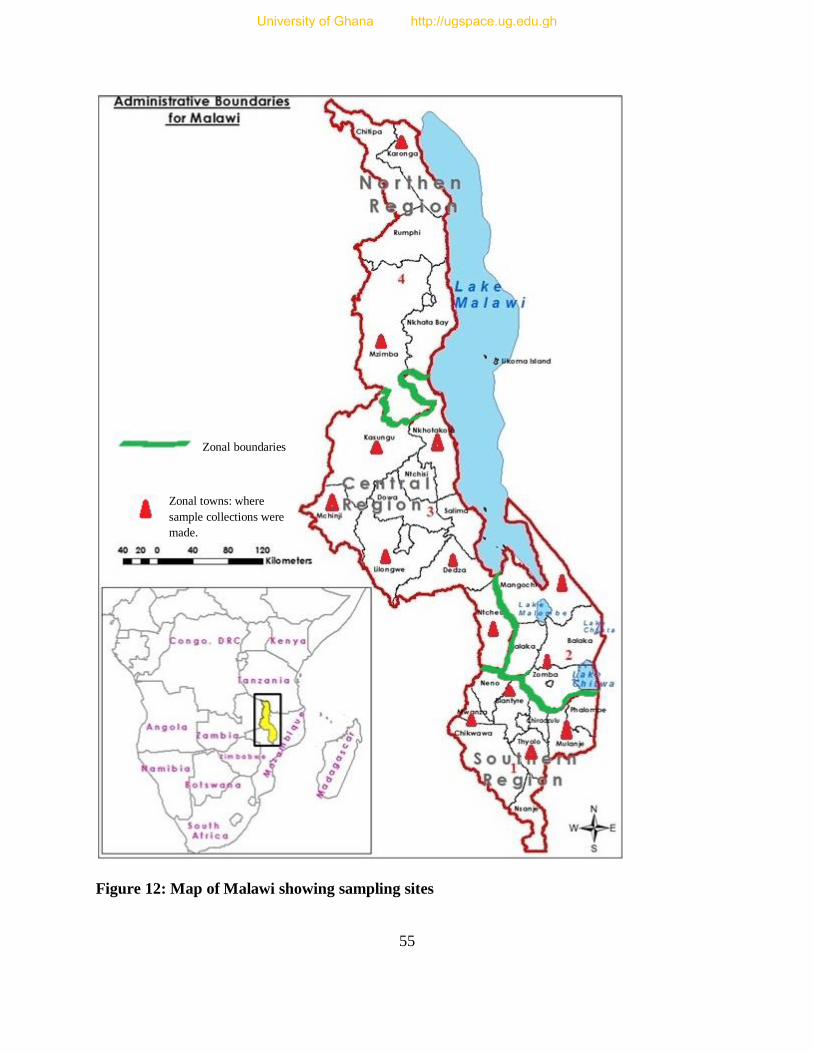
55
Figure 12: Map of Malawi showing sampling sites
Zonal boundaries
Zonal towns: where
sample collections were
made.
University of Ghana http://ugspace.ug.edu.gh
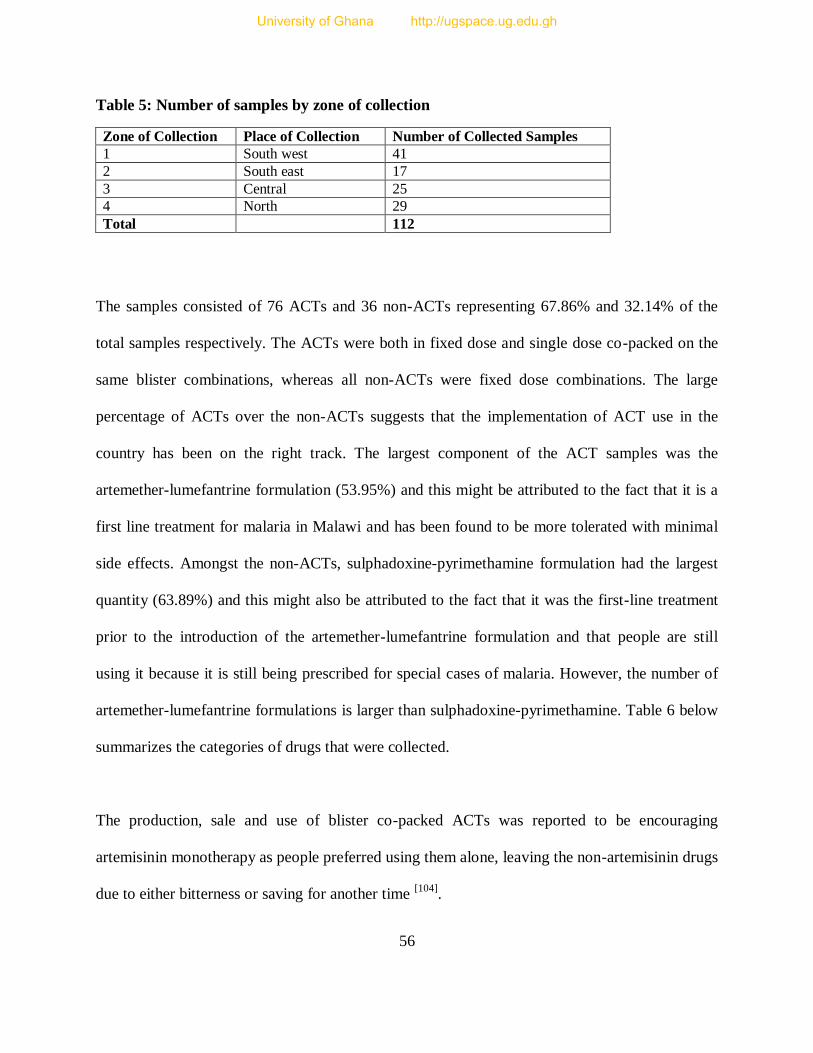
56
Table 5: Number of samples by zone of collection
Zone of Collection Place of Collection Number of Collected Samples
1 South west 41
2 South east 17
3 Central 25
4 North 29
Total 112
The samples consisted of 76 ACTs and 36 non-ACTs representing 67.86% and 32.14% of the
total samples respectively. The ACTs were both in fixed dose and single dose co-packed on the
same blister combinations, whereas all non-ACTs were fixed dose combinations. The large
percentage of ACTs over the non-ACTs suggests that the implementation of ACT use in the
country has been on the right track. The largest component of the ACT samples was the
artemether-lumefantrine formulation (53.95%) and this might be attributed to the fact that it is a
first line treatment for malaria in Malawi and has been found to be more tolerated with minimal
side effects. Amongst the non-ACTs, sulphadoxine-pyrimethamine formulation had the largest
quantity (63.89%) and this might also be attributed to the fact that it was the first-line treatment
prior to the introduction of the artemether-lumefantrine formulation and that people are still
using it because it is still being prescribed for special cases of malaria. However, the number of
artemether-lumefantrine formulations is larger than sulphadoxine-pyrimethamine. Table 6 below
summarizes the categories of drugs that were collected.
The production, sale and use of blister co-packed ACTs was reported to be encouraging
artemisinin monotherapy as people preferred using them alone, leaving the non-artemisinin drugs
due to either bitterness or saving for another time [104]
.
University of Ghana http://ugspace.ug.edu.gh
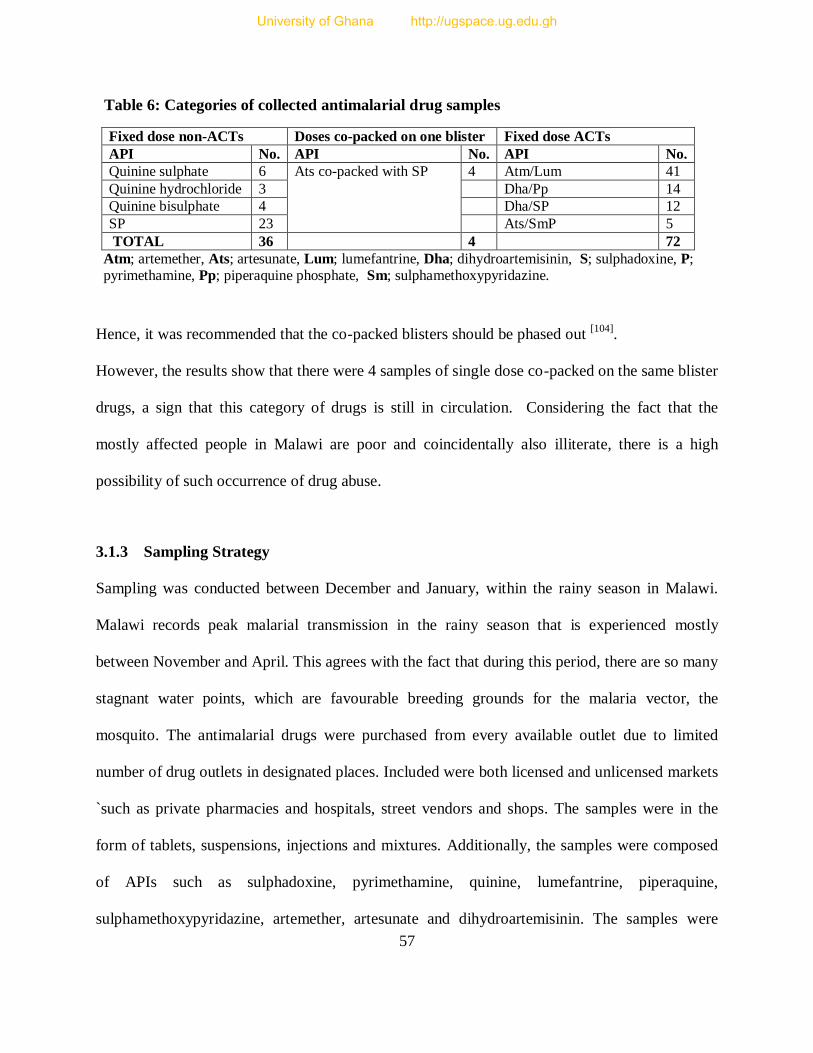
57
Table 6: Categories of collected antimalarial drug samples
Fixed dose non-ACTs Doses co-packed on one blister Fixed dose ACTs
API No. API No. API No.
Quinine sulphate 6 Ats co-packed with SP 4 Atm/Lum 41
Quinine hydrochloride 3 Dha/Pp 14
Quinine bisulphate 4 Dha/SP 12
SP 23 Ats/SmP 5
TOTAL 36 4 72
Atm; artemether, Ats; artesunate, Lum; lumefantrine, Dha; dihydroartemisinin, S; sulphadoxine, P; pyrimethamine, Pp; piperaquine phosphate, Sm; sulphamethoxypyridazine.
Hence, it was recommended that the co-packed blisters should be phased out [104]
.
However, the results show that there were 4 samples of single dose co-packed on the same blister
drugs, a sign that this category of drugs is still in circulation. Considering the fact that the
mostly affected people in Malawi are poor and coincidentally also illiterate, there is a high
possibility of such occurrence of drug abuse.
3.1.3 Sampling Strategy
Sampling was conducted between December and January, within the rainy season in Malawi.
Malawi records peak malarial transmission in the rainy season that is experienced mostly
between November and April. This agrees with the fact that during this period, there are so many
stagnant water points, which are favourable breeding grounds for the malaria vector, the
mosquito. The antimalarial drugs were purchased from every available outlet due to limited
number of drug outlets in designated places. Included were both licensed and unlicensed markets
`such as private pharmacies and hospitals, street vendors and shops. The samples were in the
form of tablets, suspensions, injections and mixtures. Additionally, the samples were composed
of APIs such as sulphadoxine, pyrimethamine, quinine, lumefantrine, piperaquine,
sulphamethoxypyridazine, artemether, artesunate and dihydroartemisinin. The samples were
University of Ghana http://ugspace.ug.edu.gh
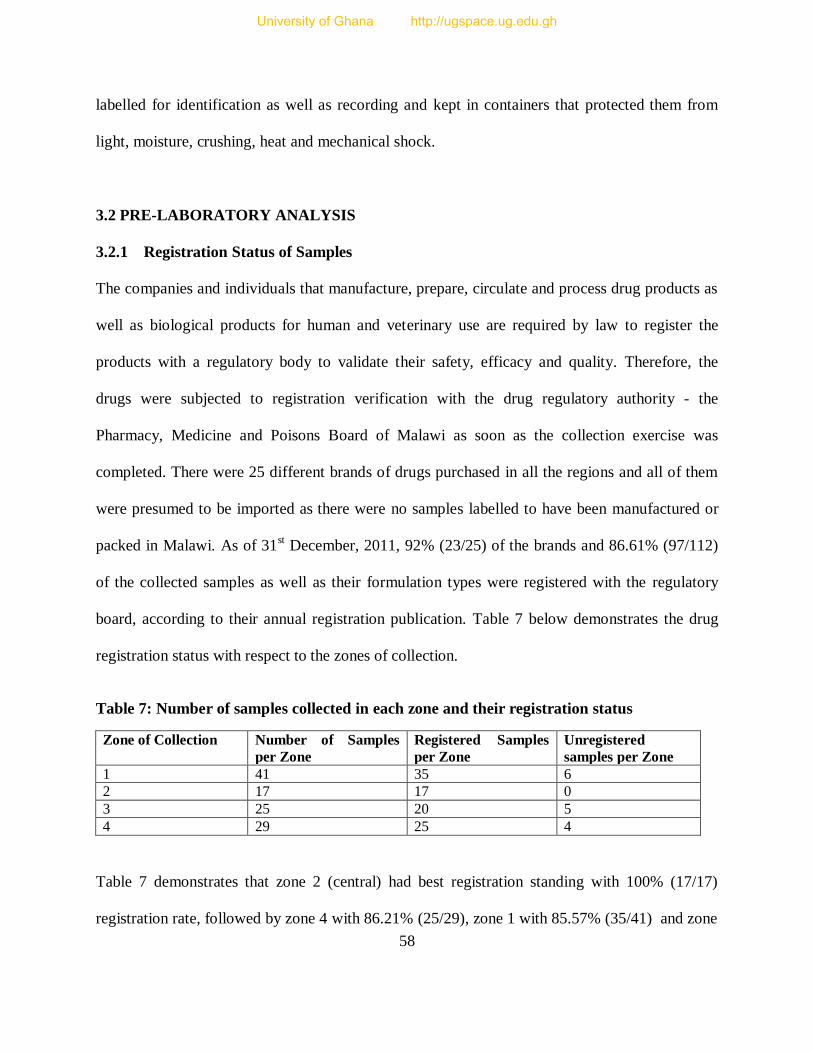
58
labelled for identification as well as recording and kept in containers that protected them from
light, moisture, crushing, heat and mechanical shock.
3.2 PRE-LABORATORY ANALYSIS
3.2.1 Registration Status of Samples
The companies and individuals that manufacture, prepare, circulate and process drug products as
well as biological products for human and veterinary use are required by law to register the
products with a regulatory body to validate their safety, efficacy and quality. Therefore, the
drugs were subjected to registration verification with the drug regulatory authority - the
Pharmacy, Medicine and Poisons Board of Malawi as soon as the collection exercise was
completed. There were 25 different brands of drugs purchased in all the regions and all of them
were presumed to be imported as there were no samples labelled to have been manufactured or
packed in Malawi. As of 31st December, 2011, 92% (23/25) of the brands and 86.61% (97/112)
of the collected samples as well as their formulation types were registered with the regulatory
board, according to their annual registration publication. Table 7 below demonstrates the drug
registration status with respect to the zones of collection.
Table 7: Number of samples collected in each zone and their registration status
Zone of Collection Number of Samples
per Zone
Registered Samples
per Zone
Unregistered
samples per Zone
1 41 35 6
2 17 17 0
3 25 20 5
4 29 25 4
Table 7 demonstrates that zone 2 (central) had best registration standing with 100% (17/17)
registration rate, followed by zone 4 with 86.21% (25/29), zone 1 with 85.57% (35/41) and zone
University of Ghana http://ugspace.ug.edu.gh

59
3 with 80% (20/25). On the whole, the registration status of antimalarials in Malawi was found to
be quite satisfactory, compared to countries such as Ghana and Togo. The most recent studies
indicated 55% and 78% unregistered antimalarials in Ghana in 2008 and 2012 respectively and
17% unregistered antimalarials in Togo in 2012 [67, 68]
3.2.2 Origin of the Collected Drug Samples
None of the drug samples was manufactured locally and an inventory confirmed that they were
imported from Asia, Africa and North America. Figure 13 below shows the countries and regions
where the drugs were manufactured and imported into Malawi.
Figure 13: Sources of the collected drug samples
3.2.3 Visual Inspection of Dosage Form and Packaging
This was done with respect to guidelines outlined in the WHO International Pharmacopoeia
(2006, Version 2). It is stated that “Every pharmaceutical preparation must comply with the
1.79%
11.61% 17.86%
8.04%
60.71%
0.00%
10.00%
20.00%
30.00%
40.00%
50.00%
60.00%
70.00%
USA Tanzania Kenya China India
America Africa Asia
Areas of drug origin
University of Ghana http://ugspace.ug.edu.gh
60
labelling requirements established under Good Manufacturing Practice.” Below are the
requirements as stipulated in the pharmacopoeia:
“(1) the name of the pharmaceutical product;
(2) the name(s) of the active ingredient(s); International Non-proprietary Names (INN) should
be used wherever possible;
(3) the amount of the active ingredient(s) in each tablet and the number of tablets in a container;
(4) the batch (lot) number assigned by the manufacturer;
(5) the expiry date and, when required, the date of manufacture;
(6) any special storage conditions or handling precautions that may be necessary;
(7) directions for use, warnings, and precautions that may be necessary; and
(8) the name and address of the manufacturer or the person responsible for placing the product
on the market.”
A sample was deemed to have passed the visual inspection if it contained all the pharmaceutical
product information outlined above and the results showed that the manufacturers of all the
collected drug samples complied with the packaging material labelling requirements.
3.3 LABORATORY ANALYSIS
3.3.1 Qualitative Colour Reactions
Drugs consist of active pharmaceutical ingredients (APIs) that are responsible for
pharmacological effect and excipients, which are inactive pharmaceutical ingredients added
together with the APIs for the former’s biopharmaceutical, stability and technical purposes.
These are basically chemical compounds and they have some distinctive functional groups,
University of Ghana http://ugspace.ug.edu.gh

61
which are mostly identical to a specific drug API or group of APIs. Reactions and suitable
reagents are chosen to distinguish a particular API from the rest. The reactions that exhibit a
colour change or produce a precipitate are preferable; a colour change or precipitate formation
depicts the presence of the compound in question. This method has been widely used in API
identification because it is rapid, cheap, simple and easily applicable; hence suitable for the
poorly equipped laboratories in less privileged communities, especially in developing countries.
It is mostly the first chemical test for drug products verification of the labelled ingredients after
visual inspection. For each API, at least two methods of identification were used because there
are some compounds that can mimic API reactions and produce false results [95]
.
The present drug samples had different APIs, formulations, excipients as well as dosage forms
and each API had its distinct methodology and apparatus as specified in pharmacopoeias and the
literature. Therefore, all samples were subjected to colorimetric tests to determine if they
contained the APIs claimed by the manufacturers and below are the details of the methods and
procedures that were used.
3.3.1.1 General Procedure
Drug samples in the form of tablets were prepared for analysis by weighing them using
analytical balance individually and all together. The individual and total masses were recorded
and later averages derived from them, then compared for consistency. The tablets were ground
using a pestle and a mortar to powder. The powdered samples were treated according to the
procedures below.
University of Ghana http://ugspace.ug.edu.gh
62
3.3.1.2 Specific Procedure
3.3.1.2.1 Artesunate containing drug samples
Description of the artesunate containing samples:
Tablets of artesunate co-packed on the same blister with sulphadoxine/pyrimethamine
combination tablets; artesunate/sulphadoxine/pyrimethamine: 100mg / 500mg / 25mg
Fixed dose combination tablets of artesunate/sulphamethoxypyridazine/pyrimethamine:
200mg / 500mg / 25mg and 100mg / 500mg / 12.5mg formulations
3.3.1.2.1.1 Artesunate
Colour and other reactions [96, 105]
a) A quantity of the powdered tablets equivalent to 100mg of artesunate was weighed into a
clean dry beaker and 40ml of dehydrated ethanol added. The mixture was shaken together to
dissolve the active ingredients. This was then filtered and the filtrate divided into
approximately 2 equal parts, 20ml each. To one half of the filtrate was added 0.5ml of
hydroxylamine hydrochloride TS 2 and 0.25ml of 2M sodium hydroxide solution. This
mixture was then heated on a water bath to boiling. The solution was then allowed to cool
and two drops of 2M HCl solution added followed by 2 drops of iron (III) chloride (50 g/l).
Expected observation: production of a light-red violet colour
b) The other half of the filtrate from (a) above was evaporated on a water bath to a volume of
about 5 ml. A few drops of the mixture were placed on a white porcelain dish and one drop of
vanillin/sulphuric acid TS1 added.
Expected observation: Production of a reddish-brown colour.
University of Ghana http://ugspace.ug.edu.gh
63
3.3.1.2.1.2 Sulphadoxine:
Colour and other reactions [105]
a) A quantity of the pulverized tablet equivalent to 50mg of the fixed-dose combination was
dissolved in 3ml of sodium hydroxide (0.1 mol/l) VS and heated gently. The mixture was then
cooled and 1.0 ml of copper (II) sulphate (80 g/l) TS was added.
Expected observation: production of a greenish yellow precipitate, the colour of which
changes gradually to blue.
b) A quantity of the powdered tablets equivalent to 50mg of the fixed-dose combination was
dissolved in 2ml hydrochloric acid (~70 g/l) TS. The resulting solution was cooled in ice,
treated with 4ml of sodium nitrite (10 g/l) TS and poured into 2ml of 2-naphthol TS1
containing 1g of sodium acetate R.
Expected observation: production of an orange-red precipitate.
3.3.1.2.1.3 Pyrimethamine:
Colour and other reactions [93]
a) A quantity of the powdered tablet equivalent to 0.25g was shaken and dissolved in 50ml
of ethanol (~750g/L) TS and heated to 60 oC. The solution was then filtered and heated to
dryness with constant weight (test substance). 0.05g of the test substance was then
dissolved in 5ml of sulphuric acid (~100g/L) TS. Freshly prepared potassio-mercuric
iodide TS was then added to the solution.
Expected observation: Formation of a creamy white precipitate.
b) A mixture of 5mL of water and 2mL of ethyl acetate R was added to 1 mL of methyl
orange/ethanol TS and shaken; ethyl acetate remained colourless. A solution prepared by
University of Ghana http://ugspace.ug.edu.gh
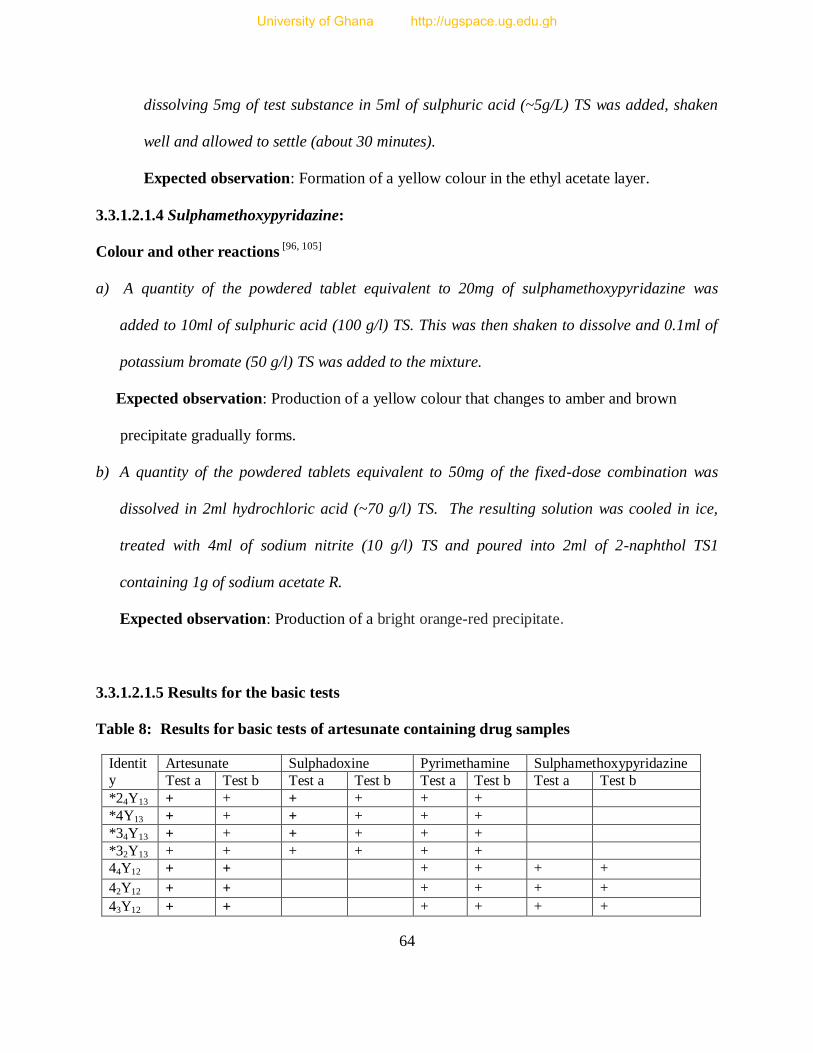
64
dissolving 5mg of test substance in 5ml of sulphuric acid (~5g/L) TS was added, shaken
well and allowed to settle (about 30 minutes).
Expected observation: Formation of a yellow colour in the ethyl acetate layer.
3.3.1.2.1.4 Sulphamethoxypyridazine:
Colour and other reactions [96, 105]
a) A quantity of the powdered tablet equivalent to 20mg of sulphamethoxypyridazine was
added to 10ml of sulphuric acid (100 g/l) TS. This was then shaken to dissolve and 0.1ml of
potassium bromate (50 g/l) TS was added to the mixture.
Expected observation: Production of a yellow colour that changes to amber and brown
precipitate gradually forms.
b) A quantity of the powdered tablets equivalent to 50mg of the fixed-dose combination was
dissolved in 2ml hydrochloric acid (~70 g/l) TS. The resulting solution was cooled in ice,
treated with 4ml of sodium nitrite (10 g/l) TS and poured into 2ml of 2-naphthol TS1
containing 1g of sodium acetate R.
Expected observation: Production of a bright orange-red precipitate.
3.3.1.2.1.5 Results for the basic tests
Table 8: Results for basic tests of artesunate containing drug samples
Identity
Artesunate Sulphadoxine Pyrimethamine Sulphamethoxypyridazine
Test a Test b Test a Test b Test a Test b Test a Test b
*24Y13 + + + + + +
*4Y13 + + + + + +
*34Y13 + + + + + +
*32Y13 + + + + + +
44Y12 + + + + + +
42Y12 + + + + + +
43Y12 + + + + + +
University of Ghana http://ugspace.ug.edu.gh
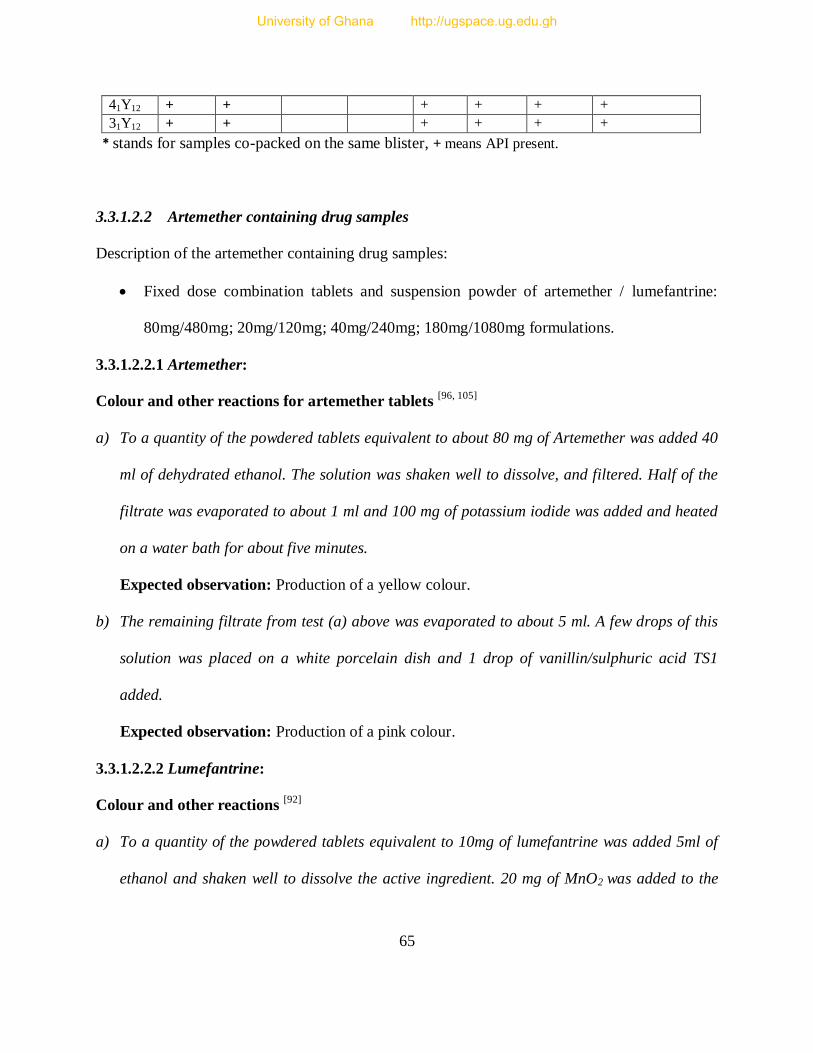
65
41Y12 + + + + + +
31Y12 + + + + + +
* stands for samples co-packed on the same blister, + means API present.
3.3.1.2.2 Artemether containing drug samples
Description of the artemether containing drug samples:
Fixed dose combination tablets and suspension powder of artemether / lumefantrine:
80mg/480mg; 20mg/120mg; 40mg/240mg; 180mg/1080mg formulations.
3.3.1.2.2.1 Artemether:
Colour and other reactions for artemether tablets [96, 105]
a) To a quantity of the powdered tablets equivalent to about 80 mg of Artemether was added 40
ml of dehydrated ethanol. The solution was shaken well to dissolve, and filtered. Half of the
filtrate was evaporated to about 1 ml and 100 mg of potassium iodide was added and heated
on a water bath for about five minutes.
Expected observation: Production of a yellow colour.
b) The remaining filtrate from test (a) above was evaporated to about 5 ml. A few drops of this
solution was placed on a white porcelain dish and 1 drop of vanillin/sulphuric acid TS1
added.
Expected observation: Production of a pink colour.
3.3.1.2.2.2 Lumefantrine:
Colour and other reactions [92]
a) To a quantity of the powdered tablets equivalent to 10mg of lumefantrine was added 5ml of
ethanol and shaken well to dissolve the active ingredient. 20 mg of MnO2 was added to the
University of Ghana http://ugspace.ug.edu.gh
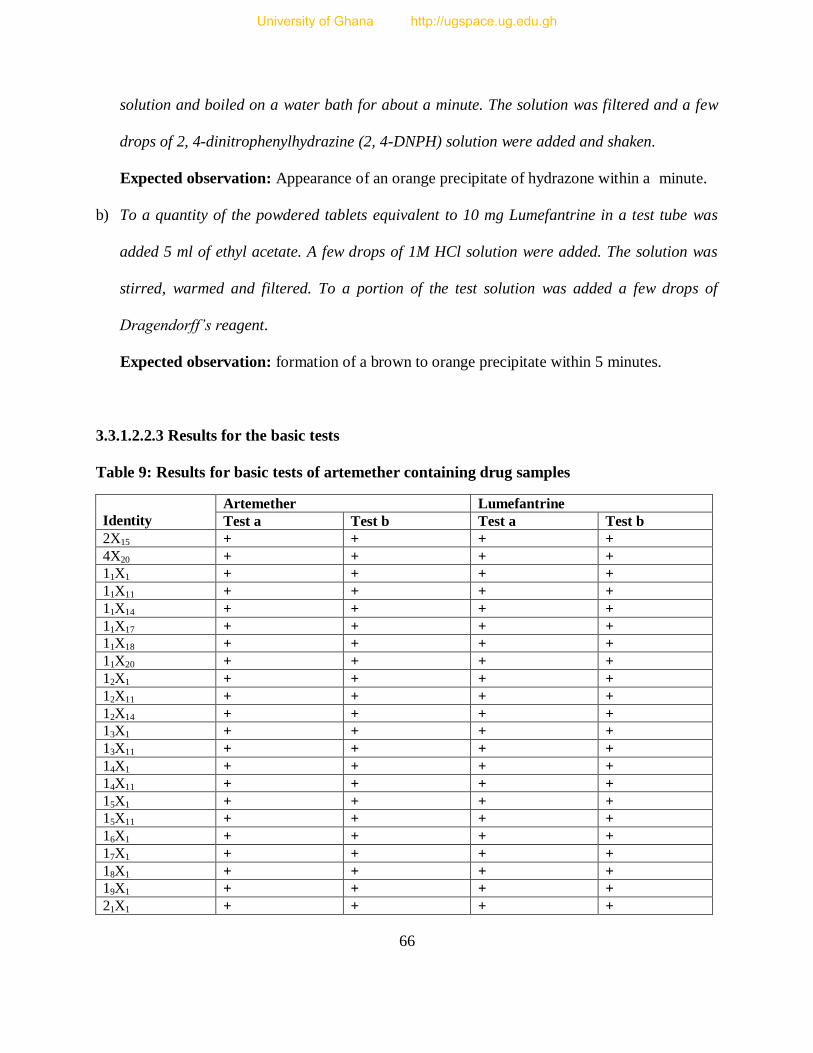
66
solution and boiled on a water bath for about a minute. The solution was filtered and a few
drops of 2, 4-dinitrophenylhydrazine (2, 4-DNPH) solution were added and shaken.
Expected observation: Appearance of an orange precipitate of hydrazone within a minute.
b) To a quantity of the powdered tablets equivalent to 10 mg Lumefantrine in a test tube was
added 5 ml of ethyl acetate. A few drops of 1M HCl solution were added. The solution was
stirred, warmed and filtered. To a portion of the test solution was added a few drops of
Dragendorff’s reagent.
Expected observation: formation of a brown to orange precipitate within 5 minutes.
3.3.1.2.2.3 Results for the basic tests
Table 9: Results for basic tests of artemether containing drug samples
Identity
Artemether Lumefantrine
Test a Test b Test a Test b
2X15 + + + +
4X20 + + + +
11X1 + + + +
11X11 + + + +
11X14 + + + +
11X17 + + + +
11X18 + + + +
11X20 + + + +
12X1 + + + +
12X11 + + + +
12X14 + + + +
13X1 + + + +
13X11 + + + +
14X1 + + + +
14X11 + + + +
15X1 + + + +
15X11 + + + +
16X1 + + + +
17X1 + + + +
18X1 + + + +
19X1 + + + +
21X1 + + + +
University of Ghana http://ugspace.ug.edu.gh
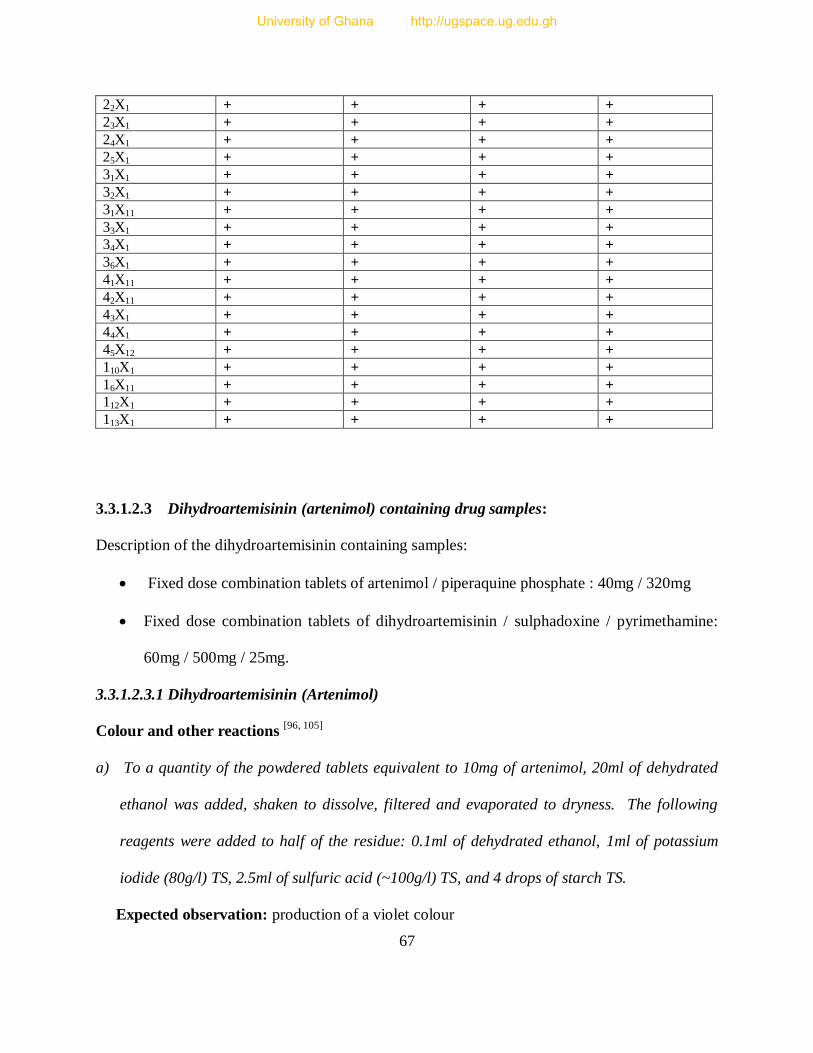
67
22X1 + + + +
23X1 + + + +
24X1 + + + +
25X1 + + + +
31X1 + + + +
32X1 + + + +
31X11 + + + +
33X1 + + + +
34X1 + + + +
36X1 + + + +
41X11 + + + +
42X11 + + + +
43X1 + + + +
44X1 + + + +
45X12 + + + +
110X1 + + + +
16X11 + + + +
112X1 + + + +
113X1 + + + +
3.3.1.2.3 Dihydroartemisinin (artenimol) containing drug samples:
Description of the dihydroartemisinin containing samples:
Fixed dose combination tablets of artenimol / piperaquine phosphate : 40mg / 320mg
Fixed dose combination tablets of dihydroartemisinin / sulphadoxine / pyrimethamine:
60mg / 500mg / 25mg.
3.3.1.2.3.1 Dihydroartemisinin (Artenimol)
Colour and other reactions [96, 105]
a) To a quantity of the powdered tablets equivalent to 10mg of artenimol, 20ml of dehydrated
ethanol was added, shaken to dissolve, filtered and evaporated to dryness. The following
reagents were added to half of the residue: 0.1ml of dehydrated ethanol, 1ml of potassium
iodide (80g/l) TS, 2.5ml of sulfuric acid (~100g/l) TS, and 4 drops of starch TS.
Expected observation: production of a violet colour
University of Ghana http://ugspace.ug.edu.gh
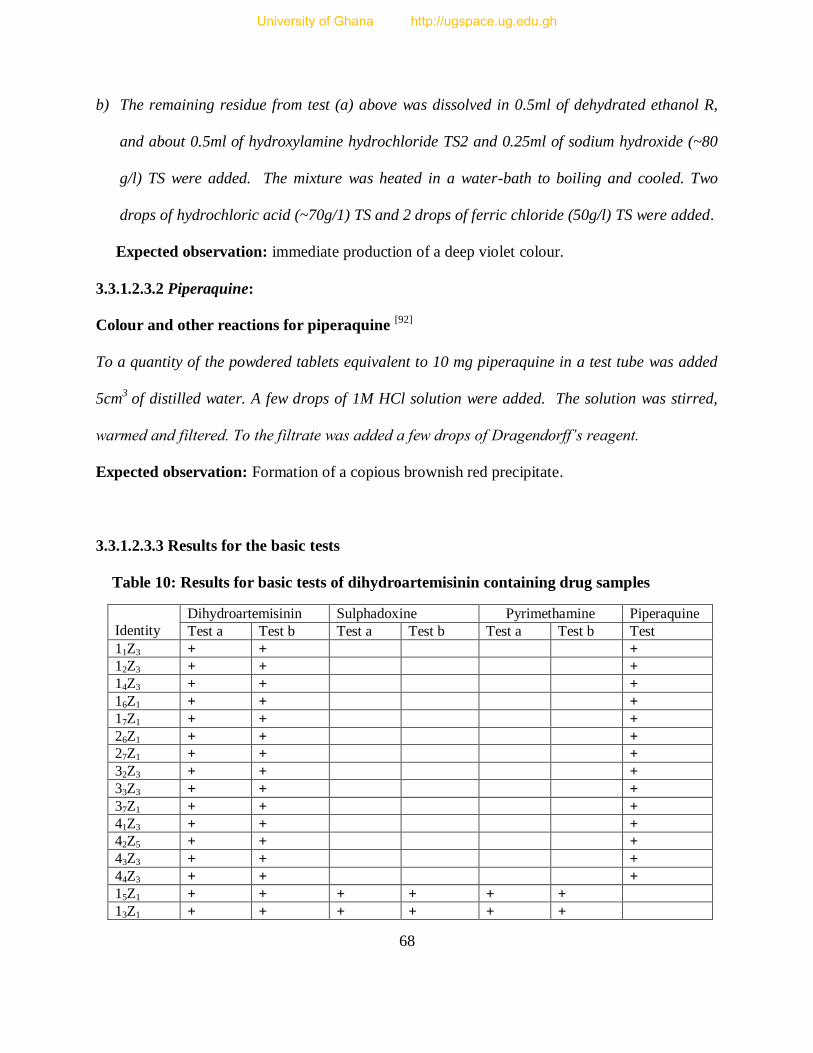
68
b) The remaining residue from test (a) above was dissolved in 0.5ml of dehydrated ethanol R,
and about 0.5ml of hydroxylamine hydrochloride TS2 and 0.25ml of sodium hydroxide (~80
g/l) TS were added. The mixture was heated in a water-bath to boiling and cooled. Two
drops of hydrochloric acid (~70g/1) TS and 2 drops of ferric chloride (50g/l) TS were added.
Expected observation: immediate production of a deep violet colour.
3.3.1.2.3.2 Piperaquine:
Colour and other reactions for piperaquine [92]
To a quantity of the powdered tablets equivalent to 10 mg piperaquine in a test tube was added
5cm3
of distilled water. A few drops of 1M HCl solution were added. The solution was stirred,
warmed and filtered. To the filtrate was added a few drops of Dragendorff’s reagent.
Expected observation: Formation of a copious brownish red precipitate.
3.3.1.2.3.3 Results for the basic tests
Table 10: Results for basic tests of dihydroartemisinin containing drug samples
Identity
Dihydroartemisinin Sulphadoxine Pyrimethamine Piperaquine
Test a Test b Test a Test b Test a Test b Test
11Z3 + + +
12Z3 + + +
14Z3 + + +
16Z1 + + +
17Z1 + + +
26Z1 + + +
27Z1 + + +
32Z3 + + +
33Z3 + + +
37Z1 + + +
41Z3 + + +
42Z5 + + +
43Z3 + + +
44Z3 + + +
15Z1 + + + + + +
13Z1 + + + + + +
University of Ghana http://ugspace.ug.edu.gh
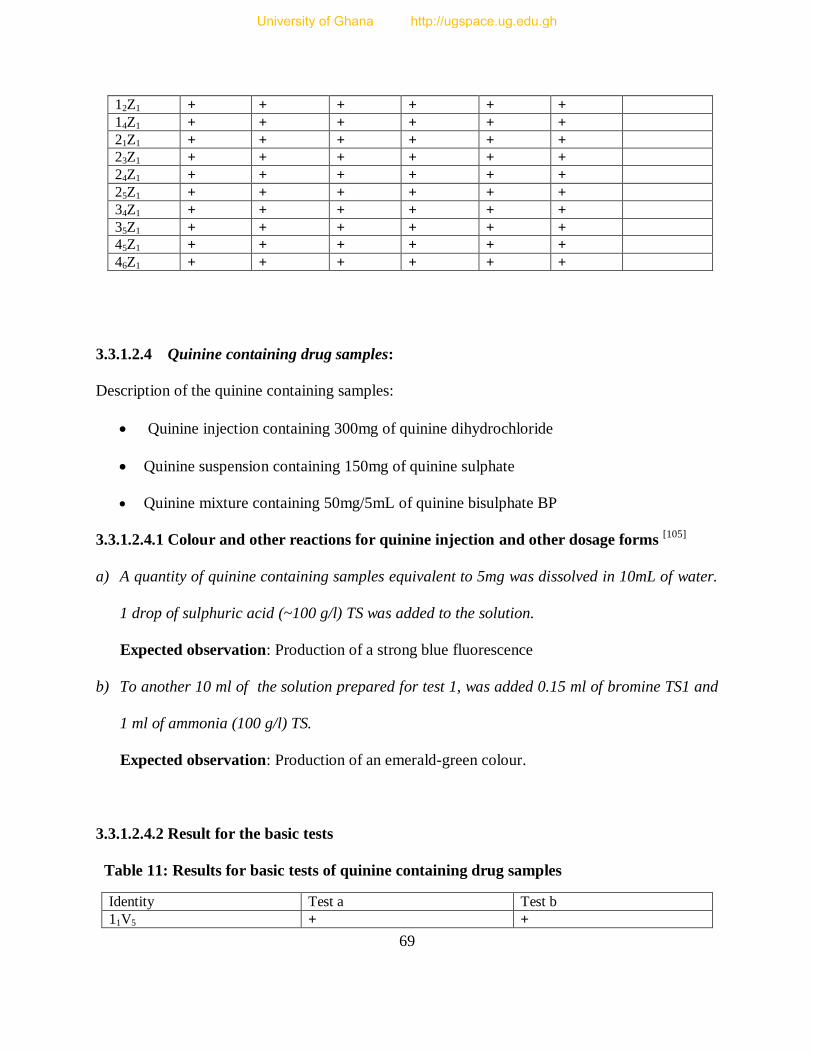
69
12Z1 + + + + + +
14Z1 + + + + + +
21Z1 + + + + + +
23Z1 + + + + + +
24Z1 + + + + + +
25Z1 + + + + + +
34Z1 + + + + + +
35Z1 + + + + + +
45Z1 + + + + + +
46Z1 + + + + + +
3.3.1.2.4 Quinine containing drug samples:
Description of the quinine containing samples:
Quinine injection containing 300mg of quinine dihydrochloride
Quinine suspension containing 150mg of quinine sulphate
Quinine mixture containing 50mg/5mL of quinine bisulphate BP
3.3.1.2.4.1 Colour and other reactions for quinine injection and other dosage forms [105]
a) A quantity of quinine containing samples equivalent to 5mg was dissolved in 10mL of water.
1 drop of sulphuric acid (~100 g/l) TS was added to the solution.
Expected observation: Production of a strong blue fluorescence
b) To another 10 ml of the solution prepared for test 1, was added 0.15 ml of bromine TS1 and
1 ml of ammonia (100 g/l) TS.
Expected observation: Production of an emerald-green colour.
3.3.1.2.4.2 Result for the basic tests
Table 11: Results for basic tests of quinine containing drug samples
Identity Test a Test b
11V5 + +
University of Ghana http://ugspace.ug.edu.gh
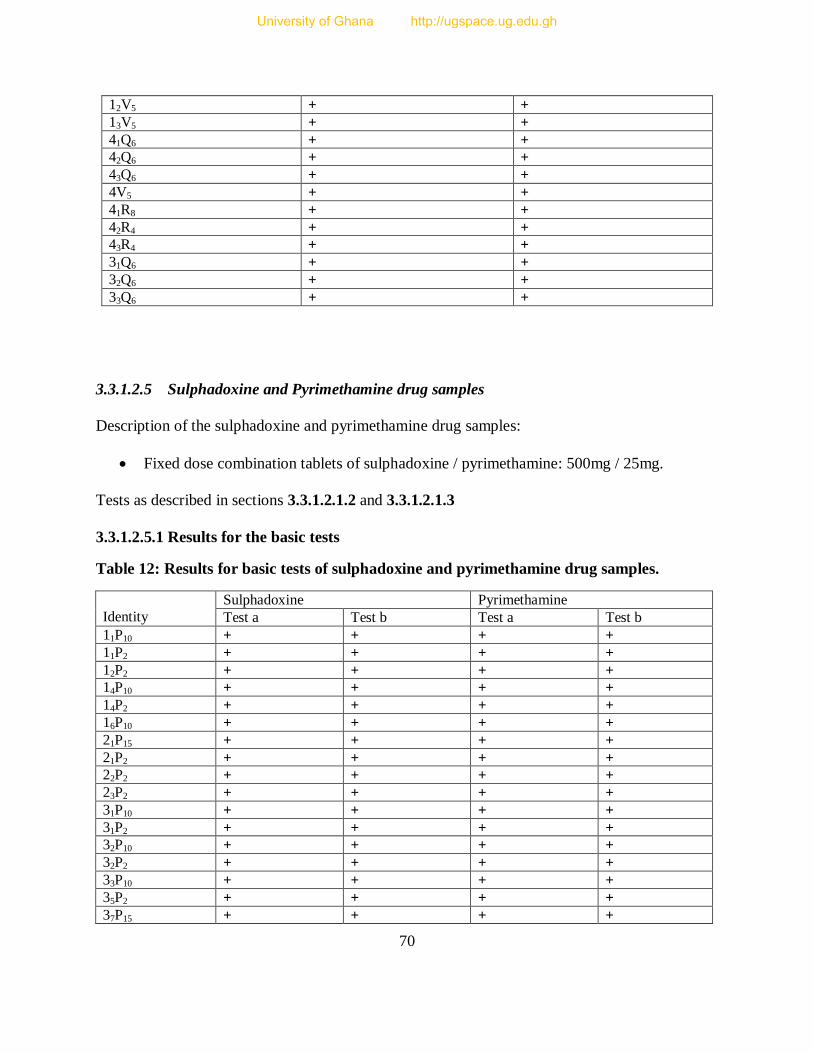
70
12V5 + +
13V5 + +
41Q6 + +
42Q6 + +
43Q6 + +
4V5 + +
41R8 + +
42R4 + +
43R4 + +
31Q6 + +
32Q6 + +
33Q6 + +
3.3.1.2.5 Sulphadoxine and Pyrimethamine drug samples
Description of the sulphadoxine and pyrimethamine drug samples:
Fixed dose combination tablets of sulphadoxine / pyrimethamine: 500mg / 25mg.
Tests as described in sections 3.3.1.2.1.2 and 3.3.1.2.1.3
3.3.1.2.5.1 Results for the basic tests
Table 12: Results for basic tests of sulphadoxine and pyrimethamine drug samples.
Identity
Sulphadoxine Pyrimethamine
Test a Test b Test a Test b
11P10 + + + +
11P2 + + + +
12P2 + + + +
14P10 + + + +
14P2 + + + +
16P10 + + + +
21P15 + + + +
21P2 + + + +
22P2 + + + +
23P2 + + + +
31P10 + + + +
31P2 + + + +
32P10 + + + +
32P2 + + + +
33P10 + + + +
35P2 + + + +
37P15 + + + +
University of Ghana http://ugspace.ug.edu.gh
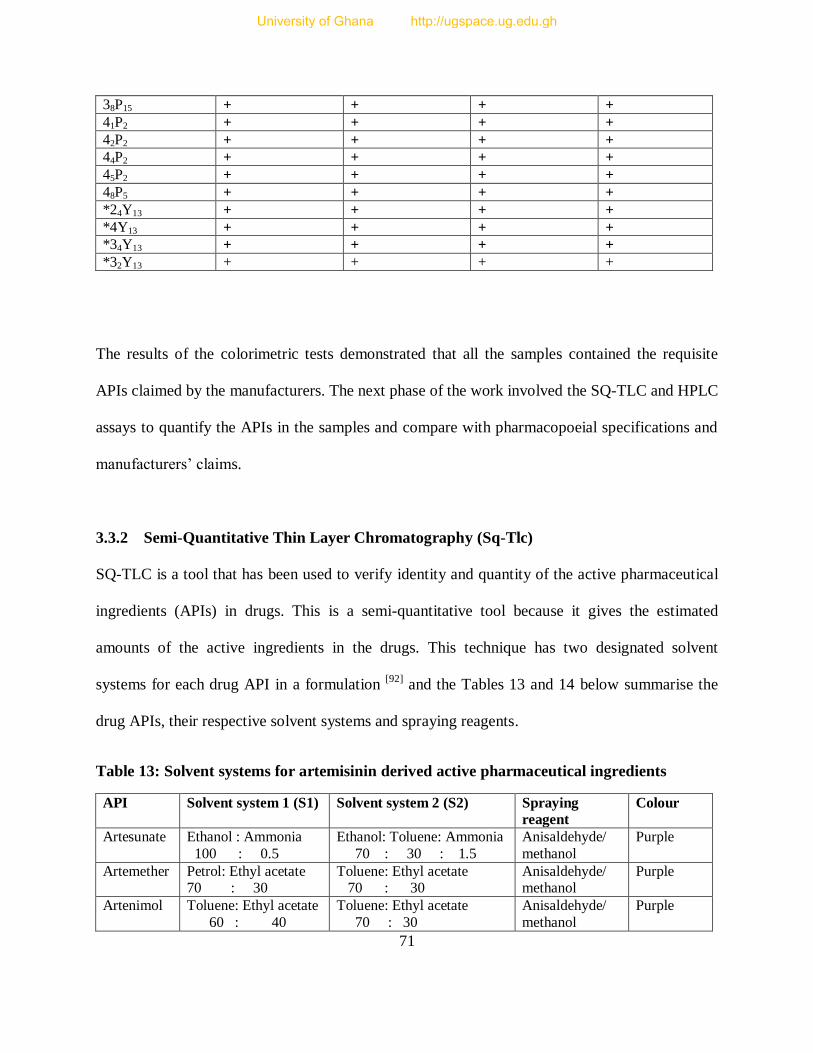
71
38P15 + + + +
41P2 + + + +
42P2 + + + +
44P2 + + + +
45P2 + + + +
48P5 + + + +
*24Y13 + + + +
*4Y13 + + + +
*34Y13 + + + +
*32Y13 + + + +
The results of the colorimetric tests demonstrated that all the samples contained the requisite
APIs claimed by the manufacturers. The next phase of the work involved the SQ-TLC and HPLC
assays to quantify the APIs in the samples and compare with pharmacopoeial specifications and
manufacturers’ claims.
3.3.2 Semi-Quantitative Thin Layer Chromatography (Sq-Tlc)
SQ-TLC is a tool that has been used to verify identity and quantity of the active pharmaceutical
ingredients (APIs) in drugs. This is a semi-quantitative tool because it gives the estimated
amounts of the active ingredients in the drugs. This technique has two designated solvent
systems for each drug API in a formulation [92]
and the Tables 13 and 14 below summarise the
drug APIs, their respective solvent systems and spraying reagents.
Table 13: Solvent systems for artemisinin derived active pharmaceutical ingredients
API Solvent system 1 (S1) Solvent system 2 (S2) Spraying
reagent
Colour
Artesunate Ethanol : Ammonia
100 : 0.5
Ethanol: Toluene: Ammonia
70 : 30 : 1.5
Anisaldehyde/
methanol
Purple
Artemether
Petrol: Ethyl acetate 70 : 30
Toluene: Ethyl acetate 70 : 30
Anisaldehyde/ methanol
Purple
Artenimol Toluene: Ethyl acetate
60 : 40
Toluene: Ethyl acetate
70 : 30
Anisaldehyde/
methanol
Purple
University of Ghana http://ugspace.ug.edu.gh
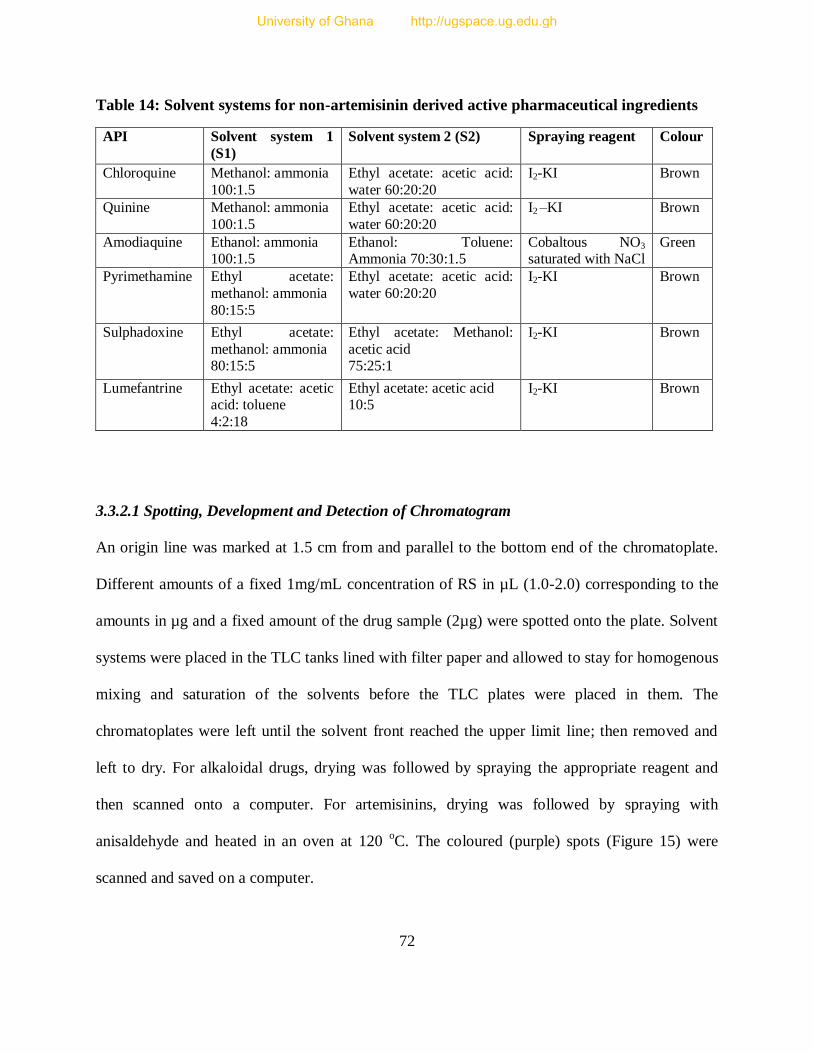
72
Table 14: Solvent systems for non-artemisinin derived active pharmaceutical ingredients
API Solvent system 1
(S1)
Solvent system 2 (S2) Spraying reagent Colour
Chloroquine Methanol: ammonia
100:1.5
Ethyl acetate: acetic acid:
water 60:20:20
I2-KI Brown
Quinine Methanol: ammonia
100:1.5
Ethyl acetate: acetic acid:
water 60:20:20
I2 –KI Brown
Amodiaquine Ethanol: ammonia 100:1.5
Ethanol: Toluene: Ammonia 70:30:1.5
Cobaltous NO3 saturated with NaCl
Green
Pyrimethamine Ethyl acetate:
methanol: ammonia
80:15:5
Ethyl acetate: acetic acid:
water 60:20:20
I2-KI Brown
Sulphadoxine Ethyl acetate:
methanol: ammonia 80:15:5
Ethyl acetate: Methanol:
acetic acid 75:25:1
I2-KI Brown
Lumefantrine Ethyl acetate: acetic acid: toluene
4:2:18
Ethyl acetate: acetic acid 10:5
I2-KI Brown
3.3.2.1 Spotting, Development and Detection of Chromatogram
An origin line was marked at 1.5 cm from and parallel to the bottom end of the chromatoplate.
Different amounts of a fixed 1mg/mL concentration of RS in µL (1.0-2.0) corresponding to the
amounts in µg and a fixed amount of the drug sample (2µg) were spotted onto the plate. Solvent
systems were placed in the TLC tanks lined with filter paper and allowed to stay for homogenous
mixing and saturation of the solvents before the TLC plates were placed in them. The
chromatoplates were left until the solvent front reached the upper limit line; then removed and
left to dry. For alkaloidal drugs, drying was followed by spraying the appropriate reagent and
then scanned onto a computer. For artemisinins, drying was followed by spraying with
anisaldehyde and heated in an oven at 120 oC. The coloured (purple) spots (Figure 15) were
scanned and saved on a computer.
University of Ghana http://ugspace.ug.edu.gh
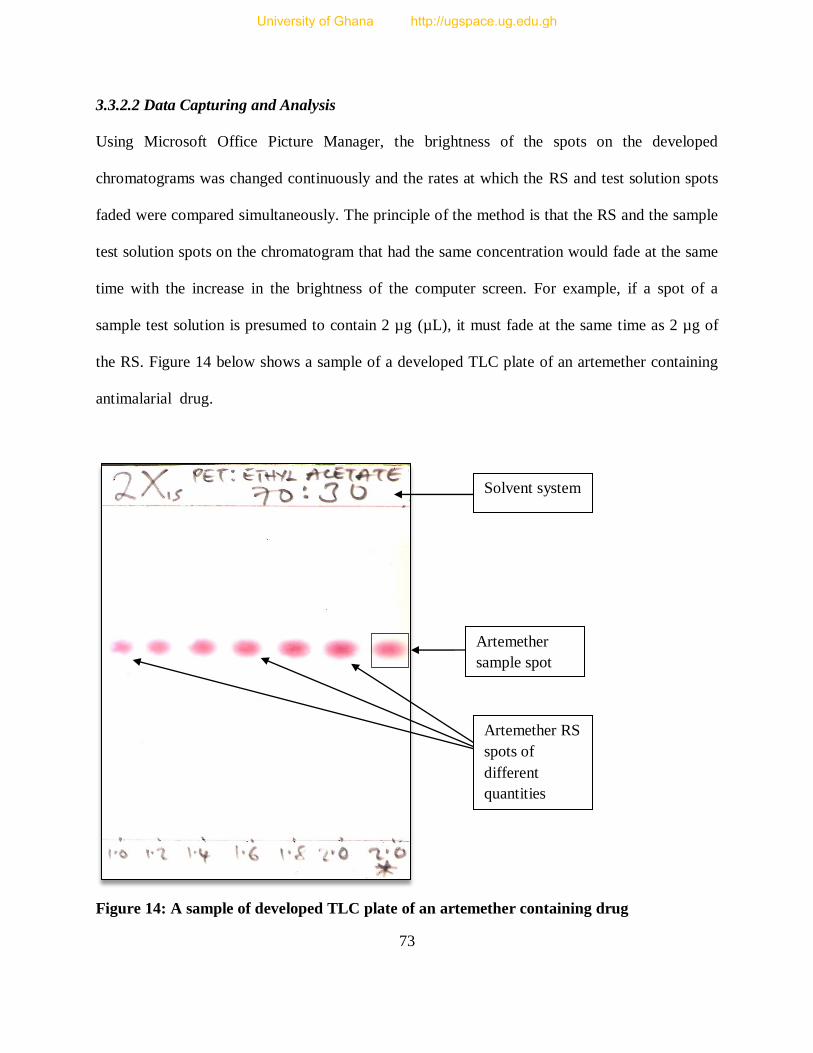
73
3.3.2.2 Data Capturing and Analysis
Using Microsoft Office Picture Manager, the brightness of the spots on the developed
chromatograms was changed continuously and the rates at which the RS and test solution spots
faded were compared simultaneously. The principle of the method is that the RS and the sample
test solution spots on the chromatogram that had the same concentration would fade at the same
time with the increase in the brightness of the computer screen. For example, if a spot of a
sample test solution is presumed to contain 2 µg (µL), it must fade at the same time as 2 µg of
the RS. Figure 14 below shows a sample of a developed TLC plate of an artemether containing
antimalarial drug.
Figure 14: A sample of developed TLC plate of an artemether containing drug
Solvent system
Artemether
sample spot
Artemether RS
spots of
different
quantities
University of Ghana http://ugspace.ug.edu.gh
74
The concentration of a test solution is estimated by taking note of the RS spot that begins to fade
simultaneously with the spot of the sample test solution and one that fades completely after the
spot of the test solution. This gives the range in which the amount of the API test solution falls.
For example, if the spot of the test solution (2µL) of a drug containing 200mg of an API
expected to fade at the same time as the 2µL reference standard spot fades between 1.4µL and
1.6 µL spots of the RS, then;
1.4µL = lower limit
1.6µL = upper limit
of the API content of the test solution
In percentage equivalent:
Lower limit = 1.4/2.0 100 = 70.0%
Upper limit = 1.6/2.0 100 = 80.0%
Converting percentage to mass:
Lower limit = 1.4/2.0 200 mg = 140 mg
Upper limit = 1.6/2.0 200 mg = 160 mg
This implies that the API quantity is within 70 - 80% (140 – 160) mg, out of the 200 mg claimed
by the manufacturer on the pack and it is also not compliant with the pharmacopoeial
requirement that stipulates that each tablet must contain not less than 90% and not more than
110% of the manufacturers label claim. So this was done for all the 12 replicates, 6 from each of
the two solvent systems. The average for the upper and lower limits was calculated for each drug
sample. The data were transferred to Microsoft Windows Excel 2007 for further analysis.
University of Ghana http://ugspace.ug.edu.gh
75
3.3.3 High Performance Liquid Chromatography (HPLC) Assays
This method was used as a validation tool for the results of the SQ-TLC method. There were
different kinds of drug formulations whereby some drugs had 2 APIs while others had 3 APIs
combined. A simultaneous assay was used where possible and single API analysis where the
former was not feasible. The analysis was done with reference to pharmacopoeias and published
validated assays subject to some adjustments in some cases where the available conditions and
prescribed methods gave unrealistic results. The adjustments made have been outlined
thoroughly in the experimental section. In all cases, an appropriate calibration curve using pure
reference samples of the requisite API was plotted. These were used in calculating the API
contents of the various dosage forms. Details are given in the experimental section.
3.3.3.1 Details of Various Drug Assays
3.3.3.1.1 HPLC Assay of Artesunate
The experimental conditions of the assay for the HPLC analysis of artesunate were formulated
from the modification of a validated method by Ranher et al. [106]
. Outlined below are the
conditions of the adapted assay:
Column measurements: Discovery C-18 bonded, 5µm, 25cm x 4mm.
Mobile phase: 70: 30 v/v, 1% triethylamine (TEA) in methanol: buffer (10mM KH2PO4/
85% H3PO4 , pH=2.5)
retention time (average): 5.1 minutes
detection wavelength: 216nm
Flow rate: 1.2 mL/ min.
volume of injection: 20 µL
University of Ghana http://ugspace.ug.edu.gh
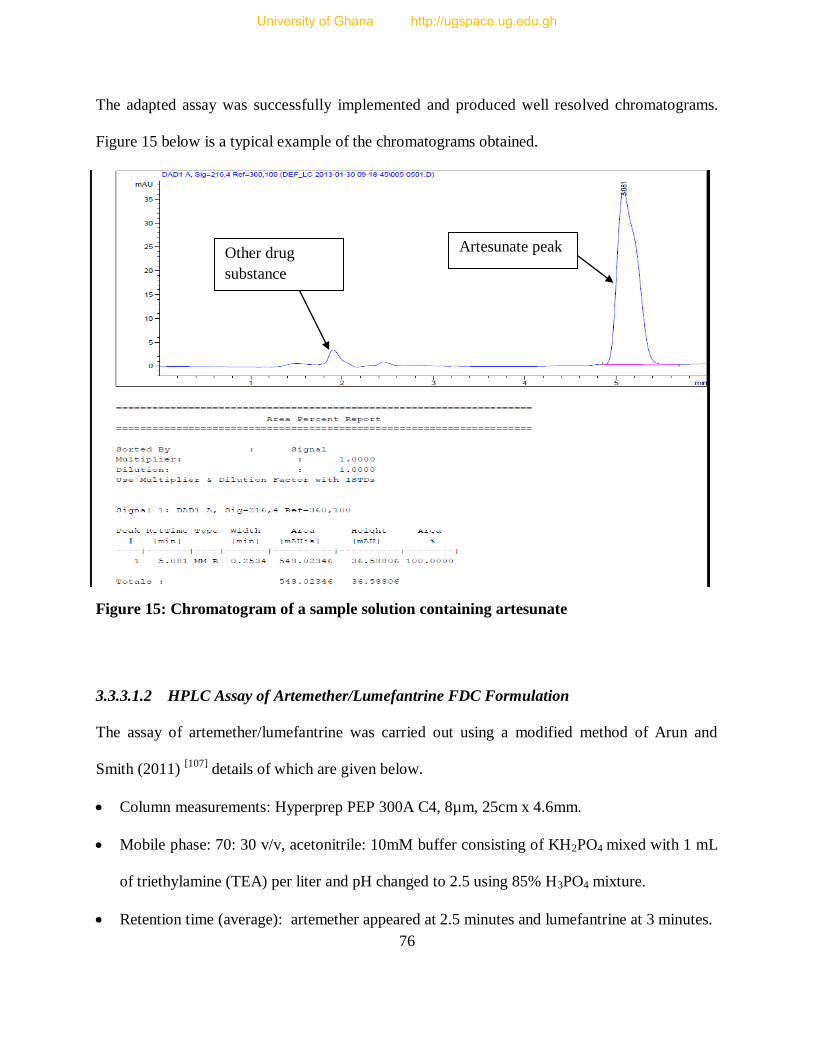
76
The adapted assay was successfully implemented and produced well resolved chromatograms.
Figure 15 below is a typical example of the chromatograms obtained.
Figure 15: Chromatogram of a sample solution containing artesunate
3.3.3.1.2 HPLC Assay of Artemether/Lumefantrine FDC Formulation
The assay of artemether/lumefantrine was carried out using a modified method of Arun and
Smith (2011) [107]
details of which are given below.
Column measurements: Hyperprep PEP 300A C4, 8µm, 25cm x 4.6mm.
Mobile phase: 70: 30 v/v, acetonitrile: 10mM buffer consisting of KH2PO4 mixed with 1 mL
of triethylamine (TEA) per liter and pH changed to 2.5 using 85% H3PO4 mixture.
Retention time (average): artemether appeared at 2.5 minutes and lumefantrine at 3 minutes.
Artesunate peak Other drug
substance
University of Ghana http://ugspace.ug.edu.gh
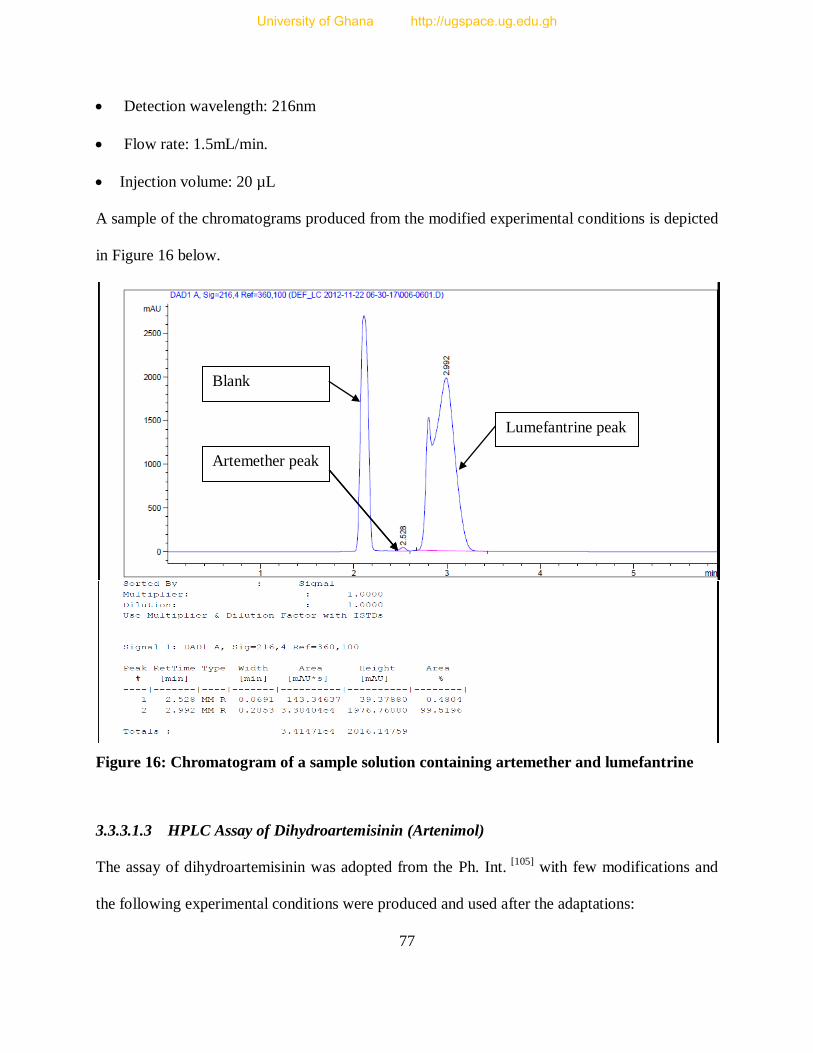
77
Detection wavelength: 216nm
Flow rate: 1.5mL/min.
Injection volume: 20 µL
A sample of the chromatograms produced from the modified experimental conditions is depicted
in Figure 16 below.
Figure 16: Chromatogram of a sample solution containing artemether and lumefantrine
3.3.3.1.3 HPLC Assay of Dihydroartemisinin (Artenimol)
The assay of dihydroartemisinin was adopted from the Ph. Int. [105]
with few modifications and
the following experimental conditions were produced and used after the adaptations:
Artemether peak
Lumefantrine peak
Blank
University of Ghana http://ugspace.ug.edu.gh
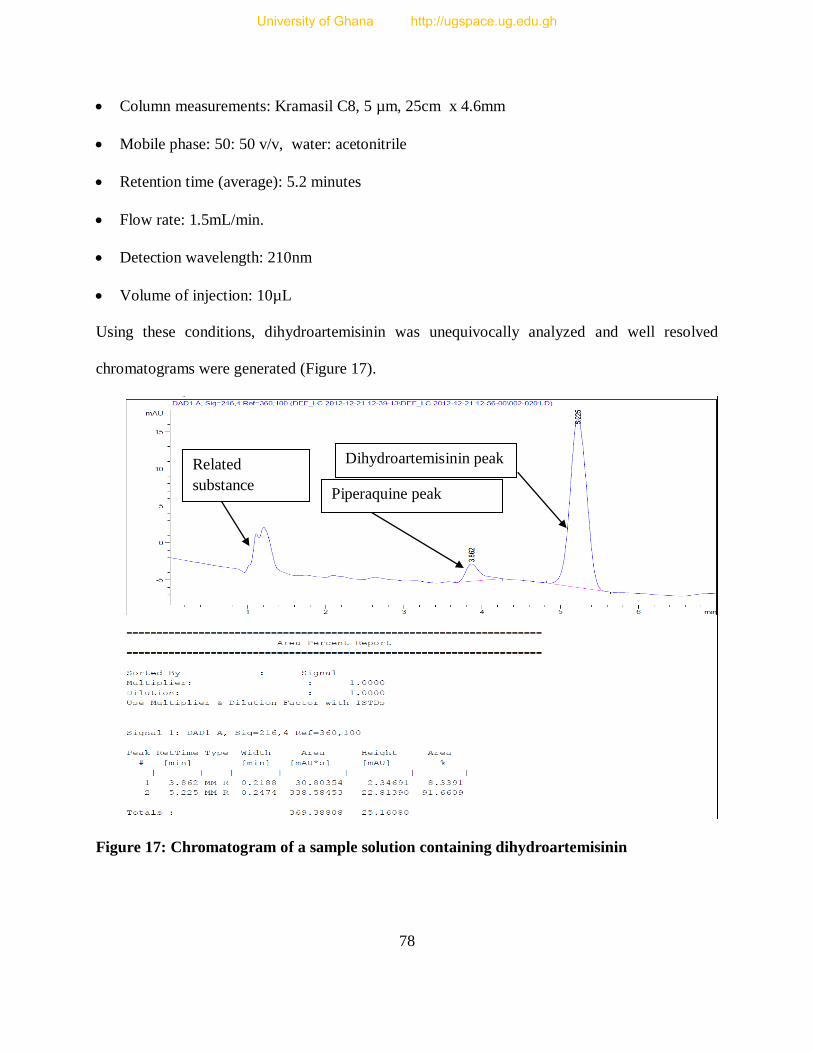
78
Column measurements: Kramasil C8, 5 µm, 25cm x 4.6mm
Mobile phase: 50: 50 v/v, water: acetonitrile
Retention time (average): 5.2 minutes
Flow rate: 1.5mL/min.
Detection wavelength: 210nm
Volume of injection: 10µL
Using these conditions, dihydroartemisinin was unequivocally analyzed and well resolved
chromatograms were generated (Figure 17).
Figure 17: Chromatogram of a sample solution containing dihydroartemisinin
Dihydroartemisinin peak
Piperaquine peak Piperaquine peak
Related
substance
University of Ghana http://ugspace.ug.edu.gh
79
3.3.3.1.4 HPLC Assay of Sulphadoxine/Pyrimethamine
WHO expert committee, 2011 adopted a method for the simultaneous assay of sulphadoxine and
pyrimethamine due to the dearth of the assay in the previous editions of the Ph. Int., which was
intended to be included in the subsequent edition (2010 edition) [108]
. In this study, the method
conditions were adapted as follows:
Column measurements: Ascentis C-18 column, 5µm, 15cm x 4.60mm.
Mobile phase: 65: 10: 25 v/v, 20mM buffer (KH2PO4/Na2HPO4 of pH 5.6: methanol:
acetonitrile.
retention time (average): 3.9 minutes for sulphadoxine and 8.7 minutes for pyrimethamine
Flow rate: 1mL/min
Detection wavelength: 240nm
Volume of injection: 10µL
Figure 18 below is an illustration of a sample chromatogram that was produced from the
application of the conditions of the modified assay.
3.3.3.1.5 HPLC Assay of Quinine
Quantitative determination of quinine described in the USP 24 [109]
was modified and used in the
HPLC assay of quinine preparations and the following conditions were generated after the
changes:
Column measurements: Discovery C-18 bonded, 5 µm, 25cm x 4mm
Mobile phase: 80: 16: 2: 2 v/v, water: acetonitrile: methanesulfonic acid: TEA (pH 2.6)
Average Retention time: 4.7 minutes.
University of Ghana http://ugspace.ug.edu.gh
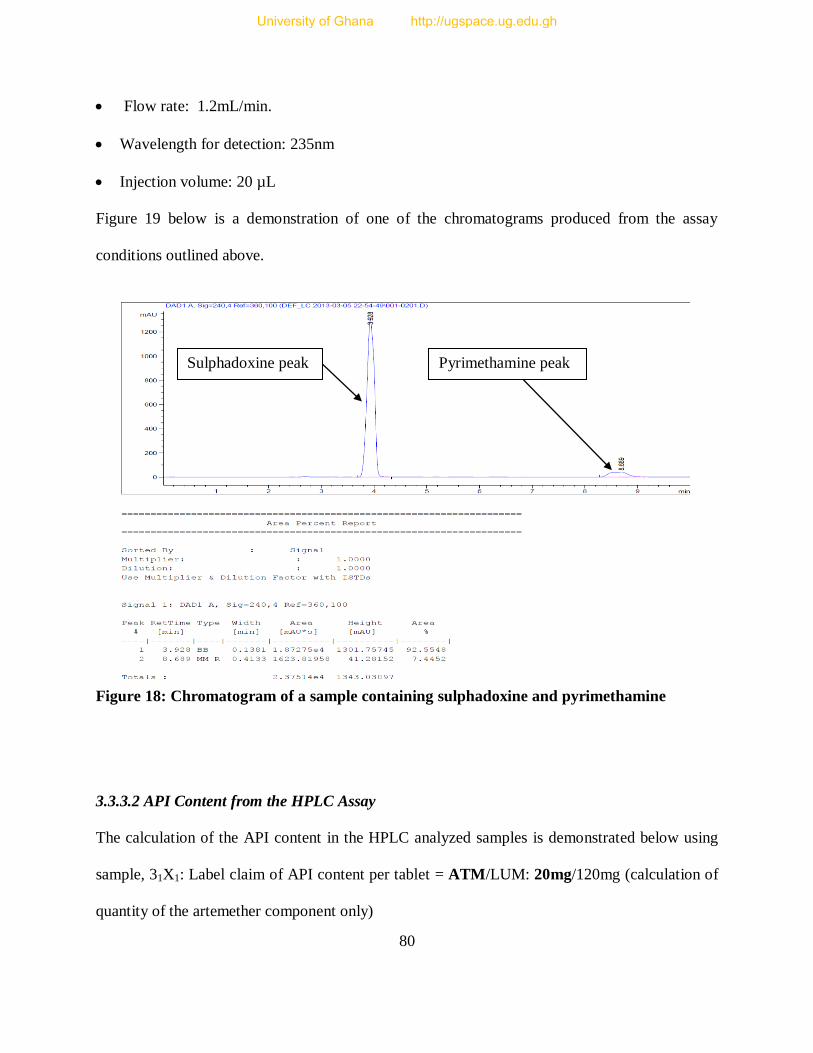
80
Flow rate: 1.2mL/min.
Wavelength for detection: 235nm
Injection volume: 20 µL
Figure 19 below is a demonstration of one of the chromatograms produced from the assay
conditions outlined above.
Figure 18: Chromatogram of a sample containing sulphadoxine and pyrimethamine
3.3.3.2 API Content from the HPLC Assay
The calculation of the API content in the HPLC analyzed samples is demonstrated below using
sample, 31X1: Label claim of API content per tablet = ATM/LUM: 20mg/120mg (calculation of
quantity of the artemether component only)
Sulphadoxine peak Pyrimethamine peak
University of Ghana http://ugspace.ug.edu.gh
81
Weight of 10 tablets = 2.9390g
Average weight of each tablet = 0.2939g = 293.9mg
Weight of tablets corresponding to 4 mg of artemether used for analysis is found as follows:
= 4mg/20mg x 293.9mg
= 58.78mg equivalent of artemether API
From the calibration curve;
AUC = 176.08 C + 74.287 and
C = (AUC – 74.287)/176.08; But AUC= 139.301
C = (139.301-74.287)/176.08
= 0.3692mg/mL
Sample solution prepared for the assay = 10mL
Quantity of artemether in 10mL = 0.3692mg/mL x 10mL
= 3.692mg
Percentage of the actual amount to the expected amount = 3.692mg/4mg x 100
= 92.3%
Therefore, the sample contains:
92.3/100 x 20mg = 18.46mg of artemether per tablet.
Since pharmacopoeial specifications require the drug to contain not less than 90% and not more
than 110% of the manufacturer’s claim, sample 31X1 will be deemed to have complied with
pharmacopoeial specifications.
University of Ghana http://ugspace.ug.edu.gh
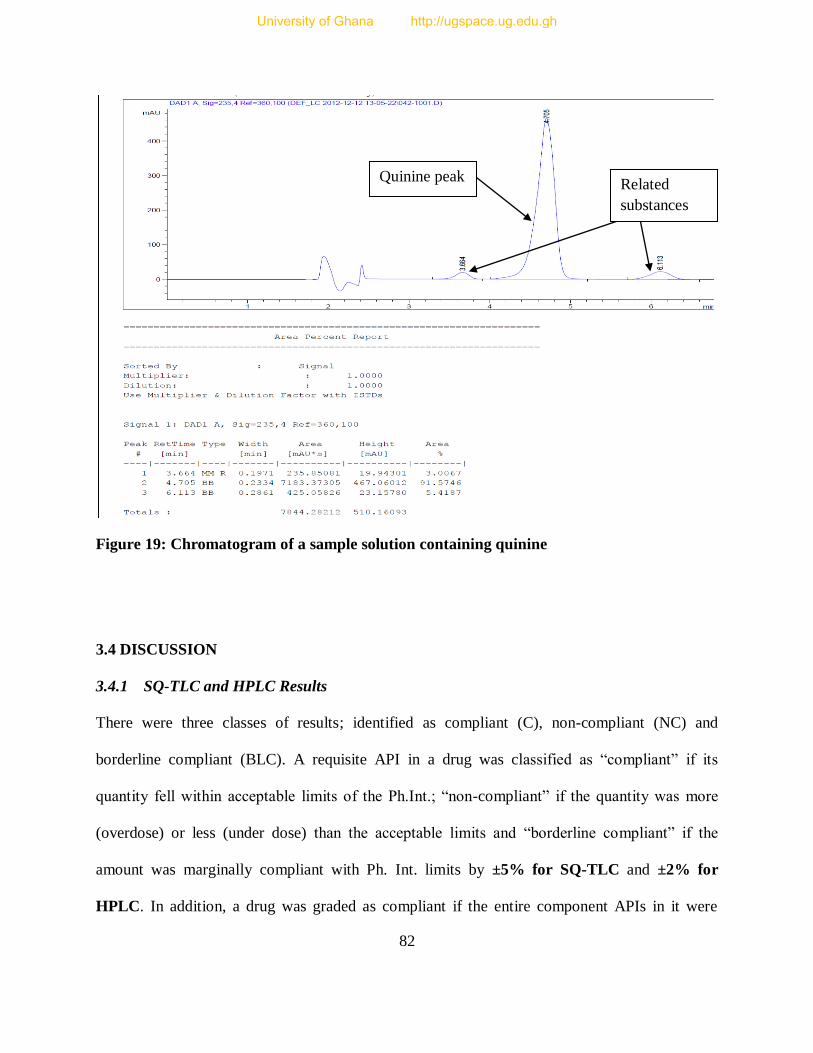
82
Figure 19: Chromatogram of a sample solution containing quinine
3.4 DISCUSSION
3.4.1 SQ-TLC and HPLC Results
There were three classes of results; identified as compliant (C), non-compliant (NC) and
borderline compliant (BLC). A requisite API in a drug was classified as “compliant” if its
quantity fell within acceptable limits of the Ph.Int.; “non-compliant” if the quantity was more
(overdose) or less (under dose) than the acceptable limits and “borderline compliant” if the
amount was marginally compliant with Ph. Int. limits by ±5% for SQ-TLC and ±2% for
HPLC. In addition, a drug was graded as compliant if the entire component APIs in it were
Quinine peak Related
substances
University of Ghana http://ugspace.ug.edu.gh

83
compliant; non-compliant if at least one of the API components was non-compliant and
borderline compliant if all components are separately borderline compliant; one component or
more is borderline amongst other compliant components of a drug.
3.4.1.1 SQ-TLC Method Results
3.4.1.1.1 Analysis of Drug API Components
Figure 20 below shows the quality status of the individual APIs when the SQ-TLC method was
used to estimate their quantities.
The samples were analysed for artemether, artesunate, dihydroartemisinin, sulphadoxine,
pyrimethamine, lumefantrine and quinine active pharmaceutical ingredients (APIs). For
artesunate, there were 33.33% (3/9) of samples that were borderline compliant, whereas 44.44%
(4/9) were compliant and 22.22% (2/9) non-compliant (under dose). 9.76% (4/41) of artemether
samples were found to be borderline compliant, with 24.39% (10/41) and 65.85% (27/41) being
compliant and non-compliant respectively, with the non-compliance arising due to 13 (48.15%)
samples being overdose and 14 (51.85%) being under dose. The samples containing lumefantrine
posted borderline qualification of 17.07% (7/41) and 31.71% (13/41) were compliant, with the
remaining 51.22% (21/41) being non-compliant; whereby twelve (12) (57.14%) samples of the
non-compliant samples (21) were overdose and 9 (42.86%) of them under dose.
For dihydroartemisinin, 7.69% (2/26) were found to be borderline compliant, 23.08% (6/26)
compliant and 69.29% (18/26) non-compliant (under dose).
University of Ghana http://ugspace.ug.edu.gh
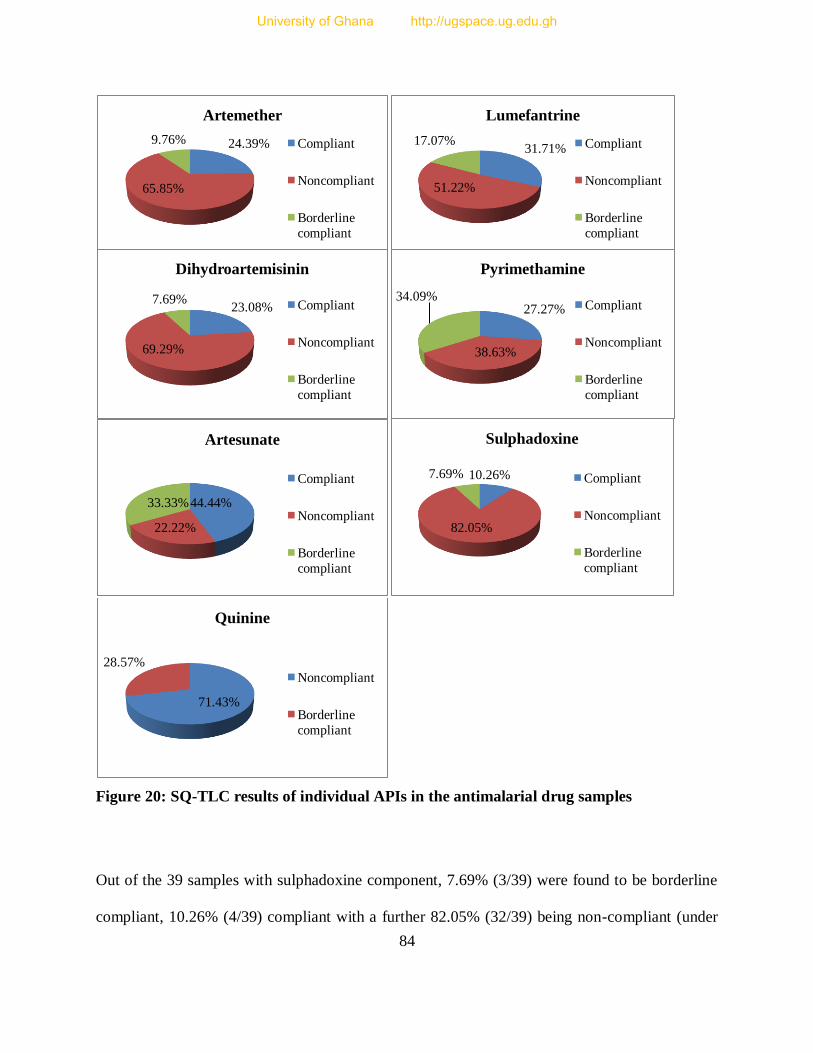
84
Figure 20: SQ-TLC results of individual APIs in the antimalarial drug samples
Out of the 39 samples with sulphadoxine component, 7.69% (3/39) were found to be borderline
compliant, 10.26% (4/39) compliant with a further 82.05% (32/39) being non-compliant (under
24.39%
65.85%
9.76%
Artemether
Compliant
Noncompliant
Borderline
compliant
31.71%
51.22%
17.07%
Lumefantrine
Compliant
Noncompliant
Borderline
compliant
23.08%
69.29%
7.69%
Dihydroartemisinin
Compliant
Noncompliant
Borderline
compliant
27.27%
38.63%
34.09%
Pyrimethamine
Compliant
Noncompliant
Borderline
compliant
44.44%
22.22%
33.33%
Artesunate
Compliant
Noncompliant
Borderline
compliant
10.26%
82.05%
7.69%
Sulphadoxine
Compliant
Noncompliant
Borderline
compliant
71.43%
28.57%
Quinine
Noncompliant
Borderline
compliant
University of Ghana http://ugspace.ug.edu.gh

85
dose). The quantity of pyrimethamine samples found to be borderline compliant were 34.09%
(15/44) with 27.27% (12/44) and 38.63% (17/44) being compliant and non-compliant
respectively, with 5 out of the non-compliant samples (17) being overdosed. The analysis of the
quinine samples showed that while 28.57% (2/7) were borderline compliant, 71.43% (5/7) were
non-compliant, with all of the 5 (100%) non-compliant samples being overdose. Some quinine
containing samples were not analyzed for the quinine API due to the insufficiency of the RS
material. Therefore, the results demonstrated the widespread occurrence of substandard API
quantities, with sulphadoxine being the most compromised.
3.4.1.1.2 Analysis of Drug Samples as a Whole Based on SQ-TLC Results
Classification of a drug as being compliant or otherwise in the case of fixed dose combination
(FDC) drugs depends on compliance of all APIs present.
3.4.1.1.2.1 Artesunate/Sulphadoxine/Sulphamethoxypyridazine/Pyrimethamine Containing
Samples
There were 9 samples of this API combination constituting 8.04% of the total samples (112). Out
of the 9 samples, 5 samples had artesunate/sulphamethoxypyridazine/pyrimethamine while the
rest (4) had artesunate/sulphadoxine/pyrimethamine API combination. Analysis of
artesunate/sulphamethoxypyridazine/pyrimethamine samples showed that 40% (2/5) samples had
been found to be non-compliant (under dose) for pyrimethamine component, whereas 20% (1/5)
and 40% (2/5) samples were found to be compliant and borderline compliant respectively. In
terms of artesunate component, 40% (2/5) were non-compliant while the other 40% (2/5) were
compliant and the remaining 20% (1/5) of the samples was borderline compliant.
University of Ghana http://ugspace.ug.edu.gh
86
Sulphamethoxypyridazine component was not successfully analyzed using SQ-TLC due to the
procedural limitations of the analytical method, that is, although the spots of the
sulphamethoxypyridazine on the TLC plate had the same retention time as the sulphadoxine
spots, they could not be stained well with the spraying agent Iodine-Potassium iodide solution
(I2/KI). Therefore, these samples were analyzed as a whole using the other available components.
On the other hand, results of the components in the artesunate/sulphadoxine/pyrimethamine
samples were as follows: samples with artesunate component being compliant were 2 (50%) and
borderline compliant samples were also 2 (50%). For sulphadoxine component, all the samples
were found to be non-compliant (under dose) and the pyrimethamine component registered 3
(75%) samples as being non-compliant all of which were also under dose and 1 (25%) sample
being borderline compliant. Thus, on the whole, SQ-TLC tests showed that 22.22% (2/9) and
77.78% of these samples were borderline compliant (Ats/SmP) and non-compliant respectively.
3.4.1.1.2.2 Artemether / Lumefantrine Containing Samples
Out of the 41 artemether/lumefantrine samples, 27 artemether and 21 lumefantrine samples were
non-compliant, with 13 (48.15%) and 12 (57.14%) of the non-compliant artemether and
lumefantrine components respectively being overdose. Therefore, overall SQ-TLC results of the
artemether/lumefantrine components showed that 2.44% (1/41) samples were borderline
compliant, whereas 4.88% (2/41) were compliant and 92.68% (38/41) non-compliant.
University of Ghana http://ugspace.ug.edu.gh
87
3.4.1.1.2.3 Dihydroartemisinin/Piperaquine Phosphate Containing Samples
These samples were analyzed for the dihydroartemisinin component only due to the lack of a
piperaquine reference standard. Therefore, they were treated like a monotherapy drug in the
analysis for dihydroartemisinin. Approximately 14.29% (2/14) of the samples were borderline
compliant, with 42.86% (6/14) and 42.86% (6/14) being compliant and non-compliant
correspondingly. All non-compliant components were under dose.
3.4.1.1.2.4 Dihydroartemisinin/Sulphadoxine/Pyrimethamine Containing Samples
For the samples of this combination, 83.33% (10/12) of the samples had sulphadoxine
component non-compliance (under dose), with 8.30% (1/12) of samples being compliant and
another 8.30% (1/12) being borderline compliant. For the pyrimethamine component, none of the
samples was found non-compliant, with 50% (6/12) being found borderline compliant and the
other 50% (6/12) found to be compliant. All the samples had 100% non-compliance (under dose)
for the dihydroartemisinin component. Thus, out of the 12 samples that contained
dihydroartemisinin/sulphadoxine/ pyrimethamine, none was found to be compliant, with the
failure rate mainly due to the failure of the dihydroartemisinin and sulphadoxine components.
3.4.1.1.2.5 Sulphadoxine/Pyrimethamine Containing Samples
Out of the 23 samples, 78.26% (18/23) had sulphadoxine component being non-compliant, with
13.04% (3/23) being compliant and 8.70% (2/23) being borderline compliant. For the
pyrimethamine component, 52.17% (12/23) samples were non-compliant (3 overdose, 9 under
dose), with 21.74% (5/23) found to be compliant and 26.09% (6/23) being borderline compliant.
Therefore, on the whole, of the 23 samples that contained the combined sulphadoxine and
University of Ghana http://ugspace.ug.edu.gh

88
pyrimethamine only, 8.70% (2/23) were found to be borderline compliant, 4.35% (1/23) being
compliant and 86.96% (20/23) non-compliant.
3.4.1.1.2.6 Quinine Containing Samples
There were 13 samples consisting of quinine sulphate, quinine bisulphate and quinine
hydrochloride and 7 samples were selected for SQ-TLC due to inadequate reference standard
(RS). Out of this, 28.57% (2/7) of these samples were borderline compliant and 71.43% (5/7)
being non-compliant, with 100% (5/5) of the non-compliance arising from overdosed API
quantity. Figure 21 below summaries the statuses of the drugs as a whole based on SQ-TLC only.
Figure 21: SQ-TLC results of drug samples when all components are considered
ATM/LUM ATS/SP DHA/PP SP DHA/SP QN
BLC 2.44% 22.22% 14.29% 8.70% 0% 28.57%
C 4.88% 0.00% 42.86% 4.35% 0% 0%
NC 92.68% 77.78% 42.86% 86.96% 100% 71.43%
0.00%
20.00%
40.00%
60.00%
80.00%
100.00%
120.00%
Per
cen
tage
(%)
Categories of drug samples and their API components
SQ-TLC results of drug samples
University of Ghana http://ugspace.ug.edu.gh
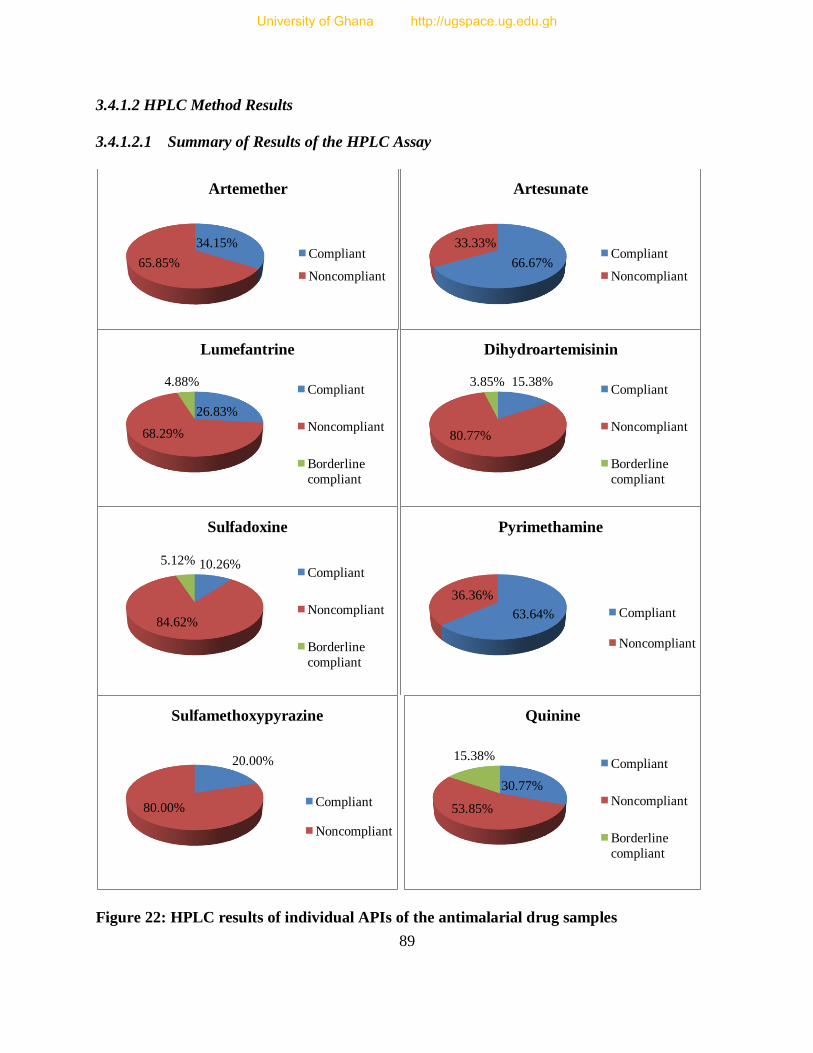
89
3.4.1.2 HPLC Method Results
3.4.1.2.1 Summary of Results of the HPLC Assay
Figure 22: HPLC results of individual APIs of the antimalarial drug samples
34.15%
65.85%
Artemether
Compliant
Noncompliant 66.67%
33.33%
Artesunate
Compliant
Noncompliant
26.83%
68.29%
4.88%
Lumefantrine
Compliant
Noncompliant
Borderline
compliant
15.38%
80.77%
3.85%
Dihydroartemisinin
Compliant
Noncompliant
Borderline
compliant
10.26%
84.62%
5.12%
Sulfadoxine
Compliant
Noncompliant
Borderline
compliant
63.64%
36.36%
Pyrimethamine
Compliant
Noncompliant
20.00%
80.00%
Sulfamethoxypyrazine
Compliant
Noncompliant
30.77%
53.85%
15.38%
Quinine
Compliant
Noncompliant
Borderline
compliant
University of Ghana http://ugspace.ug.edu.gh
90
Figure 22 above demonstrates a summary of the results obtained from the HPLC analysis of the
APIs. With the HPLC method, the samples were analysed for artemether, artesunate,
dihydroartemisinin, sulphadoxine, sulphamethoxypyridazine, pyrimethamine, lumefantrine and
quinine active pharmaceutical ingredients (APIs). For artesunate component, 66.67% (6/9) of
the samples were compliant and the remaining 33.33% (3/9) were non-compliant (under dose).
Artemether component of the samples posted 34.15% (14/41) and 65.85% (27/41) compliant and
non-compliant results respectively, with 48.15% (13/27) of the non-compliant samples being
overdose.
About 4.88% (2/41) of the lumefantrine component were found to be borderline compliant,
whereas 26.83% (11/41) and 68.29% (28/41) were compliant and non-compliant respectively,
and 50% (14/28) of the non-compliant samples were overdose. Of the samples that were
analyzed for dihydroartemisinin, 3.85% (1/26) was found to be borderline compliant, with
15.38% (4/26) being found compliant and 80.77% (21/26) found non-compliant (under dose).
In the case of sulphadoxine and pyrimethamine components, the HPLC results showed a
corresponding 5.12% (2/39) and 10.26% (4/39) for borderline compliant and compliant with
respect to sulphadoxine component and the remaining 84.62% (33/39) were non-compliant
(under dose). For pyrimethamine, 63.64% (28/44) and 36.36% (16/44) of the samples were
compliant and non-compliant respectively, of which 6/16 (37.50%) of the non-compliant
samples were overdose. Sulphamethoxypyridazine component had approximately 20% (1/5) of
the samples being certified as compliant, with 80% (4/5) being declared non-compliant all of
which were under dose. Finally, 15.38% (2/13) of the quinine samples were borderline
University of Ghana http://ugspace.ug.edu.gh
91
compliant, while 30.77% (4/13) were endorsed as compliant and 53.85% (7/13) turned out to be
non-compliant; 85.71% (6/7) of the non-compliant samples were found overdose (Figure 22).
These HPLC results were as a result of some SQ-TLC borderline samples in the numbers 3, 4, 1,
1, 13 and 1 for artesunate, artemether, lumefantrine, sulphadoxine, pyrimethamine and quinine
respectively being found compliant using the HPLC method (indicated as *BLC in the table of
results appendix II). Almost all the values for the latter method were also within the range of the
TLC method estimation. In addition, borderline compliant samples for lumefantrine (2) and
dihydroartemisinin (1) remained unchanged while the rest of the borderline samples were found
non-compliant. Out of the total 139 non-compliant components in all the samples, 28.06%
(39/139) were found to be overdose. Therefore, the HPLC results confirmed the widespread
existence of substandard API component quantities in all the drug samples. Therefore, non-
compliance was accounted for by both over dosage and under dosage of some of the
components, both in significant proportions.
3.4.1.2.2 Analysis of APIs of the Drug Samples with Respect to their Country of Origin
The samples were also analysed for API quantity with respect to their country of origin (source)
to find out a source that produced antimalarial drugs with good quality or better drug compliance
rate. In essence, a recommendation would be made as to the private traders as to whom they
should import from for quality drugs. Only the HPLC results were used based on individual APIs
and the drug as a whole. All the samples in this study were purported to be manufactured and
imported from India (68), Tanzania (13), Kenya (20), China (9) and the USA (2). Based on
HPLC results, the samples were comparatively analysed for compliance/non-compliance.
University of Ghana http://ugspace.ug.edu.gh
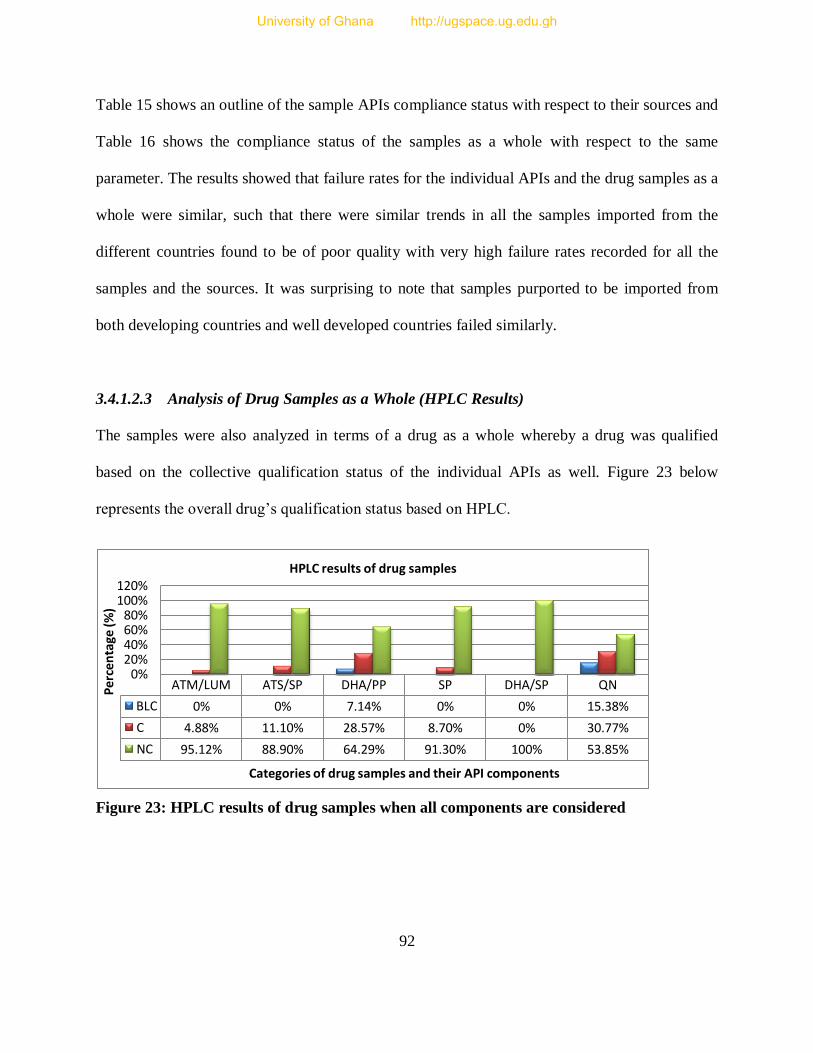
92
Table 15 shows an outline of the sample APIs compliance status with respect to their sources and
Table 16 shows the compliance status of the samples as a whole with respect to the same
parameter. The results showed that failure rates for the individual APIs and the drug samples as a
whole were similar, such that there were similar trends in all the samples imported from the
different countries found to be of poor quality with very high failure rates recorded for all the
samples and the sources. It was surprising to note that samples purported to be imported from
both developing countries and well developed countries failed similarly.
3.4.1.2.3 Analysis of Drug Samples as a Whole (HPLC Results)
The samples were also analyzed in terms of a drug as a whole whereby a drug was qualified
based on the collective qualification status of the individual APIs as well. Figure 23 below
represents the overall drug’s qualification status based on HPLC.
Figure 23: HPLC results of drug samples when all components are considered
ATM/LUM ATS/SP DHA/PP SP DHA/SP QN
BLC 0% 0% 7.14% 0% 0% 15.38%
C 4.88% 11.10% 28.57% 8.70% 0% 30.77%
NC 95.12% 88.90% 64.29% 91.30% 100% 53.85%
0% 20% 40% 60% 80%
100% 120%
Per
cen
tage
(%)
Categories of drug samples and their API components
HPLC results of drug samples
University of Ghana http://ugspace.ug.edu.gh
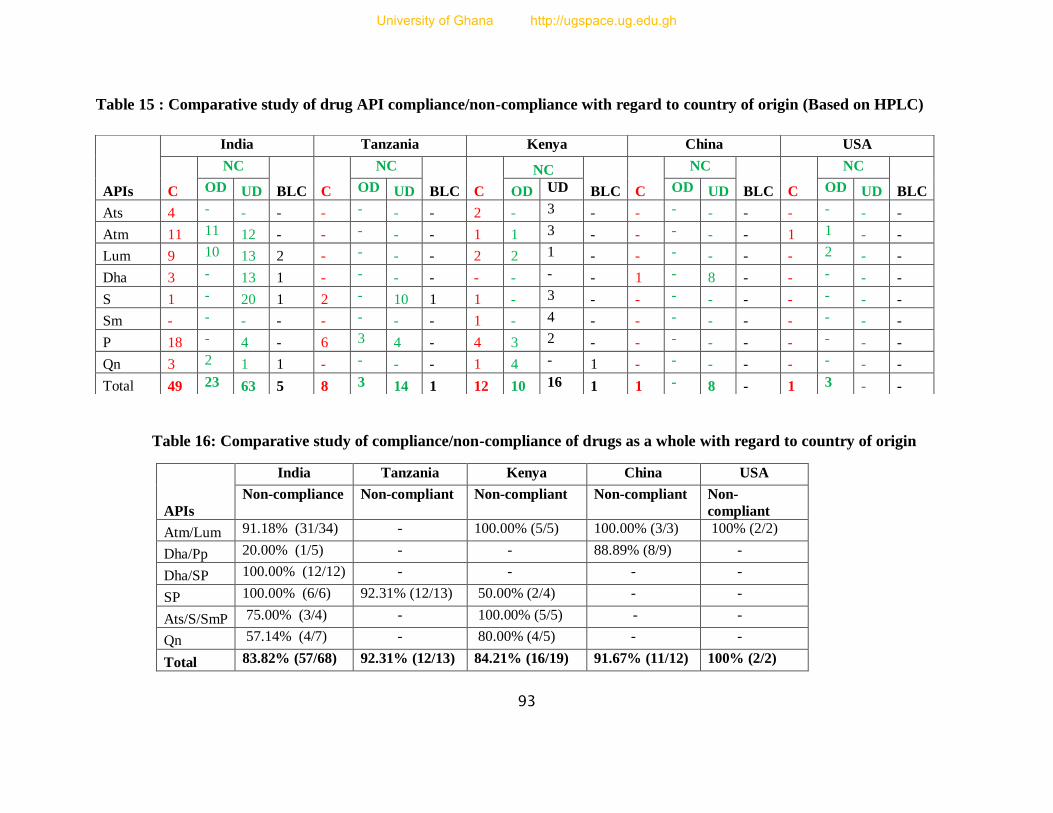
93
Table 15 : Comparative study of drug API compliance/non-compliance with regard to country of origin (Based on HPLC)
Table 16: Comparative study of compliance/non-compliance of drugs as a whole with regard to country of origin
APIs
India Tanzania Kenya China USA
Non-compliance Non-compliant Non-compliant Non-compliant Non-
compliant
Atm/Lum 91.18% (31/34) - 100.00% (5/5) 100.00% (3/3) 100% (2/2)
Dha/Pp 20.00% (1/5) - - 88.89% (8/9) -
Dha/SP 100.00% (12/12) - - - -
SP 100.00% (6/6) 92.31% (12/13) 50.00% (2/4) - -
Ats/S/SmP 75.00% (3/4) - 100.00% (5/5) - -
Qn 57.14% (4/7) - 80.00% (4/5) - -
Total 83.82% (57/68) 92.31% (12/13) 84.21% (16/19) 91.67% (11/12) 100% (2/2)
APIs
India Tanzania Kenya China USA
C
NC
BLC C
NC
BLC C
NC
BLC C
NC
BLC C
NC
BLC OD UD OD UD OD UD OD UD OD UD
Ats 4 - - - - - - - 2 - 3 - - - - - - - - -
Atm 11 11 12 - - - - - 1 1 3 - - - - - 1 1 - -
Lum 9 10 13 2 - - - - 2 2 1 - - - - - - 2 - -
Dha 3 - 13 1 - - - - - - - - 1 - 8 - - - - -
S 1 - 20 1 2 - 10 1 1 - 3 - - - - - - - - -
Sm - - - - - - - - 1 - 4 - - - - - - - - -
P 18 - 4 - 6 3 4 - 4 3 2 - - - - - - - - -
Qn 3 2 1 1 - - - - 1 4 - 1 - - - - - - - -
Total 49 23 63 5 8 3 14 1 12 10 16 1 1 - 8 - 1 3 - -
University of Ghana http://ugspace.ug.edu.gh
94
3.4.1.2.3.1 Artesunate/Sulphadoxine/Sulphamethoxypyridazine/Pyrimethamine Containing
Samples
With the HPLC, all the sample components were successfully analyzed. These samples consisted
of 5 artesunate/sulphamethoxypyridazine/pyrimethamine (Ats/SmP) samples and 4
artesunate/sulphadoxine/pyrimethamine (Ats/SP) samples. In Ats/SP samples, 100% (4/4) of the
artesunate components were compliant. For sulphadoxine component, 25% (1/4) was borderline
compliant with the rest (3/4) being non-compliant due to under dosage and 50% (2/4) of the
pyrimethamine component was compliant, while the remaining 2 were non-compliant (under
dose). In Ats/SmP samples, 40% (2/5) of the artesunate component was compliant whereas the
remaining 3 components were non-compliant and under dose. For sulphamethoxypyridazine
component, 20% (1/5) was borderline compliant with the rest being non-compliant and under
dose, whereas 40.00% (2/5) of pyrimethamine component were borderline compliant and 60%
(3/5) were found to be non-compliant and overdose. Overall, the results showed that
approximately 11.10% (1/9) and 88.90% (8/9) of the total sample were compliant and non-
compliant respectively.
3.4.1.2.3.2 Artemether/Lumefantrine Containing Samples
Out of the 36.6% (41/112) samples of artemether/lumefantrine analyzed, the HPLC results
showed that 4.88% (2/41) samples were compliant and 95.12% (34/41) non-compliant. The non-
compliant samples here had the quantities within the range 35-89% for under dosed and 110-
178% for over dosed (see section 3.4.1.2.1 for details). The HPLC tests found the SQ-TLC
designated borderline compliant sample to be non-compliant in addition to those that were
already non-compliant.
University of Ghana http://ugspace.ug.edu.gh
95
3.4.1.2.3.3 Dihydroartemisinin/Piperaquine Phosphate Containing Samples
With the HPLC as well, these samples were analyzed for the dihydroartemisinin component only
due to the lack of the piperaquine RS material. Therefore, it was treated like a monotherapy drug
in the analysis for dihydroartemisinin. Approximately 28.57% (4/14) of the samples were found
compliant, whereas 7.14% (1/14) turned out to be borderline compliant, with 64.29% (9/14)
being non-compliant due to under dosage. Using the HPLC, one of the two SQ-TLC borderline
compliant samples was found to be non-compliant and the other one remained the same.
3.4.1.2.3.4 Dihydroartemisinin/Sulphadoxine/Pyrimethamine Containing Samples
12 samples contained dihydroartemisinin/sulphadoxine/pyrimethamine APIs and all the samples
were non-compliant due to the high failure rate in the dihydroartemisinin and sulphadoxine
components. For example, while 100% (12/12) of the pyrimethamine component was compliant,
100% of the dihydroartemisinin was non-compliant and 8.33% (1/12) of the sulphadoxine was
compliant; with the further 91.67% (11/12) being non-compliant. All the non-compliant samples
in both dihydroartemisinin and sulphadoxine components failed because they were under dosed.
3.4.1.2.3.5 Sulphadoxine/Pyrimethamine Containing Samples
Out of the 23 samples that contained sulphadoxine and pyrimethamine only, 8.70% (2/23) were
found to be compliant and the remaining 91.30% (21/23) were non-compliant. The failure rate
was overwhelming due to the high non-compliant status of the sulphadoxine component unlike
the pyrimethamine. As a matter of illustration, 13.04% (3/23) of the sulphadoxine alone was
confirmed compliant, while 4.35% (1/23) was borderline compliant and 82.61% (19/23) non-
compliant. On the other hand, the quantity of pyrimethamine that turned out to be compliant and
University of Ghana http://ugspace.ug.edu.gh
96
non-compliant was 52.17% (12/23) and 47.83% (11/23) respectively. All the non-compliant
components fell within the 47-84% range, except 27.27% (3/11) of the non-compliant
pyrimethamine component that were overdosed. One (1) out of the 2 SQ-TLC borderline
compliant samples turned out to be non-compliant whereas the other one was found to be
compliant when the HPLC method was used.
3.4.1.2.3.6 Quinine Containing Samples
The quinine samples were in different forms of quinine sulphate, quinine bisulphate and quinine
hydrochloride. All the samples were duly analysed using HPLC. Approximately 30.77% (4/13)
of these samples were compliant, with 15.38% (2/13) and 53.85% (7/13) being borderline
compliant and non-compliant respectively; 85.71% (6/7) of the non-compliant quinine samples
were found overdosed. The HPLC tests of the SQ-TLC borderline compliant samples showed
that 1 sample turned out to be compliant, whereas one sample became non-compliant and one
SQ-TLC non-compliant sample turned out to be borderline compliant.
Therefore, majority of the samples have been found non-compliant with the Ph. Int. [96, 105]
requirements. Some of the non-compliant samples had more than the requisite API amount, a
situation which is abnormal for most substandard drugs. This might be attributed to either wrong
calibration in a normal/licensed manufacturing company or counterfeiting, whereby production
of the drugs takes place in substandard infrastructure using substandard materials and machinery
by mostly unqualified personnel.
University of Ghana http://ugspace.ug.edu.gh

97
The current study results are comparable to those found in recent studies conducted in Ghana by
Osei-Safo et al. [92]
and Konadu [68]
as well as several other surveys in both Africa and Asia in
which significant proportions of the samples were also found to be overdosed, with serious cases
also reported in quinine samples as well.
The results therefore show that whereas a given FDC drug may have certain individual
components complying with pharmacopoeial specifications, other components may render the
drug as a whole non-compliant. If therefore a component complies and is in sufficient quantities
to effect reduction of parasitaemia, the drug as a whole may produce some treatment success,
giving a false impression of total efficacy. The danger, however is that the absence or
insufficient quantities of the other component(s) of the fixed dose combination drug to do what
it/ is/are supposed to do in the overall cure or reduction in parasitaemia, could lead to rapid
development of drug resistance.
3.4.1.3 Comparison of SQ-TLC and HPLC Results
After analyzing the results with respect to SQ-TLC and HPLC methods separately, the results
were compared as well to find out if they were comparable. Figure 24 below illustrates the
comparison of the results derived from the two analytical methods.
University of Ghana http://ugspace.ug.edu.gh
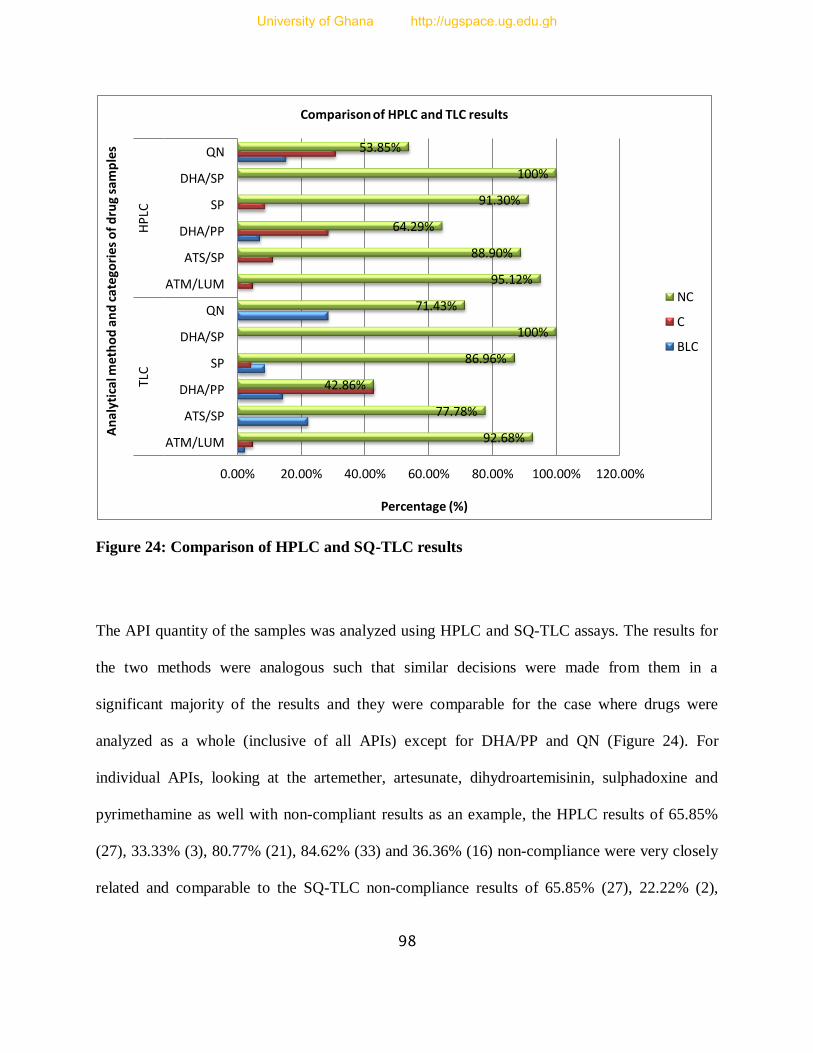
98
Figure 24: Comparison of HPLC and SQ-TLC results
The API quantity of the samples was analyzed using HPLC and SQ-TLC assays. The results for
the two methods were analogous such that similar decisions were made from them in a
significant majority of the results and they were comparable for the case where drugs were
analyzed as a whole (inclusive of all APIs) except for DHA/PP and QN (Figure 24). For
individual APIs, looking at the artemether, artesunate, dihydroartemisinin, sulphadoxine and
pyrimethamine as well with non-compliant results as an example, the HPLC results of 65.85%
(27), 33.33% (3), 80.77% (21), 84.62% (33) and 36.36% (16) non-compliance were very closely
related and comparable to the SQ-TLC non-compliance results of 65.85% (27), 22.22% (2),
92.68%
77.78%
42.86%
86.96%
100%
71.43%
95.12%
88.90%
64.29%
91.30%
100%
53.85%
0.00% 20.00% 40.00% 60.00% 80.00% 100.00% 120.00%
ATM/LUM
ATS/SP
DHA/PP
SP
DHA/SP
QN
ATM/LUM
ATS/SP
DHA/PP
SP
DHA/SP
QN TL
C
HP
LC
Percentage (%)
An
alyt
ical
me
tho
d a
nd
cat
ego
rie
s o
f d
rug
sam
ple
s
Comparison of HPLC and TLC results
NC
C
BLC
University of Ghana http://ugspace.ug.edu.gh

99
69.29% (18), 82.05% (32) and 38.63% (17) respectively. However, the HPLC and SQ-TLC
results of lumefantrine and quinine APIs were slightly wider in difference. These slight and wide
differences can be attributed to some of the borderline SQ-TLC compliant cases being found to
be either fully compliant or non-compliant by HPLC. The HPLC assay was used to confirm and
specify the estimated TLC results. Hence, the difference between the two methods was found to
be insignificant because majority of the HPLC results fell within the TLC results ranges, whether
compliant or non-compliant. For example, artesunate (3), artemether (4), lumefantrine (1),
sulphadoxine (1), pyrimethamine (13) and quinine (1) samples changed from borderline
compliant to compliant with HPLC assay (indicated as *BLC in the table of results, appendix II)
and were still within the TLC range which made the TLC results statistics more closer to those of
the HPLC results. Therefore, the HPLC and TLC results were comparable and equally important
for the analysis (refer to appendix II). A correlation curve for each API in Figure 25 below
further illustrates the comparability of the HPLC and SQ-TLC results; with a correlation
coefficient of r = 0.949, showing a very strong similarity in the results.
Figure 25: Correlation curve of HPLC and SQ-TLC results
0
50
100
150
200
0 20 40 60 80 100 120 140 160
HP
LC A
PI R
esu
lts
SQ-TLC API Results
Correlation Curve of SQ-TLC vs HPLC for Each API
University of Ghana http://ugspace.ug.edu.gh

100
3.4.2 Combined HPLC and SQ-TLC Results
3.4.2.1 Artesunate/Sulphadoxine/Sulphamethoxypyrazine/Pyrimethamine Containing Samples
There were 9 samples constituting 8.04% of the total samples. 33.33% (3/9) of these samples had
artesunate component failure, 77.78% (7/9) had sulphadoxine component failure and 55.56%
(5/9) had a pyrimethamine component failure. The overall results for the drug samples with all
the components analyzed showed that 1 out of 9 samples were fully compliant in all respects
representing an overall 88.89% failure rate.
3.4.2.2 Artemether/Lumefantrine Containing Samples
41 samples containing artemether/lumefantrine were analyzed representing 36.6% of the total
sample size. The results of the artemether component showed a 65.85% (27/41) failure rate and
lumefantrine component was found to be 68.85% (28) non-compliant. On overall, 39 out of 41
samples were not compliant representing a 95.12% failure rate. Being the first line treatment, this
is a devastating situation to the efforts against Malaria in a country burdened with acute, frequent
and persistent drug shortages in public hospitals, thus making people resort to private hospitals
and pharmacies for prompt and easily accessible treatment.
3.4.2.3 Dihydroartemisinin/Piperaquine Phosphate Containing Samples
These samples were analyzed for the dihydroartemisinin component only due to the lack of a
piperaquine reference standard. Therefore, it was treated like a monotherapy drug in the analysis.
35.71% (5/14) of the samples were compliant. It is quite possible that a few more non-
compliance cases would have been recorded if the piperaquine had also been analysed.
University of Ghana http://ugspace.ug.edu.gh
101
3.4.2.4 Dihydroartemisinin/Sulphadoxine/Pyrimethamine Containing Samples
There were 12 samples containing this formulation. The components dihydroartemisinin,
sulphadoxine and pyrimethamine recorded 100%, 91.7% and 0% failure rates respectively.
Generally, all the samples were non-compliant with the Ph. Int. requirements, even though all the
samples had 100% compliance for pyrimethamine. This situation where one component of a
multi component formulation complies while the other does not, was found to be common in all
the samples analysed. The implication is that the synergism effect that is aimed at preventing
development of parasite resistance against the drug over a short period of its usage is
compromised. Hence, the drug only reduces the malaria causing parasite, which eliminates the
signs/symptoms and once the parasites re-group and one falls sick again, it is unlikely that s/he
would get cured as the parasites might have developed resistance against the drug. In cases
where the API is overdosed, one is likely to get cured with serious or unexpected side effects
and/or organ damages even unintended self-poisoning that can cause death.
3.4.2.5 Sulphadoxine / Pyrimethamine Containing Samples
There were 23 samples that contained sulphadoxine and pyrimethamine only and 82.61% (19/23)
of the sulphadoxine component were non-compliant, 4.35% (1/23) were borderline compliant
and 13.04% (3/23) were compliant. In addition, 52.17% (12/23) of the pyrimethamine
component were non-compliant and the rest were compliant. On overall, 91.30% (21/23) of the
samples were non-compliant. This is also a worrisome development because sulphadoxine /
pyrimethamine is still administered in Malawian hospitals especially to the vulnerable group of
pregnant women, due to the lack of comprehensive studies on the possible adverse effects of
ACTs on the developing foetus. Hence, administering of poor quality SP drugs could worsen the
University of Ghana http://ugspace.ug.edu.gh
102
already fragile situation this group encounters and aggravate the parasite resistance the regimen
has faced.
3.4.2.6 Quinine Containing Samples
There were 13 quinine containing samples consisting of quinine sulphate, quinine bisulphate and
quinine hydrochloride. All the samples were analysed using HPLC, while some could not be
analysed using SQ-TLC method because the extraction process was not efficient enough such
that the results were not comparable to their HPLC counterparts like all other samples (see
appendix II for details for such samples). The results showed that 53.85% of the samples were
non-compliant.
The high failure rate of the drugs and their individual components is worrisome and poses a
serious parasite resistance (for under dosed) and toxicity (for overdosed) threats to the use of
quinine for the treatment of more complicated cases of malaria. In addition, most of the malaria
cases in Malawi are diagnosed without microscopic determination. In most cases, most types of
fever are presumed to be malaria first, and treated as such. If indeed, such an ad hoc diagnosis is
also treated with substandard or poor quality antimalarials, this could lead to treatment failure
and/or fast development of resistance. This inference comes with the background reported by
Bate et al.[45]
that resistance development of chloroquine and sulphadoxine in Africa in the 1990s
and the devastating impact of malaria on the people was partly due to the use of substandard
drugs.
University of Ghana http://ugspace.ug.edu.gh

103
3.4.3 Registration Status and Quality of the Samples
The results of the registered and unregistered samples were compared to determine whether the
registration status necessarily had an influence on the quality of the drugs. Below is Figure 26
summarizing the relationship between drug registration and compliance.
Figure 26: A comparison of failure rates for registered and unregistered samples
Out of the 97 registered samples, 15.46% (15) of the samples were compliant, while 6.67% (1) of
the 15 unregistered samples were compliant. Although the registered samples had a better
compliance compared to the unregistered ones, the overall results show that better registration
status does not necessarily always guarantee the quality a drug. These results are similar to the
observations made in the 2008/2009 Ghana study [67]
. This implies that a registered drug does not
mean good quality drug and the fact that a drug is registered with the national regulatory
authority does not make it good. This might be caused by lack of adherence of a supplier to
registration guidelines, whereby they register a particular batch number of drug products and
duplicate lots of that batch number, which are not checked by authorities.
registered Unregistered
compliant 15.46% 6.67%
non-compliant 84.54% 93.33%
0.00%
20.00%
40.00%
60.00%
80.00%
100.00%
Per
cen
tage
(%)
Registered vs Unregistered samples
University of Ghana http://ugspace.ug.edu.gh

104
In addition, this might also be caused by a supplier registering a particular product name or
formulation and more products similar to it subsequently supplied without being checked.
Furthermore, this problem might be attributed to lack of rigorous testing and assessment of the
new products information required and presented for registration due to either lack of
instruments for thorough testing or lack of qualified personnel. Additionally, this problem is also
caused by supplier presenting a well manufactured drug product for the registration application
process, which after passing the scrutiny, is diluted and subsequent products are prepared
without regard to GMP. Finally, due to the lack of forensic testing of the drug products, some
counterfeit products get their way into the market by mimicking the registered products,
compromising the quality of the drug market as a whole. There is also the possibility of an
importer simply not subjecting products for registration with all the tools involved, simply
because the regulatory authorities are not vigilant enough in surveillance and application of
appropriate sanctions.
3.4.4 Samples with the Same Batch Number
Such samples were expected to have the same quantities of APIs or negligible differences. On
the contrary, majority of the samples had varying quantities within a pool of a batch number (see
appendix III). This might be attributed to counterfeiting, lack of adherence to good
manufacturing and laboratory practices, inconsistent quantities of excipients that are, among
others, used to minimize the effect of adverse conditions (e.g. heat, humidity) on APIs and
exposure to different environmental conditions that affect the stability of APIs significantly.
University of Ghana http://ugspace.ug.edu.gh
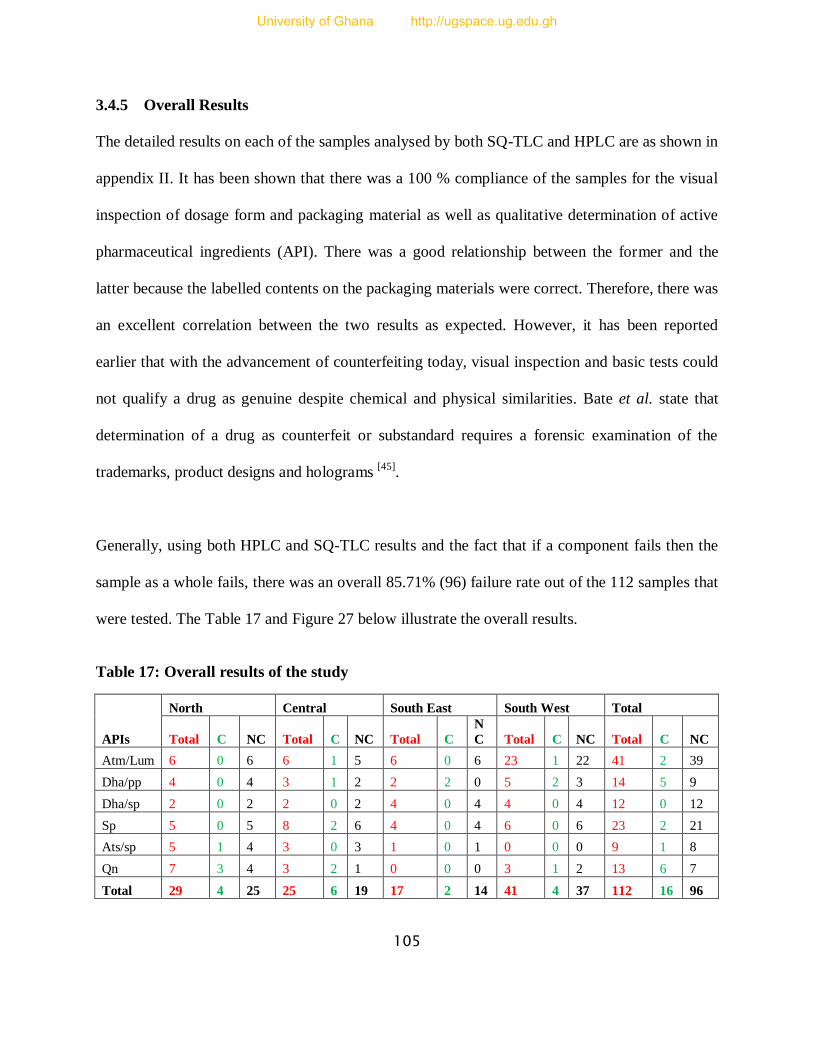
105
3.4.5 Overall Results
The detailed results on each of the samples analysed by both SQ-TLC and HPLC are as shown in
appendix II. It has been shown that there was a 100 % compliance of the samples for the visual
inspection of dosage form and packaging material as well as qualitative determination of active
pharmaceutical ingredients (API). There was a good relationship between the former and the
latter because the labelled contents on the packaging materials were correct. Therefore, there was
an excellent correlation between the two results as expected. However, it has been reported
earlier that with the advancement of counterfeiting today, visual inspection and basic tests could
not qualify a drug as genuine despite chemical and physical similarities. Bate et al. state that
determination of a drug as counterfeit or substandard requires a forensic examination of the
trademarks, product designs and holograms [45]
.
Generally, using both HPLC and SQ-TLC results and the fact that if a component fails then the
sample as a whole fails, there was an overall 85.71% (96) failure rate out of the 112 samples that
were tested. The Table 17 and Figure 27 below illustrate the overall results.
Table 17: Overall results of the study
APIs
North Central South East South West Total
Total C NC Total C NC Total C
N
C Total C NC Total C NC
Atm/Lum 6 0 6 6 1 5 6 0 6 23 1 22 41 2 39
Dha/pp 4 0 4 3 1 2 2 2 0 5 2 3 14 5 9
Dha/sp 2 0 2 2 0 2 4 0 4 4 0 4 12 0 12
Sp 5 0 5 8 2 6 4 0 4 6 0 6 23 2 21
Ats/sp 5 1 4 3 0 3 1 0 1 0 0 0 9 1 8
Qn 7 3 4 3 2 1 0 0 0 3 1 2 13 6 7
Total 29 4 25 25 6 19 17 2 14 41 4 37 112 16 96
University of Ghana http://ugspace.ug.edu.gh
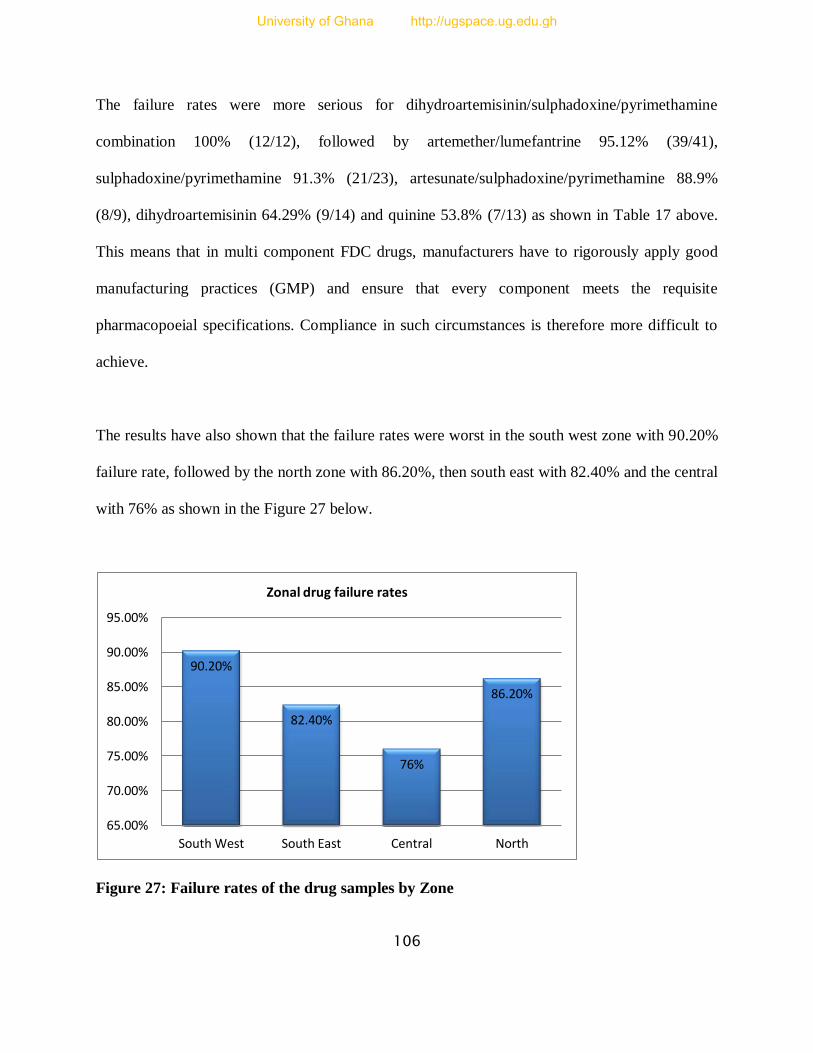
106
The failure rates were more serious for dihydroartemisinin/sulphadoxine/pyrimethamine
combination 100% (12/12), followed by artemether/lumefantrine 95.12% (39/41),
sulphadoxine/pyrimethamine 91.3% (21/23), artesunate/sulphadoxine/pyrimethamine 88.9%
(8/9), dihydroartemisinin 64.29% (9/14) and quinine 53.8% (7/13) as shown in Table 17 above.
This means that in multi component FDC drugs, manufacturers have to rigorously apply good
manufacturing practices (GMP) and ensure that every component meets the requisite
pharmacopoeial specifications. Compliance in such circumstances is therefore more difficult to
achieve.
The results have also shown that the failure rates were worst in the south west zone with 90.20%
failure rate, followed by the north zone with 86.20%, then south east with 82.40% and the central
with 76% as shown in the Figure 27 below.
Figure 27: Failure rates of the drug samples by Zone
90.20%
82.40%
76%
86.20%
65.00%
70.00%
75.00%
80.00%
85.00%
90.00%
95.00%
South West South East Central North
Zonal drug failure rates
University of Ghana http://ugspace.ug.edu.gh
107
The results suggest that there is a widespread circulation of poor quality antimalarial drugs with
the south west zone being the worst affected. This has been greatly attributed to the presence of
more economic activity places in south west region such as the Mulanje border, Mwanza border
and Blantyre city that attract more imports and influence the import of poor quality drugs. In
addition, this region has higher economic activities with higher likelihood of population increase,
which provides a good market for goods. The north has two places of high economic activities
such as Karonga border and Mzuzu and a large number of imports pass through this border from
Tanzania and Kenya just like the Mwanza border in the south west zone. However, the other
zones are equally centres of high economic activities because they also have cities and border
posts like Zomba city and Mangochi district border for south east and Lilongwe city as well as
Mchinji and Dedza border posts for the central zone, only that the activities are slightly lower
than the former two zones with high failure rates. In addition, the borders are porous and despite
the regulatory body carrying out some testing activities, some poor quality drugs are bound to be
smuggled into the country; worse still the tests done at the border posts are not rigorous enough
to detect a fake, substandard or degraded drug, other than just certifying that the sample contains
the labelled APIs, which is not sufficient; that is, if at all they take place as per requirement
because their occurrence is not well documented in the published literature.
The high circulation of poor quality drugs implies that many people are using antimalarial drugs
with insufficient or too much amount of the requisite APIs, hence such drugs would either not be
effective because they cannot eradicate all the parasites from the body and those that survive can
easily develop and transmit resistance (for under dose) or cause some toxicity concerns (for
overdose). These effects might lead to worsening of an acute to severe malaria case, high cost of
University of Ghana http://ugspace.ug.edu.gh
108
treatment to get cured, loss of public trust in the treatment regimen and unreliable studies on
medical drug efficacy resulting in high mortality rate. Despite the effort put in by the Malawi
government and its partners to minimize the impact of Malaria over the years, Malaria remains
the country’s biggest health challenge and the most risky part is that almost the whole population
is affected.
Several programmes have been rolled out and phased out, others are still in progress, but the
problem seems to be getting worse and there have been cases of resistance against antimalarials
as well. Nevertheless, the trend is similar to the areas where resistance and high treatment
failures have been attributed to poor quality drugs. Some of these suggestions are supported by
an article in which the Malawi government is quoted to have ordered the removal of some
antimalarial drugs such as sulphadoxine/pyrimethamine from the shops’ shelves. This particular
antimalarial drug was suspected to have had its sensitivity to malaria parasites compromised, and
has since been replaced with artemether/lumefantrine [110]
.
The post-marketing surveillance and pharmacovigilance system in Malawi has been under
development since 2009 and therefore is still faced with severe limitations. This problem is also
shared by other African countries like Tanzania and Kenya which are also sources of antimalarial
drugs imported into Malawi. Unless this problem is solved with urgency, all efforts to kick out
malaria will be in vain. Moreover, if there is development of resistance, this could be disastrous
because currently there does not appear to be any new efficacious antimalarial drug in the
pipeline to replace the current regimen.
University of Ghana http://ugspace.ug.edu.gh
109
3.4.6 Comparison of Results with Recent Results from other African Countries
The results of the current Malawi study were compared with the results of other African
countries from a recent survey reported in the WHO QAMSA report of 2011, where the
participating countries Ethiopia, Kenya, Tanzania, Cameroon, Ghana and Nigeria had 0%, 5%,
11%, 37%, 39% and 64% failure rates respectively [55]
. Another recent study report by Nayyar et
al. (2012) was selected. In this survey, the authors reviewed several survey reports of poor
quality antimalarial drugs from mostly Uganda, Cameroon, Kenya, Democratic Republic of
Congo, Burkina Faso, Madagascar, Senegal, Ghana, Nigeria, Tanzania, Ethiopia, Gabon, Mali,
Mozambique, Zimbabwe, Sudan, Burundi, Angola, Congo, Chad and Rwanda for the period
between 1999 and 2011 [63]
.
The review report showed that the failure rates for all the surveys conducted in these countries
within the stated period were in the range 12-69%, with the exception of one of the studies
conducted in Ghana which reported an 82% failure rate in 2008 [63]
. Therefore, the Malawian
failure rate of 85.71% is very alarming. This problem might be attributed to lack of routine
rigorous drug testing by international and local organizations as most international surveys have
rarely included samples from Malawi and such activities are also rarely done internally if they
take place at all because efforts to locate any such activity taking place at the required level have
proved futile.
In addition, Caudron et al., 2008 reported the results of a quality audit done by Medicin Sans
Frontiers (MSF) pharmacists over a period of 4 years in 180 sites they visited, which showed that
most regulated manufacturers bypassed their GMP compliance and set the standards of their drug
University of Ghana http://ugspace.ug.edu.gh
110
products based on the recipient countries status with regard to the level of regulation capability
and level of income as well as lack of prequalified standards by most developing countries to
their suppliers [111]
. So Malawi being one of the poorest countries apart from just being a
developing country, with poor regulatory capability, without a pharmacovigilance system and
lack of expertise in such areas, there is a possibility that these factors might be amongst the
causes of the high failure rates, because most of the drugs circulating in these countries are
manufactured by almost the same manufacturers.
3.4.7 Conclusions
The results have shown an alarming widespread use of poor quality drugs in Malawi, with the
south west and the north zones appearing to be the hub of the circulation of substandard
antimalarial drugs and the central zone having relatively high quality antimalarial drugs. In
addition, the results have also shown that the failure rate is much higher compared to other
African countries. The registration, visual and qualitative analysis of the drugs alone would not
serve a purpose of certifying a drug as worth prescription and the fact that a drug is registered
with the national regulatory authority does not guarantee its quality. As such, there is always a
need to carry out thorough tests on the drugs if the purpose of such activities is to flush out the
poor quality drugs. Some forms of drugs that are supposed to be phased out at the time of this
study were found to be still in circulation. It has also been established that SQ-TLC method can
be used if the HPLC method is beyond the capability of the community since the results of the
two methods are comparable.
University of Ghana http://ugspace.ug.edu.gh
111
Therefore, the results have shown that while the existence of a poor regulatory system is not a
conclusion that can be drawn directly from the present study, it could be responsible for the high
failure rate of medicines imported into the country. Hence, the regulatory system needs urgent
attention by the authorities for improvement to be able to carry out thorough routine tests of
drugs. This will result in better quality health care delivery through malaria and other diseases
control, patients’ safety, fight and eradication of parasite resistance.
3.4.8 Recommendations
Well-planned and implemented surveys need to be conducted to give a true reflection of the
nature of the poor antimalarial drugs as to whether those drugs found to be non-compliant are
degraded due to exposure to adverse conditions, counterfeited or substandard as a result of poor
manufacturing practices. From the fact that some substandard drugs might not be necessarily
counterfeit, it is recommended that analysis be carried out to determine the factors that
contributed to the current state of being substandard. This is so because a substandard drug can
result during production for a number of reasons like deliberate deviation from standards to
maximise profits, non-compliance with standard operating procedures (SOPs) and good
manufacturing practices (GMPs), equipment error or malfunctioning, degradation and/or
mishandling at any part of medicine continuum. Knowledge generated from the study would help
in choosing appropriate action to address the situation. The studies should also include
dissolution tests, which is also another important parameter that defines the quality of a drug plus
many other important parameters. Such studies should also be extended to public hospitals and
pharmacies.
University of Ghana http://ugspace.ug.edu.gh
112
Good procurement practices amongst the public and private institutions must be promoted and
appropriate measures taken to prevent the illegal importing and smuggling of drugs into the
country. The drug regulatory authority’s capacity should be strengthened in terms of
infrastructure and working personnel so that they will be able to conduct thorough initial quality
and routine tests on new supplies, drug manufacturing and packaging companies and suppliers
inspection to ensure strict adherence to the GMPs. Appropriate sensitisation of the public and
drug handling personnel in charge of the supply chain is needed to let them know the appropriate
quality control measures, proper drug storage and distribution.
A properly functioning and sustainable pharmacovigilance system should be developed. This
could partly be achieved by incorporating the pharmacovigilance topics in the various training
disciplines such as medicine, pharmacy, nursing colleges, public health schools or even
secondary schools at an introductory level.
University of Ghana http://ugspace.ug.edu.gh
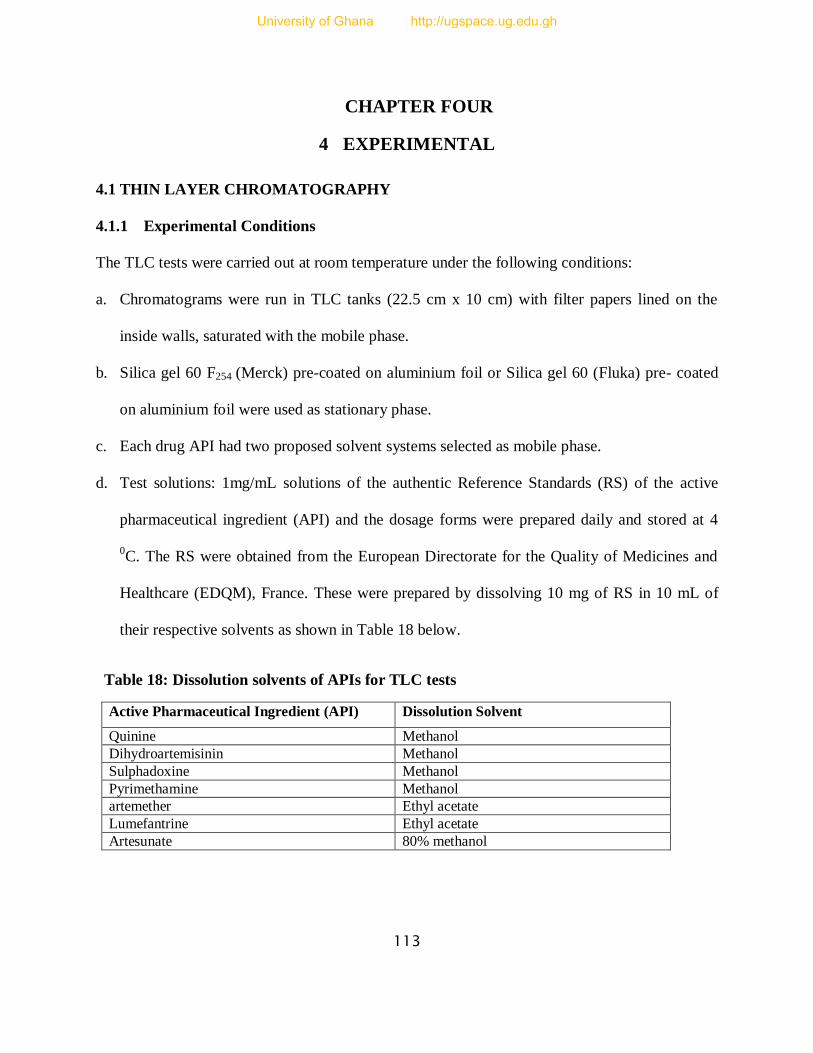
113
CHAPTER FOUR
4 EXPERIMENTAL
4.1 THIN LAYER CHROMATOGRAPHY
4.1.1 Experimental Conditions
The TLC tests were carried out at room temperature under the following conditions:
a. Chromatograms were run in TLC tanks (22.5 cm x 10 cm) with filter papers lined on the
inside walls, saturated with the mobile phase.
b. Silica gel 60 F254 (Merck) pre-coated on aluminium foil or Silica gel 60 (Fluka) pre- coated
on aluminium foil were used as stationary phase.
c. Each drug API had two proposed solvent systems selected as mobile phase.
d. Test solutions: 1mg/mL solutions of the authentic Reference Standards (RS) of the active
pharmaceutical ingredient (API) and the dosage forms were prepared daily and stored at 4
0C. The RS were obtained from the European Directorate for the Quality of Medicines and
Healthcare (EDQM), France. These were prepared by dissolving 10 mg of RS in 10 mL of
their respective solvents as shown in Table 18 below.
Table 18: Dissolution solvents of APIs for TLC tests
Active Pharmaceutical Ingredient (API) Dissolution Solvent
Quinine Methanol
Dihydroartemisinin Methanol
Sulphadoxine Methanol
Pyrimethamine Methanol
artemether Ethyl acetate
Lumefantrine Ethyl acetate
Artesunate 80% methanol
University of Ghana http://ugspace.ug.edu.gh

114
e. Application: different volumes of a 1mg/mL concentration reference standard (RS) in the
range 1.0, 1.2, 1.4, 1.6, 1.8, 2.0, 2.2 and 2.4μL equivalent to the corresponding quantities in
µg were applied to the plate at 1cm apart. The quantity of the dosage form was however kept
constant; 2.0μL of a 1mg/mL solution equivalent to 2.0μg of each drug was applied.
f. Detection: each active ingredient had its specific detection agent as specified in the
pharmacopoeia and published literature and these have been outlined (Tables 13 and 14).
4.1.2 Preparation of Dosage Form Solutions
An amount of the ground dosage form equivalent to 10mg of a given API was weighed into a
clean dry beaker. 5 mL of a suitable dissolution solvent was added to the beaker, then the
mixture shaken for at least 5 minutes and filtered. Another 3 mL of the solvent was added to the
filtration residue, shaken gently, then allowed to settle for at least 5 minutes and filtered again.
To check the effectiveness of the extraction, another 2 mL of the solvent was added to the
residue and a TLC spot developed from residue solution alongside the RS. Absence of the spot
from the residue meant complete API extraction. The filtrate was subsequently added to the other
filtrates to make up 10 mL of the dosage form solution. So in effect, a 1mg/mL solution was
prepared.
For each of the FDC formulations, each API component was assayed independent of the other
API constituents. For example, if artemether/lumefantrine is assayed for artemether, a quantity
that will give out 10mg of artemether is weighed, irrespective of what the amount of
lumefantrine will be given. Likewise when lumefantrine is assayed, an amount that will give
10mg of lumefantrine is weighed irrespective of the amount of artemether. Therefore, in
University of Ghana http://ugspace.ug.edu.gh
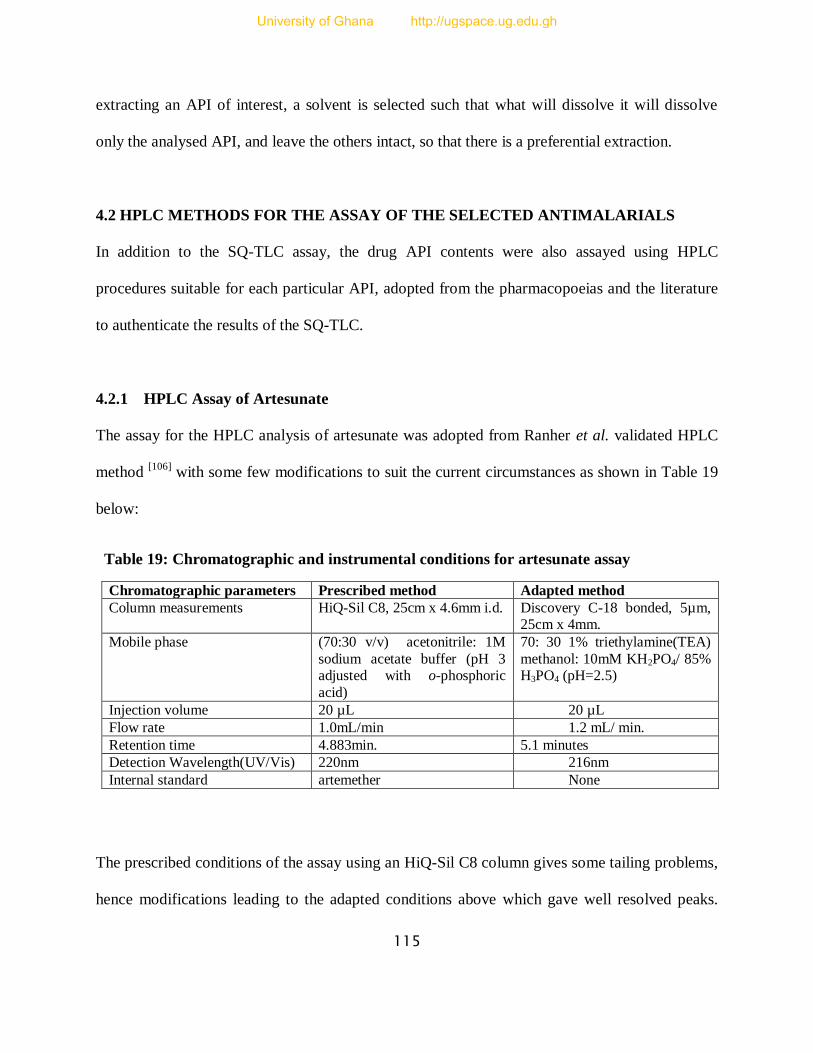
115
extracting an API of interest, a solvent is selected such that what will dissolve it will dissolve
only the analysed API, and leave the others intact, so that there is a preferential extraction.
4.2 HPLC METHODS FOR THE ASSAY OF THE SELECTED ANTIMALARIALS
In addition to the SQ-TLC assay, the drug API contents were also assayed using HPLC
procedures suitable for each particular API, adopted from the pharmacopoeias and the literature
to authenticate the results of the SQ-TLC.
4.2.1 HPLC Assay of Artesunate
The assay for the HPLC analysis of artesunate was adopted from Ranher et al. validated HPLC
method [106]
with some few modifications to suit the current circumstances as shown in Table 19
below:
Table 19: Chromatographic and instrumental conditions for artesunate assay
Chromatographic parameters Prescribed method Adapted method
Column measurements HiQ-Sil C8, 25cm x 4.6mm i.d. Discovery C-18 bonded, 5µm, 25cm x 4mm.
Mobile phase (70:30 v/v) acetonitrile: 1M
sodium acetate buffer (pH 3 adjusted with o-phosphoric
acid)
70: 30 1% triethylamine(TEA)
methanol: 10mM KH2PO4/ 85% H3PO4 (pH=2.5)
Injection volume 20 µL 20 µL
Flow rate 1.0mL/min 1.2 mL/ min.
Retention time 4.883min. 5.1 minutes
Detection Wavelength(UV/Vis) 220nm 216nm
Internal standard artemether None
The prescribed conditions of the assay using an HiQ-Sil C8 column gives some tailing problems,
hence modifications leading to the adapted conditions above which gave well resolved peaks.
University of Ghana http://ugspace.ug.edu.gh
116
The modifying agent, 1% triethylamine (TEA) was added to methanol and the pH of the 0.01 M
buffer potassium dihydrogen phosphate was adjusted to 2.5 with 10mM of phosphoric acid in the
70/30 v/v mobile phase.
4.2.1.1 Preparation and Assay of Artesunate RS Solution for Calibration Curve
Artesunate concentrations comprising 0.706 mg/mL, 0.807 mg/mL, 0.908 mg/mL, 1.009 mg/mL,
1.211mg/mL, 1.312mg/mL and 1.413mg/mL were prepared through dilution of pipette volumes
of 0.7mL, 0.8mL, 0.9mL, 1.0mL, 1.2mL, 1.3mL and 1.4mL respectively, from a 10.1mg/mL
stock solution of the artesunate reference material using 2mL of mobile phase (70:30 methanol:
buffer) and 8mL of HPLC grade water to produce 10 mL of working solution. The area under the
curve (AUC) for each concentration was determined with six replicates each and an average
AUC resulting from them. This data was used to plot a graph of average AUC against
concentration (C) using Microsoft Excel and the slope of the graph, intercept, correlation
coefficient (r2) as well as equation of the straight line, AUC = mC + b were deduced and
calculated from it. The area under the curve (AUC) is the average area under a chromatographic
peak, m = slope of the straight line and b = AUC intercept (Table 20 and Figure 28 below).
4.2.1.2 Preparation and Assay of Solutions of Artesunate Containing Tablets
A quantity of powdered dosage form equivalent to 10 mg of artesunate was weighed into a clean
dry 10 mL volumetric flask. 5mL of the mobile phase (70:30 v/v, 1% triethylamine in methanol:
buffer) was then added and the mixture shaken for 15 minutes on an ultrasonic sonicator. Then,
more mobile phase was added to the mark and the solution filtered through a 0.45 µm filter.
University of Ghana http://ugspace.ug.edu.gh
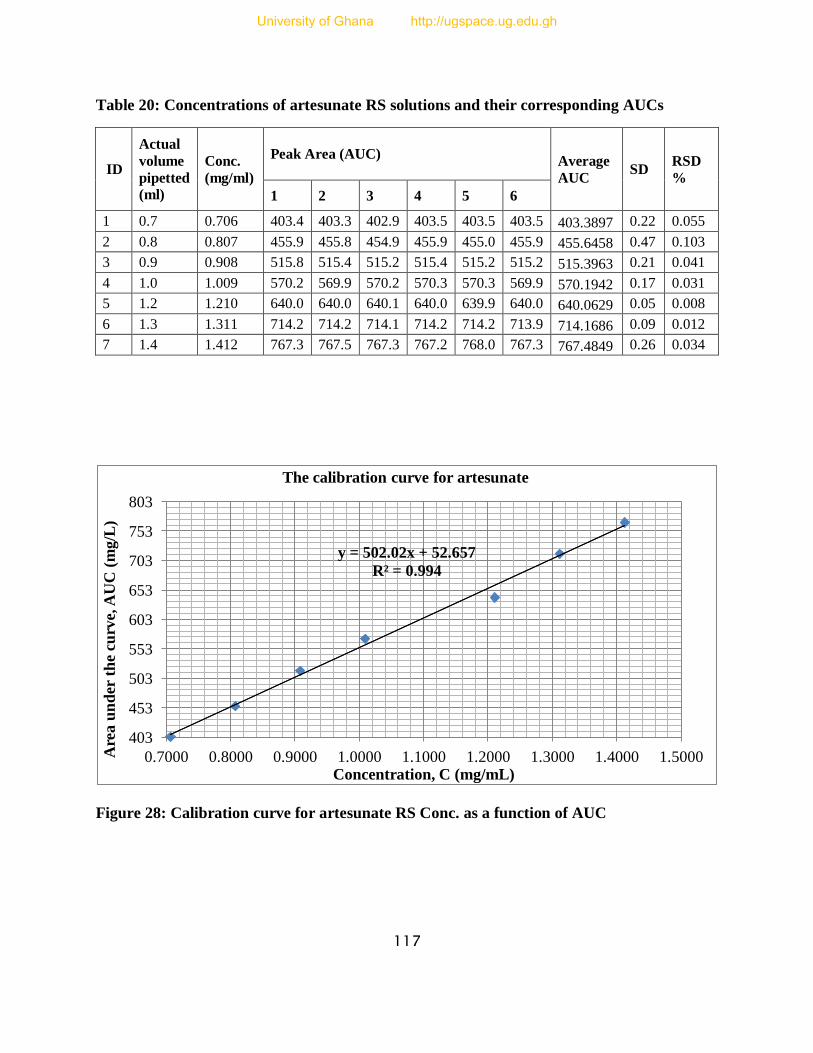
117
Table 20: Concentrations of artesunate RS solutions and their corresponding AUCs
ID
Actual
volume
pipetted
(ml)
Conc.
(mg/ml)
Peak Area (AUC) Average
AUC SD
RSD
%
1 2 3 4 5 6
1 0.7 0.706 403.4 403.3 402.9 403.5 403.5 403.5 403.3897 0.22 0.055
2 0.8 0.807 455.9 455.8 454.9 455.9 455.0 455.9 455.6458 0.47 0.103
3 0.9 0.908 515.8 515.4 515.2 515.4 515.2 515.2 515.3963 0.21 0.041
4 1.0 1.009 570.2 569.9 570.2 570.3 570.3 569.9 570.1942 0.17 0.031
5 1.2 1.210 640.0 640.0 640.1 640.0 639.9 640.0 640.0629 0.05 0.008
6 1.3 1.311 714.2 714.2 714.1 714.2 714.2 713.9 714.1686 0.09 0.012
7 1.4 1.412 767.3 767.5 767.3 767.2 768.0 767.3 767.4849 0.26 0.034
Figure 28: Calibration curve for artesunate RS Conc. as a function of AUC
y = 502.02x + 52.657
R² = 0.994
403
453
503
553
603
653
703
753
803
0.7000 0.8000 0.9000 1.0000 1.1000 1.2000 1.3000 1.4000 1.5000 Are
a u
nd
er t
he
curv
e, A
UC
(m
g/L
)
Concentration, C (mg/mL)
The calibration curve for artesunate
University of Ghana http://ugspace.ug.edu.gh
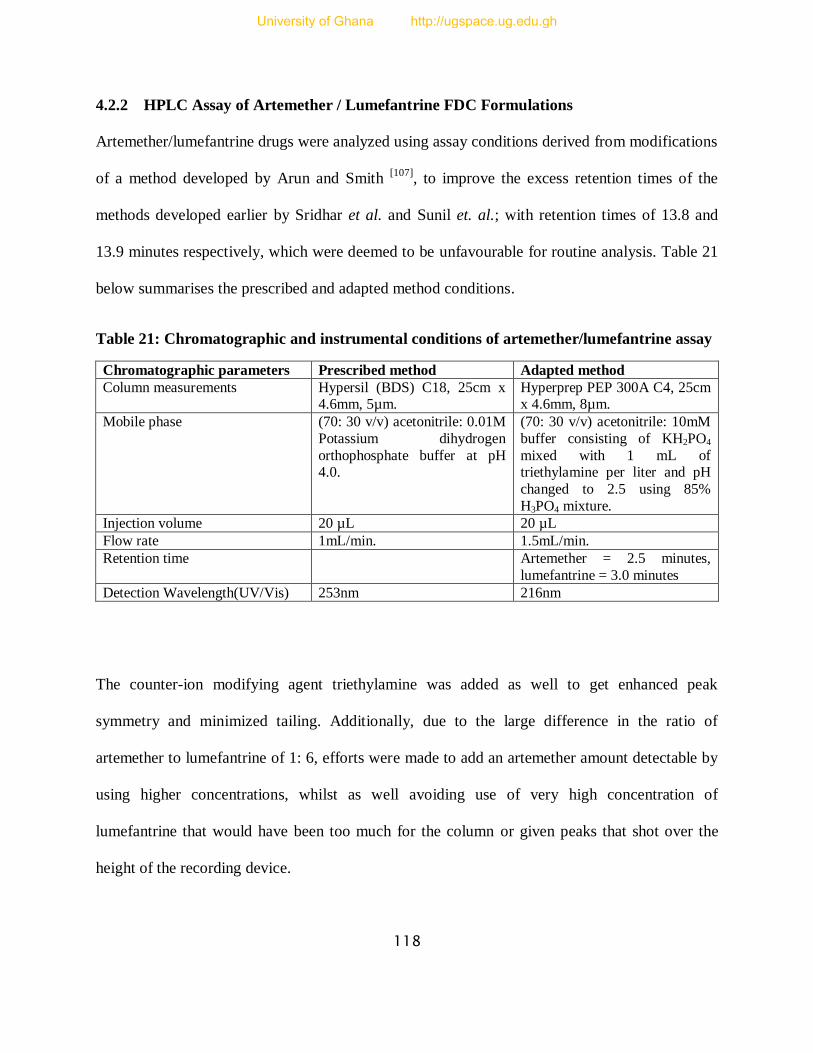
118
4.2.2 HPLC Assay of Artemether / Lumefantrine FDC Formulations
Artemether/lumefantrine drugs were analyzed using assay conditions derived from modifications
of a method developed by Arun and Smith [107]
, to improve the excess retention times of the
methods developed earlier by Sridhar et al. and Sunil et. al.; with retention times of 13.8 and
13.9 minutes respectively, which were deemed to be unfavourable for routine analysis. Table 21
below summarises the prescribed and adapted method conditions.
Table 21: Chromatographic and instrumental conditions of artemether/lumefantrine assay
Chromatographic parameters Prescribed method Adapted method
Column measurements Hypersil (BDS) C18, 25cm x 4.6mm, 5µm.
Hyperprep PEP 300A C4, 25cm x 4.6mm, 8µm.
Mobile phase (70: 30 v/v) acetonitrile: 0.01M
Potassium dihydrogen
orthophosphate buffer at pH 4.0.
(70: 30 v/v) acetonitrile: 10mM
buffer consisting of KH2PO4
mixed with 1 mL of triethylamine per liter and pH
changed to 2.5 using 85%
H3PO4 mixture.
Injection volume 20 µL 20 µL
Flow rate 1mL/min. 1.5mL/min.
Retention time Artemether = 2.5 minutes,
lumefantrine = 3.0 minutes
Detection Wavelength(UV/Vis) 253nm 216nm
The counter-ion modifying agent triethylamine was added as well to get enhanced peak
symmetry and minimized tailing. Additionally, due to the large difference in the ratio of
artemether to lumefantrine of 1: 6, efforts were made to add an artemether amount detectable by
using higher concentrations, whilst as well avoiding use of very high concentration of
lumefantrine that would have been too much for the column or given peaks that shot over the
height of the recording device.
University of Ghana http://ugspace.ug.edu.gh
119
4.2.2.1 Preparation and Assay of Artemether RS Solution for Calibration Curve
Artemether concentrations comprising 0.2797mg/mL, 0.3168mg/mL, 0.3564mg/mL,
0.3960mg/mL, 0.4356mg/mL, 0.4752mg/mL and 0.5148mg/mL were prepared through dilution
of 0.28mL, 0.32mL, 0.36mL, 0.40mL, 0.44mL, 0.48mL and 0.52mL pipette volumes of 9.9
mg/mL stock solution of the artemether reference material respectively and topped up to 10 mL
using mobile phase (70:30 v/v acetonitrile: buffer). Area under the curve (AUC) for each
concentration was determined with six replicates for each and an average AUC derived from
them. The data was used to plot a graph of average AUC against concentration (C) using
Microsoft Excel and the slope of the graph, intercept, correlation coefficient (r2) as well as
equation of the straight line, AUC = mC + b were deduced and calculated from it. The area under
the curve (AUC) is the average area under a chromatographic peak, m = slope of the straight line
and b = AUC intercept (Table 22 and Figure 29).
4.2.2.2 Preparation and Assay of Lumefantrine RS Solution for Calibration Curve
Similarly, lumefantrine concentrations comprising 1.6782mg/mL, 1.9008mg/mL, 2.1384mg/mL,
2.3760mg/mL, 2.6136mg/mL, 2.8512mg/mL and 3.0888mg/mL were prepared through dilution
of 0.28mL, 0.32mL, 0.36mL, 0.4mL, 0.44mL, 0.48mL and 0.52mL pipette volumes of
9.9mg/mL stock solution of the lumefantrine reference material for each concentration and top
up to 10mL using mobile phase (70:30 acetonitrile: buffer). Area under the curve (AUC) for
each concentration was determined with six replicates each and an average AUC derived from
them. The data was used to plot a graph of average AUC against concentration (C) using
Microsoft Excel and the slope of the graph, intercept, correlation coefficient(r2) as well as
equation of the straight line, AUC = mC + b were deduced and calculated from it. The area under
University of Ghana http://ugspace.ug.edu.gh
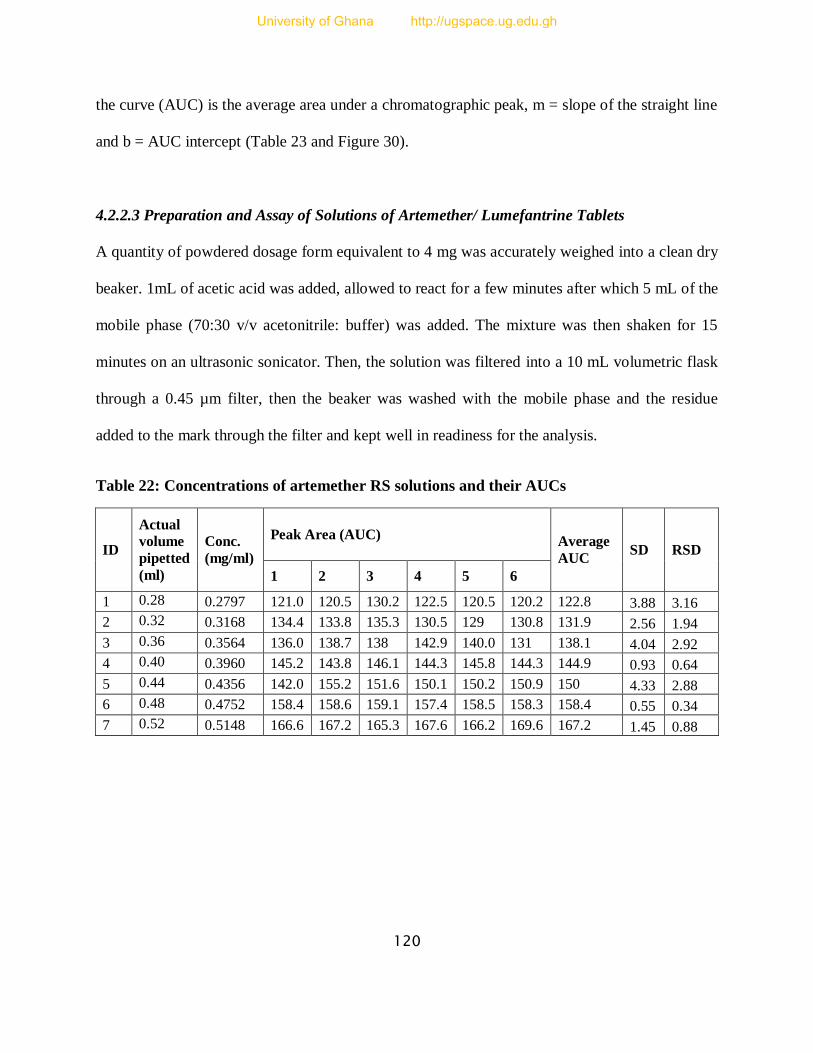
120
the curve (AUC) is the average area under a chromatographic peak, m = slope of the straight line
and b = AUC intercept (Table 23 and Figure 30).
4.2.2.3 Preparation and Assay of Solutions of Artemether/ Lumefantrine Tablets
A quantity of powdered dosage form equivalent to 4 mg was accurately weighed into a clean dry
beaker. 1mL of acetic acid was added, allowed to react for a few minutes after which 5 mL of the
mobile phase (70:30 v/v acetonitrile: buffer) was added. The mixture was then shaken for 15
minutes on an ultrasonic sonicator. Then, the solution was filtered into a 10 mL volumetric flask
through a 0.45 µm filter, then the beaker was washed with the mobile phase and the residue
added to the mark through the filter and kept well in readiness for the analysis.
Table 22: Concentrations of artemether RS solutions and their AUCs
ID
Actual
volume
pipetted
(ml)
Conc.
(mg/ml)
Peak Area (AUC) Average
AUC SD RSD
1 2 3 4 5 6
1 0.28 0.2797 121.0 120.5 130.2 122.5 120.5 120.2 122.8 3.88 3.16
2 0.32 0.3168 134.4 133.8 135.3 130.5 129 130.8 131.9 2.56 1.94
3 0.36 0.3564 136.0 138.7 138 142.9 140.0 131 138.1 4.04 2.92
4 0.40 0.3960 145.2 143.8 146.1 144.3 145.8 144.3 144.9 0.93 0.64
5 0.44 0.4356 142.0 155.2 151.6 150.1 150.2 150.9 150 4.33 2.88
6 0.48 0.4752 158.4 158.6 159.1 157.4 158.5 158.3 158.4 0.55 0.34
7 0.52 0.5148 166.6 167.2 165.3 167.6 166.2 169.6 167.2 1.45 0.88
University of Ghana http://ugspace.ug.edu.gh

121
Table 23: Concentrations of lumefantrine RS solutions and their AUCs
ID
Actual
volume
pipetted
(ml)
Conc.
mg/ml
Peak Area (AUC) Average
AUC SD
%
SD
1 2 3 4 5 6
1 0.28 1.6782 28344 28337 28093 28315 28297 28090 28226 121 0.4
2 0.32 1.9008 30243 30245 30685 30544 30345 30262 30416 185 0.6
3 0.36 2.1384 32159 32131 30909 32160 32122 32091 31883 500 1.6
4 0.40 2.3760 33503 33500 32033 33493 33502 33541 33214 602 1.8
5 0.44 2.6136 35452 35404 33385 35462 35391 35460 35020 836 2.4
6 0.48 2.8512 36537 36533 34161 36512 36334 36537 36015 954 2.7
7 0.52 3.0888 37822 37848 36892 37805 37843 37867 37651 386 1.0
Figure 29: Calibration curve for artemether RS Conc. as a function of AUC
y = 176.08x + 74.287
R² = 0.9941
122.78807
127.78807
132.78807
137.78807
142.78807
147.78807
152.78807
157.78807
162.78807
167.78807
172.78807
0.2804 0.3304 0.3804 0.4304 0.4804 0.5304
Are
a u
nd
er t
he
curv
e, A
UC
(m
g/L
)
Concentration, C (mg/mL)
The calibration curve for artemether
University of Ghana http://ugspace.ug.edu.gh

122
Figure 30: Calibration curve for lumefantrine RS Conc. as a function of AUC
4.2.3 HPLC Assay of Dihydroartemisinin
A method outlined in the Ph. Int. [105]
was modified to suit the present study as shown in Table 24
below, with both the old method conditions and the new conditions outlined.
Table 24: Chromatographic and instrumental conditions of dihydroartemisinin assay
Chromatographic parameters Prescribed technique Adapted method
Column measurements C-18 column, 10cm x 4.6mm, 3 µm
Kramasil C8, 25cm x 4.6mm, 5µm
Mobile phase 60:40 v/v, acetonitrile: water
with gradient elution
50:50 v/v, water: acetonitrile
Injection volume 20 µL 10µL
Flow rate 0.6mL/min. 1.5mL/min.
Retention time Total runtime of 30 min; no
retention time given
5.2 minutes
Detection wavelength (UV/Vis) 216nm 210nm
y = 6320.7x + 17985
R² = 0.9934
28226.02
30226.02
32226.02
34226.02
36226.02
38226.02
40226.02
1.6854 1.8854 2.0854 2.2854 2.4854 2.6854 2.8854 3.0854 3.2854
Are
a u
nd
er t
he
curv
e, A
UC
(mg
/L)
Concentration, C (mg/mL)
The calibration curve for lumefantrine
University of Ghana http://ugspace.ug.edu.gh

123
4.2.3.1 Preparation and Assay of Dihydroartemisinin RS Solution for Calibration Curve
Dihydroartemisinin concentrations comprising 0.7014mg/mL, 0.8016mg/mL, 0.9018mg/mL,
1.0020mg/mL, 1.1022mg/mL, 1.2024mg/mL and 1.3026mg/mL were prepared through dilution
of pipetted volumes of 1.4mL, 1.6mL, 1.8mL, 2.0mL, 2.2mL, 2.4mL and 2.6mL respectively,
from a stock solution of 12.5mg/mL dihydroartemisinin reference material and mobile phase
(60:40 v/v acetonitrile: phosphate buffer) was added to make a 25 mL solution. Area under the
curve (AUC) for each concentration was determined with six replicates each and an average
AUC derived from them. The data was used to plot a graph of average AUC against
concentration (C) using Microsoft Excel and the slope of the graph, intercept, correlation
coefficient (r2) as well as equation of the straight line, AUC = mC + b were deduced and
calculated from it. The area under the curve (AUC) is the average area under a chromatographic
peak, m = slope of the straight line and b = AUC intercept (Table 25 and Figure 31 below).
4.2.3.2 Preparation and Assay of Solutions of Dihydroartemisinin Containing Tablets
A quantity of powder equivalent to 10 mg of dosage form was accurately weighed into a clean
dry beaker. 5 mL of the mobile phase (60:40 v/v acetonitrile: phosphate buffer) was added as a
diluent and sonicated for 15 minutes on an ultrasonic sonicator. The solution was then filtered
through a 0.45 µm filter into a 10 mL volumetric flask and more diluent was used to wash the
beaker and the residue was added to the mark through the filter and the solution kept well in
readiness for the analysis.
University of Ghana http://ugspace.ug.edu.gh
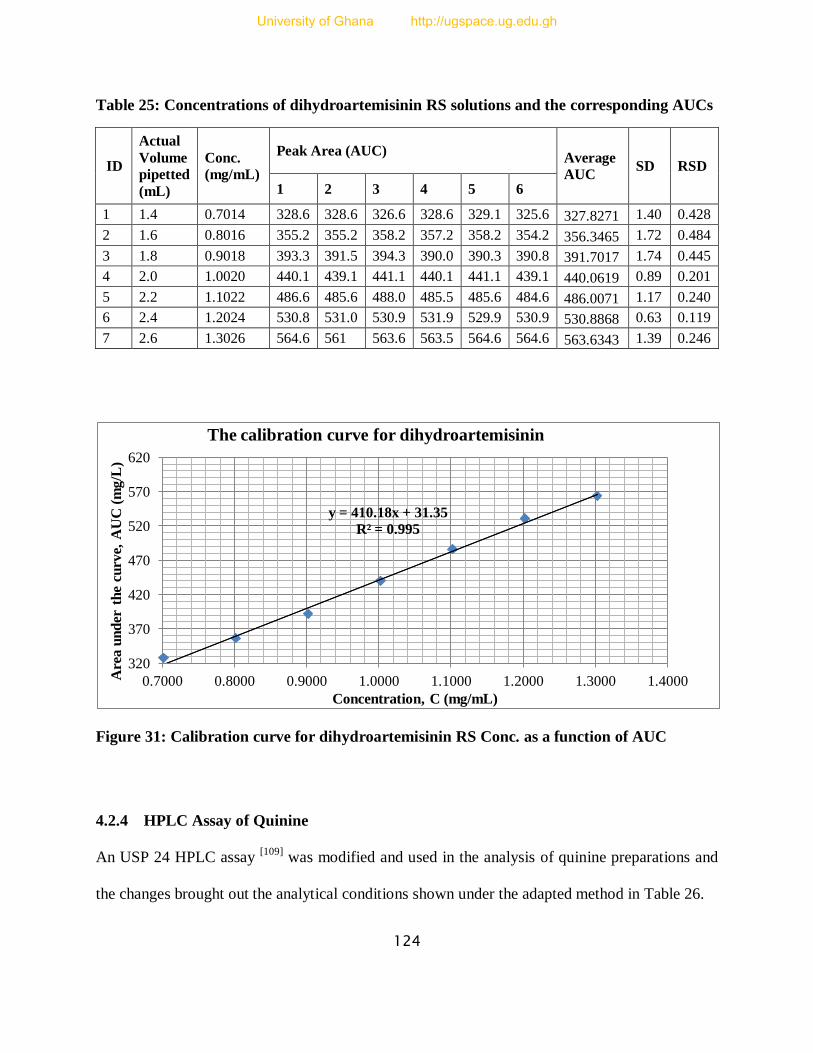
124
Table 25: Concentrations of dihydroartemisinin RS solutions and the corresponding AUCs
ID
Actual
Volume
pipetted
(mL)
Conc.
(mg/mL)
Peak Area (AUC) Average
AUC SD RSD
1 2 3 4 5 6
1 1.4 0.7014 328.6 328.6 326.6 328.6 329.1 325.6 327.8271 1.40 0.428
2 1.6 0.8016 355.2 355.2 358.2 357.2 358.2 354.2 356.3465 1.72 0.484
3 1.8 0.9018 393.3 391.5 394.3 390.0 390.3 390.8 391.7017 1.74 0.445
4 2.0 1.0020 440.1 439.1 441.1 440.1 441.1 439.1 440.0619 0.89 0.201
5 2.2 1.1022 486.6 485.6 488.0 485.5 485.6 484.6 486.0071 1.17 0.240
6 2.4 1.2024 530.8 531.0 530.9 531.9 529.9 530.9 530.8868 0.63 0.119
7 2.6 1.3026 564.6 561 563.6 563.5 564.6 564.6 563.6343 1.39 0.246
Figure 31: Calibration curve for dihydroartemisinin RS Conc. as a function of AUC
4.2.4 HPLC Assay of Quinine
An USP 24 HPLC assay [109]
was modified and used in the analysis of quinine preparations and
the changes brought out the analytical conditions shown under the adapted method in Table 26.
y = 410.18x + 31.35
R² = 0.995
320
370
420
470
520
570
620
0.7000 0.8000 0.9000 1.0000 1.1000 1.2000 1.3000 1.4000 Are
a u
nd
er t
he
curv
e, A
UC
(m
g/L
)
Concentration, C (mg/mL)
The calibration curve for dihydroartemisinin
University of Ghana http://ugspace.ug.edu.gh

125
Table 26: Chromatographic and instrumental conditions for quinine assay
Chromatographic parameters Prescribed technique Adapted method
Column measurements C-18 Phenomenex luna, 15cm
x 4.66mm, 5 µm
Discovery C-18 bonded
, 25cm x 4.0 mm, 5 µm
Mobile phase 81:15:2:2 v/v, water: acetonitrile: methanesulfonic
acid solution: triethylamine
(TEA), pH 2.6
80:16:2:2 v/v, water: acetonitrile: methanesulfonic
acid: TEA, pH 2.6
Injection volume 10 µL 20 µL
Flow rate 1.2mL/min. 1.2mL/min.
Retention time 3.6minutes 4.7 minutes
Detection Wavelength (UV/Vis) 235nm 235nm
4.2.4.1 Mobile Phase Preparation
Methanesulfonic acid solution:
3.5 mL of methanesulfonic acid
2.0 mL of glacial acetic acid
Dilute with water to 50 mL of solution
Triethylamine solution:
10.0 mL of triethylamine
Dilute with water to 100.0 mL of solution
Final composition:
Water – acetonitrile – methanesulfonic acid solution – triethylamine solution
(80:16:2:2 v/v) adjusted to pH 2.6
4.2.4.2 Preparation and Assay of Quinine RS Solution for Calibration Curve
50.6mg of Quinine reference standard was weighed into a 50mL volumetric flask to give a
resultant solution of concentration 1.012mg/mL. Concentrations comprising 0.3542mg/mL,
University of Ghana http://ugspace.ug.edu.gh

126
0.4048mg/mL, 0.4554mg/mL, 0.5060mg/mL, 0.5566mg/mL, 0.6072mg/mL and 0.6578mg/mL
were prepared by diluting pipetted volumes of 3.5mL, 4.0mL, 4.5mL, 5.0mL, 5.5mL, 6.0mL and
6.5mL respectively, from a stock solution of the quinine reference material into a 10mL
volumetric flask. Area under the curve (AUC) for each concentration was determined with six
replicates each and an average AUC derived from them. The data was used to plot a graph of
average AUC against concentration(C) using Microsoft Excel and the slope of the graph,
intercept, correlation coefficient(r2) as well as equation of the straight line, AUC = mC + b were
deduced and calculated from it. Area under the curve is the average area under chromatographic
peak, m = slope of the straight line and b = AUC intercept (Table 27 and Figure 32).
4.2.4.3 Preparation and Assay of Solutions of Quinine Containing Drug Samples
4.2.4.3.1 Quinine Suspensions / Mixtures /Injections
A certain amount of the quinine suspension was sonicated for about 15 minutes and a quantity
equivalent to 5mg was pipetted into a 10 mL volumetric flask. 8 mL of methanol was then added
to the content of the flask and made up to the mark with the mobile phase. Where necessary, the
solution was also filtered.
For the injections, a 10mL solution was prepared in a volumetric flask after 5 ampoules of
quinine injections were mixed together and 20 µL aliquot was measured from the stock quinine
solution using a microlitre syringe. The prepared solution was diluted with 8mL of methanol and
mobile phase was added to the 10mL mark.
University of Ghana http://ugspace.ug.edu.gh
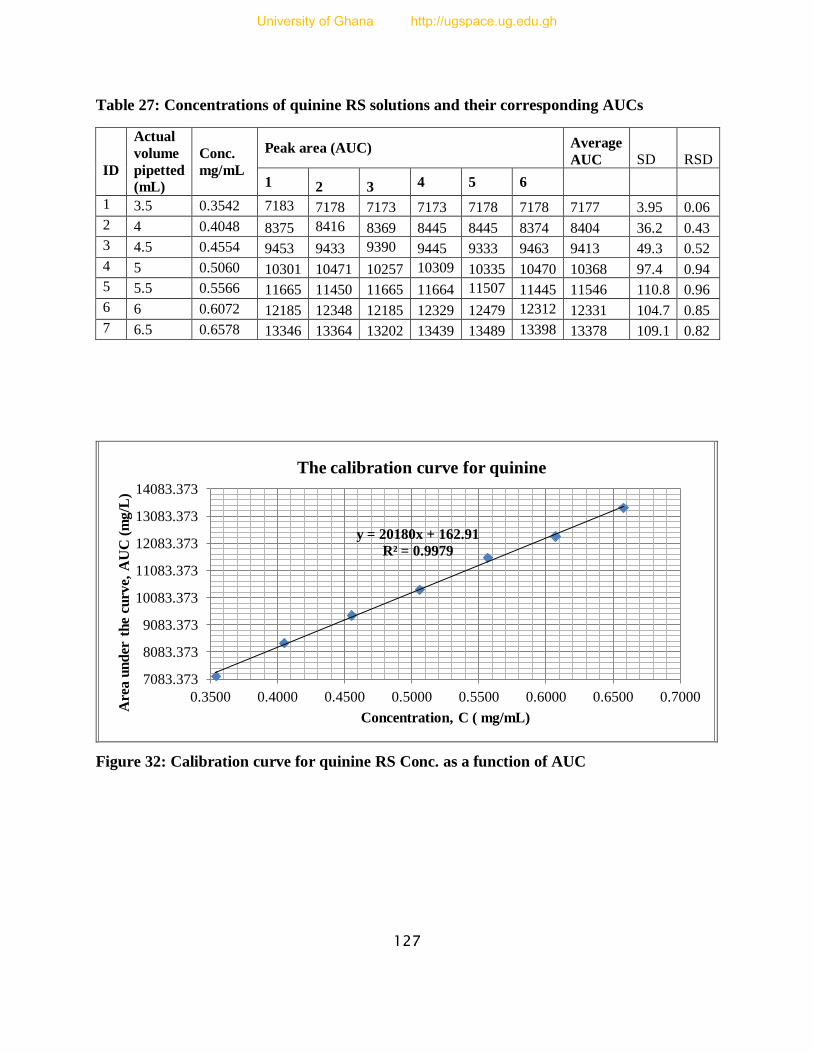
127
Table 27: Concentrations of quinine RS solutions and their corresponding AUCs
ID
Actual
volume
pipetted
(mL)
Conc.
mg/mL
Peak area (AUC) Average
AUC SD RSD
1 2 3 4 5 6
1 3.5 0.3542 7183 7178 7173 7173 7178 7178 7177 3.95 0.06
2 4 0.4048 8375 8416 8369 8445 8445 8374 8404 36.2 0.43
3 4.5 0.4554 9453 9433 9390 9445 9333 9463 9413 49.3 0.52
4 5 0.5060 10301 10471 10257 10309 10335 10470 10368 97.4 0.94
5 5.5 0.5566 11665 11450 11665 11664 11507 11445 11546 110.8 0.96
6 6 0.6072 12185 12348 12185 12329 12479 12312 12331 104.7 0.85
7 6.5 0.6578 13346 13364 13202 13439 13489 13398 13378 109.1 0.82
Figure 32: Calibration curve for quinine RS Conc. as a function of AUC
y = 20180x + 162.91
R² = 0.9979
7083.373
8083.373
9083.373
10083.373
11083.373
12083.373
13083.373
14083.373
0.3500 0.4000 0.4500 0.5000 0.5500 0.6000 0.6500 0.7000
Are
a u
nd
er t
he
curv
e, A
UC
(m
g/L
)
Concentration, C ( mg/mL)
The calibration curve for quinine
University of Ghana http://ugspace.ug.edu.gh
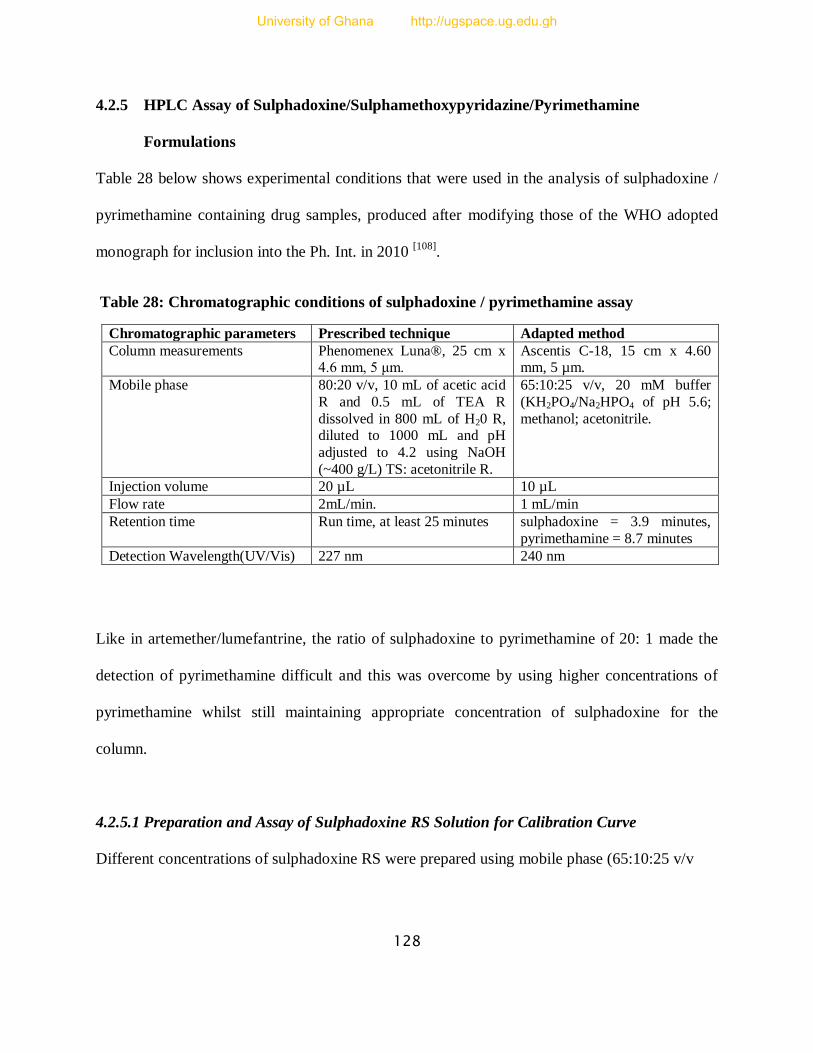
128
4.2.5 HPLC Assay of Sulphadoxine/Sulphamethoxypyridazine/Pyrimethamine
Formulations
Table 28 below shows experimental conditions that were used in the analysis of sulphadoxine /
pyrimethamine containing drug samples, produced after modifying those of the WHO adopted
monograph for inclusion into the Ph. Int. in 2010 [108]
.
Table 28: Chromatographic conditions of sulphadoxine / pyrimethamine assay
Chromatographic parameters Prescribed technique Adapted method
Column measurements Phenomenex Luna®, 25 cm x 4.6 mm, 5 μm.
Ascentis C-18, 15 cm x 4.60 mm, 5 µm.
Mobile phase 80:20 v/v, 10 mL of acetic acid
R and 0.5 mL of TEA R
dissolved in 800 mL of H20 R, diluted to 1000 mL and pH
adjusted to 4.2 using NaOH
(~400 g/L) TS: acetonitrile R.
65:10:25 v/v, 20 mM buffer
(KH2PO4/Na2HPO4 of pH 5.6;
methanol; acetonitrile.
Injection volume 20 µL 10 µL
Flow rate 2mL/min. 1 mL/min
Retention time Run time, at least 25 minutes sulphadoxine = 3.9 minutes,
pyrimethamine = 8.7 minutes
Detection Wavelength(UV/Vis) 227 nm 240 nm
Like in artemether/lumefantrine, the ratio of sulphadoxine to pyrimethamine of 20: 1 made the
detection of pyrimethamine difficult and this was overcome by using higher concentrations of
pyrimethamine whilst still maintaining appropriate concentration of sulphadoxine for the
column.
4.2.5.1 Preparation and Assay of Sulphadoxine RS Solution for Calibration Curve
Different concentrations of sulphadoxine RS were prepared using mobile phase (65:10:25 v/v
University of Ghana http://ugspace.ug.edu.gh
129
buffer: methanol: acetonitrile) as shown in Table 29 and Figure 33 below. Area under the curve
(AUC) for each concentration was determined with six replicates each and an average AUC
derived from them. The data was used to plot a graph of average AUC against concentration (C)
using Microsoft Excel and the slope of the graph, intercept, correlation coefficient (r2) as well as
equation of the straight line, AUC = mC + b were deduced and calculated from it. The area under
the curve (AUC) is the average area under a chromatographic peak, m = slope of the straight line
and b = AUC intercept (Table 29 and Figure 33).
4.2.5.2 Preparation and Assay of Pyrimethamine RS Solution for Calibration Curve
Similarly, different concentrations of pyrimethamine RS were prepared using mobile phase
(65:10:25 v/v buffer: methanol: acetonitrile) as shown in the Table 30 and Figure 33 below. Area
under the curve (AUC) for each concentration was determined with six replicates each and an
average AUC derived from them. The data was used to plot a graph of average AUC against
concentration (C) using Microsoft Excel and the slope of the graph, intercept, correlation
coefficient (r2) as well as equation of the straight line, AUC = mC + b were deduced and
calculated from it. The area under the curve (AUC) is the average area under a chromatographic
peak, m = slope of the straight line and b = AUC intercept (Table 30 and Figure 34).
4.2.5.3 Preparation and Assay of Solution of Sulphadoxine/Sulphamethoxypyridazine/
Pyrimethamine Containing Tablets
100mg of sulphadoxine/sulphamethoxypyridazine and 5mg of pyrimethamine equivalents of the
dosage form were weighed simultaneously into a clean dry beaker and the APIs extracted three
University of Ghana http://ugspace.ug.edu.gh
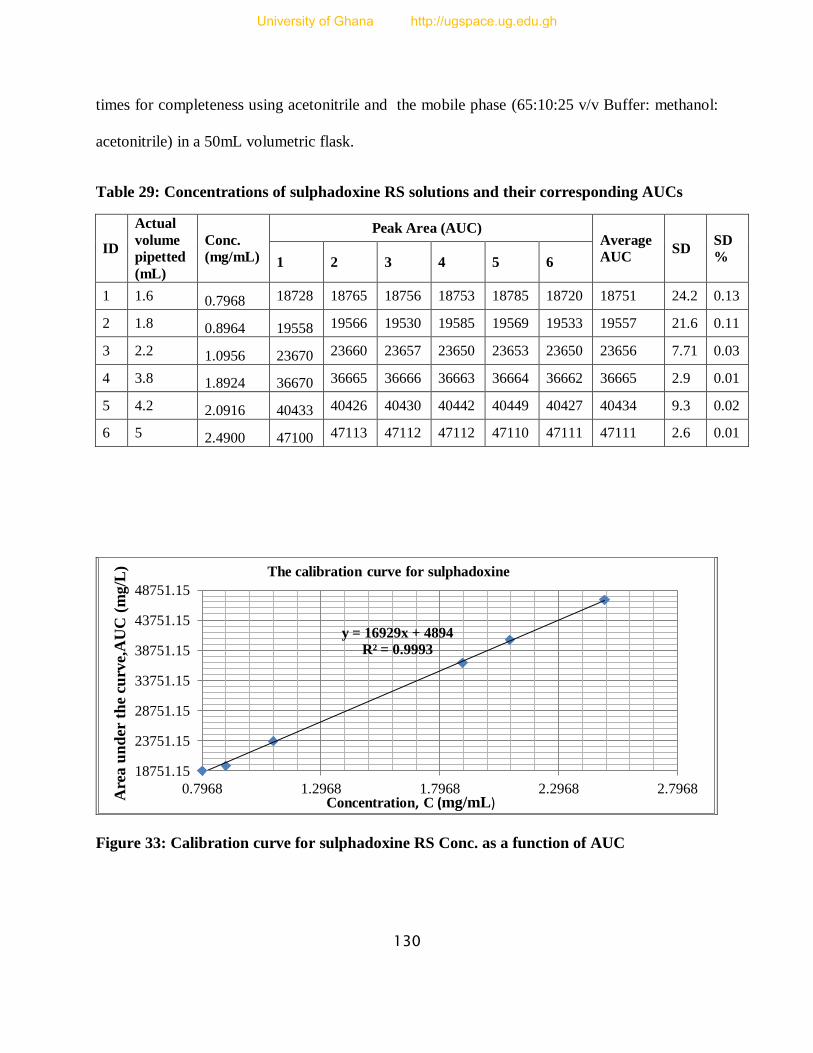
130
times for completeness using acetonitrile and the mobile phase (65:10:25 v/v Buffer: methanol:
acetonitrile) in a 50mL volumetric flask.
Table 29: Concentrations of sulphadoxine RS solutions and their corresponding AUCs
ID
Actual
volume
pipetted
(mL)
Conc.
(mg/mL)
Peak Area (AUC) Average
AUC SD
SD
% 1 2 3 4 5 6
1 1.6 0.7968 18728 18765 18756 18753 18785 18720 18751 24.2 0.13
2 1.8 0.8964 19558 19566 19530 19585 19569 19533 19557 21.6 0.11
3 2.2 1.0956 23670 23660 23657 23650 23653 23650 23656 7.71 0.03
4 3.8 1.8924 36670 36665 36666 36663 36664 36662 36665 2.9 0.01
5 4.2 2.0916 40433 40426 40430 40442 40449 40427 40434 9.3 0.02
6 5 2.4900 47100 47113 47112 47112 47110 47111 47111 2.6 0.01
Figure 33: Calibration curve for sulphadoxine RS Conc. as a function of AUC
y = 16929x + 4894
R² = 0.9993
18751.15
23751.15
28751.15
33751.15
38751.15
43751.15
48751.15
0.7968 1.2968 1.7968 2.2968 2.7968
The calibration curve for sulphadoxine
Are
a u
nd
er t
he
curv
e,A
UC
(m
g/L
)
Concentration, C (mg/mL)
University of Ghana http://ugspace.ug.edu.gh
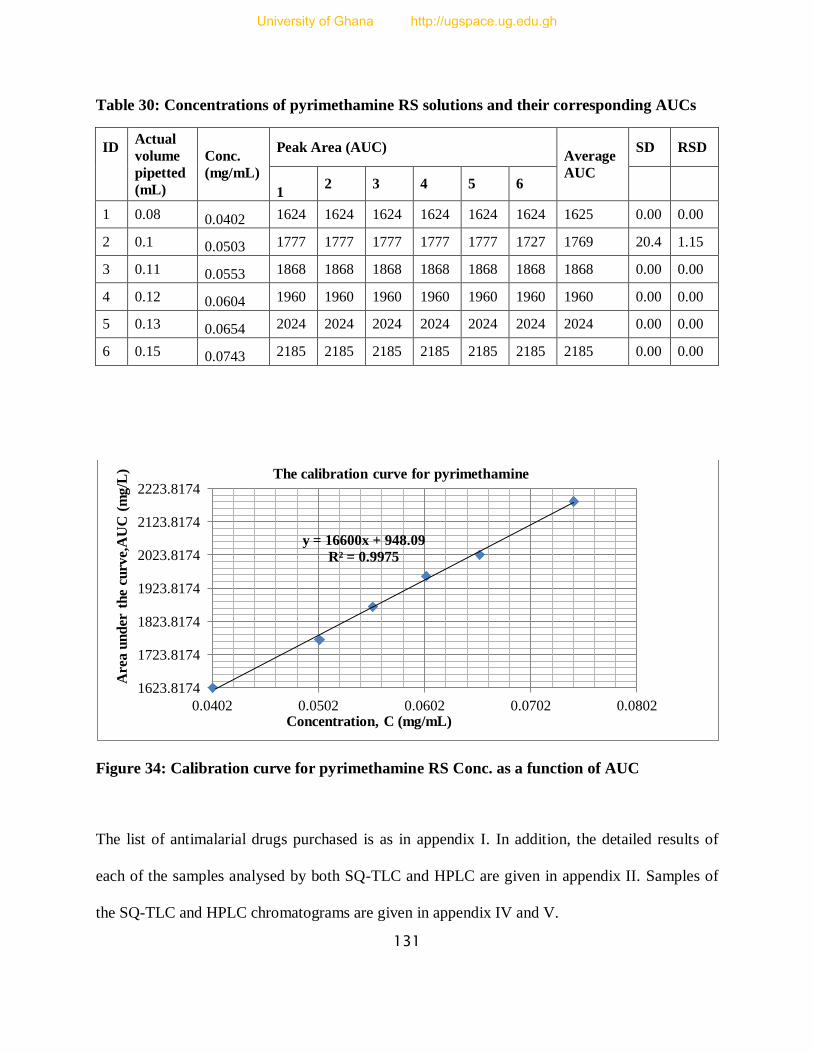
131
Table 30: Concentrations of pyrimethamine RS solutions and their corresponding AUCs
ID Actual
volume
pipetted
(mL)
Conc.
(mg/mL)
Peak Area (AUC) Average
AUC
SD RSD
1 2 3 4 5 6
1 0.08 0.0402 1624 1624 1624 1624 1624 1624 1625 0.00 0.00
2 0.1 0.0503 1777 1777 1777 1777 1777 1727 1769 20.4 1.15
3 0.11 0.0553 1868 1868 1868 1868 1868 1868 1868 0.00 0.00
4 0.12 0.0604 1960 1960 1960 1960 1960 1960 1960 0.00 0.00
5 0.13 0.0654 2024 2024 2024 2024 2024 2024 2024 0.00 0.00
6 0.15 0.0743 2185 2185 2185 2185 2185 2185 2185 0.00 0.00
Figure 34: Calibration curve for pyrimethamine RS Conc. as a function of AUC
The list of antimalarial drugs purchased is as in appendix I. In addition, the detailed results of
each of the samples analysed by both SQ-TLC and HPLC are given in appendix II. Samples of
the SQ-TLC and HPLC chromatograms are given in appendix IV and V.
y = 16600x + 948.09
R² = 0.9975
1623.8174
1723.8174
1823.8174
1923.8174
2023.8174
2123.8174
2223.8174
0.0402 0.0502 0.0602 0.0702 0.0802
The calibration curve for pyrimethamine
Concentration, C (mg/mL)
Are
a u
nd
er t
he
curv
e,A
UC
(m
g/L
)
University of Ghana http://ugspace.ug.edu.gh

132
5 REFERENCES
1. Meshnick, S.R., & Dobson, M.J. (2001). The History of Antimalarial Drugs. Springer.
Retrieved from www.springer.com/cda/content/.../cda.../9780896036703-c2.pdf?...0.
2. Kakkiyala, B.S. (2011, April 10). The Malaria Parasites. Malaria site; All about malaria.
Retrieved from http://www.malariasite.com/malaria/MalarialParasite.htm.
3. Müller, I.B., & Hyde, J.E. (2010). Antimalarial Drugs: Modes of Action and
Mechanisms of Parasite Resistance. Future Microbiology, 5(12), 1857-1873.
DOI:10.2217/fmb.10.136.
4. Mandal, A. (2013). Malaria-What is malaria. News Medical. Retrieved from
http://www.news-medical.net/ .
5. Centers for Disease Control and Prevention (CDC) (2012, November 9). Health
information for travellers to Malawi. Centers for Disease Control and Prevention.
Retrieved from http://www.cdc.gov/malaria/travelers/drugs.html.
6. World Health Organization, WHO. World Malaria Report 2011. ISBN 978 92 4 156440
3 (NLM classification: WC 765). Geneva, Switzerland.
7. Ashley, E.A., & White, N.J. (2005). Artemisinin-based combinations. Curr Opin Infect
Dis., 18, 531-536. Retrieved from PubMed: http://www.ncbi.nlm.nih.gov/pubmed/16258328.
8. Dondorp, A.M., Yeung, S., White, L., Nguon, C., Day, N.P.J., Socheat, D., & Seidlein,
L.V. (2010). Artemisinin resistance: current status and scenarios for containment. Nature
Reviews Microbiology, 8, 272-280. DOI:10.1038/nrmicro2331.
9. World Health Organisation, WHO. (2011). Global Plan for Artemisinin Resistance
Containment (GPARC). WHO/DUP. Retrieved from
http://www.who.int/malaria/publications/atoz/artemisinin_resistance_containment_2011.pdf.
University of Ghana http://ugspace.ug.edu.gh
133
10. Stevenson, K. (2012, 8 May). Malawi recognizes World Malaria Day. IYIP Rights
Media Internships, Retrieved from http://www.jhr.ca/blog/2012/05/malawi-recognizes-
world-malaria-day/.
11. Our Reporter (2010, January 19). Drugs Said to Endanger Malaria Patients Lives. Malawi
Digest. Retrieved from http://malawidigest.blogspot.com/2010/01/some-patients-lives-put-in-
danger.html.
12. Dzinjalamala, F. (2005). Epidemiology of Malaria in Malawi. [email protected].
Retrieved from www.medcol.com/commhealth.
13. National Malaria Control Programme, NMCP (2011). Malaria strategic plan 2011-2015;
Towards universal access. Government of Malawi, Ministry of Health, NMCP,
Community Health Sciences Unit, Private Bag 65, Lilongwe, Malawi.
14. Ministry of Health, MoH (2011). Malawi Health Sector Strategic Plan 2011-2016;
Moving towards equity and quality. Government of Malawi. Lilongwe, Malawi.
15. Kabuluzi, S., Ali, D, Chiphwanya, J., Nsona, H., Zoya, J., et al. (2004, August). Malawi
Roll Back Malaria Consultative Mission: Essential Actions to Support the Attainment of
the Abuja Targets 19-23 April 2004. MALAWI RBM Country Consultative Mission
Final Report. Retrieved from http://www.pdfio.com/k-1543741.html#.
16. World Health Organisation, WHO (2011). World Malaria Report (WMR); WHO WMR
2011. Malawi profile. Geneva. Retrieved from
www.who.int/malaria/publications/...profiles/profile_mwi_en.pdf.
17. Bangun, T.W.D. & Blok, E.F. (2009). Pharmacology aspect of antimalaria. Retrieved
from ocw.usu.ac.id/.../elo173_slide_pharmacology_aspect_of_antimalaria.pdf.
University of Ghana http://ugspace.ug.edu.gh
134
18. Butler, A.R., Khan, S., & Ferguson, E. (2010). A brief history of malaria chemotherapy. J
R Coll Physicians Edinb, 40, 172–177. DOI: 10.4997/JRCPE.2010.216.
19. Wiser, M.F. (2011, November 15). Malaria. Tulane University (©2000). Retrieved from
http://www.tulane.edu/~wiser/protozoology/notes/malaria.html.
20. European Vaccine Initiative, EVI-UniversitätsKlinikum Heidelberg 2013. Malaria.
Retrieved from http://www.euvaccine.eu/vaccines-diseases/diseases-poverty/malaria.
21. U.S. Department of Health and Human Services; National Institutes of Health, NIH
(2007: 2). Understanding malaria: fighting an ancient scourge. NIAID Science Education.
Retrieved from http://www.niaid.nih.gov/topics/malaria/documents/malaria.pdf.
22. Schlitzer, M. (2007). Malaria Chemotherapeutics Part I: History of Antimalarial Drug
Development, Currently Used Therapeutics, and Drugs in Clinical Development.
ChemMedChem, 2, 944 – 986. DOI: 10.1002/cmdc.200600240.
23. Ockenhouse, C.F., Magill, A., Smith, D., & Milhous, W. (2005). History of U.S. military
contributions to the study of Malaria. Military Medicine, 4 (12), 170. Retrieved from
http://afids.org/publications/PDF/History/AFIDS%20Milit%20Med%20Suppl%203-Malaria.pdf.
24. Awofeso, N. (2011). Project 523: Transformation of artemisinin from traditional Chinese
medicine to mainstream antimalarial chemotherapy. Spatula DD, 2(1), 113-118.
DOI: 10.5455/spatula.20110514053140.
25. Cui, L., & Su, X.Z. (2009). Discovery, mechanisms of action and combination therapy of
artemisinin. Expert Rev Anti Infect Ther., 7(8), 999–1013. DOI: 10.1586/eri.09.68.
26. Enserink, M. (2010). Malaria’s drug miracle in danger. Science, 328 (5980), 844-846
DOI: 10.1126/science.328.5980.844.
University of Ghana http://ugspace.ug.edu.gh
135
27. Kakkiyala, B.S. (2006, April 14). Anti Malarial Drugs. Malaria site; All about malaria.
Retrieved from http://www.malariasite.com/malaria/anti_malarial_drugs.htm.
28. World Health Organization, WHO (2010). Guidelines for the Treatment of Malaria
(GTM), 2nd
Edition. ISBN 978-92-4-154792-5. Geneva. Retrived from
http://whqlibdoc.who.int/publications/2010/9789241547925_eng.pdf.
29. Robert, A., Benoit-Vical, F., Dechy-Cabaret, O., & Meunier, B. (2001). From classical
antimalarial drugs to new compounds based on the mechanism of action of artemisinin.
Pure Appl. Chem., 73 (7), 1173–1188. Retrieved from
http://195.37.231.82/publications/pac/pdf/2001/pdf/7307x1173.pdf.
30. CDC (1983, August 26). Update: Chloroquine-Resistant Plasmodium falciparum –
Africa. MMWR Weekly, 32(33), 437-438. Retrieved from
http://www.cdc.gov/mmwr/preview/mmwrhtml/00000128.htm.
31. Farooq, U. & Mahajan, R.C. (2004). Drug resistance in malaria. J Vect Borne Dis., 41, pp
45–53. Retrieved from http://www.mrcindia.org/journal/issues/413045.pdf.
32. Wellems, T.E., & Plowe, C.V. (2001). Chloroquine-Resistant Malaria. The Journal of
Infectious Diseases, 184,770–776. Retrieved from
http://jid.oxfordjournals.org/content/184/6/770.full.pdf.
33. Robert, A., Meunier, B. (1998). Is alkylation the main mechanism of action of the
antimalarial drug Artemisinin? Chemical Society Reviews. 27, 273-279.
DOI: 10.1039/A827273Z.
34. Posner, G.H., McGarvey, D.J., Oh, C.H., Kumar, N., Meshnick, S.R. &
Asawamahasadka, W. (1995). Structure-activity relationships of lactone ring opened
University of Ghana http://ugspace.ug.edu.gh
136
analogs of the antimalarial 1, 2, 4-trioxane Artemisinin. J.Med.Chem., 38(4), 607-612.
DOI: 10.1021/jm00004a006.
35. Taglialatela-Scafati, O,. Fattorusso, E., Romano, A., Scala, F., Barone, V., Cimino,
P., Stendardo, E., Catalanotti, B., Persico, M., & Fattorusso, C. (2009). Insight into the
mechanism of action of plakortins, simple 1,2-dioxaneantimalarials. Org. Biomol.
Chem., 8, 846-856. DOI: 10.1039/B918600J.
36. Hong, Y.L., Yang, Y.Z., & Meshnick, S.R. (1994). The interaction of Artemisinin with
malarial hemozoin. Mol.Biochem. Parasitol. 63 (1), 121-128. DOI:
http://dx.doi.org/10.1016/0166-6851 (94)90014-0.
37. Krishnaa, S., Uhlemanna, A.C., & Haynes, R.K. (2004). Artemisinins: mechanisms of
action and potential for resistance. Drug Resistance Updates, 7, 233–244. Retrieved from
Science@Direct, www.sciencedirect.com.
38. Yang, Y.Z., Little, B. & Meshnick, S.R. (1994). Alkylation of proteins by Artemisinin.
Effects of Haeme, pH and drug structure. Biochem. Pharmacol., 48 (3), 569-573. DOI:
http://dx.doi.org/10.1016/0006-2952(94)90287-9.
39. Slater, A.F.G., Swiggard, W.J., Orton, B.R., Flitter, W.D., Goldberg, D.E., Cerami, A. &
Henderson, B.G. (1991). An iron-carboxylate bond links the haeme units of malaria
pigment Proc Natl.Acad.Sci., 88, 325-329. Retrieved from
http://www.pnas.org/content/88/2/325.full.pdf.
40. Bohle, D.S., Dinnebier, R.E., Madsen, S.K., & Stephens, P.W. (1997). Characterization
of the products of the haeme detoxification pathway in malarial late trophozoites by x-ray
diffraction. J biol. Chem., 272,713-716. DOI:10.1074/jbc.272.2.713.
University of Ghana http://ugspace.ug.edu.gh
137
41. Asawamahasakda, W., Ittarat, I., Pu, Y.M., Ziffer, H. & Meshnick, S.R. (1994). Reaction
of antimalarial endoperoxides with specific parasite proteins. Antimicrob. Agents
Chemother., 38 (8), 1854-1858. Retrieved from
http://www.ncbi.nlm.nih.gov/pmc/articles/PMC284649/pdf/aac00372-0160.pdf.
42. Megh, R.B. (2009). Molecular-Mechanisms of Drug Resistance. Articles base. Retrieved
from http://www.articlesbase.com/science-articles/molecular-mechanism-of-drug-
resistance-1325173.html.
43. Bloland, P. B. (2001). Drug resistance in malaria. WHO/CDS/CSR/DRS/2001.4.
44. World Health Organisation, WHO; Malaria Control Department, MCD. (2003, July). An
Update on: Quality Assurance and Procurement through WHO for Improving Access to
Artemisinin-Based Combination Treatments (ACTs) for Malaria. Geneva. Retrieved from
http://www1.paho.org/English/AD/DPC/CD/mal-acts-update-7-03.pdf.
45. Bate, R., Coticelli, P., Tren, R., & Attaran, A. (2008). Antimalarial drug quality in the
most severely Malarious parts of Africa – A six country study. PLoS ONE, 3(5), e2132.
DOI:10.1371/journal.pone.0002132.
46. World Health Organisation (WHO), International Medical Products Anti
Counterfeiting Task Force (IMPACT) Tool Kit-Be Aware (2011). Helping to fight
counterfeit medicines, keeping patients safer. Retrieved from
http://www.whpa.org/Toolkit_BeAware.pdf.
47. Nordqvist, C. (2012). Fake antimalarial medications undermine Africa malaria drive.
Medical News Today (MNT). Retrieved from http://www.medicalnewstoday.com/articles
University of Ghana http://ugspace.ug.edu.gh
138
48. Kaur, H., Green, M.D., Hostetler, D.M., Fernández, F.M., & Newton, P.N. (2010).
Antimalarial drug quality: methods to detect suspect drugs. Future Medicine Ltd., ISSN
1475-0708, 49–57. DOI: http://dx.doi.org/10.2217/thy.09.84.
49. Amin, A. A. & Kokwaro, G. O. (2007). Antimalarial drug quality in Africa. Journal of
Clinical Pharmacy and Therapeutics,32,429440.DOI: 10.1111/j.13652710.2007.00847.x.
50. Newton, P.N., McGready, R., Fernandez, F., Green, M.D., Sunjio, M., Bruneton, C.,
Phanouvong, S., Millet, P., Whitty, C.J.M., Talisuna, A.O., Proux, S., Christophel, E.M.,
Malenga, G., Singhasivanon, P., Bojang, K., Kaur, H., Palmer, K., Day, N.P.J.,
Greenwood, B.M., Nosten, F., & White, N.J. (2006). Manslaughter by fake artesunate in
Asia—Will Africa be next? PLoS Med, 3(6), e197. DOI:10.1371/journal.pmed.0030197.
51. Wechsler, J. (2003). “Counterfeiting, compliance and controls,” in Washington Report,
Pharm. Technol., 27, 28–36. Retrieved from
http://www.pharmtech.com/pharmtech/data/articlestandard/pharmtech/382003/70112/article.pdf.
52. Hall, K.A., Newton, P.N., Green, M.D., De Veij, M., Vandenabeele, P., Pizzanelli, D.,
Mayxay, M., Dondorp, A., & Fernandez, F.M. (2006). Characterization of counterfeit
artesunate antimalarial tablets from south-east Asia. Am J Trop Med Hyg., 75(5), 804-
811. Retrieved from http://www.ajtmh.org/content/75/5/804.full.pdf+html.
53. Nzila, A.M., Nduati, E., Mberu, E.K., Sibley, C.H., Monks, S.A., Winstanley, P.A.,
Watkins, W.M. (2000). Molecular evidence of greater selective pressure for drug
resistance exerted by the long-acting antifolate pyrimethamine/sulphadoxine compared
with the short-acting chlorproguanil/dapsone on Kenyan Plasmodium falciparum.
University of Ghana http://ugspace.ug.edu.gh

139
Journal of Infectious Diseases, 181 (6), 2023–2028. Retrieved from
http://jid.oxfordjournals.org/content/181/6/2023.full.pdf.
54. Watkins, W.M., & Mosobo, M. (1993). Treatment of Plasmodium falciparum malaria
with pyrimethamine sulphadoxine: selective pressure for resistance is a function of long
elimination half-life. Royal Society of Tropical Medicine and Hygiene, 87 (1), 75–78.
DOI: 10.1016/0035-9203(93)90431-O.
55. WHO QAMSA (2011). Survey of the quality of selected antimalarial medicines
circulating in six countries of sub-Saharan Africa. Geneva: World Health Organization
Quality Assurance and Safety; Essential Medicines and pharmaceutical Policies.
WHO/EMP/QSM/2011.1. Retrieved from
http://www.who.int/medicines/publications/WHO_QAMSA_report.pdf.
56. International Medical Products Anti-Counterfeiting Taskforce, IMPACT (2011). THE
HANDBOOK Facts | Activities | Documents developed by the Assembly and the
Working Groups 2006-2010. Retrieved from
http://www.who.int/impact/handbook_impact.pdf.
57. Lucas, T.I., Bishara, R.H., & Seevers, R.H. (2004). A Stability Programme for the
Distribution of Drug Products. Pharmaceutical Technology. 68–73.
58. Newton, P.N., White, N.J., Rozendaal, J.A, & Green, M.D. (2002). Murder by fake
drugs. BMJ, 324, 800-801. DOI: http://dx.doi.org/10.1136/bmj.324.7341.800.
59. Dondorp, A.M., Newton, P.N., Mayxay, M., Van Damme, W., Smithuis, F.M., Yeung,
S., Petit, A., Lynam, A.J., Johnson, A., Hien, T.T., McGready, R., Farrar,
J.J., Looareesuwan, S., Day, N.P., Green, M.D., White, N.J. (2004). Fake antimalarials in
University of Ghana http://ugspace.ug.edu.gh
140
Southeast Asia are a major impediment to malaria control: Multinational Cross-sectional
Survey on the Prevalence of Fake antimalarials. Trop Med Int Health., 9 (12), 1241-
1246. DOI: 10.1111/j.1365-3156.2004.01342.x.
60. Abdo-Rabbo, A., Bassili, A., & Atta, H. (2005): The Quality of Antimalarials Available
in Yemen. Malaria J, 4, 28. DOI: 10.1186/1475-2875-4-28.
61. McNeil Jr., D.G. (2007, February 20). A growing epidemic of fake medicines in Asia-
International Herald Tribune. The New York Times; Health Science. Retrieved from
http://www.nytimes.com/2007/02/20/health/20iht-drugs.4656560.html?pagewanted=all&_r=0
62. Newton, P.N., Fernández, F.M., Plançon, A., Mildenhall, D.C., Green, M.D., et al.
(2008). A Collaborative Epidemiological Investigation into the Criminal Fake Artesunate
Trade in South East Asia. PLoS Med, 5(2), e32. DOI:10.1371/journal.pmed.0050032.
63. Nayyar, G.M.L., Breman, J.G., Newton, P.N., & Herrington, J. (2012).
Poor-quality antimalarial drugs in southeast Asia and sub-Saharan Africa. The Lancet
Infectious Diseases., 12 (6), 488 – 496. DOI:10.1016/S1473-3099(12)70064-6.
64. Anonymous (2001). Fake antimalarial drugs in Tanzania. Market letter (Article no.
011655604).
65. Kaur, H., Goodman, C., Thompson, E., Thompson, K-A., Masanja, I., et al. (2008). A
Nationwide Survey of the Quality of Antimalarials in Retail Outlets in Tanzania. PLoS
ONE 3(10): e3403. DOI:10.1371/journal.pone.0003403.
University of Ghana http://ugspace.ug.edu.gh

141
66. Basco, L.K. (2004). Molecular epidemiology of malaria in Cameroon. Quality of
Antimalarial drugs used for self-medication. Am J Trop Med Hyg., 70(3), 245-250.
Retrieved from http://www.ajtmh.org/content/70/3/245.long.
67. Harrison, J.J.E.K. (2009). Validation and Application of Quality Assurance Methods
Developed for Selected Antimalarial Drugs in Ghana. MPhil. Chemistry thesis,
University of Ghana-Legon.
68. Addae-Mensah, I., Osei-Safo, D., Harrison, J.J.E.K., Konadu, D.Y., Amegnona, A.,
Koudouvo, K., Mamadou, E. (2012). Pharmacovigilance of selected antimalarial drugs
distributed in Ghana and Togo. A report submitted to West Africa Health Organisation
(WAHO). Unpublished.
69. Atemnkeng, M.A., De Cock, K., & Plaizier-Vercammen, J. (2007a). Quality Control of
Active Ingredients in Artemisinin-Derivative Antimalarials within Kenya and DR Congo.
Trop Med Int Health, 12 (1), 68-74. DOI: 10.1111/j.1365-3156.2006.01769.x.
70. Atemnkeng, M.A., Chimanuka, B., Plaizier-Vercammen, J. (2007b). Quality evaluation
of chloroquine, quinine, sulphadoxine-pyrimethamine and proguanil formulations sold on
the market in East Congo DR. Journal of Clinical Pharmacy and Therapeutics, 32 (2),
123-132. DOI: 10.1111/j.1365-2710.2007.00797.x.ISSN: 0269-4727.
71. Taylor, R.B., Shakoor, O., Behrens, R.H., Everard, M., Low, A.S., Wangboonsku, J.,
Reid, R.G., Kolawole, J.A. (2001). Pharmacopoeial quality of drugs supplied by Nigerian
pharmacies. Lancet, 357 (9272), 1933-1936. DOI: http://dx.doi.org/10.1016/S0140-
6736(00)05065-0.
University of Ghana http://ugspace.ug.edu.gh

142
72. World Health Organization, WHO Media centre (MC) (2003). World Health
Organization steps up action against substandard and counterfeit medicines. Retrieved
from http://www.who.int/mediacentre/news/releases/2003/pr85/en/.
73. Maponga, C., & Ondari, C. (2003). The quality of antimalarials: a study in selected
African countries. World Health Organization (WHO) Department of Essential Drugs
and Medicines. WHO/EDM/PAR/2003.4. Retrieved from
http://apps.who.int/medicinedocs/pdf/s4901e/s4901e.pdf.
74. Bogere, H., & Nafula, J. (2007, May 10). Fake Quinine on market. All Africa ; The
Monitor. Retrieved from http://allafrica.com/stories/200705090881.html.
75. Ofori-Kwakye, K., Asantewaa, Y., & Gaye, O. (2008). Quality of artesunate tablets sold
in pharmacies in Kumasi, Ghana. Trop J Pharm Res, 7, 1179-1184. Retrieved from
http://www.tjpr.org.
76. Kingsley, E.H. (2009, July 10). Beware of fake co-artem malaria tabs on the market.
Modern Ghana ; Kumasi-Newtimesonline.com. Retrieved from
http://www.modernghana.com/news/226612/1/beware-of-fake-co-artem-malaria-tabs-on-the-
market.html.
77. Onwujekwe, O., Kaur, H., Dike, N., Shu, E., Uzochukwu, B., Hanson, K., Okoye, V., &
Okonkwo, P. (2009). Quality of Anti-malarial Drugs Provided by Public and Private
Healthcare Providers in South-east Nigeria. Malaria J, 8, 22. DOI:10.1186/1475-2875-8-
22
78. Shekighenda, L. (2009, April 1). TFDA halts sale, use of metakelfin. IPP Media.
Retrieved from http://www.ippmedia.com/.
University of Ghana http://ugspace.ug.edu.gh
143
79. IRIN. (2009, January 15). Tanzania: Counterfeit drugs put lives at risk. IRIN Africa.
Retrieved from http://www.irinnews.org/report/82374/tanzania-counterfeit-drugs-put-
lives-at-risk.
80. Thoithi, G.N., Abuga, K.O., Nguyo, J.M., King‘ondu, O.K., Mukindia, G.G., Mugo,
H.N., Ngugi, J.K., & Kibwage, I.O. (2008). Drug Quality Control in Kenya: Observations
in the Drug Analysis and Research Unit during the Period 2001-2005. East Cent Afr J.
Pharm Sci, 11, 74-81. Retrieved from
www.uonbi.ac.ke/projects/ecajournal/index.php?option=com.
81. Management Sciences for Health, MSH; Center for Pharmaceutical Management. (2007).
Assessing the Quality of Antimalarial Medicines in Malawi. Strengthening
Pharmaceutical Systems. Retrieved from
http://spssms.msh.org/products/Quality%20of%20anti-malaria%20medicine--FINAL.pdf.
82. Kachala, R. (2011, January 20). Report on Control of Malaria in Malawi. Kachala: Just
another WordPress.com site. Retrieved from
http://kachala.wordpress.com/2011/01/20/report-on-control-of-malaria-in-malawi/.
83. Staedke, S. (2009). Drug Safety and Quality. London School of Hygiene & Tropical
Medicine; Uganda Malaria Surveillance Project. ACT Consortium. Retrieved from
http://www.actconsortium.org/data/files/actc_safety_and_quality__overview.pdf.
84. Strengthening Pharmaceutical Systems (SPS) Program. 2011. Safety of Medicines in Sub-
Saharan Africa: Assessment of Pharmacovigilance Systems and their Performance.
Submitted to the US Agency for International Development by the Strengthening
Pharmaceutical Systems (SPS) Program. Arlington, VA: Management Sciences for
Health.
University of Ghana http://ugspace.ug.edu.gh

144
85. Chirombo, R. (2012). Drug certification and Quality Control in Malawi. Zachimalawi.
Retrieved from http://zachimalawi.blogspot.com/2012/03/drug-certification-and-quality-
control.html.
86. Population Service International (PSI). (2007). ACT Procurement and Distribution
Quality Assurance Guidelines for PSI Programmes. A Draft Operational Guideline for
PSI Programmes. (Version 1.06). PSI Malaria Control. Retrieved from
http://www.docstoc.com/docs/120947037/recommendations-for-quality-assurance-protocal.
87. Tipke, M., Diallo, S., Coulibaly, B., Störzinger, D., Hoppe-Tichy, T., Sie, A., & Müller,
O. (2008). Substandard antimalarial drugs in Burkina Faso. Malaria Journal, 7(95). DOI:
10.1186/1475-2875-7-95.
88. Green, M.D., Nettey, H., Rojas, O.V., Pamanivong, C., Khounsaknalath, L., Ortiz, M.G.,
Newton, P.N., Fernández, F.M., Vongsack, L., Manolin, O. (2007). Use of Refractometry
and Colorimetry as Field Methods to Rapidly Assess Antimalarial Drug Quality. J.
Pharm. Biomed. Anal., 43, 105-110. DOI:10.1016/j.jpba.2007.01.028.
89. Jaehnke, R. (2004). Counterfeit Medicines and the GPHF Minilab for Rapid Drug
Quality Verification. Pharm. Ind., 66(10), 1187-1193.
90. Ioset, J.R., & Kaur, H. (2009). Simple Field Assays to Check Quality of Current
Artemisinin-Based Antimalarial Combination Formulations. PloS ONE, 4(9), e7270.
DOI:10.1371/journal.pone.0007270.
91. Addae-Mensah, I., & Osei-Safo, D. (2006). Development and Validation of Thin Layer
Chromatographic Screening Methods for the Identification of Dosage Forms of Selected
Antimalarial Drugs - Part Two: Selection of Two Solvent Systems for Identification and Semi-
Quantitative Estimation of Artemisinin-Based Antimalarial Drugs. A report submitted to
University of Ghana http://ugspace.ug.edu.gh
145
Quality Assurance & Safety: Medicines (QSM), Department of Essential Drugs and Medicines
Policy (EDM), World Health Organization, Geneva 27.
92. Osei-Safo, D., Harrison, J.J.E.K., & Addae-Mensah, I. (2010). “Validation and
application of quality assurance methods developed for artemisinin-based antimalarial
drugs to assess the quality of a selection of such drugs distributed in Accra, Ghana”.
African Journal of Pharmaceutical Sciences and Pharmacy, 1(1), 1-25. Retrieved from
http://pdf.handbook2.com/Validation-and-Application-of-Quality-Assurance-Methods-
Developed-download-w4013.pdf.
93. World Health Organisation, WHO, BTD. (1998). Basic Tests for Drugs: Pharmaceutical
Substances, Medicinal Plant Materials and Dosage form. Retrieved from
http://books.google.com.gh/books.
94. World Health Organisation (WHO) Working Document QAS/06.159. (2006). New Basic
Tests for Antimalarials. Quality Assurance & Safety: Medicines (QSM), Department of
Essential Drugs and Medicines Policy (EDM), World Health Organisation, CH-1211
Geneva 27, Switzerland.
95. World Health Organisation, WHO. (1991). Basic tests for pharmaceutical dosage forms.
Geneva. Retrieved from http://archives.who.int/tbs/qual/h1794e.pdf.
96. World Health Organization, WHO. The International Pharmacopoeia (including First,
Second and Third supplements). 4th Edition, Version 2; Online (Ph. Int.). (2013). Geneva.
Retrieved from http://apps.who.int/phint/en/p/about/.
97. Sherma, J. (2007). Analysis of Counterfeit Drugs by Thin Layer Chromatography. Acta
Chromatographica, No.19, 5-20. Retrieved from
http://www.us.edu.pl/uniwersytet/jednostki/wydzialy/chemia/acta/ac19/zrodla/01_AC19.pdf.
University of Ghana http://ugspace.ug.edu.gh
146
98. Risha, P., Layloff, T., Msuya, Z., & Ndomondo-Sigonda, M. (2006). Proficiency Testing
as a Tool to Assess the Performance of Visual TLC Quantitation Estimates. Management
Sciences for Health (MSH): Strategies for Enhancing Access to Medicines (SEAM).
Retrieved from www.researchgate.net/.
99. Pharma Tips. (2013, January 19). UHPLC+ Focused: Ultra High Performance Liquid
Chromatograph. Pharma Tips. Retrieved from
http://pharmatips.doyouknow.in/Articles/Pharmaceutical-Equipment/UHPLC-Focused-
Ultra-High-Performance-Liquid-Chromatograph.aspx.
100. Settle, F.A. (1997). Handbook of Instrumental Techniques for Analytical
Chemistry. Prentice Hall PTR, Upper Saddle River, NJ 07458.
101. Koninklijke Philips Electronics N.V. ( 2008). High pressure liquid
chromatography. Mi Plaza. Retrieved from
http://www.innovationservices.philips.com/sites/default/files/materials-analysis-hplc.pdf.
102. Oona, M. (2009). An introduction to HPLC pharmaceutical analysis; Excerpt.
Mourne Training Services (MTS). Retrieved from
http://www.mournetrainingservices.co.uk/Preview_book_introduction_HPLC.pdf.
103. HPLC Basics. Fundamentals of liquid chromatography (HPLC). Courtesy of
Agilent Technologies Inc. Retrieved from
http://polymer.ustc.edu.cn/xwxx_20/xw/201109/P020110906263097048536.pdf.
104. Africa Fighting Malaria, AFM (2009, April 9). Antimalarial drugs-Challenges and
suggestions for the way forward. March of Washingtons. Washington DC. Retrieved
from http://fightingmalaria.org/pdfs/WMD09.pdf.
University of Ghana http://ugspace.ug.edu.gh
147
105. World Health Organization, WHO. The International Pharmacopoeia (Ph. Int.),
4th Edition, Version 2; CD-ROM. (2006). Geneva.
106. Ranher, S.S., Gandhi, S.V., Kadukar, S.S., & Ranjane, P.N. (2010). A validated
HPLC method for determination of artesunate in bulk and tablet formulation. Journal of
Analytical Chemistry, 65(5), 507-510. Retrieved from http://link.springer.com/static-
content/lookinside/510/art%253A10.1134%252FS1061934810050126/000.png.
107. Arun, A., & Smith, A.A. (2011). Simultaneous HPLC-UV method for the
estimation of artemether and lumefantrine in tablet dosage form. International Journal of
Pharmaceutical and Biomedical Research, 2(3), 201-205. ISSN No.: 0976-0350.
108. World Health Organization, WHO expert committee (2011). Sulphadoxine and
pyrimethamine tablets. Adopted text for addition to The International Pharmacopoeia.
Working document QAS/07.218/FINAL. Retrieved from
http://www.who.int/medicines/publications/pharmacopoeia/Sulfadox-Pyrimeth-tab-QAS07-218
109. The United States Pharmacopoeia USP NF 24. Monographs of quinine sulphate
and quinine sulphate tablets. United States Pharmacopoeia Convention: Rockville. p.
1458-1460.
110. Somanje, C. (2011, ). Malawi Orders Malaria Drugs off Shop Shelves. Eyes on
Malaria Online; An AMMREN magazine . 7th Edition . Retrieved from
http://trial.eyesonmalaria.org/content/malawi-orders-malaria-drugs-shelves-0.
111. Caudron, J.M., Ford, N., Henkens, M., Macé, C., Kiddle-Monroe, R., & Pinel, J.
(2008). Substandard medicines in resource-poor settings: a problem that can no longer be
ignored. Trop. Med. Int. Health, 13, 1062–1072. DOI: 10.1111/j.1365-156.2008.02106.x.
University of Ghana http://ugspace.ug.edu.gh

148
APPENDICES
APPENDIX I
LIST AND DETAILS OF ANTIMALARIAL DRUGS PURCHASED
Table 31: List of artemisinin-based and non-artemisinin based antimalarial drugs purchased from various zones in Malawi
No. Code Name of drug Dosage form Active ingredient Batch no. Manufacturer Man–Exp
Date
ZONE 1: SOUTH WEST
NON-ARTEMISININ-BASED DRUGS
1 *14P10 Malacure Tablet Sulphadoxine USP/ Pyrimethamine
USP
500mg/ 25mg
fixed dose
S-60 S Kant
India
07/2010-
06/2013
2 *16P10 Malacure Tablet Sulphadoxine USP/ Pyrimethamine
USP
500mg/ 25mg
fixed dose
S-60 S Kant
India
07/2010-
06/2013
3 *11P10 Malacure Tablet Sulphadoxine USP/ Pyrimethamine
USP 500mg/ 25mg
fixed dose
S-60 S Kant
India
07/2010-
06/2013
4 11P2 Sulphadar Tablet Sulphadoxine USP/ Pyrimethamine
USP
500mg/ 25mg
fixed dose
10011 Shellys
Tanzania
07/2010-
06/2014
* Unregistered samples
University of Ghana http://ugspace.ug.edu.gh
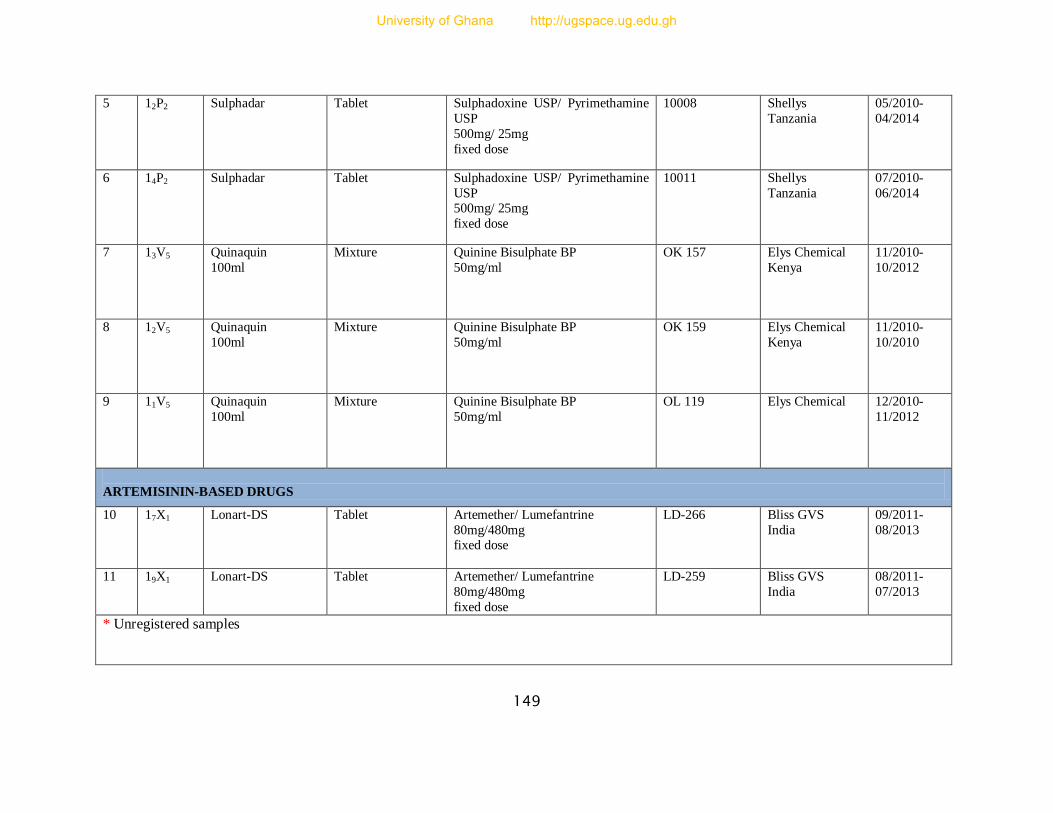
149
5 12P2 Sulphadar Tablet Sulphadoxine USP/ Pyrimethamine
USP
500mg/ 25mg
fixed dose
10008 Shellys
Tanzania
05/2010-
04/2014
6 14P2 Sulphadar Tablet Sulphadoxine USP/ Pyrimethamine
USP 500mg/ 25mg
fixed dose
10011 Shellys
Tanzania
07/2010-
06/2014
7 13V5 Quinaquin
100ml
Mixture Quinine Bisulphate BP
50mg/ml
OK 157 Elys Chemical
Kenya
11/2010-
10/2012
8 12V5 Quinaquin
100ml
Mixture Quinine Bisulphate BP
50mg/ml
OK 159 Elys Chemical
Kenya
11/2010-
10/2010
9 11V5 Quinaquin
100ml
Mixture Quinine Bisulphate BP
50mg/ml
OL 119 Elys Chemical 12/2010-
11/2012
ARTEMISININ-BASED DRUGS
10 17X1 Lonart-DS Tablet Artemether/ Lumefantrine
80mg/480mg fixed dose
LD-266 Bliss GVS
India
09/2011-
08/2013
11 19X1 Lonart-DS Tablet Artemether/ Lumefantrine
80mg/480mg
fixed dose
LD-259 Bliss GVS
India
08/2011-
07/2013
* Unregistered samples
University of Ghana http://ugspace.ug.edu.gh
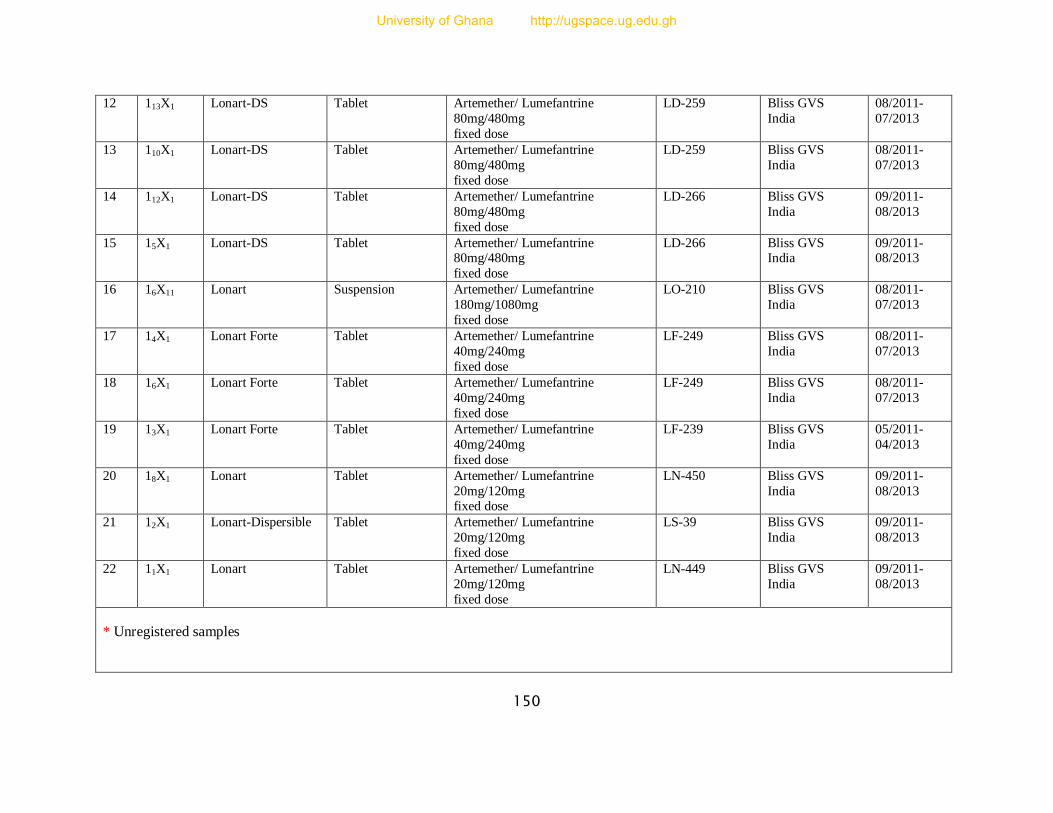
150
12 113X1 Lonart-DS Tablet Artemether/ Lumefantrine
80mg/480mg
fixed dose
LD-259 Bliss GVS
India
08/2011-
07/2013
13 110X1 Lonart-DS Tablet Artemether/ Lumefantrine
80mg/480mg
fixed dose
LD-259 Bliss GVS
India
08/2011-
07/2013
14 112X1 Lonart-DS Tablet Artemether/ Lumefantrine
80mg/480mg
fixed dose
LD-266 Bliss GVS
India
09/2011-
08/2013
15 15X1
Lonart-DS Tablet Artemether/ Lumefantrine
80mg/480mg
fixed dose
LD-266 Bliss GVS India
09/2011- 08/2013
16 16X11 Lonart Suspension Artemether/ Lumefantrine
180mg/1080mg
fixed dose
LO-210 Bliss GVS
India
08/2011-
07/2013
17 14X1 Lonart Forte Tablet Artemether/ Lumefantrine
40mg/240mg
fixed dose
LF-249 Bliss GVS
India
08/2011-
07/2013
18 16X1 Lonart Forte Tablet Artemether/ Lumefantrine
40mg/240mg
fixed dose
LF-249 Bliss GVS
India
08/2011-
07/2013
19 13X1 Lonart Forte Tablet Artemether/ Lumefantrine
40mg/240mg
fixed dose
LF-239 Bliss GVS
India
05/2011-
04/2013
20 18X1 Lonart Tablet Artemether/ Lumefantrine
20mg/120mg fixed dose
LN-450 Bliss GVS
India
09/2011-
08/2013
21 12X1 Lonart-Dispersible Tablet Artemether/ Lumefantrine
20mg/120mg
fixed dose
LS-39 Bliss GVS
India
09/2011-
08/2013
22 11X1 Lonart Tablet Artemether/ Lumefantrine
20mg/120mg
fixed dose
LN-449 Bliss GVS
India
09/2011-
08/2013
* Unregistered samples
University of Ghana http://ugspace.ug.edu.gh
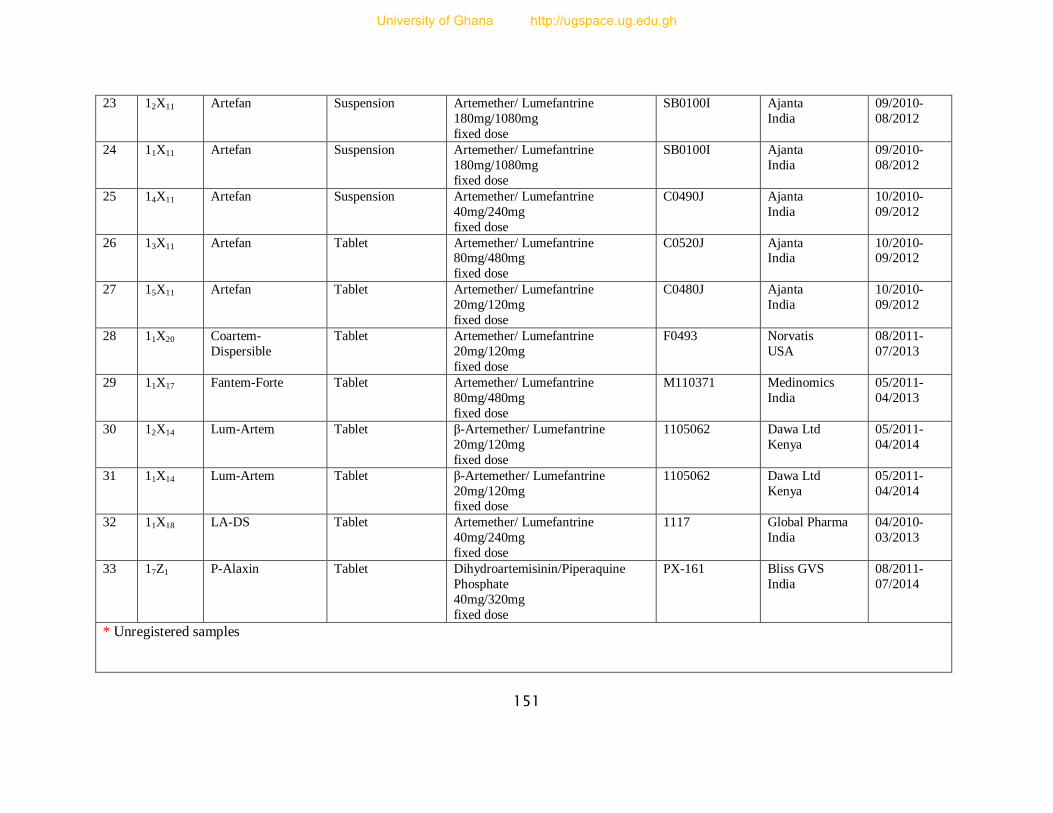
151
23 12X11 Artefan Suspension Artemether/ Lumefantrine
180mg/1080mg
fixed dose
SB0100I Ajanta
India
09/2010-
08/2012
24 11X11 Artefan Suspension Artemether/ Lumefantrine
180mg/1080mg
fixed dose
SB0100I Ajanta
India
09/2010-
08/2012
25 14X11 Artefan Suspension Artemether/ Lumefantrine
40mg/240mg
fixed dose
C0490J Ajanta
India
10/2010-
09/2012
26 13X11 Artefan Tablet Artemether/ Lumefantrine 80mg/480mg
fixed dose
C0520J Ajanta India
10/2010- 09/2012
27 15X11 Artefan Tablet Artemether/ Lumefantrine
20mg/120mg
fixed dose
C0480J Ajanta
India
10/2010-
09/2012
28 11X20 Coartem-
Dispersible
Tablet Artemether/ Lumefantrine
20mg/120mg
fixed dose
F0493 Norvatis
USA
08/2011-
07/2013
29 11X17 Fantem-Forte Tablet Artemether/ Lumefantrine
80mg/480mg
fixed dose
M110371 Medinomics
India
05/2011-
04/2013
30 12X14 Lum-Artem Tablet β-Artemether/ Lumefantrine
20mg/120mg
fixed dose
1105062 Dawa Ltd
Kenya
05/2011-
04/2014
31 11X14 Lum-Artem Tablet β-Artemether/ Lumefantrine
20mg/120mg fixed dose
1105062 Dawa Ltd
Kenya
05/2011-
04/2014
32 11X18 LA-DS Tablet Artemether/ Lumefantrine
40mg/240mg
fixed dose
1117 Global Pharma
India
04/2010-
03/2013
33 17Z1 P-Alaxin Tablet Dihydroartemisinin/Piperaquine
Phosphate
40mg/320mg
fixed dose
PX-161 Bliss GVS
India
08/2011-
07/2014
* Unregistered samples
University of Ghana http://ugspace.ug.edu.gh
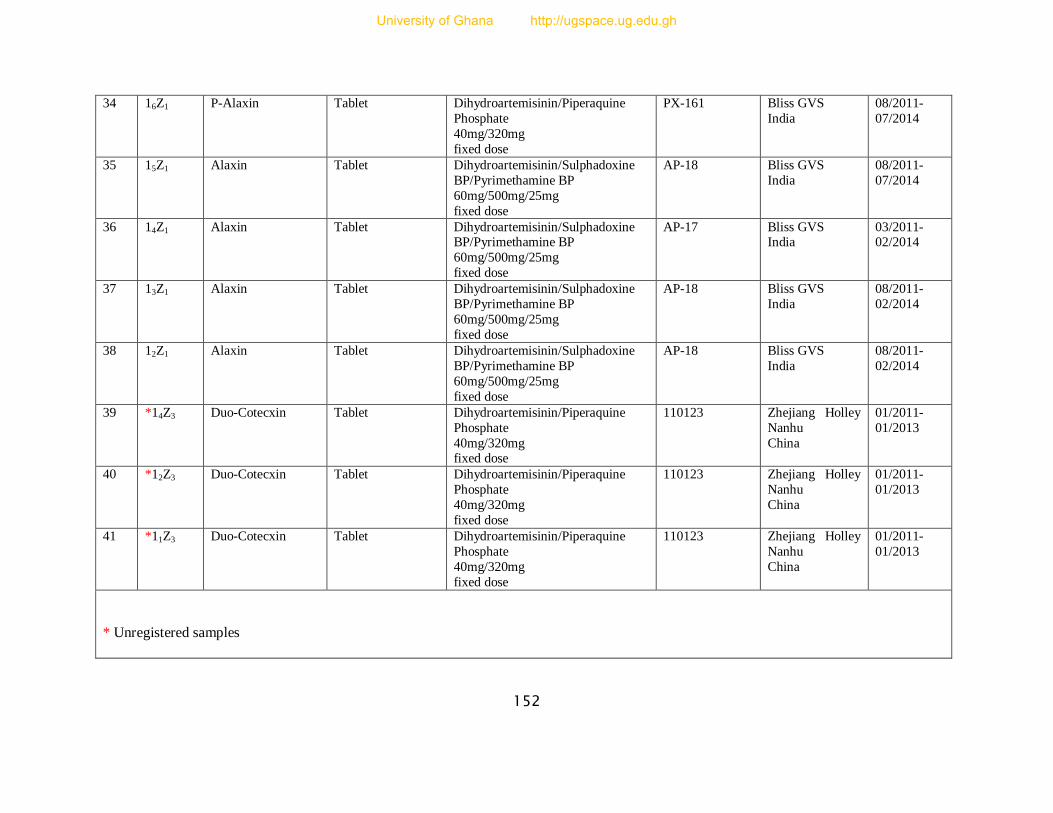
152
34 16Z1 P-Alaxin Tablet Dihydroartemisinin/Piperaquine
Phosphate
40mg/320mg
fixed dose
PX-161 Bliss GVS
India
08/2011-
07/2014
35 15Z1 Alaxin Tablet Dihydroartemisinin/Sulphadoxine
BP/Pyrimethamine BP
60mg/500mg/25mg
fixed dose
AP-18 Bliss GVS
India
08/2011-
07/2014
36 14Z1 Alaxin Tablet Dihydroartemisinin/Sulphadoxine BP/Pyrimethamine BP
60mg/500mg/25mg
fixed dose
AP-17 Bliss GVS India
03/2011- 02/2014
37 13Z1 Alaxin Tablet Dihydroartemisinin/Sulphadoxine
BP/Pyrimethamine BP
60mg/500mg/25mg
fixed dose
AP-18 Bliss GVS
India
08/2011-
02/2014
38 12Z1 Alaxin Tablet Dihydroartemisinin/Sulphadoxine
BP/Pyrimethamine BP
60mg/500mg/25mg
fixed dose
AP-18 Bliss GVS
India
08/2011-
02/2014
39 *14Z3 Duo-Cotecxin Tablet Dihydroartemisinin/Piperaquine
Phosphate
40mg/320mg fixed dose
110123 Zhejiang Holley
Nanhu
China
01/2011-
01/2013
40 *12Z3 Duo-Cotecxin Tablet Dihydroartemisinin/Piperaquine
Phosphate
40mg/320mg
fixed dose
110123 Zhejiang Holley
Nanhu
China
01/2011-
01/2013
41 *11Z3 Duo-Cotecxin Tablet Dihydroartemisinin/Piperaquine
Phosphate
40mg/320mg
fixed dose
110123 Zhejiang Holley
Nanhu
China
01/2011-
01/2013
* Unregistered samples
University of Ghana http://ugspace.ug.edu.gh
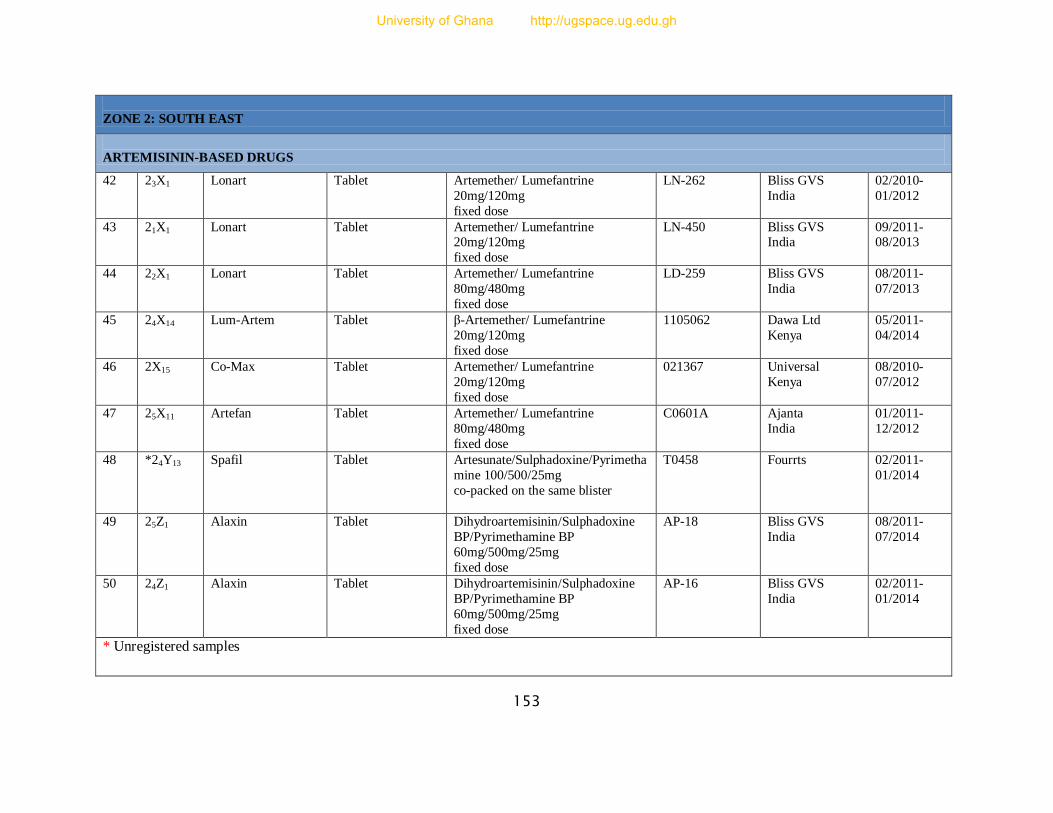
153
ZONE 2: SOUTH EAST
ARTEMISININ-BASED DRUGS
42 23X1 Lonart Tablet Artemether/ Lumefantrine
20mg/120mg
fixed dose
LN-262 Bliss GVS
India
02/2010-
01/2012
43 21X1 Lonart Tablet Artemether/ Lumefantrine 20mg/120mg
fixed dose
LN-450 Bliss GVS India
09/2011- 08/2013
44 22X1 Lonart Tablet Artemether/ Lumefantrine
80mg/480mg
fixed dose
LD-259 Bliss GVS
India
08/2011-
07/2013
45 24X14 Lum-Artem Tablet β-Artemether/ Lumefantrine
20mg/120mg
fixed dose
1105062 Dawa Ltd
Kenya
05/2011-
04/2014
46 2X15 Co-Max Tablet Artemether/ Lumefantrine
20mg/120mg
fixed dose
021367 Universal
Kenya
08/2010-
07/2012
47 25X11 Artefan Tablet Artemether/ Lumefantrine
80mg/480mg
fixed dose
C0601A Ajanta
India
01/2011-
12/2012
48 *24Y13 Spafil Tablet Artesunate/Sulphadoxine/Pyrimetha
mine 100/500/25mg
co-packed on the same blister
T0458 Fourrts 02/2011-
01/2014
49 25Z1 Alaxin Tablet Dihydroartemisinin/Sulphadoxine
BP/Pyrimethamine BP
60mg/500mg/25mg
fixed dose
AP-18 Bliss GVS
India
08/2011-
07/2014
50 24Z1 Alaxin Tablet Dihydroartemisinin/Sulphadoxine
BP/Pyrimethamine BP
60mg/500mg/25mg
fixed dose
AP-16 Bliss GVS
India
02/2011-
01/2014
* Unregistered samples
University of Ghana http://ugspace.ug.edu.gh
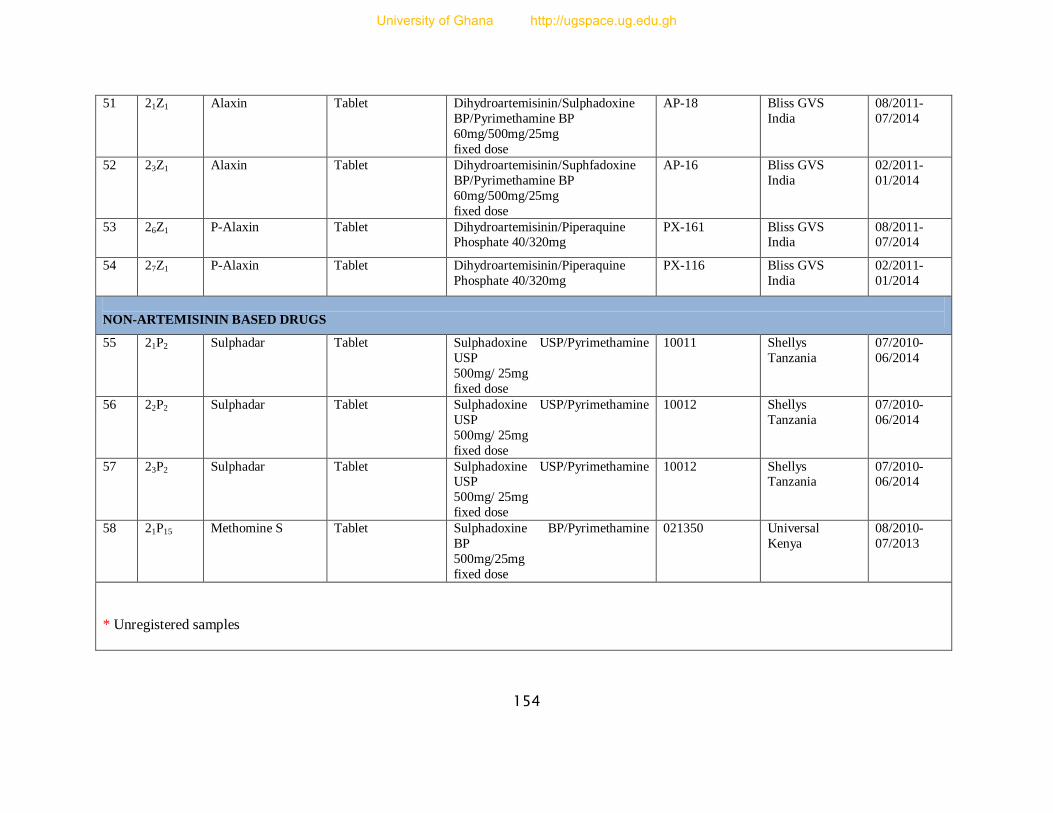
154
51 21Z1 Alaxin Tablet Dihydroartemisinin/Sulphadoxine
BP/Pyrimethamine BP
60mg/500mg/25mg
fixed dose
AP-18 Bliss GVS
India
08/2011-
07/2014
52 23Z1 Alaxin Tablet Dihydroartemisinin/Suphfadoxine
BP/Pyrimethamine BP
60mg/500mg/25mg
fixed dose
AP-16 Bliss GVS
India
02/2011-
01/2014
53 26Z1 P-Alaxin Tablet Dihydroartemisinin/Piperaquine
Phosphate 40/320mg PX-161 Bliss GVS
India 08/2011- 07/2014
54 27Z1 P-Alaxin Tablet Dihydroartemisinin/Piperaquine
Phosphate 40/320mg
PX-116 Bliss GVS
India
02/2011-
01/2014
NON-ARTEMISININ BASED DRUGS
55 21P2 Sulphadar
Tablet Sulphadoxine USP/Pyrimethamine
USP
500mg/ 25mg
fixed dose
10011 Shellys
Tanzania
07/2010-
06/2014
56 22P2 Sulphadar Tablet Sulphadoxine USP/Pyrimethamine
USP
500mg/ 25mg
fixed dose
10012 Shellys
Tanzania
07/2010-
06/2014
57 23P2 Sulphadar Tablet Sulphadoxine USP/Pyrimethamine
USP
500mg/ 25mg
fixed dose
10012 Shellys Tanzania
07/2010- 06/2014
58 21P15 Methomine S Tablet Sulphadoxine BP/Pyrimethamine
BP
500mg/25mg
fixed dose
021350 Universal
Kenya
08/2010-
07/2013
* Unregistered samples
University of Ghana http://ugspace.ug.edu.gh
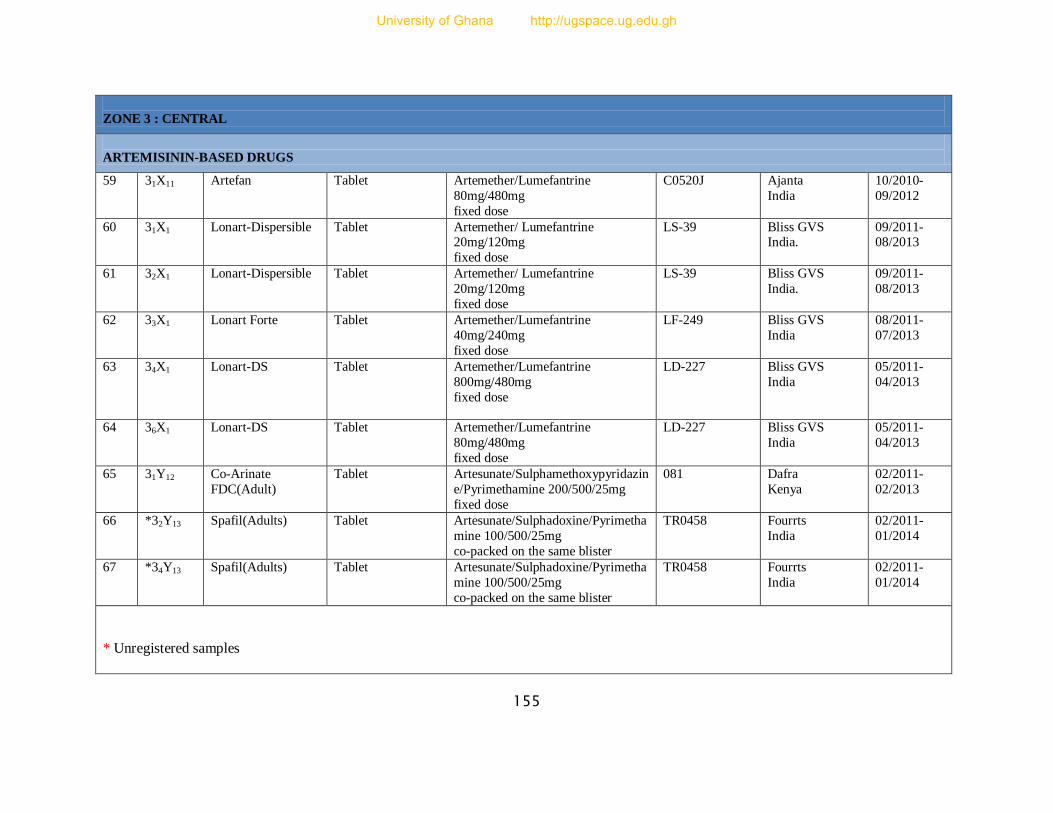
155
ZONE 3 : CENTRAL
ARTEMISININ-BASED DRUGS
59 31X11 Artefan Tablet Artemether/Lumefantrine
80mg/480mg
fixed dose
C0520J Ajanta
India
10/2010-
09/2012
60 31X1 Lonart-Dispersible
Tablet Artemether/ Lumefantrine 20mg/120mg
fixed dose
LS-39 Bliss GVS India.
09/2011- 08/2013
61 32X1 Lonart-Dispersible
Tablet Artemether/ Lumefantrine
20mg/120mg
fixed dose
LS-39 Bliss GVS
India.
09/2011-
08/2013
62 33X1 Lonart Forte Tablet Artemether/Lumefantrine
40mg/240mg
fixed dose
LF-249 Bliss GVS
India
08/2011-
07/2013
63 34X1 Lonart-DS Tablet Artemether/Lumefantrine
800mg/480mg
fixed dose
LD-227 Bliss GVS
India
05/2011-
04/2013
64 36X1 Lonart-DS Tablet Artemether/Lumefantrine
80mg/480mg
fixed dose
LD-227 Bliss GVS
India
05/2011-
04/2013
65 31Y12 Co-Arinate
FDC(Adult)
Tablet Artesunate/Sulphamethoxypyridazin
e/Pyrimethamine 200/500/25mg
fixed dose
081 Dafra
Kenya
02/2011-
02/2013
66 *32Y13 Spafil(Adults) Tablet Artesunate/Sulphadoxine/Pyrimetha
mine 100/500/25mg
co-packed on the same blister
TR0458 Fourrts
India
02/2011-
01/2014
67 *34Y13 Spafil(Adults) Tablet Artesunate/Sulphadoxine/Pyrimetha
mine 100/500/25mg
co-packed on the same blister
TR0458 Fourrts
India
02/2011-
01/2014
* Unregistered samples
University of Ghana http://ugspace.ug.edu.gh
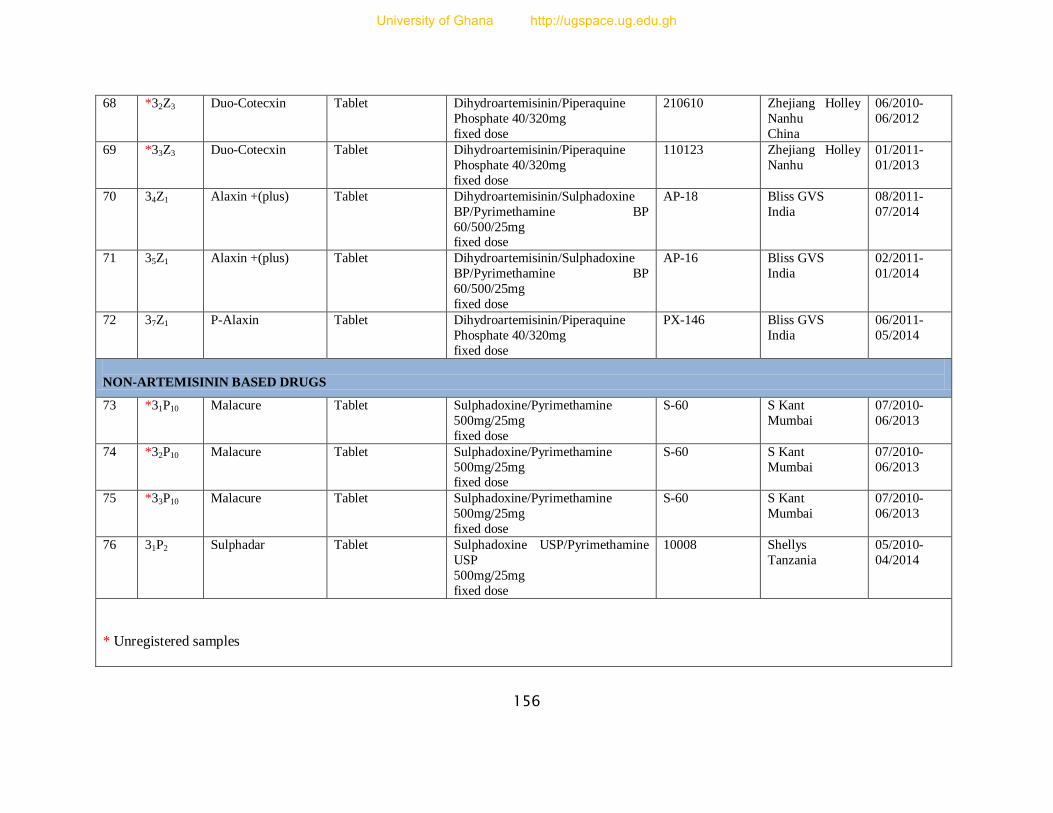
156
68 *32Z3 Duo-Cotecxin Tablet Dihydroartemisinin/Piperaquine
Phosphate 40/320mg
fixed dose
210610 Zhejiang Holley
Nanhu
China
06/2010-
06/2012
69 *33Z3 Duo-Cotecxin Tablet Dihydroartemisinin/Piperaquine
Phosphate 40/320mg
fixed dose
110123 Zhejiang Holley
Nanhu
01/2011-
01/2013
70 34Z1 Alaxin +(plus) Tablet Dihydroartemisinin/Sulphadoxine
BP/Pyrimethamine BP
60/500/25mg fixed dose
AP-18 Bliss GVS
India
08/2011-
07/2014
71 35Z1 Alaxin +(plus) Tablet Dihydroartemisinin/Sulphadoxine
BP/Pyrimethamine BP
60/500/25mg
fixed dose
AP-16 Bliss GVS
India
02/2011-
01/2014
72 37Z1 P-Alaxin Tablet Dihydroartemisinin/Piperaquine
Phosphate 40/320mg
fixed dose
PX-146 Bliss GVS
India
06/2011-
05/2014
NON-ARTEMISININ BASED DRUGS
73 *31P10 Malacure Tablet Sulphadoxine/Pyrimethamine
500mg/25mg
fixed dose
S-60 S Kant
Mumbai
07/2010-
06/2013
74 *32P10 Malacure Tablet Sulphadoxine/Pyrimethamine
500mg/25mg fixed dose
S-60 S Kant
Mumbai
07/2010-
06/2013
75 *33P10 Malacure Tablet Sulphadoxine/Pyrimethamine
500mg/25mg
fixed dose
S-60 S Kant
Mumbai
07/2010-
06/2013
76 31P2 Sulphadar Tablet Sulphadoxine USP/Pyrimethamine
USP
500mg/25mg
fixed dose
10008 Shellys
Tanzania
05/2010-
04/2014
* Unregistered samples
University of Ghana http://ugspace.ug.edu.gh
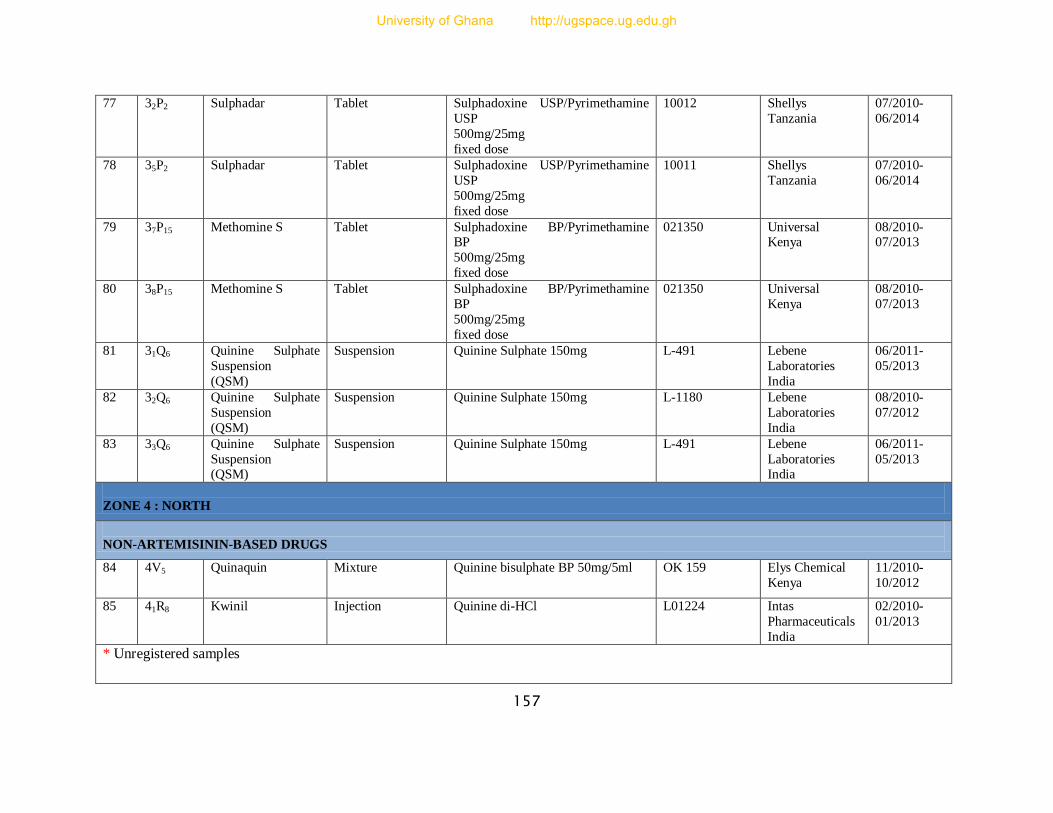
157
77 32P2 Sulphadar Tablet Sulphadoxine USP/Pyrimethamine
USP
500mg/25mg
fixed dose
10012 Shellys
Tanzania
07/2010-
06/2014
78 35P2 Sulphadar Tablet Sulphadoxine USP/Pyrimethamine
USP
500mg/25mg
fixed dose
10011 Shellys
Tanzania
07/2010-
06/2014
79 37P15 Methomine S Tablet Sulphadoxine BP/Pyrimethamine BP
500mg/25mg
fixed dose
021350 Universal Kenya
08/2010- 07/2013
80 38P15 Methomine S Tablet Sulphadoxine BP/Pyrimethamine
BP
500mg/25mg
fixed dose
021350 Universal
Kenya
08/2010-
07/2013
81 31Q6 Quinine Sulphate
Suspension
(QSM)
Suspension Quinine Sulphate 150mg L-491 Lebene
Laboratories
India
06/2011-
05/2013
82 32Q6 Quinine Sulphate
Suspension
(QSM)
Suspension Quinine Sulphate 150mg L-1180 Lebene
Laboratories
India
08/2010-
07/2012
83 33Q6 Quinine Sulphate
Suspension (QSM)
Suspension Quinine Sulphate 150mg L-491 Lebene
Laboratories India
06/2011-
05/2013
ZONE 4 : NORTH
NON-ARTEMISININ-BASED DRUGS
84 4V5 Quinaquin Mixture Quinine bisulphate BP 50mg/5ml OK 159 Elys Chemical
Kenya
11/2010-
10/2012
85 41R8 Kwinil Injection Quinine di-HCl L01224 Intas
Pharmaceuticals
India
02/2010-
01/2013
* Unregistered samples
University of Ghana http://ugspace.ug.edu.gh
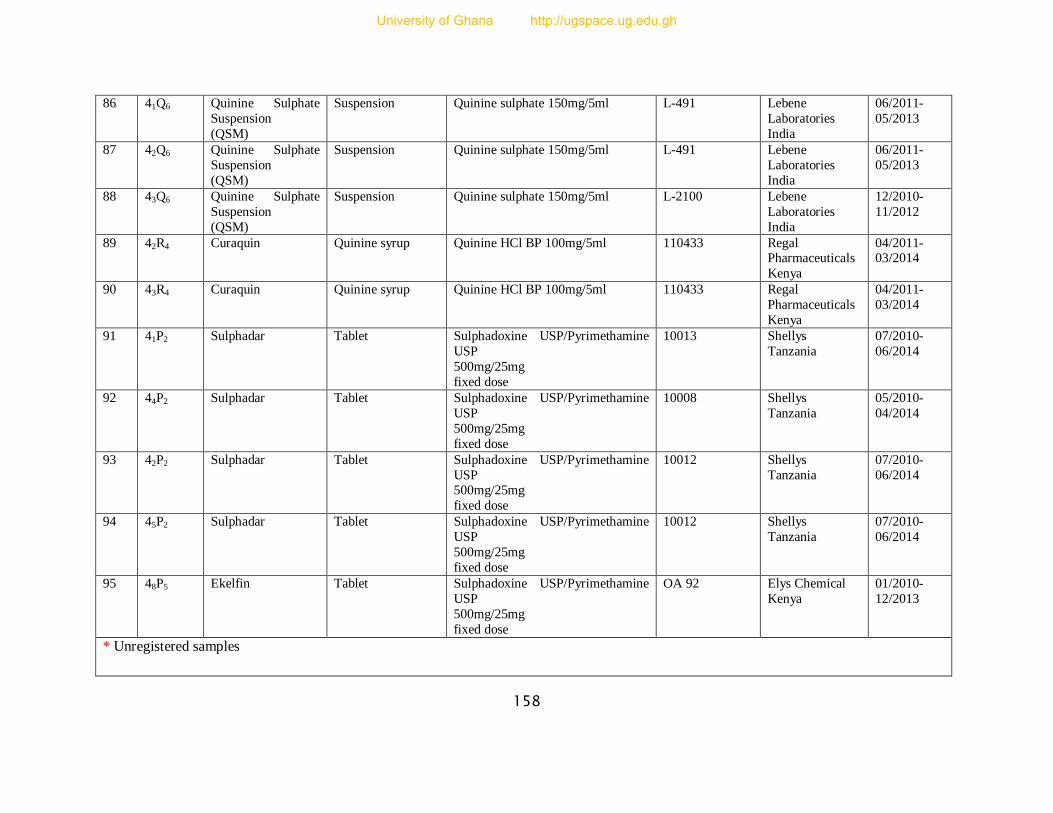
158
86 41Q6 Quinine Sulphate
Suspension
(QSM)
Suspension Quinine sulphate 150mg/5ml L-491 Lebene
Laboratories
India
06/2011-
05/2013
87 42Q6 Quinine Sulphate
Suspension
(QSM)
Suspension Quinine sulphate 150mg/5ml L-491 Lebene
Laboratories
India
06/2011-
05/2013
88 43Q6 Quinine Sulphate
Suspension
(QSM)
Suspension Quinine sulphate 150mg/5ml L-2100 Lebene
Laboratories
India
12/2010-
11/2012
89 42R4 Curaquin Quinine syrup Quinine HCl BP 100mg/5ml 110433 Regal Pharmaceuticals
Kenya
04/2011- 03/2014
90 43R4 Curaquin Quinine syrup Quinine HCl BP 100mg/5ml 110433 Regal
Pharmaceuticals
Kenya
04/2011-
03/2014
91 41P2 Sulphadar Tablet Sulphadoxine USP/Pyrimethamine
USP
500mg/25mg
fixed dose
10013 Shellys
Tanzania
07/2010-
06/2014
92 44P2 Sulphadar Tablet Sulphadoxine USP/Pyrimethamine
USP
500mg/25mg
fixed dose
10008 Shellys
Tanzania
05/2010-
04/2014
93 42P2 Sulphadar Tablet Sulphadoxine USP/Pyrimethamine
USP 500mg/25mg
fixed dose
10012 Shellys
Tanzania
07/2010-
06/2014
94 45P2 Sulphadar Tablet Sulphadoxine USP/Pyrimethamine
USP
500mg/25mg
fixed dose
10012 Shellys
Tanzania
07/2010-
06/2014
95 48P5 Ekelfin Tablet Sulphadoxine USP/Pyrimethamine
USP
500mg/25mg
fixed dose
OA 92 Elys Chemical
Kenya
01/2010-
12/2013
* Unregistered samples
University of Ghana http://ugspace.ug.edu.gh
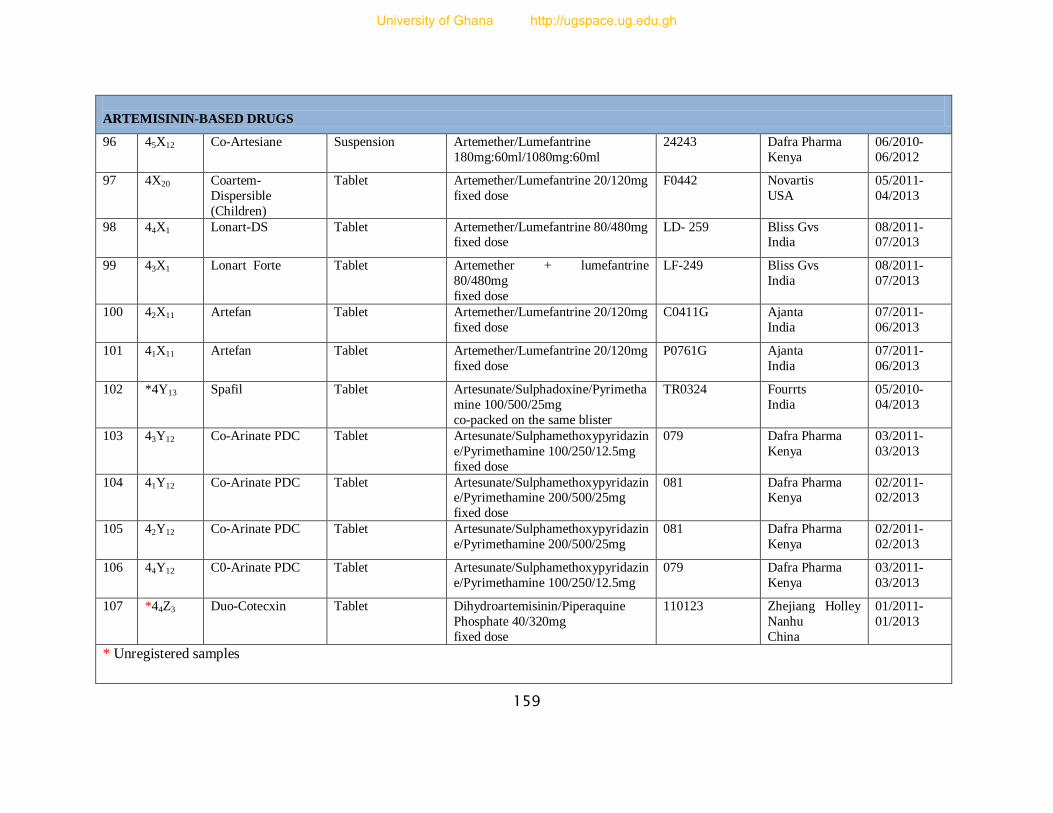
159
ARTEMISININ-BASED DRUGS
96 45X12 Co-Artesiane Suspension Artemether/Lumefantrine
180mg:60ml/1080mg:60ml
24243 Dafra Pharma
Kenya
06/2010-
06/2012
97 4X20 Coartem-
Dispersible
(Children)
Tablet Artemether/Lumefantrine 20/120mg
fixed dose
F0442 Novartis
USA
05/2011-
04/2013
98 44X1 Lonart-DS Tablet
Artemether/Lumefantrine 80/480mg fixed dose
LD- 259 Bliss Gvs India
08/2011- 07/2013
99 43X1 Lonart Forte Tablet Artemether + lumefantrine
80/480mg
fixed dose
LF-249 Bliss Gvs
India
08/2011-
07/2013
100 42X11 Artefan
Tablet
Artemether/Lumefantrine 20/120mg
fixed dose
C0411G Ajanta
India
07/2011-
06/2013
101 41X11 Artefan Tablet Artemether/Lumefantrine 20/120mg
fixed dose
P0761G Ajanta
India
07/2011-
06/2013
102 *4Y13 Spafil Tablet Artesunate/Sulphadoxine/Pyrimetha
mine 100/500/25mg
co-packed on the same blister
TR0324 Fourrts
India
05/2010-
04/2013
103 43Y12
Co-Arinate PDC Tablet
Artesunate/Sulphamethoxypyridazin
e/Pyrimethamine 100/250/12.5mg
fixed dose
079 Dafra Pharma
Kenya
03/2011-
03/2013
104 41Y12 Co-Arinate PDC Tablet Artesunate/Sulphamethoxypyridazin
e/Pyrimethamine 200/500/25mg
fixed dose
081 Dafra Pharma Kenya
02/2011- 02/2013
105 42Y12 Co-Arinate PDC Tablet
Artesunate/Sulphamethoxypyridazin
e/Pyrimethamine 200/500/25mg
081 Dafra Pharma
Kenya
02/2011-
02/2013
106 44Y12 C0-Arinate PDC Tablet Artesunate/Sulphamethoxypyridazin
e/Pyrimethamine 100/250/12.5mg
079 Dafra Pharma
Kenya
03/2011-
03/2013
107 *44Z3 Duo-Cotecxin Tablet Dihydroartemisinin/Piperaquine
Phosphate 40/320mg
fixed dose
110123 Zhejiang Holley
Nanhu
China
01/2011-
01/2013
* Unregistered samples
University of Ghana http://ugspace.ug.edu.gh
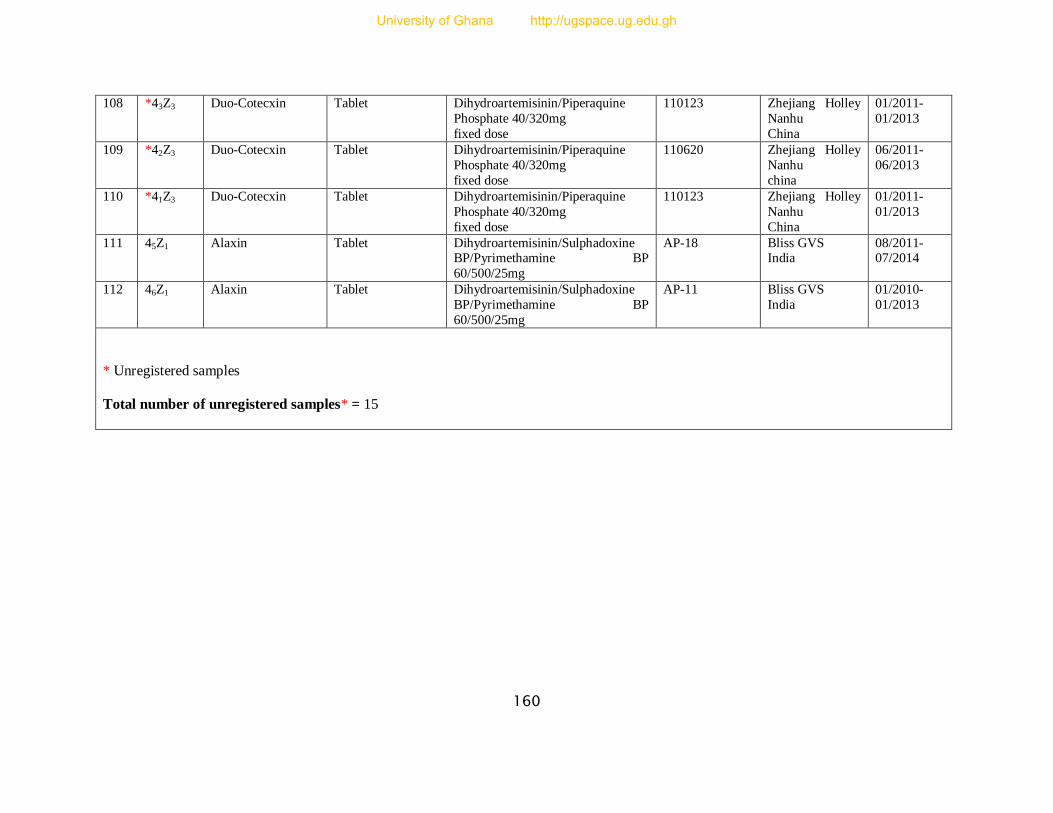
160
108 *43Z3 Duo-Cotecxin Tablet Dihydroartemisinin/Piperaquine
Phosphate 40/320mg
fixed dose
110123 Zhejiang Holley
Nanhu
China
01/2011-
01/2013
109 *42Z3 Duo-Cotecxin Tablet Dihydroartemisinin/Piperaquine
Phosphate 40/320mg
fixed dose
110620 Zhejiang Holley
Nanhu
china
06/2011-
06/2013
110 *41Z3 Duo-Cotecxin Tablet Dihydroartemisinin/Piperaquine
Phosphate 40/320mg
fixed dose
110123 Zhejiang Holley
Nanhu
China
01/2011-
01/2013
111 45Z1 Alaxin Tablet Dihydroartemisinin/Sulphadoxine BP/Pyrimethamine BP
60/500/25mg
AP-18 Bliss GVS India
08/2011- 07/2014
112 46Z1 Alaxin Tablet Dihydroartemisinin/Sulphadoxine
BP/Pyrimethamine BP
60/500/25mg
AP-11 Bliss GVS
India
01/2010-
01/2013
* Unregistered samples
Total number of unregistered samples* = 15
University of Ghana http://ugspace.ug.edu.gh
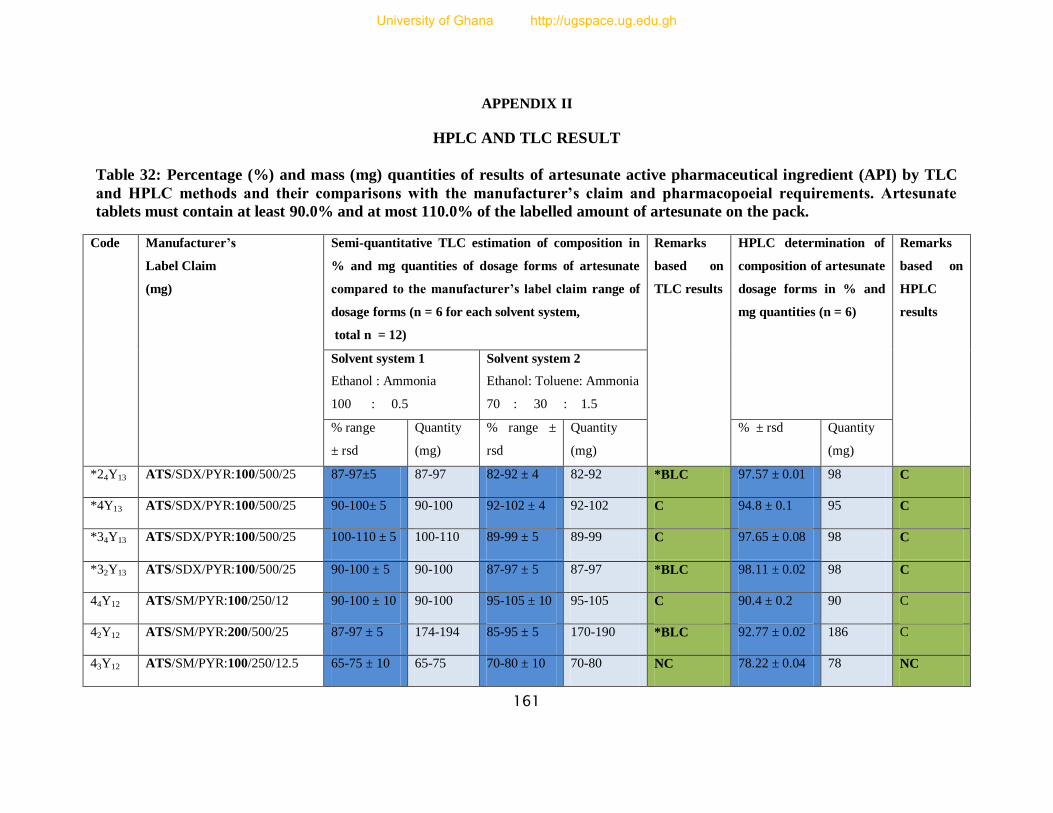
161
APPENDIX II
HPLC AND TLC RESULT
Table 32: Percentage (%) and mass (mg) quantities of results of artesunate active pharmaceutical ingredient (API) by TLC
and HPLC methods and their comparisons with the manufacturer’s claim and pharmacopoeial requirements. Artesunate
tablets must contain at least 90.0% and at most 110.0% of the labelled amount of artesunate on the pack.
Code Manufacturer’s
Label Claim
(mg)
Semi-quantitative TLC estimation of composition in
% and mg quantities of dosage forms of artesunate
compared to the manufacturer’s label claim range of
dosage forms (n = 6 for each solvent system,
total n = 12)
Remarks
based on
TLC results
HPLC determination of
composition of artesunate
dosage forms in % and
mg quantities (n = 6)
Remarks
based on
HPLC
results
Solvent system 1
Ethanol : Ammonia
100 : 0.5
Solvent system 2
Ethanol: Toluene: Ammonia
70 : 30 : 1.5
% range
± rsd
Quantity
(mg)
% range ±
rsd
Quantity
(mg)
% ± rsd Quantity
(mg)
*24Y13 ATS/SDX/PYR:100/500/25 87-97±5 87-97 82-92 ± 4 82-92 *BLC 97.57 ± 0.01 98 C
*4Y13 ATS/SDX/PYR:100/500/25 90-100± 5 90-100 92-102 ± 4 92-102 C 94.8 ± 0.1 95 C
*34Y13 ATS/SDX/PYR:100/500/25 100-110 ± 5 100-110 89-99 ± 5 89-99 C 97.65 ± 0.08 98 C
*32Y13 ATS/SDX/PYR:100/500/25 90-100 ± 5 90-100 87-97 ± 5 87-97 *BLC 98.11 ± 0.02 98 C
44Y12 ATS/SM/PYR:100/250/12 90-100 ± 10 90-100 95-105 ± 10 95-105 C 90.4 ± 0.2 90 C
42Y12
ATS/SM/PYR:200/500/25 87-97 ± 5 174-194 85-95 ± 5 170-190 *BLC 92.77 ± 0.02 186 C
43Y12
ATS/SM/PYR:100/250/12.5 65-75 ± 10 65-75 70-80 ± 10 70-80 NC 78.22 ± 0.04 78 NC
University of Ghana http://ugspace.ug.edu.gh
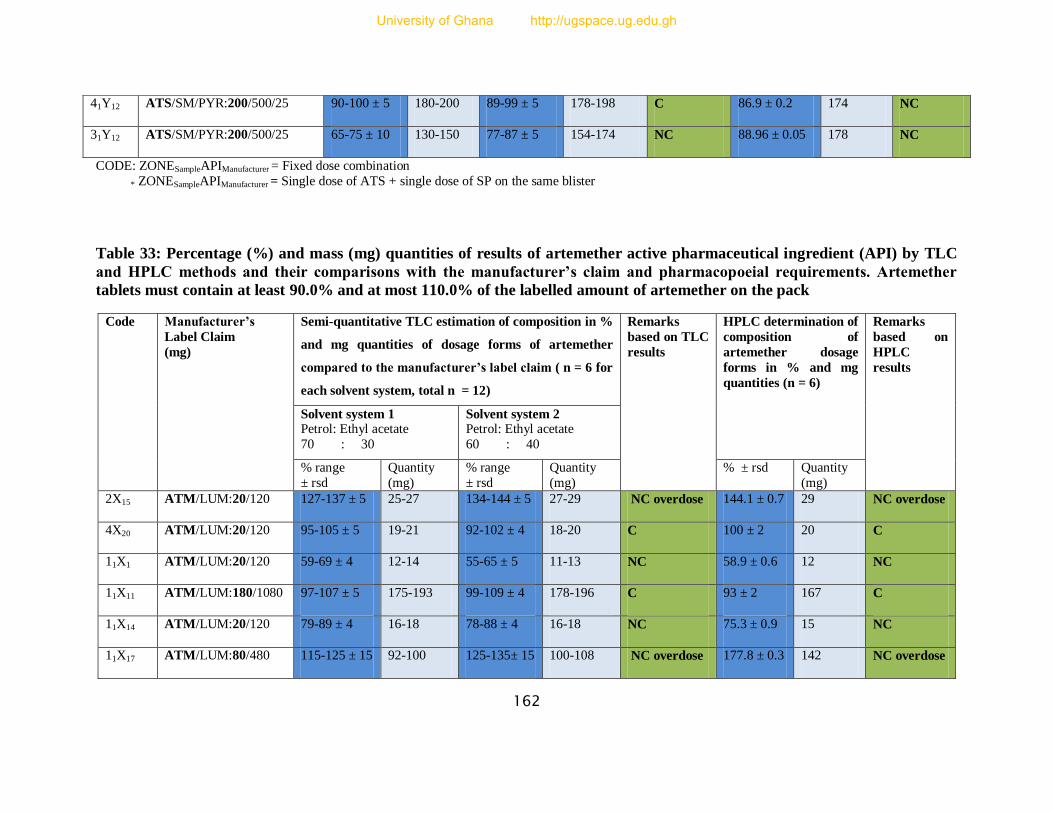
162
CODE: ZONESampleAPIManufacturer = Fixed dose combination
* ZONESampleAPIManufacturer = Single dose of ATS + single dose of SP on the same blister
Table 33: Percentage (%) and mass (mg) quantities of results of artemether active pharmaceutical ingredient (API) by TLC
and HPLC methods and their comparisons with the manufacturer’s claim and pharmacopoeial requirements. Artemether
tablets must contain at least 90.0% and at most 110.0% of the labelled amount of artemether on the pack
41Y12
ATS/SM/PYR:200/500/25 90-100 ± 5 180-200 89-99 ± 5 178-198 C 86.9 ± 0.2 174 NC
31Y12 ATS/SM/PYR:200/500/25 65-75 ± 10 130-150 77-87 ± 5 154-174 NC 88.96 ± 0.05 178 NC
Code Manufacturer’s
Label Claim
(mg)
Semi-quantitative TLC estimation of composition in %
and mg quantities of dosage forms of artemether
compared to the manufacturer’s label claim ( n = 6 for
each solvent system, total n = 12)
Remarks
based on TLC
results
HPLC determination of
composition of
artemether dosage
forms in % and mg
quantities (n = 6)
Remarks
based on
HPLC
results
Solvent system 1 Petrol: Ethyl acetate
70 : 30
Solvent system 2 Petrol: Ethyl acetate
60 : 40
% range
± rsd
Quantity
(mg)
% range
± rsd
Quantity
(mg)
% ± rsd Quantity
(mg)
2X15 ATM/LUM:20/120 127-137 ± 5 25-27 134-144 ± 5 27-29 NC overdose 144.1 ± 0.7 29 NC overdose
4X20 ATM/LUM:20/120 95-105 ± 5 19-21 92-102 ± 4 18-20 C 100 ± 2 20 C
11X1 ATM/LUM:20/120 59-69 ± 4 12-14 55-65 ± 5 11-13 NC 58.9 ± 0.6 12 NC
11X11 ATM/LUM:180/1080 97-107 ± 5 175-193 99-109 ± 4 178-196 C 93 ± 2 167 C
11X14 ATM/LUM:20/120 79-89 ± 4 16-18 78-88 ± 4 16-18 NC 75.3 ± 0.9 15 NC
11X17 ATM/LUM:80/480 115-125 ± 15 92-100 125-135± 15 100-108 NC overdose 177.8 ± 0.3 142 NC overdose
University of Ghana http://ugspace.ug.edu.gh

163
11X18 ATM/LUM:40/240 30-40 ± 5 12-16 29-39 ± 4 12-16 NC 26.5 ± 0.8 11 NC
11X20 ATM/LUM:20/120 132-142 ± 4 26-28 134-144 ± 5 27-29 NC overdose 135 ± 4 27 NC overdose
12X1 ATM/LUM:20/120 119-129 ± 4 24-26 115-125 ± 5 23-25 NC overdose 119.7 ± 0.8 24 NC overdose
12X11 ATM/LUM:180/1080 105-115 ± 5 189-207 100-110 ± 5 180-198 *BLC 103.3 ± 0.8 186 C
12X14 ATM/LUM:20/120 30-40 ± 5 6-8 30-40 ± 5 6-8 NC 35 ± 2 7 NC
13X1 ATM/LUM:40/240 92-102 ± 4 37-41 94-104 ± 5 38-42 C 96.8 ± 0.2 39 C
13X11 ATM/LUM:80/480 35-45 ± 5 28-36 35-45 ± 5 28-36 NC 39.6 ± 0.5 32 NC
14X1 ATM/LUM:40/240 64-74 ± 5 26-30 67-77 ± 5 27-31 NC 69 ± 2 28 NC
14X11 ATM/LUM:40/240 75-85 ± 5 30-34 72-82 ± 4 29-33 NC 82.7 ± 0.3 33 NC
15X1 ATM/LUM:80/480 65-75 ± 5 52-60 62-72 ± 4 50-58 NC 67.3 ± 0.3 54 NC
15X11 ATM/LUM:20/120 40-50 ± 0 8-10 40-50 ± 0 8-10 NC 45 ± 1 9 NC
16X1 ATM/LUM:40/240 125-135 ± 10 50-54 120-130 ± 5 48-52 NC overdose 163.2 ± 0.4 65 NC overdose
17X1 ATM/LUM:80/480 84-94 ± 5 67-75 84-94 ± 5 67-75 NC 81.205±0 65 NC
18X1 ATM/LUM:20/120 120-130 ± 5 24-26 120-130 ± 5 24-26 NC overdose 162.7 ± 0.3 33 NC overdose
19X1 ATM/LUM:80/480 105-115 ± 5 84-92 105-115 ± 5 84-92 *BLC 103.4 ± 0.4 83 C
21X1 ATM/LUM:20/120 97-107± 5 19-21 97-107 ± 5 19-21 C 97 ± 1 19 C
22X1 ATM/LUM:80/480 120-130 ± 5 96-104 115-125± 15 92-100 NC overdose 131.5 ± 0.2 105 NC overdose
23X1 ATM/LUM:20/120 135-145 ± 5 27-29 129-139 ± 4 26-28 NC overdose 149 ± 1 30 NC overdose
University of Ghana http://ugspace.ug.edu.gh
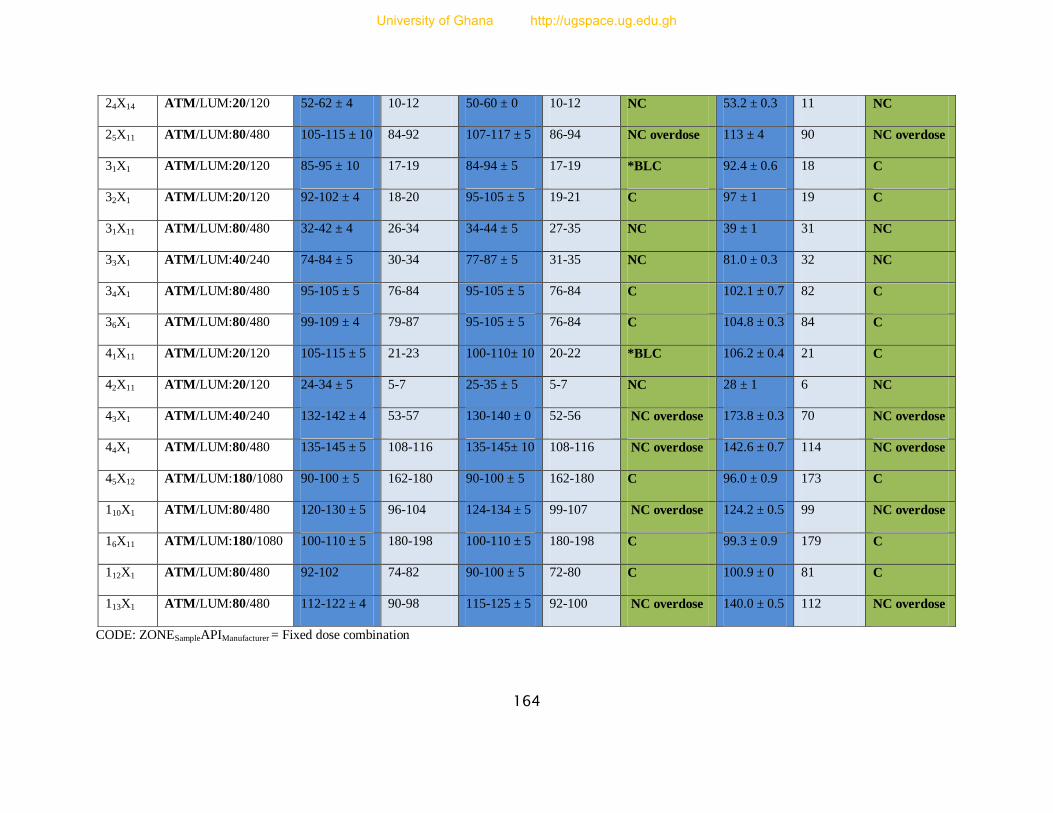
164
CODE: ZONESampleAPIManufacturer = Fixed dose combination
24X14 ATM/LUM:20/120 52-62 ± 4 10-12 50-60 ± 0 10-12 NC 53.2 ± 0.3 11 NC
25X11 ATM/LUM:80/480 105-115 ± 10 84-92 107-117 ± 5 86-94 NC overdose 113 ± 4 90 NC overdose
31X1 ATM/LUM:20/120 85-95 ± 10 17-19 84-94 ± 5 17-19 *BLC 92.4 ± 0.6 18 C
32X1 ATM/LUM:20/120 92-102 ± 4 18-20 95-105 ± 5 19-21 C 97 ± 1 19 C
31X11 ATM/LUM:80/480 32-42 ± 4 26-34 34-44 ± 5 27-35 NC 39 ± 1 31 NC
33X1 ATM/LUM:40/240 74-84 ± 5 30-34 77-87 ± 5 31-35 NC 81.0 ± 0.3 32 NC
34X1 ATM/LUM:80/480 95-105 ± 5 76-84 95-105 ± 5 76-84 C 102.1 ± 0.7 82 C
36X1 ATM/LUM:80/480 99-109 ± 4 79-87 95-105 ± 5 76-84 C 104.8 ± 0.3 84 C
41X11 ATM/LUM:20/120 105-115 ± 5 21-23 100-110± 10 20-22 *BLC 106.2 ± 0.4 21 C
42X11 ATM/LUM:20/120 24-34 ± 5 5-7 25-35 ± 5 5-7 NC 28 ± 1 6 NC
43X1 ATM/LUM:40/240 132-142 ± 4 53-57 130-140 ± 0 52-56 NC overdose 173.8 ± 0.3 70 NC overdose
44X1 ATM/LUM:80/480 135-145 ± 5 108-116 135-145± 10 108-116 NC overdose 142.6 ± 0.7 114 NC overdose
45X12 ATM/LUM:180/1080 90-100 ± 5 162-180 90-100 ± 5 162-180 C 96.0 ± 0.9 173 C
110X1 ATM/LUM:80/480 120-130 ± 5 96-104 124-134 ± 5 99-107 NC overdose 124.2 ± 0.5 99 NC overdose
16X11 ATM/LUM:180/1080 100-110 ± 5 180-198 100-110 ± 5 180-198 C 99.3 ± 0.9 179 C
112X1 ATM/LUM:80/480 92-102 74-82 90-100 ± 5 72-80 C 100.9 ± 0 81 C
113X1 ATM/LUM:80/480 112-122 ± 4 90-98 115-125 ± 5 92-100 NC overdose 140.0 ± 0.5 112 NC overdose
University of Ghana http://ugspace.ug.edu.gh

165
Table 34: Percentage (%) and mass (mg) quantities of results of lumefantrine active pharmaceutical ingredient (API) by TLC
and HPLC methods and their comparisons with the manufacturer’s claim and pharmacopoeial requirements. Lumefantrine
tablets must contain at least 90.0% and at most 110.0% of the labelled amount of Lumefantrine on the pack
Code Manufacturer’s
Label Claim
(mg)
Semi-quantitative TLC estimation of composition in % and
mg quantities of dosage forms of lumefantrine compared to
the manufacturer’s label claim
( n = 6 for each solvent system, total n = 12)
Remarks
based on TLC
results
HPLC determination of
composition of
lumefantrine dosage
forms in % and mg
quantities
(n = 6)
Remarks
based on
HPLC results
Solvent system 1 Ethyl acetate: acetic acid:
toluene
4:2:18
Solvent system 2
Ethyl acetate: acetic acid
10:5
% range ± rsd Quantity (mg) % range ± rsd Quantity (mg) % ± rsd Quantity
(mg)
2X15 ATM/LUM:20/120 95-105 ± 5 114-126 95-105 ± 5 114-126 C 97 ± 2 116 C
4X20 ATM/LUM:20/120 112-122± 4 134-146 113-123±5 136-148 NC overdose 119.5 ± 0.4 143 NC overdose
11X1 ATM/LUM:20/120 104-114± 5 125-137 95-105 ± 5 114-126 C 112.5 ± 0.5 135 NC overdose
11X11 ATM/LUM:180/1080 117-127± 5 1264-1372 120-130 ± 0 1296-1404 NC overdose 127 ± 1 1372 NC overdose
11X14 ATM/LUM:20/120 60-70 ± 0 72-84 60-70 ± 0 72-84 NC 69.3 ± 0.3 83 NC
11X17 ATM/LUM:80/480 94-104 ± 5 451-499 98-108 ± 5 470-518 C 101.0 ± 0.4 485 C
11X18 ATM/LUM:40/240 95-105 ± 5 228-252 90-100 ± 0 216-240 C 92.9 ± 0.3 223 C
11X20 ATM/LUM:20/120 109-119± 4 131-143 110-120 ± 0 132-144 NC overdose 114.5 ± 0.5 137 NC overdose
12X1 ATM/LUM:20/120 100-110 ± 5 120-132 94-104 ± 5 113-125 C 113.0 ± 0.4 136 NC
12X11 ATM/LUM:180/1080 122-132± 4 1318-1426 119-129 ± 4 1285-1393 NC overdose 123 ± 2 1328 NC overdose
University of Ghana http://ugspace.ug.edu.gh
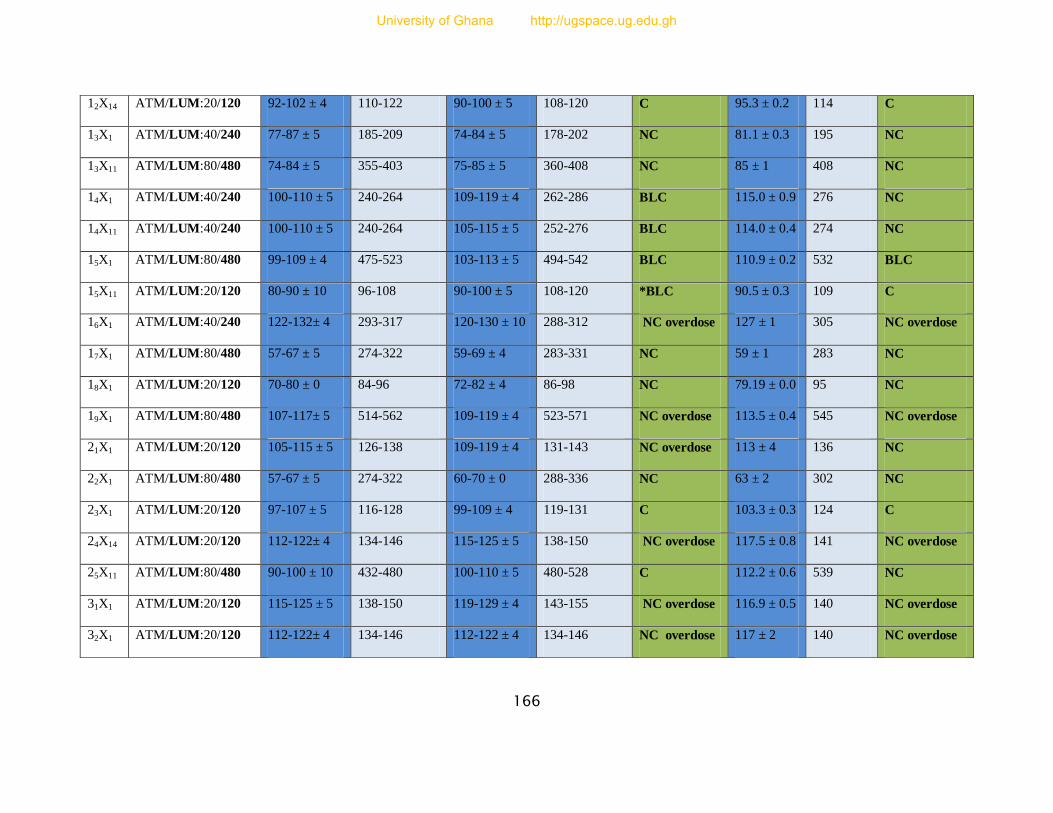
166
12X14 ATM/LUM:20/120 92-102 ± 4 110-122 90-100 ± 5 108-120 C 95.3 ± 0.2 114 C
13X1 ATM/LUM:40/240 77-87 ± 5 185-209 74-84 ± 5 178-202 NC 81.1 ± 0.3 195 NC
13X11 ATM/LUM:80/480 74-84 ± 5 355-403 75-85 ± 5 360-408 NC 85 ± 1 408 NC
14X1 ATM/LUM:40/240 100-110 ± 5 240-264 109-119 ± 4 262-286 BLC 115.0 ± 0.9 276 NC
14X11 ATM/LUM:40/240 100-110 ± 5 240-264 105-115 ± 5 252-276 BLC 114.0 ± 0.4 274 NC
15X1 ATM/LUM:80/480 99-109 ± 4 475-523 103-113 ± 5 494-542 BLC 110.9 ± 0.2 532 BLC
15X11 ATM/LUM:20/120 80-90 ± 10 96-108 90-100 ± 5 108-120 *BLC 90.5 ± 0.3 109 C
16X1 ATM/LUM:40/240 122-132± 4 293-317 120-130 ± 10 288-312 NC overdose 127 ± 1 305 NC overdose
17X1 ATM/LUM:80/480 57-67 ± 5 274-322 59-69 ± 4 283-331 NC 59 ± 1 283 NC
18X1 ATM/LUM:20/120 70-80 ± 0 84-96 72-82 ± 4 86-98 NC 79.19 ± 0.0 95 NC
19X1 ATM/LUM:80/480 107-117± 5 514-562 109-119 ± 4 523-571 NC overdose 113.5 ± 0.4 545 NC overdose
21X1 ATM/LUM:20/120 105-115 ± 5 126-138 109-119 ± 4 131-143 NC overdose 113 ± 4 136 NC
22X1 ATM/LUM:80/480 57-67 ± 5 274-322 60-70 ± 0 288-336 NC 63 ± 2 302 NC
23X1 ATM/LUM:20/120 97-107 ± 5 116-128 99-109 ± 4 119-131 C 103.3 ± 0.3 124 C
24X14 ATM/LUM:20/120 112-122± 4 134-146 115-125 ± 5 138-150 NC overdose 117.5 ± 0.8 141 NC overdose
25X11 ATM/LUM:80/480 90-100 ± 10 432-480 100-110 ± 5 480-528 C 112.2 ± 0.6 539 NC
31X1 ATM/LUM:20/120 115-125 ± 5 138-150 119-129 ± 4 143-155 NC overdose 116.9 ± 0.5 140 NC overdose
32X1 ATM/LUM:20/120 112-122± 4 134-146 112-122 ± 4 134-146 NC overdose 117 ± 2 140 NC overdose
University of Ghana http://ugspace.ug.edu.gh
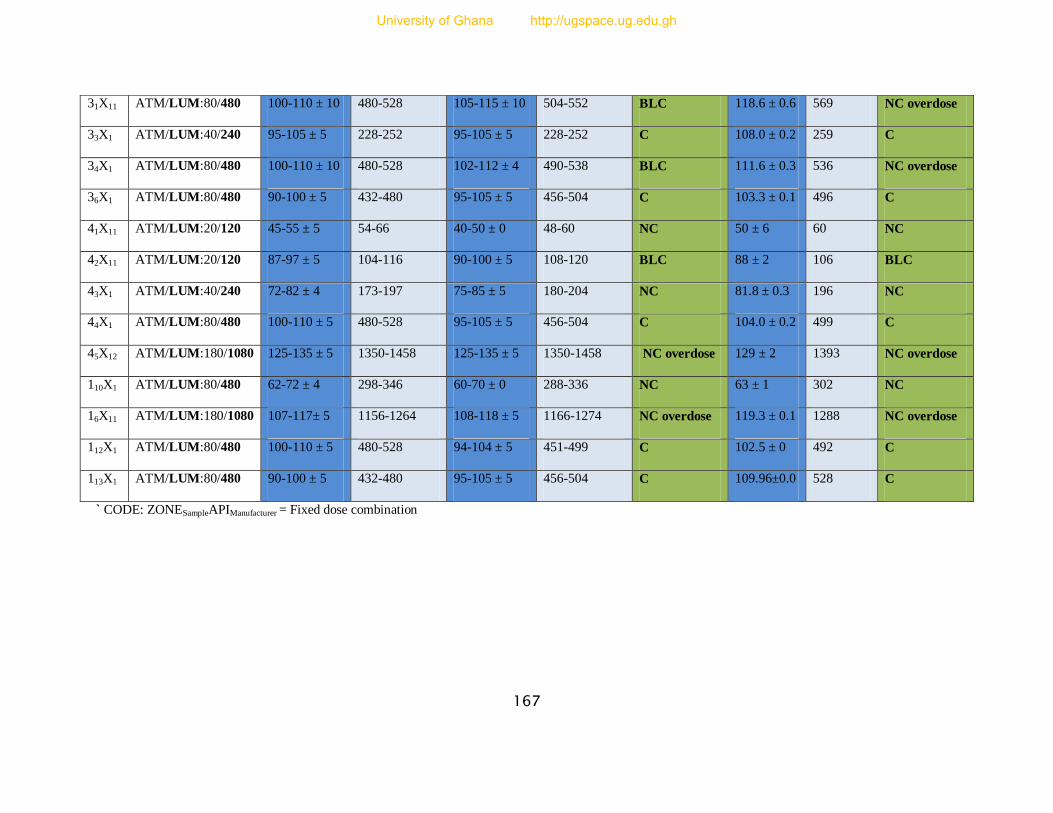
167
` CODE: ZONESampleAPIManufacturer = Fixed dose combination
31X11 ATM/LUM:80/480 100-110 ± 10 480-528 105-115 ± 10 504-552 BLC 118.6 ± 0.6 569 NC overdose
33X1 ATM/LUM:40/240 95-105 ± 5 228-252 95-105 ± 5 228-252 C 108.0 ± 0.2 259 C
34X1 ATM/LUM:80/480 100-110 ± 10 480-528 102-112 ± 4 490-538 BLC 111.6 ± 0.3 536 NC overdose
36X1 ATM/LUM:80/480 90-100 ± 5 432-480 95-105 ± 5 456-504 C 103.3 ± 0.1 496 C
41X11 ATM/LUM:20/120 45-55 ± 5 54-66 40-50 ± 0 48-60 NC 50 ± 6 60 NC
42X11 ATM/LUM:20/120 87-97 ± 5 104-116 90-100 ± 5 108-120 BLC 88 ± 2 106 BLC
43X1 ATM/LUM:40/240 72-82 ± 4 173-197 75-85 ± 5 180-204 NC 81.8 ± 0.3 196 NC
44X1 ATM/LUM:80/480 100-110 ± 5 480-528 95-105 ± 5 456-504 C 104.0 ± 0.2 499 C
45X12 ATM/LUM:180/1080 125-135 ± 5 1350-1458 125-135 ± 5 1350-1458 NC overdose 129 ± 2 1393 NC overdose
110X1 ATM/LUM:80/480 62-72 ± 4 298-346 60-70 ± 0 288-336 NC 63 ± 1 302 NC
16X11 ATM/LUM:180/1080 107-117± 5 1156-1264 108-118 ± 5 1166-1274 NC overdose 119.3 ± 0.1 1288 NC overdose
112X1 ATM/LUM:80/480 100-110 ± 5 480-528 94-104 ± 5 451-499 C 102.5 ± 0 492 C
113X1 ATM/LUM:80/480 90-100 ± 5 432-480 95-105 ± 5 456-504 C 109.96±0.0 528 C
University of Ghana http://ugspace.ug.edu.gh

168
Table 35: Percentage (%) and mass (mg) quantities of results of dihydroartemisinin (Artenimol) active pharmaceutical
ingredient (API) by TLC and HPLC methods and their comparisons with the manufacturer’s claim and pharmacopoeial
requirements. Dihydroartemisinin tablets must contain at least 90.0% and at most 110.0% of the labelled amount of
Dihydroartemisinin on the pack
Code Manufacturer’s
Label Claim
(mg)
Semi-quantitative TLC estimation of
composition in % and mg quantities of dosage
forms of dihydroartemisinin compared to the
manufacturer’s label claim (n = 6 for each
solvent system, total n = 12)
Remarks
based on
TLC results
HPLC determination of
composition of
dihydroartemisinin dosage
forms in % and mg
quantities
(n = 6)
Remarks
based on
HPLC
results
Solvent system 1
Toluene: Ethyl acetate
60 : 40
Solvent system 2
Toluene: Ethyl acetate
70 : 30
% range ±
rsd
Quantity
(mg)
% range ±
rsd
Quantity
(mg)
% ± rsd Quantity
(mg)
11Z3 DHA/PPQ:40/320 100-110 ± 5 40-44 95-105 ± 5 38-42 C 98.7 ± 0.2 39 C
12Z3 DHA/PPQ:40/320 84-94± 5 34-38 84-94± 5 34-38 NC 86 ± 2 34 NC
14Z3 DHA/PPQ:40/320 70-80 ± 5 28-32 70-80 ± 5 28-32 NC 70 ± 1 28 NC
16Z1 DHA/PPQ:40/320 90-100 ± 10 36-40 94-104± 5 38-42 C 97.5 ± 0.9 39 C
17Z1 DHA/PPQ:40/320 85-95 ± 10 34-38 85-95 ± 10 34-38 BLC 85 ± 1 34 NC
26Z1 DHA/PPQ:40/320 95-105 ± 10 38-42 95-105 ± 10 38-42 C 103 ± 1 41 C
27Z1 DHA/PPQ:40/320 102-112± 4 41-45 100-110 ± 5 40-44 BLC 88 ± 5 35 BLC
32Z3 DHA/PPQ:40/320 67-77 ± 5 27-31 66-76 ± 5 26-30 NC 73 ± 2 29 NC
33Z3 DHA/PPQ:40/320 62-72 ± 4 25-29 64-74 ± 5 26-30 NC 71 ± 1 28 NC
University of Ghana http://ugspace.ug.edu.gh
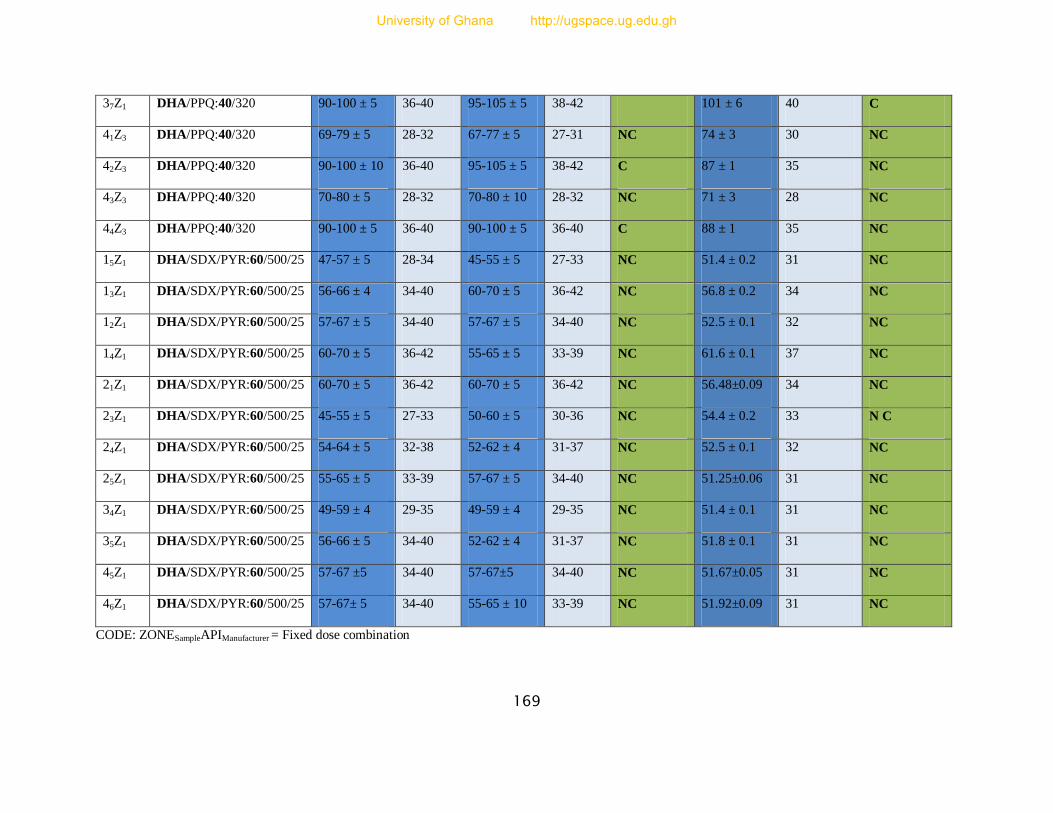
169
37Z1 DHA/PPQ:40/320 90-100 ± 5 36-40 95-105 ± 5 38-42 C 101 ± 6 40 C
41Z3 DHA/PPQ:40/320 69-79 ± 5 28-32 67-77 ± 5 27-31 NC 74 ± 3 30 NC
42Z3 DHA/PPQ:40/320 90-100 ± 10 36-40 95-105 ± 5 38-42 C 87 ± 1 35 NC
43Z3 DHA/PPQ:40/320 70-80 ± 5 28-32 70-80 ± 10 28-32 NC 71 ± 3 28 NC
44Z3 DHA/PPQ:40/320 90-100 ± 5 36-40 90-100 ± 5 36-40 C 88 ± 1 35 NC
15Z1 DHA/SDX/PYR:60/500/25 47-57 ± 5 28-34 45-55 ± 5 27-33 NC 51.4 ± 0.2 31 NC
13Z1 DHA/SDX/PYR:60/500/25 56-66 ± 4 34-40 60-70 ± 5 36-42 NC 56.8 ± 0.2 34 NC
12Z1 DHA/SDX/PYR:60/500/25 57-67 ± 5 34-40 57-67 ± 5 34-40 NC 52.5 ± 0.1 32 NC
14Z1 DHA/SDX/PYR:60/500/25 60-70 ± 5 36-42 55-65 ± 5 33-39 NC 61.6 ± 0.1 37 NC
21Z1 DHA/SDX/PYR:60/500/25 60-70 ± 5 36-42 60-70 ± 5 36-42 NC 56.48±0.09 34 NC
23Z1 DHA/SDX/PYR:60/500/25 45-55 ± 5 27-33 50-60 ± 5 30-36 NC 54.4 ± 0.2 33 N C
24Z1 DHA/SDX/PYR:60/500/25 54-64 ± 5 32-38 52-62 ± 4 31-37 NC 52.5 ± 0.1 32 NC
25Z1 DHA/SDX/PYR:60/500/25 55-65 ± 5 33-39 57-67 ± 5 34-40 NC 51.25±0.06 31 NC
34Z1 DHA/SDX/PYR:60/500/25 49-59 ± 4 29-35 49-59 ± 4 29-35 NC 51.4 ± 0.1 31 NC
35Z1 DHA/SDX/PYR:60/500/25 56-66 ± 5 34-40 52-62 ± 4 31-37 NC 51.8 ± 0.1 31 NC
45Z1 DHA/SDX/PYR:60/500/25 57-67 ±5 34-40 57-67±5 34-40 NC 51.67±0.05 31 NC
46Z1 DHA/SDX/PYR:60/500/25 57-67± 5 34-40 55-65 ± 10 33-39 NC 51.92±0.09 31 NC
CODE: ZONESampleAPIManufacturer = Fixed dose combination
University of Ghana http://ugspace.ug.edu.gh

170
Table 36: Percentage (%) and Mass (mg) quantities of results of sulphadoxine active pharmaceutical ingredient (API) by TLC
and HPLC methods and their comparisons with the manufacturer’s claim and pharmacopoeial requirements. Sulphadoxine
tablets must contain at least 90.0% and at most 110.0% of the labelled amount of Sulphadoxine on the pack
Code Manufacturer’s
Label Claim
(mg)
Semi-quantitative TLC estimation of composition in
% and mg quantities of dosage forms of
sulphadoxine compared to the manufacturer’s label
claim n = 6 for each solvent system, total n = 12)
Remarks
based on
TLC
results
HPLC determination of
composition of sulphadoxine
dosage forms in % and mg
quantities (n = 6)
Remarks
based on
HPLC
results Solvent system 1
Ethyl acetate/methanol/
Ammonia 80:15:5
Solvent system 2
Ethyl acetate/acetic acid/
water 60:20:20
% range ±
rsd
Quantity
(mg)
% range ±
rsd
Quantity
(mg)
% ± rsd Quantity
(mg)
11P10 SDX/PYR:500/25 80-90 ± 5 400-450 77-87±5 385-435 NC 78 ± 2 390 NC
11P2 SDX/PYR:500/25 82-92±4 410-460 80-90 ± 0 400-450 NC 87 ± 2 435 NC
12P2 SDX/PYR:500/25 70-80 ± 5 350-400 70-80 ± 5 350-400 NC 67 ± 4 335 NC
14P10 SDX/PYR:500/25 74-84± 5 370-420 77-87 ± 5 385-435 NC 85 ± 2 425 NC
14P2 SDX/PYR:500/25 79-89± 4 395-445 78-88 ± 5 390-440 NC 82 ± 2 410 NC
16P10 SDX/PYR:500/25 82-92± 4 410-460 80-90 ± 5 400-450 NC 83 ± 3 415 NC
21P15 SDX/PYR:500/25 77-87± 5 385-435 78-88 ± 4 390-440 NC 82 ± 3 410 NC
21P2 SDX/PYR:500/25 87-97± 5 435-485 80-90 ± 0 400-450 NC 77 ± 1 385 NC
22P2 SDX/PYR:500/25 85-95 ± 5 425-475 83-93 ± 5 415-465 NC 83 ± 2 415 NC
23P2 SDX/PYR:500/25 90-100± 5 450-500 90-100 ± 0 450-500 C 96 ± 2 480 C
University of Ghana http://ugspace.ug.edu.gh

171
31P10 SDX/PYR:500/25 94-104±5 470-520 85-95 ± 5 425-475 C 83 ± 2 415 NC
31P2 SDX/PYR:500/25 94-104± 5 470-520 90-100± 10 450-500 C 97 ± 3 485 C
32P10 SDX/PYR:500/25 85-95 ± 5 425-475 80-90 ± 0 400-450 NC 81 ± 2 405 NC
32P2 SDX/PYR:500/25 82-92 ± 4 410-460 82-92± 4 410-460 NC 85 ± 2 425 NC
33P10 SDX/PYR:500/25 70-80 ± 5 350-400 69-79 ± 4 345-395 NC 82 ± 2 410 NC
35P2 SDX/PYR:500/25 50-60 ± 0 250-300 50-60 ± 0 250-300 NC 53 ± 3 265 NC
37P15 SDX/PYR:500/25 70-80 ± 5 350-400 75-85 ± 5 375-425 NC 71 ± 2 355 NC
38P15 SDX/PYR:500/25 85-95± 10 425-475 85-95 ± 5 425-475 *BLC 91.7 ± 0.2 459 C
41P2 SDX/PYR:500/25 85-95 ± 5 425-475 80-90 ± 5 400-450 NC 89 ± 3 445 BLC
42P2 SDX/PYR:500/25 55-65 ± 5 275-325 52-62 ± 4 260-310 NC 47 ± 2 235 NC
44P2 SDX/PYR:500/25 72-82 ± 4 360-410 75-85 ± 10 375-425 NC 85.17 ± 0.06 426 NC
45P2 SDX/PYR:500/25 82-92 ± 4 410-460 85-95 ± 5 425-475 NC 85.1 ± 0.2 426 NC
48P5 SDX/PYR:500/25 87-97 ± 5 435-485 90-100± 10 450-500 BLC 85 ± 2 425 NC
*24Y13 ATS/SDX/PYR:100/500/25 79-89 ± 4 395-445 73-83 ± 5 365-415 NC 72 ± 2 360 NC
*4Y13 ATS/SDX/PYR:100/500/25 77-87 ± 5 385-435 77-87 ± 5 385-435 NC 89 ± 2 445 BLC
*34Y13 ATS/SDX/PYR:100/500/25 65-75 ± 5 325-375 63-73 ± 5 315-365 NC 74 ± 4 370 NC
*32Y13 ATS/SDX/PYR:100/500/25 64-74 ± 5 320-370 63-73 ± 5 315-365 NC 68 ± 5 340 NC
15Z1 DHA/SDX/PYR:60/500/25 84-94 ± 5 420-470 88-98 ± 4 440-490 BLC 85.694 ± 0 428 NC
University of Ghana http://ugspace.ug.edu.gh
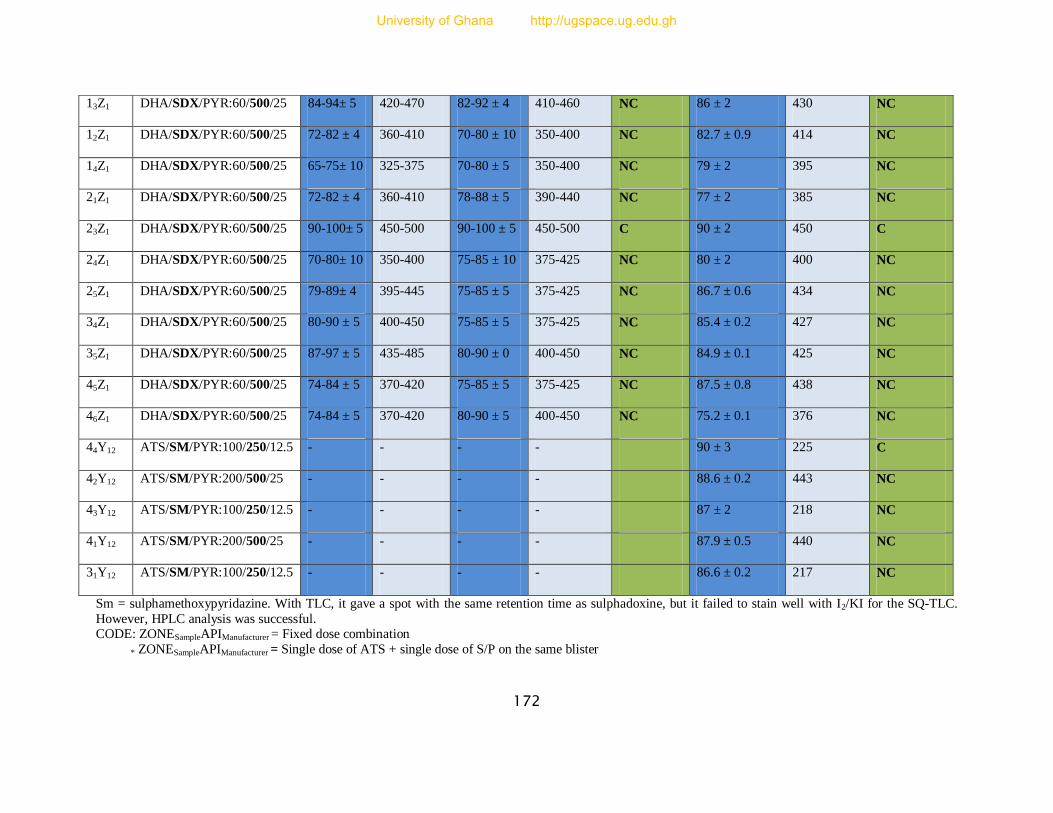
172
Sm = sulphamethoxypyridazine. With TLC, it gave a spot with the same retention time as sulphadoxine, but it failed to stain well with I2/KI for the SQ-TLC.
However, HPLC analysis was successful. CODE: ZONESampleAPIManufacturer = Fixed dose combination
* ZONESampleAPIManufacturer = Single dose of ATS + single dose of S/P on the same blister
13Z1 DHA/SDX/PYR:60/500/25 84-94± 5 420-470 82-92 ± 4 410-460 NC 86 ± 2 430 NC
12Z1 DHA/SDX/PYR:60/500/25 72-82 ± 4 360-410 70-80 ± 10 350-400 NC 82.7 ± 0.9 414 NC
14Z1 DHA/SDX/PYR:60/500/25 65-75± 10 325-375 70-80 ± 5 350-400 NC 79 ± 2 395 NC
21Z1 DHA/SDX/PYR:60/500/25 72-82 ± 4 360-410 78-88 ± 5 390-440 NC 77 ± 2 385 NC
23Z1 DHA/SDX/PYR:60/500/25 90-100± 5 450-500 90-100 ± 5 450-500 C 90 ± 2 450 C
24Z1 DHA/SDX/PYR:60/500/25 70-80± 10 350-400 75-85 ± 10 375-425 NC 80 ± 2 400 NC
25Z1 DHA/SDX/PYR:60/500/25 79-89± 4 395-445 75-85 ± 5 375-425 NC 86.7 ± 0.6 434 NC
34Z1 DHA/SDX/PYR:60/500/25 80-90 ± 5 400-450 75-85 ± 5 375-425 NC 85.4 ± 0.2 427 NC
35Z1 DHA/SDX/PYR:60/500/25 87-97 ± 5 435-485 80-90 ± 0 400-450 NC 84.9 ± 0.1 425 NC
45Z1 DHA/SDX/PYR:60/500/25 74-84 ± 5 370-420 75-85 ± 5 375-425 NC 87.5 ± 0.8 438 NC
46Z1 DHA/SDX/PYR:60/500/25 74-84 ± 5 370-420 80-90 ± 5 400-450 NC 75.2 ± 0.1 376 NC
44Y12 ATS/SM/PYR:100/250/12.5 - - - - 90 ± 3 225 C
42Y12 ATS/SM/PYR:200/500/25 - - - - 88.6 ± 0.2 443 NC
43Y12 ATS/SM/PYR:100/250/12.5 - - - - 87 ± 2 218 NC
41Y12 ATS/SM/PYR:200/500/25 - - - - 87.9 ± 0.5 440 NC
31Y12 ATS/SM/PYR:100/250/12.5 - - - - 86.6 ± 0.2 217 NC
University of Ghana http://ugspace.ug.edu.gh
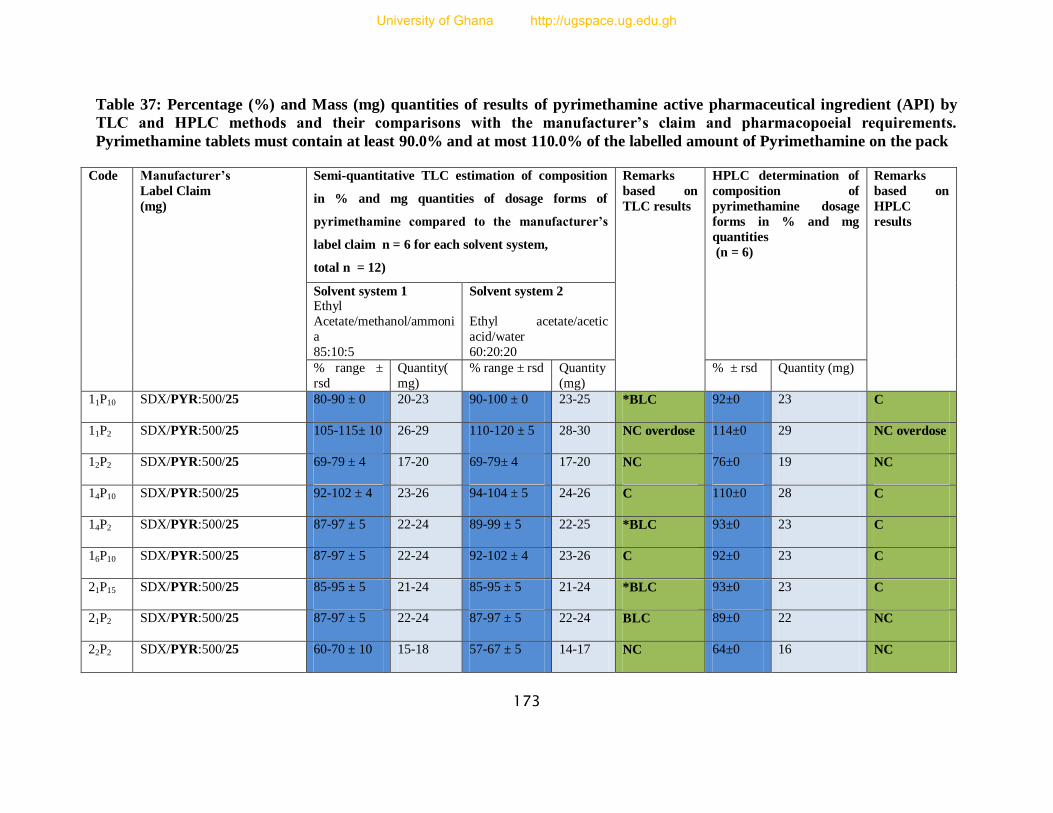
173
Table 37: Percentage (%) and Mass (mg) quantities of results of pyrimethamine active pharmaceutical ingredient (API) by
TLC and HPLC methods and their comparisons with the manufacturer’s claim and pharmacopoeial requirements.
Pyrimethamine tablets must contain at least 90.0% and at most 110.0% of the labelled amount of Pyrimethamine on the pack
Code Manufacturer’s
Label Claim
(mg)
Semi-quantitative TLC estimation of composition
in % and mg quantities of dosage forms of
pyrimethamine compared to the manufacturer’s
label claim n = 6 for each solvent system,
total n = 12)
Remarks
based on
TLC results
HPLC determination of
composition of
pyrimethamine dosage
forms in % and mg
quantities
(n = 6)
Remarks
based on
HPLC
results
Solvent system 1 Ethyl
Acetate/methanol/ammoni
a
85:10:5
Solvent system 2
Ethyl acetate/acetic
acid/water
60:20:20
% range ±
rsd
Quantity(
mg)
% range ± rsd Quantity
(mg)
% ± rsd Quantity (mg)
11P10 SDX/PYR:500/25 80-90 ± 0 20-23 90-100 ± 0 23-25 *BLC 92±0 23 C
11P2 SDX/PYR:500/25 105-115± 10 26-29 110-120 ± 5 28-30 NC overdose 114±0 29 NC overdose
12P2 SDX/PYR:500/25 69-79 ± 4 17-20 69-79± 4 17-20 NC 76±0 19 NC
14P10 SDX/PYR:500/25 92-102 ± 4 23-26 94-104 ± 5 24-26 C 110±0 28 C
14P2 SDX/PYR:500/25 87-97 ± 5 22-24 89-99 ± 5 22-25 *BLC 93±0 23 C
16P10 SDX/PYR:500/25 87-97 ± 5 22-24 92-102 ± 4 23-26 C 92±0 23 C
21P15 SDX/PYR:500/25 85-95 ± 5 21-24 85-95 ± 5 21-24 *BLC 93±0 23 C
21P2 SDX/PYR:500/25 87-97 ± 5 22-24 87-97 ± 5 22-24 BLC 89±0 22 NC
22P2 SDX/PYR:500/25 60-70 ± 10 15-18 57-67 ± 5 14-17 NC 64±0 16 NC
University of Ghana http://ugspace.ug.edu.gh
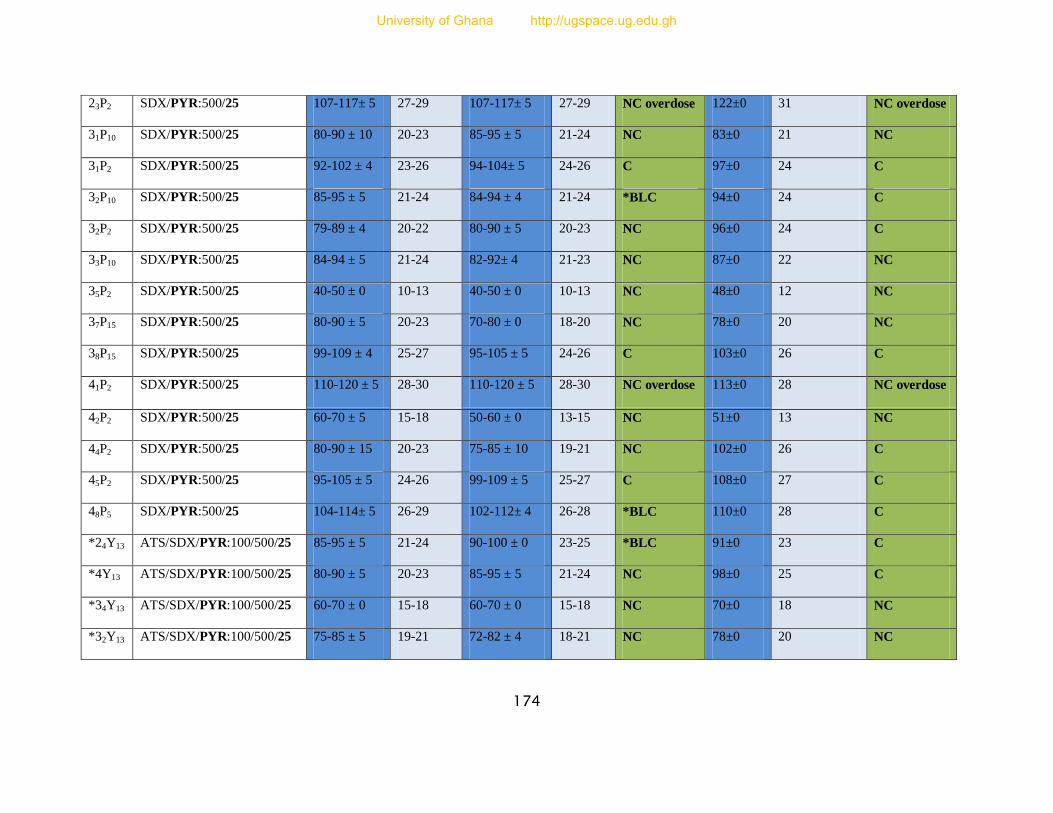
174
23P2 SDX/PYR:500/25 107-117± 5 27-29 107-117± 5 27-29 NC overdose 122±0 31 NC overdose
31P10 SDX/PYR:500/25 80-90 ± 10 20-23 85-95 ± 5 21-24 NC 83±0 21 NC
31P2 SDX/PYR:500/25 92-102 ± 4 23-26 94-104± 5 24-26 C 97±0 24 C
32P10 SDX/PYR:500/25 85-95 ± 5 21-24 84-94 ± 4 21-24 *BLC 94±0 24 C
32P2 SDX/PYR:500/25 79-89 ± 4 20-22 80-90 ± 5 20-23 NC 96±0 24 C
33P10 SDX/PYR:500/25 84-94 ± 5 21-24 82-92± 4 21-23 NC 87±0 22 NC
35P2 SDX/PYR:500/25 40-50 ± 0 10-13 40-50 ± 0 10-13 NC 48±0 12 NC
37P15 SDX/PYR:500/25 80-90 ± 5 20-23 70-80 ± 0 18-20 NC 78±0 20 NC
38P15 SDX/PYR:500/25 99-109 ± 4 25-27 95-105 ± 5 24-26 C 103±0 26 C
41P2 SDX/PYR:500/25 110-120 ± 5 28-30 110-120 ± 5 28-30 NC overdose 113±0 28 NC overdose
42P2 SDX/PYR:500/25 60-70 ± 5 15-18 50-60 ± 0 13-15 NC 51±0 13 NC
44P2 SDX/PYR:500/25 80-90 ± 15 20-23 75-85 ± 10 19-21 NC 102±0 26 C
45P2 SDX/PYR:500/25 95-105 ± 5 24-26 99-109 ± 5 25-27 C 108±0 27 C
48P5 SDX/PYR:500/25 104-114± 5 26-29 102-112± 4 26-28 *BLC 110±0 28 C
*24Y13 ATS/SDX/PYR:100/500/25 85-95 ± 5 21-24 90-100 ± 0 23-25 *BLC 91±0 23 C
*4Y13 ATS/SDX/PYR:100/500/25 80-90 ± 5 20-23 85-95 ± 5 21-24 NC 98±0 25 C
*34Y13 ATS/SDX/PYR:100/500/25 60-70 ± 0 15-18 60-70 ± 0 15-18 NC 70±0 18 NC
*32Y13 ATS/SDX/PYR:100/500/25 75-85 ± 5 19-21 72-82 ± 4 18-21 NC 78±0 20 NC
University of Ghana http://ugspace.ug.edu.gh
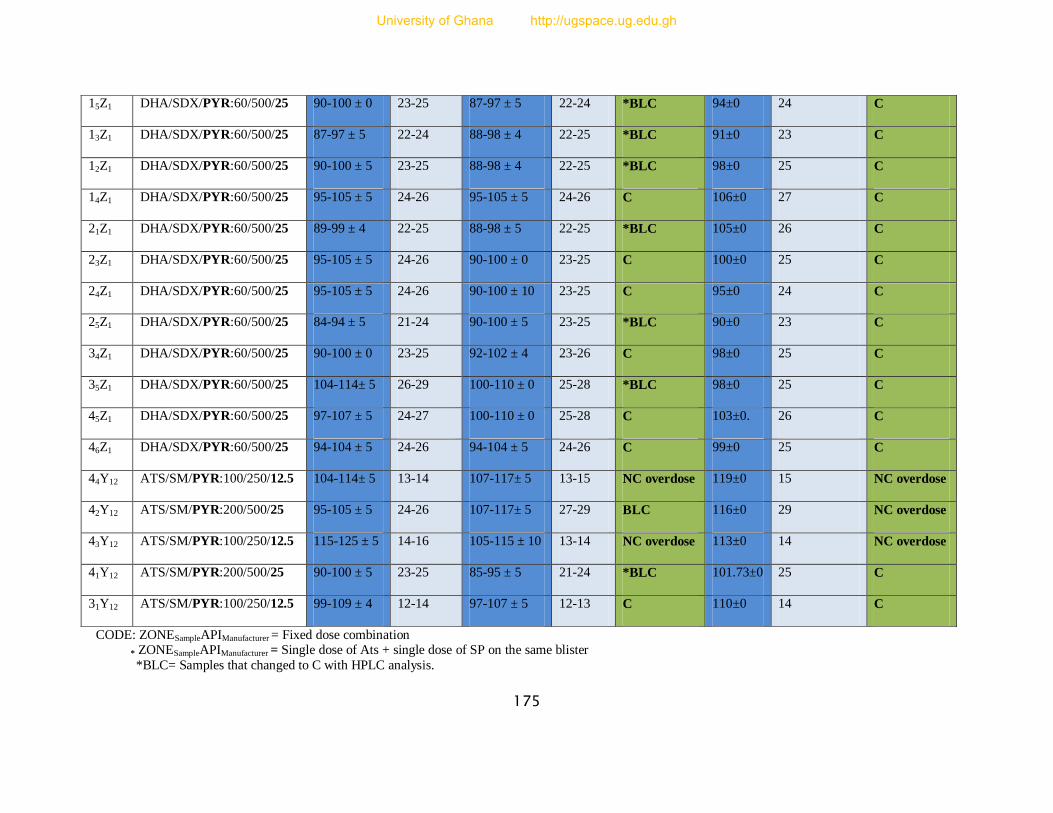
175
CODE: ZONESampleAPIManufacturer = Fixed dose combination
* ZONESampleAPIManufacturer = Single dose of Ats + single dose of SP on the same blister
*BLC= Samples that changed to C with HPLC analysis.
15Z1 DHA/SDX/PYR:60/500/25 90-100 ± 0 23-25 87-97 ± 5 22-24 *BLC 94±0 24 C
13Z1 DHA/SDX/PYR:60/500/25 87-97 ± 5 22-24 88-98 ± 4 22-25 *BLC 91±0 23 C
12Z1 DHA/SDX/PYR:60/500/25 90-100 ± 5 23-25 88-98 ± 4 22-25 *BLC 98±0 25 C
14Z1 DHA/SDX/PYR:60/500/25 95-105 ± 5 24-26 95-105 ± 5 24-26 C 106±0 27 C
21Z1 DHA/SDX/PYR:60/500/25 89-99 ± 4 22-25 88-98 ± 5 22-25 *BLC 105±0 26 C
23Z1 DHA/SDX/PYR:60/500/25 95-105 ± 5 24-26 90-100 ± 0 23-25 C 100±0 25 C
24Z1 DHA/SDX/PYR:60/500/25 95-105 ± 5 24-26 90-100 ± 10 23-25 C 95±0 24 C
25Z1 DHA/SDX/PYR:60/500/25 84-94 ± 5 21-24 90-100 ± 5 23-25 *BLC 90±0 23 C
34Z1 DHA/SDX/PYR:60/500/25 90-100 ± 0 23-25 92-102 ± 4 23-26 C 98±0 25 C
35Z1 DHA/SDX/PYR:60/500/25 104-114± 5 26-29 100-110 ± 0 25-28 *BLC 98±0 25 C
45Z1 DHA/SDX/PYR:60/500/25 97-107 ± 5 24-27 100-110 ± 0 25-28 C 103±0. 26 C
46Z1 DHA/SDX/PYR:60/500/25 94-104 ± 5 24-26 94-104 ± 5 24-26 C 99±0 25 C
44Y12 ATS/SM/PYR:100/250/12.5 104-114± 5 13-14 107-117± 5 13-15 NC overdose 119±0 15 NC overdose
42Y12 ATS/SM/PYR:200/500/25 95-105 ± 5 24-26 107-117± 5 27-29 BLC 116±0 29 NC overdose
43Y12 ATS/SM/PYR:100/250/12.5 115-125 ± 5 14-16 105-115 ± 10 13-14 NC overdose 113±0 14 NC overdose
41Y12 ATS/SM/PYR:200/500/25 90-100 ± 5 23-25 85-95 ± 5 21-24 *BLC 101.73±0 25 C
31Y12 ATS/SM/PYR:100/250/12.5 99-109 ± 4 12-14 97-107 ± 5 12-13 C 110±0 14 C
University of Ghana http://ugspace.ug.edu.gh
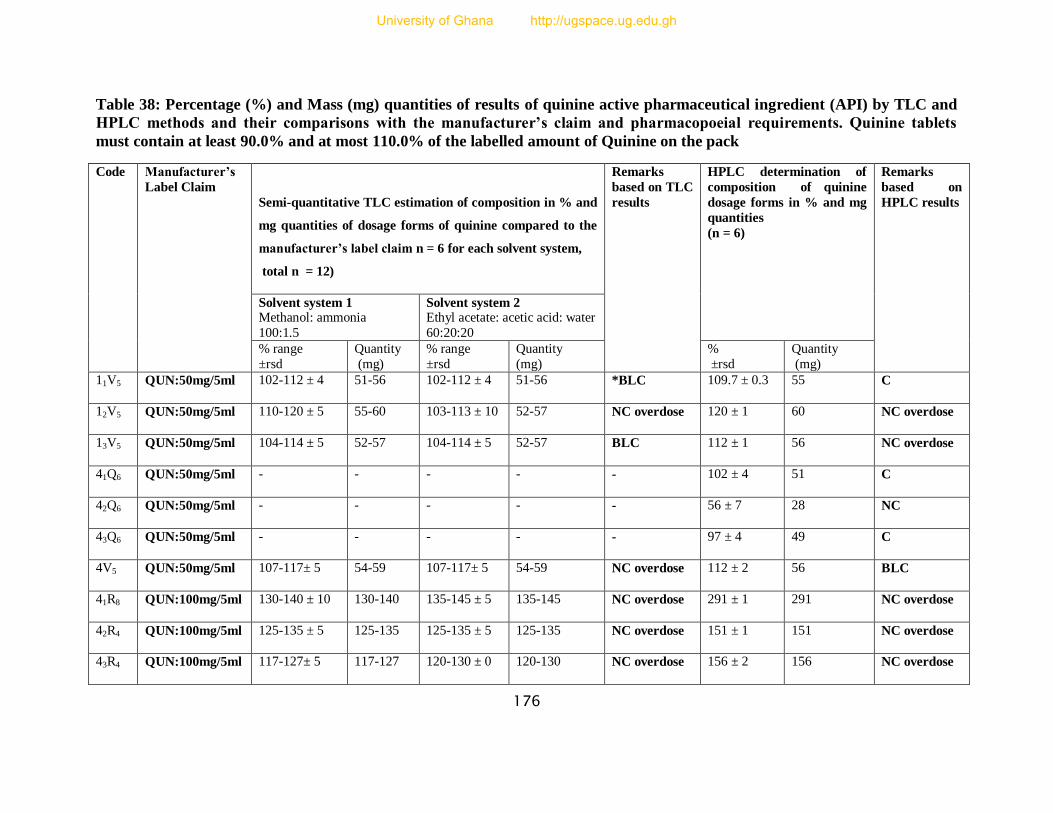
176
Table 38: Percentage (%) and Mass (mg) quantities of results of quinine active pharmaceutical ingredient (API) by TLC and
HPLC methods and their comparisons with the manufacturer’s claim and pharmacopoeial requirements. Quinine tablets
must contain at least 90.0% and at most 110.0% of the labelled amount of Quinine on the pack
Code Manufacturer’s
Label Claim
Semi-quantitative TLC estimation of composition in % and
mg quantities of dosage forms of quinine compared to the
manufacturer’s label claim n = 6 for each solvent system,
total n = 12)
Remarks
based on TLC
results
HPLC determination of
composition of quinine
dosage forms in % and mg
quantities
(n = 6)
Remarks
based on
HPLC results
Solvent system 1 Methanol: ammonia
100:1.5
Solvent system 2 Ethyl acetate: acetic acid: water
60:20:20
% range
±rsd
Quantity
(mg)
% range
±rsd
Quantity
(mg)
%
±rsd
Quantity
(mg)
11V5 QUN:50mg/5ml 102-112 ± 4 51-56 102-112 ± 4 51-56 *BLC 109.7 ± 0.3 55 C
12V5 QUN:50mg/5ml 110-120 ± 5 55-60 103-113 ± 10 52-57 NC overdose 120 ± 1 60 NC overdose
13V5 QUN:50mg/5ml 104-114 ± 5 52-57 104-114 ± 5 52-57 BLC 112 ± 1 56 NC overdose
41Q6 QUN:50mg/5ml - - - - - 102 ± 4 51 C
42Q6 QUN:50mg/5ml - - - - - 56 ± 7 28 NC
43Q6 QUN:50mg/5ml - - - - - 97 ± 4 49 C
4V5 QUN:50mg/5ml 107-117± 5 54-59 107-117± 5 54-59 NC overdose 112 ± 2 56 BLC
41R8 QUN:100mg/5ml 130-140 ± 10 130-140 135-145 ± 5 135-145 NC overdose 291 ± 1 291 NC overdose
42R4 QUN:100mg/5ml 125-135 ± 5 125-135 125-135 ± 5 125-135 NC overdose 151 ± 1 151 NC overdose
43R4 QUN:100mg/5ml 117-127± 5 117-127 120-130 ± 0 120-130 NC overdose 156 ± 2 156 NC overdose
University of Ghana http://ugspace.ug.edu.gh
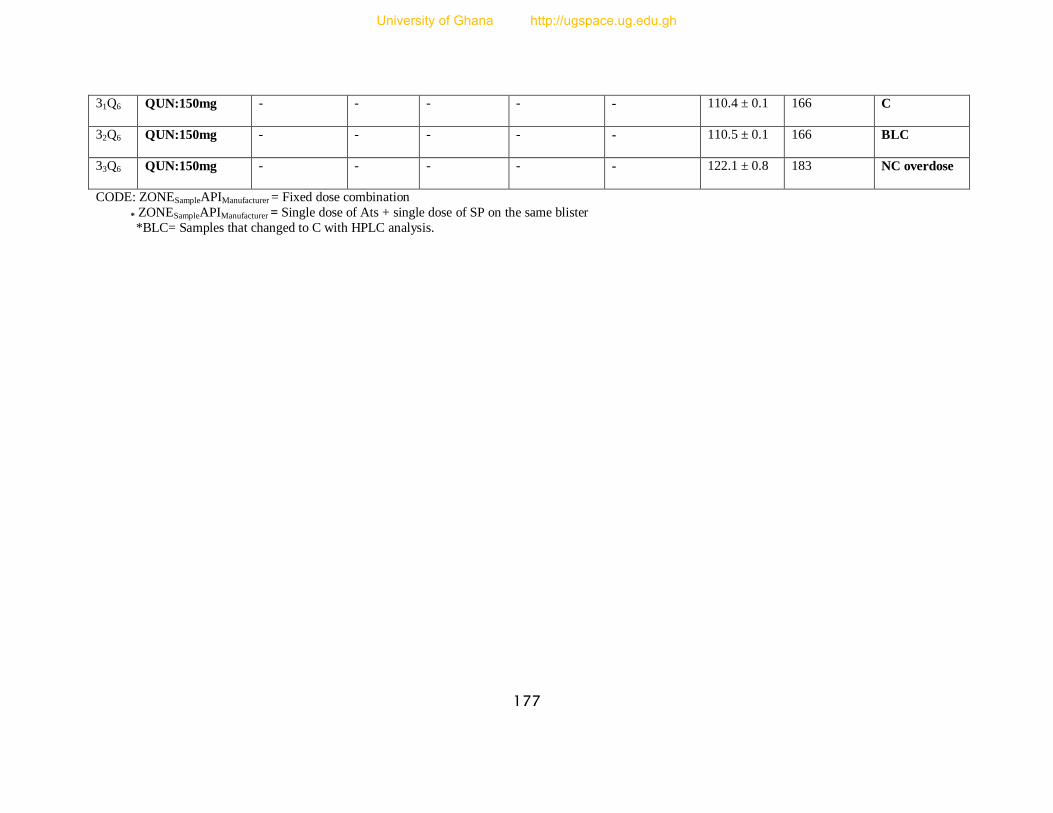
177
31Q6 QUN:150mg - - - - - 110.4 ± 0.1 166 C
32Q6 QUN:150mg - - - - - 110.5 ± 0.1 166 BLC
33Q6 QUN:150mg - - - - - 122.1 ± 0.8 183 NC overdose
CODE: ZONESampleAPIManufacturer = Fixed dose combination
* ZONESampleAPIManufacturer = Single dose of Ats + single dose of SP on the same blister
*BLC= Samples that changed to C with HPLC analysis.
University of Ghana http://ugspace.ug.edu.gh

178
APPENDIX III
Table 39: Samples with the same batch number and their respective masses (mg)
Batch No. Samples with the same batch number and their masses
S-60
14P10 16P10 11P10 31P10 32P10 33P10
85mg/110mg 83mg/92mg 78mg/92mg 83mg/83mg 81mg/94mg 82mg/87mg
10011
11P2 14P2 21P2 35P2
87mg/114mg 82mg/93mg 77mg/89mg 53mg/48mg
10008
31P2 44P2 12P2
97mg/97mg 85mg/102mg 67mg/76mg
OK 159
12V5 4V5
120mg 112mg
LD-266
112X1 15X1 17X1
101mg/103mg 67mg/111mg 81mg/59mg
LD-259
19X1 113X1 110X1 22X1 44X1
103mg/114mg 140mg/110mg 124mg/63mg 131mg/63mg 143mg/104mg
LF-249
14X1 16X1 33X1 43X1
69mg/115mg 163mg/127mg 81mg/108mg 174mg/82mg
University of Ghana http://ugspace.ug.edu.gh

179
LN-450
18X1 21X1
163mg/79mg 97mg/113mg
LS-39
12X1 31X1 32X1
120mg/113mg 92mg/117mg 97mg/117mg
SB0100I
12X11 11X11
103mg/123mg 93mg/127mg
C0520J
31X11 13X11
39mg/119mg 40mg/85mg
1105062
12X14 11X14 24X14
35mg/95mg 75mg/69mg 53mg/118mg
PX-161
17Z1 16Z1 26Z1
85mg/- 98mg/- 103mg/-
AP-18
15Z1 13Z1 12Z1 25Z1 21Z1 34Z1 45Z1
51mg/86mg/94mg 57mg/86mg/91mg 53mg/83mg/98mg 51mg/87mg/90mg 56mg/77mg/105mg 51mg/85mg/98mg (52/88/105)mg
110123
14Z3 12Z3 11Z3 33Z3 44Z3 43Z3 41Z3
70mg/- 86mg/- 99mg/- 71mg/- 88mg/- 71mg/- 74mg/-
AP-16 24Z1 23Z1 35Z1
University of Ghana http://ugspace.ug.edu.gh
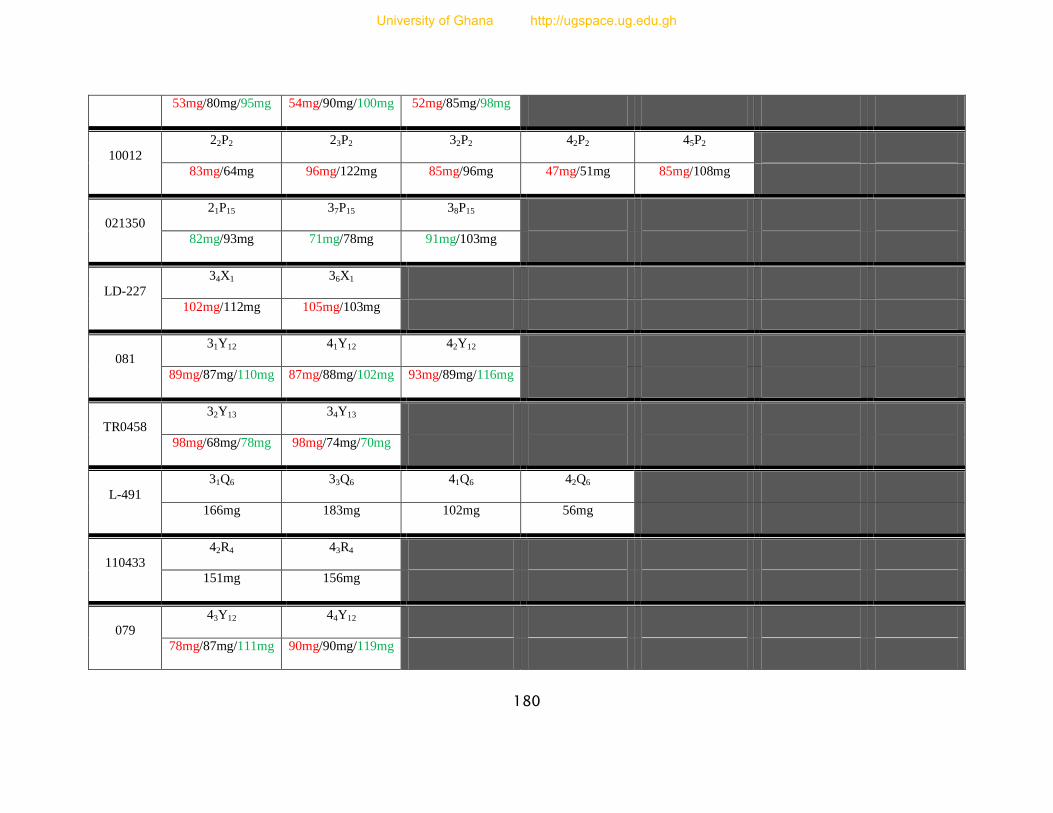
180
53mg/80mg/95mg 54mg/90mg/100mg 52mg/85mg/98mg
10012
22P2 23P2 32P2 42P2 45P2
83mg/64mg 96mg/122mg 85mg/96mg 47mg/51mg 85mg/108mg
021350
21P15 37P15 38P15
82mg/93mg 71mg/78mg 91mg/103mg
LD-227
34X1 36X1
102mg/112mg 105mg/103mg
081
31Y12 41Y12 42Y12
89mg/87mg/110mg 87mg/88mg/102mg 93mg/89mg/116mg
TR0458
32Y13 34Y13
98mg/68mg/78mg 98mg/74mg/70mg
L-491
31Q6 33Q6 41Q6 42Q6
166mg 183mg 102mg 56mg
110433
42R4 43R4
151mg 156mg
079
43Y12 44Y12
78mg/87mg/111mg 90mg/90mg/119mg
University of Ghana http://ugspace.ug.edu.gh
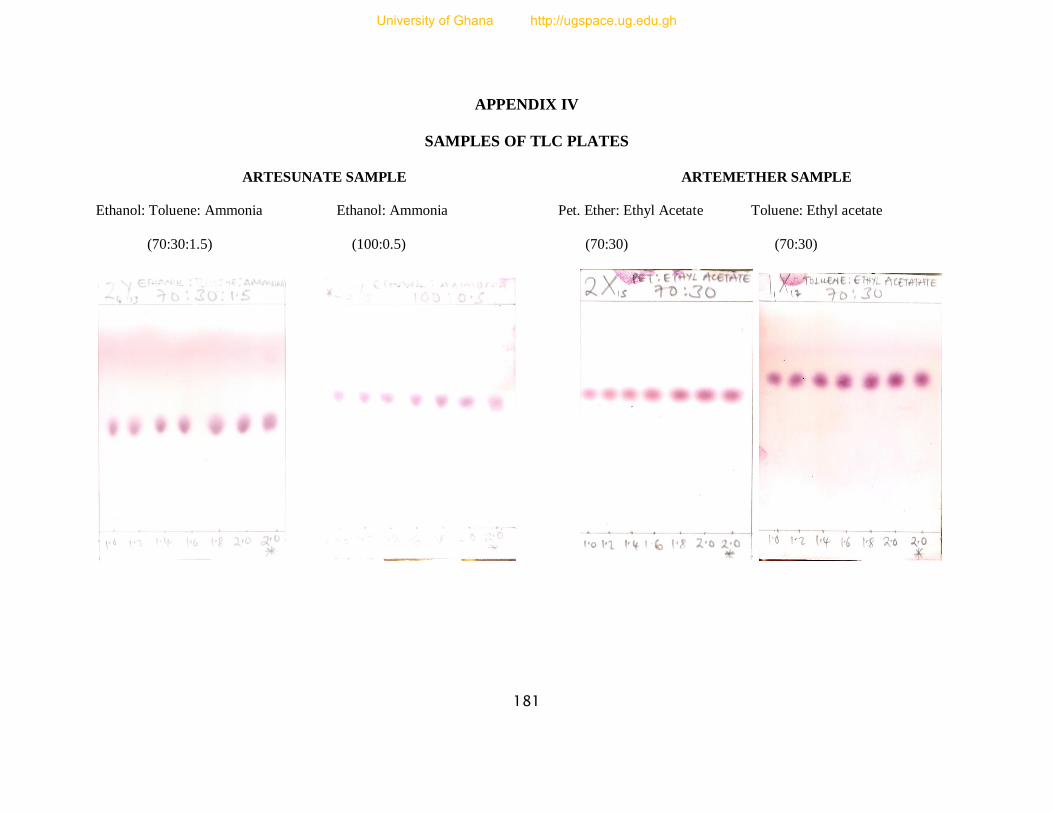
181
APPENDIX IV
SAMPLES OF TLC PLATES
ARTESUNATE SAMPLE ARTEMETHER SAMPLE
Ethanol: Toluene: Ammonia Ethanol: Ammonia Pet. Ether: Ethyl Acetate Toluene: Ethyl acetate
(70:30:1.5) (100:0.5) (70:30) (70:30)
University of Ghana http://ugspace.ug.edu.gh

182
LUMEFANTRINE SAMPLE DIHYDROARTEMISININ SAMPLE
Ethyl Acetate: Acetic acid:Toluene Ethyl acetate: Acetic acid Toluene: Ethyl acetate Toluene: Ethyl acetate
(4:2:18) (10:5) (60:40) (70:30)
University of Ghana http://ugspace.ug.edu.gh
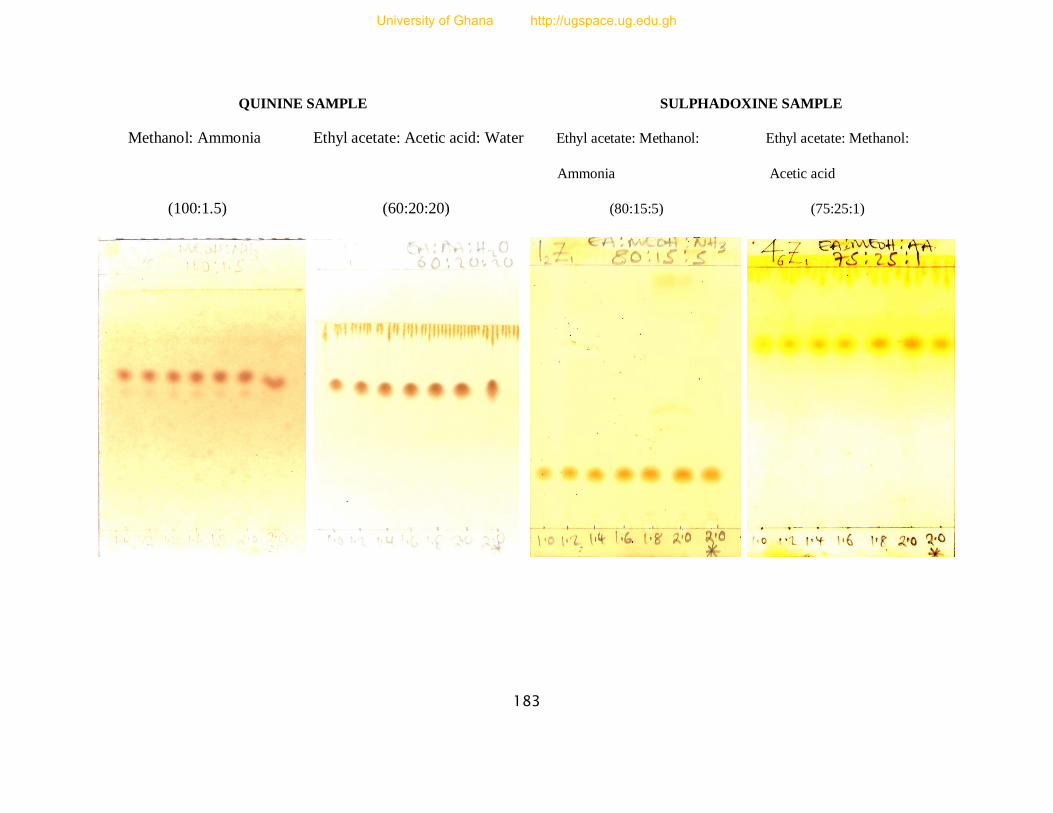
183
QUININE SAMPLE SULPHADOXINE SAMPLE
Methanol: Ammonia Ethyl acetate: Acetic acid: Water Ethyl acetate: Methanol: Ethyl acetate: Methanol:
Ammonia Acetic acid
(100:1.5) (60:20:20) (80:15:5) (75:25:1)
University of Ghana http://ugspace.ug.edu.gh
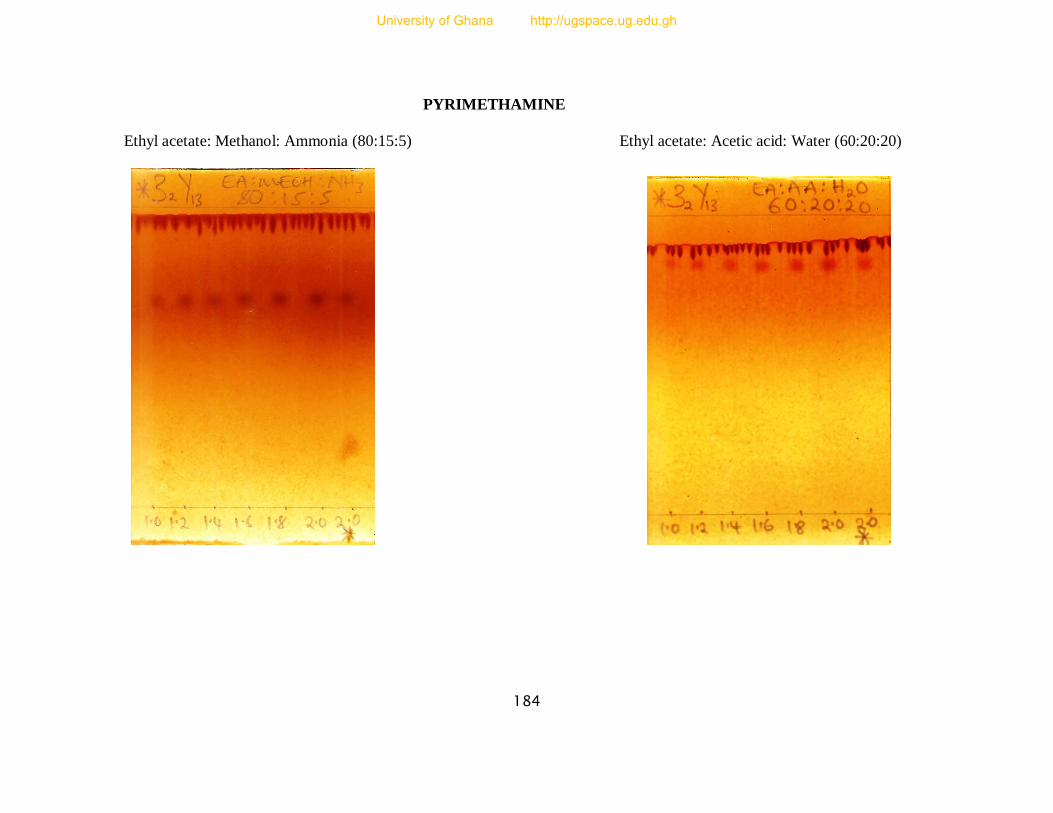
184
PYRIMETHAMINE
Ethyl acetate: Methanol: Ammonia (80:15:5) Ethyl acetate: Acetic acid: Water (60:20:20)
University of Ghana http://ugspace.ug.edu.gh
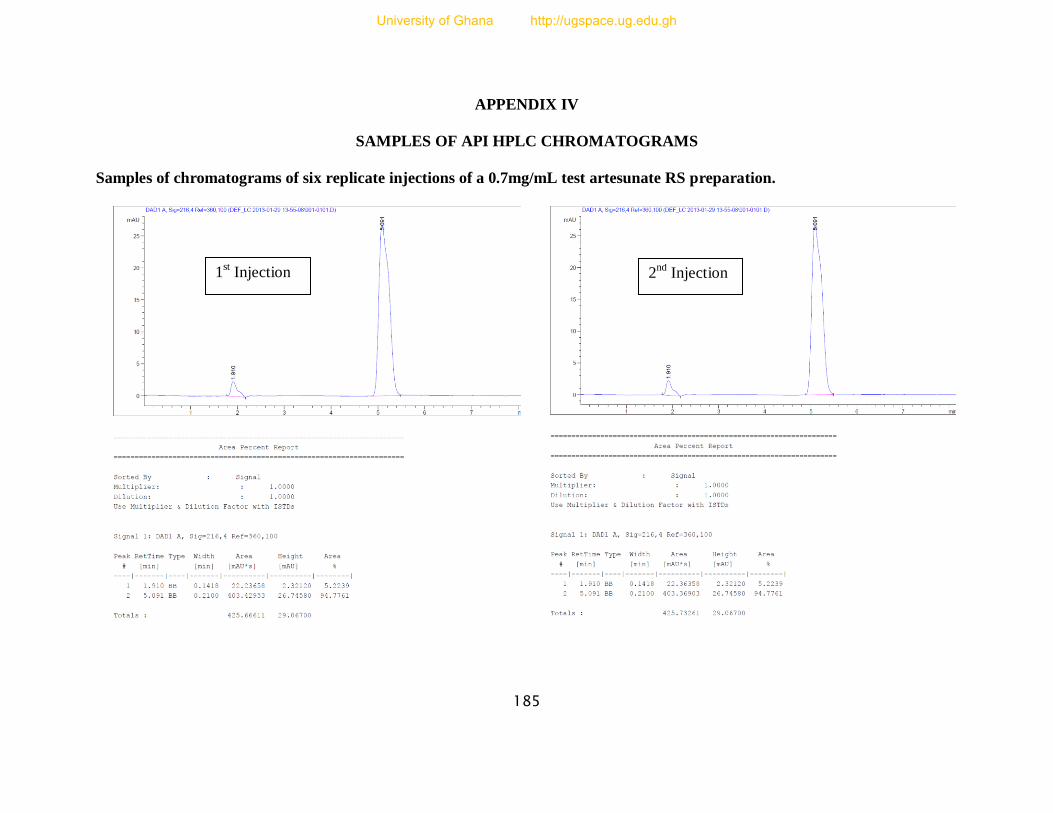
185
APPENDIX IV
SAMPLES OF API HPLC CHROMATOGRAMS
Samples of chromatograms of six replicate injections of a 0.7mg/mL test artesunate RS preparation.
1st Injection 2
nd Injection
University of Ghana http://ugspace.ug.edu.gh
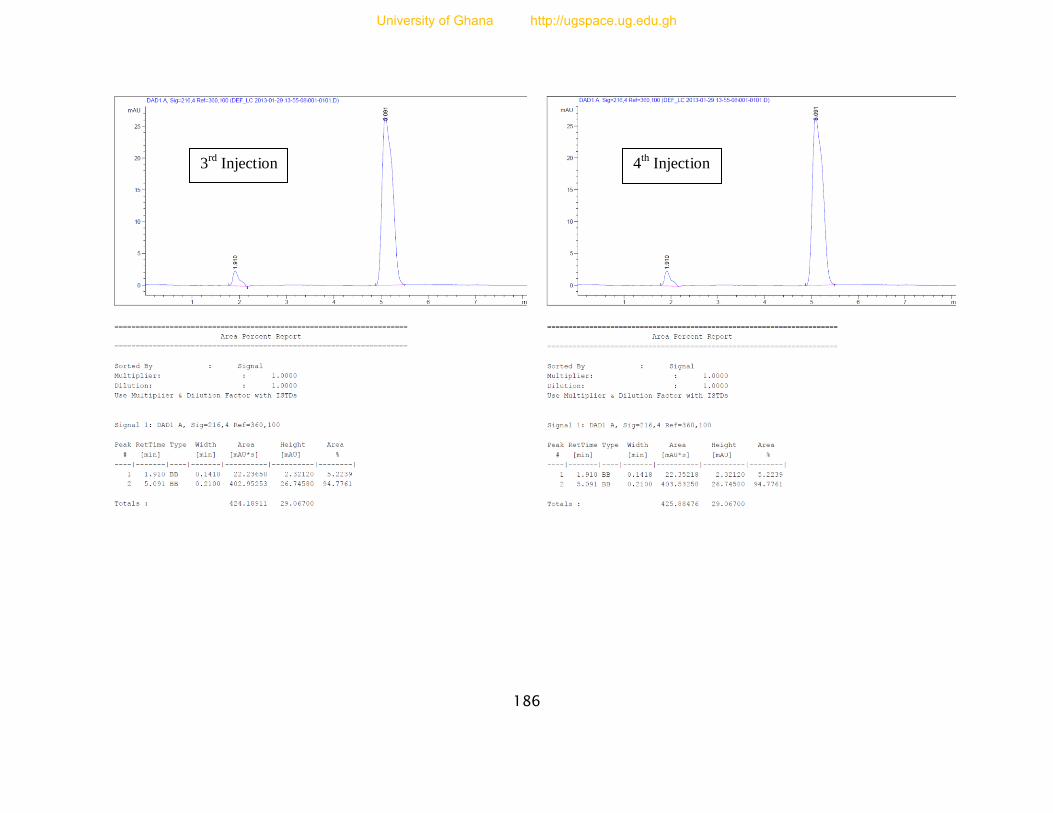
186
3rd
Injection 4th Injection
University of Ghana http://ugspace.ug.edu.gh
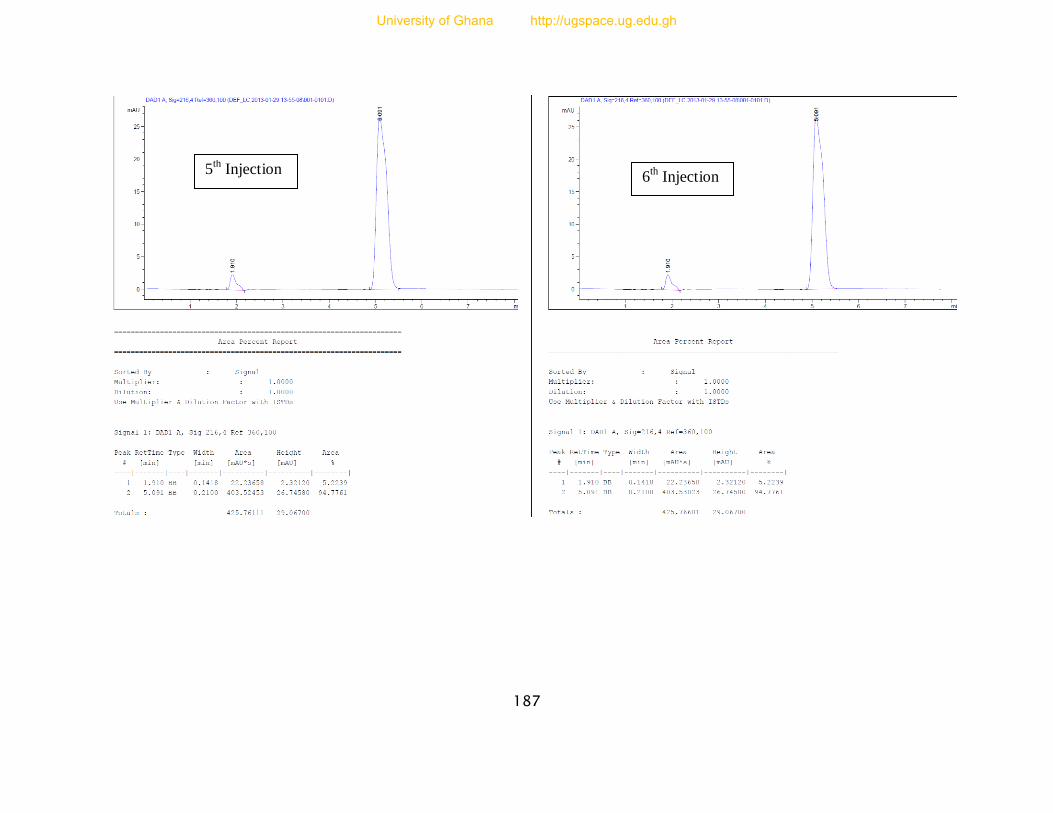
187
5th Injection
6th Injection
University of Ghana http://ugspace.ug.edu.gh
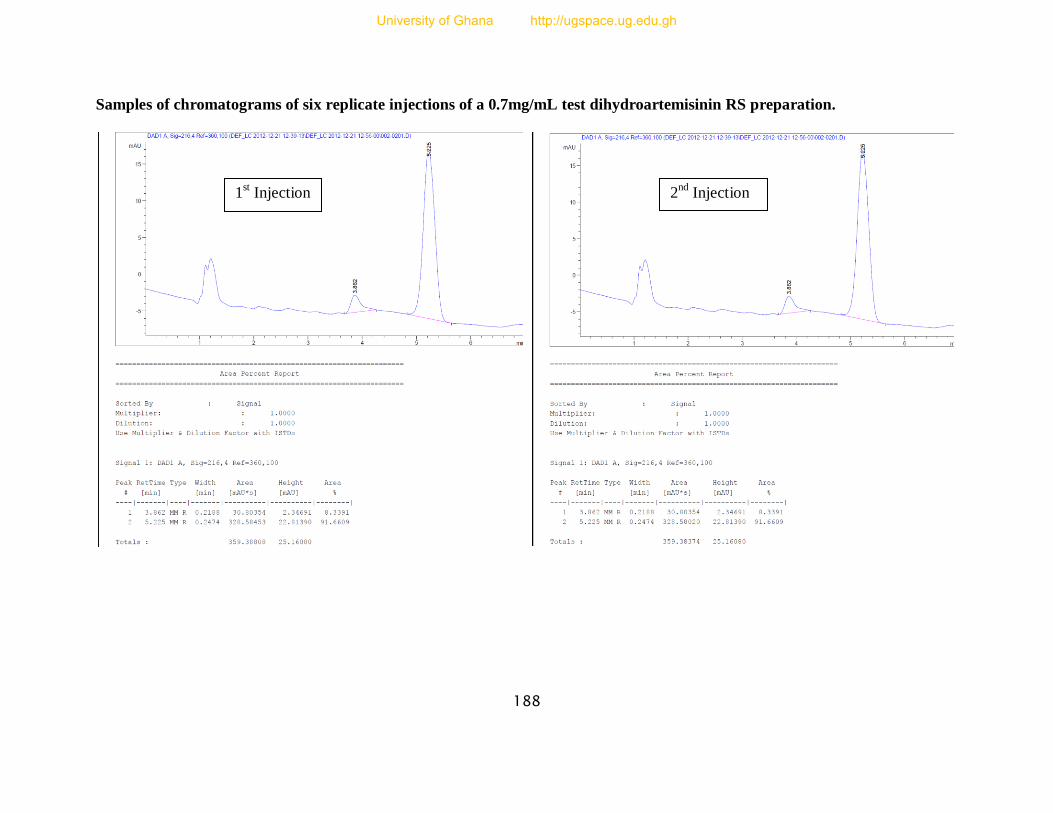
188
Samples of chromatograms of six replicate injections of a 0.7mg/mL test dihydroartemisinin RS preparation.
1st Injection 2
nd Injection
University of Ghana http://ugspace.ug.edu.gh
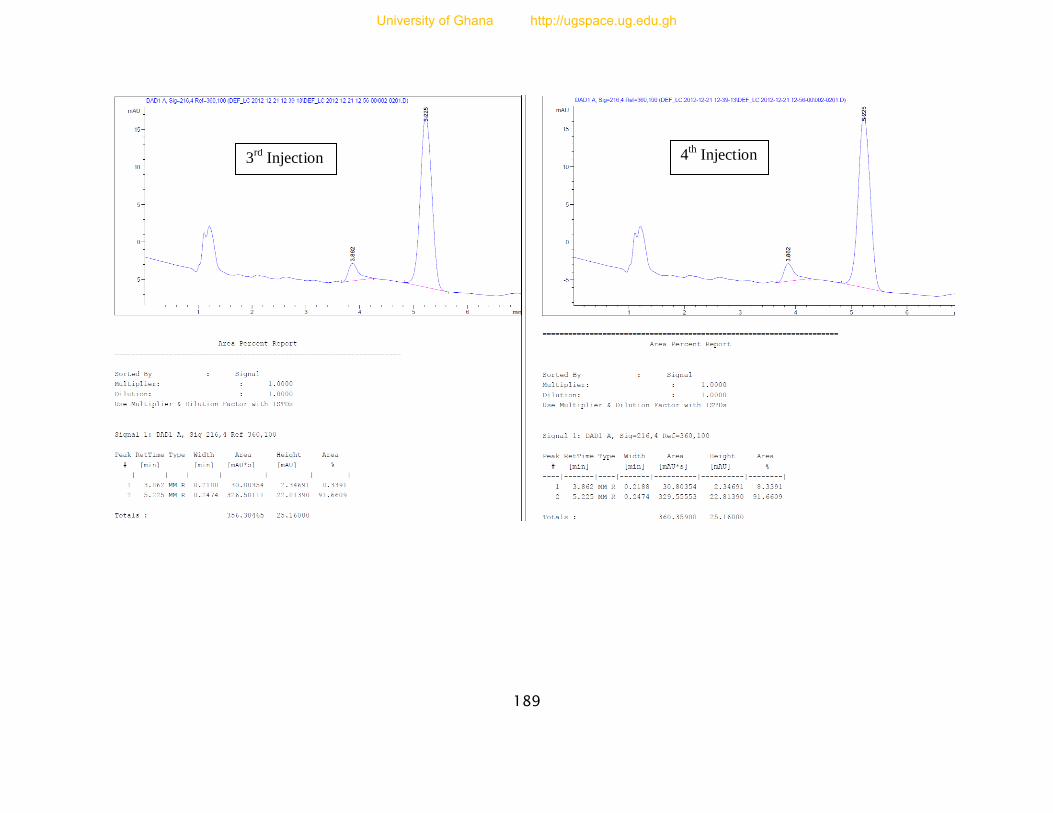
189
3rd
Injection 4th Injection
University of Ghana http://ugspace.ug.edu.gh
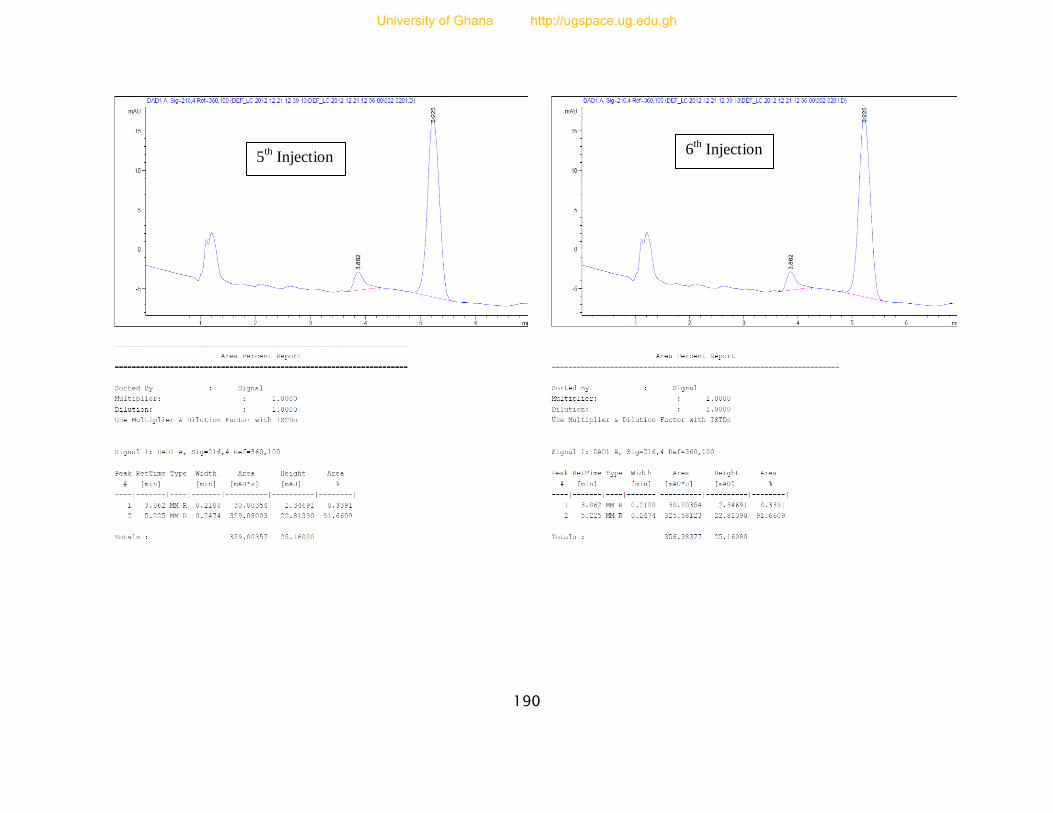
190
5th Injection
6th Injection
University of Ghana http://ugspace.ug.edu.gh

191
Samples of chromatograms of six replicate injections of a 0.4mg/mL test quinine RS preparation.
1st Injection 2
nd Injection
University of Ghana http://ugspace.ug.edu.gh
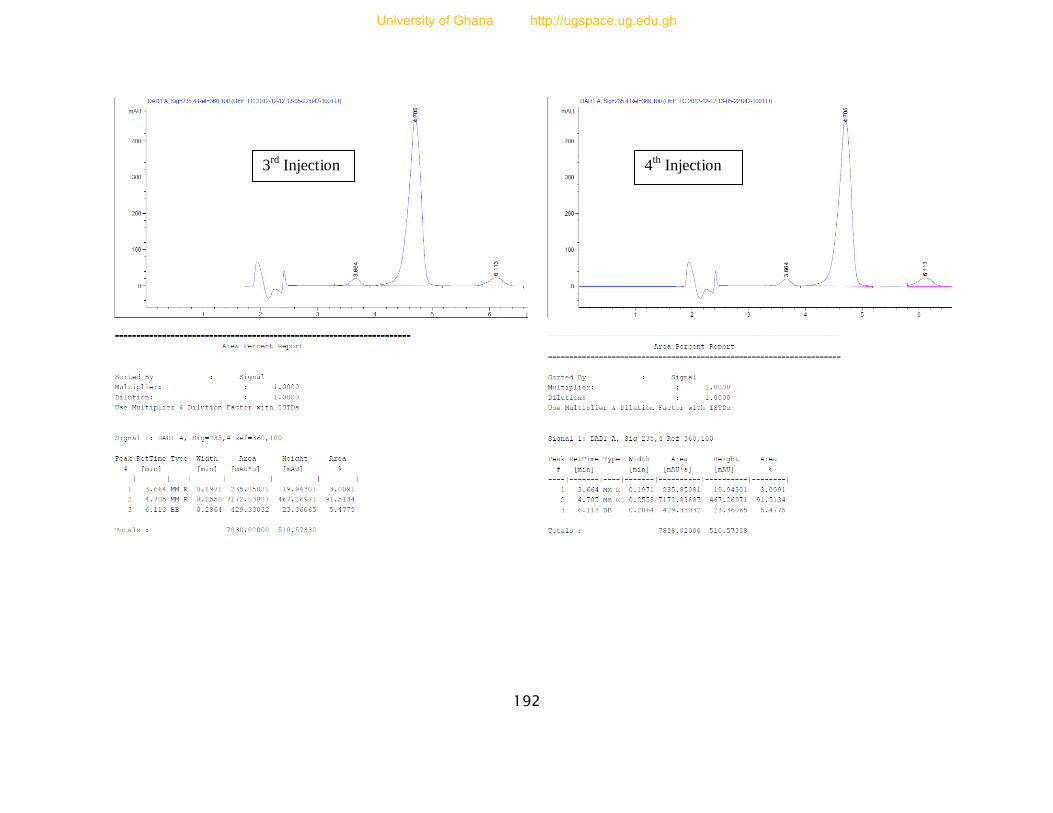
192
3rd
Injection 4th
Injection
University of Ghana http://ugspace.ug.edu.gh
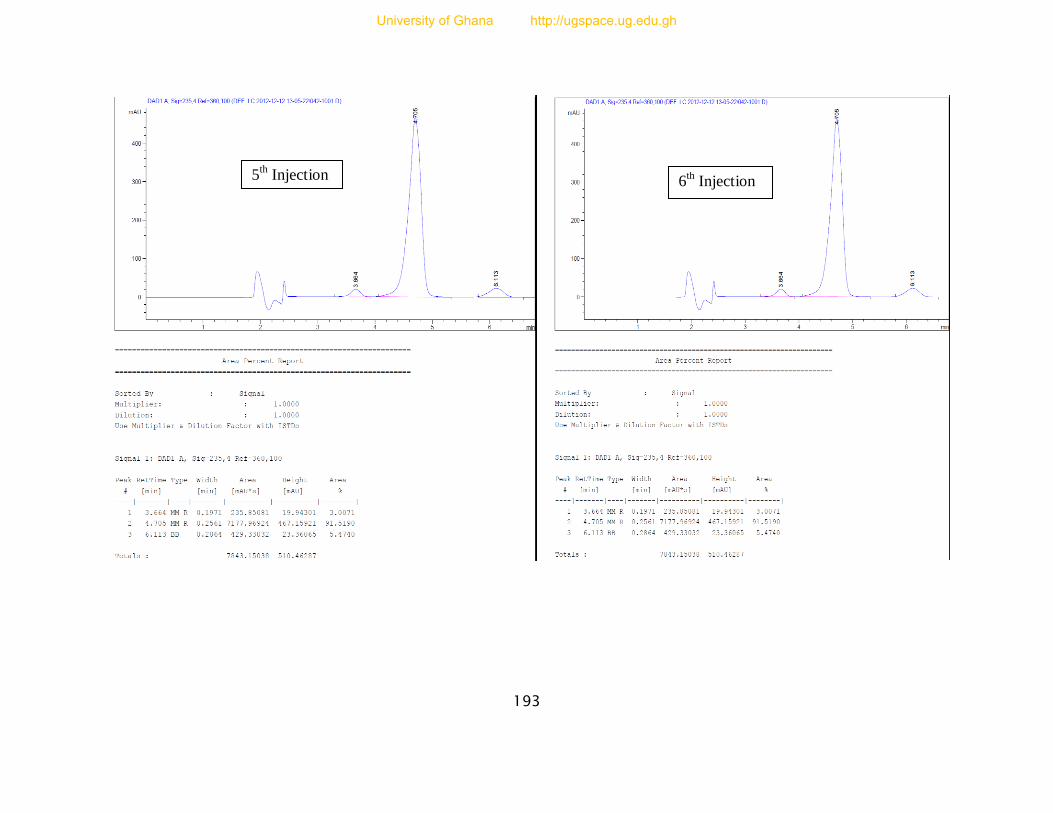
193
5th Injection 6
th Injection
University of Ghana http://ugspace.ug.edu.gh
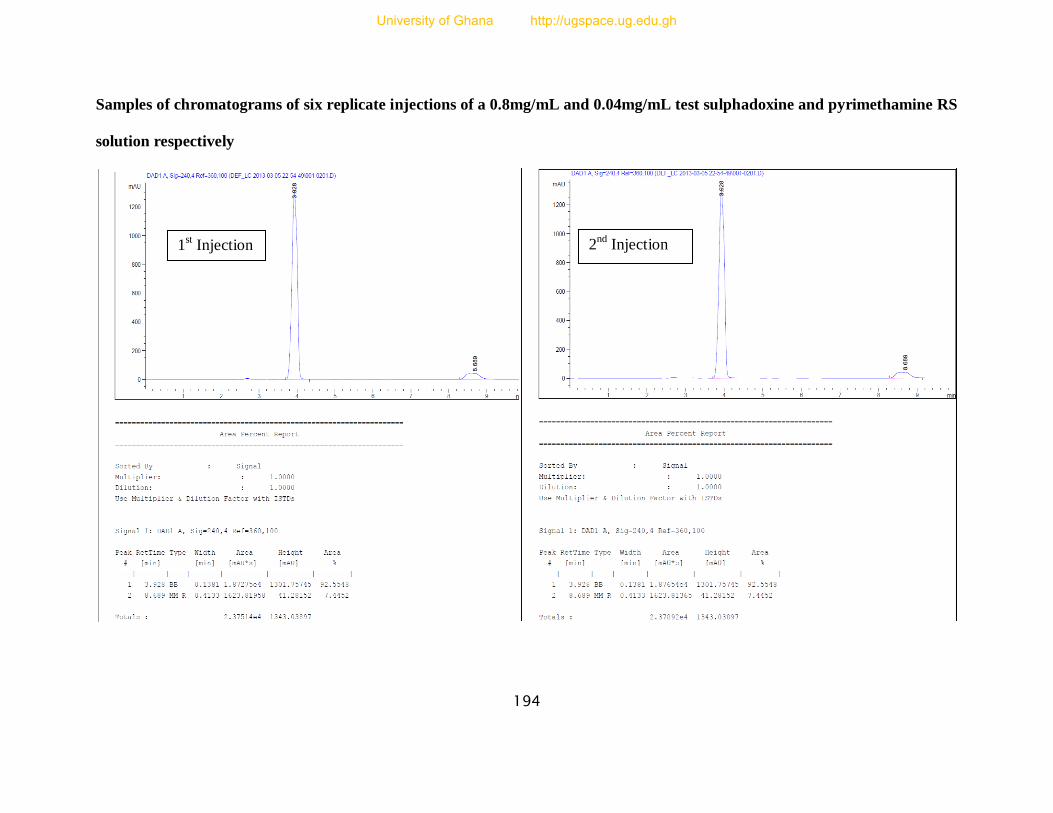
194
Samples of chromatograms of six replicate injections of a 0.8mg/mL and 0.04mg/mL test sulphadoxine and pyrimethamine RS
solution respectively
1st Injection 2
nd Injection
University of Ghana http://ugspace.ug.edu.gh
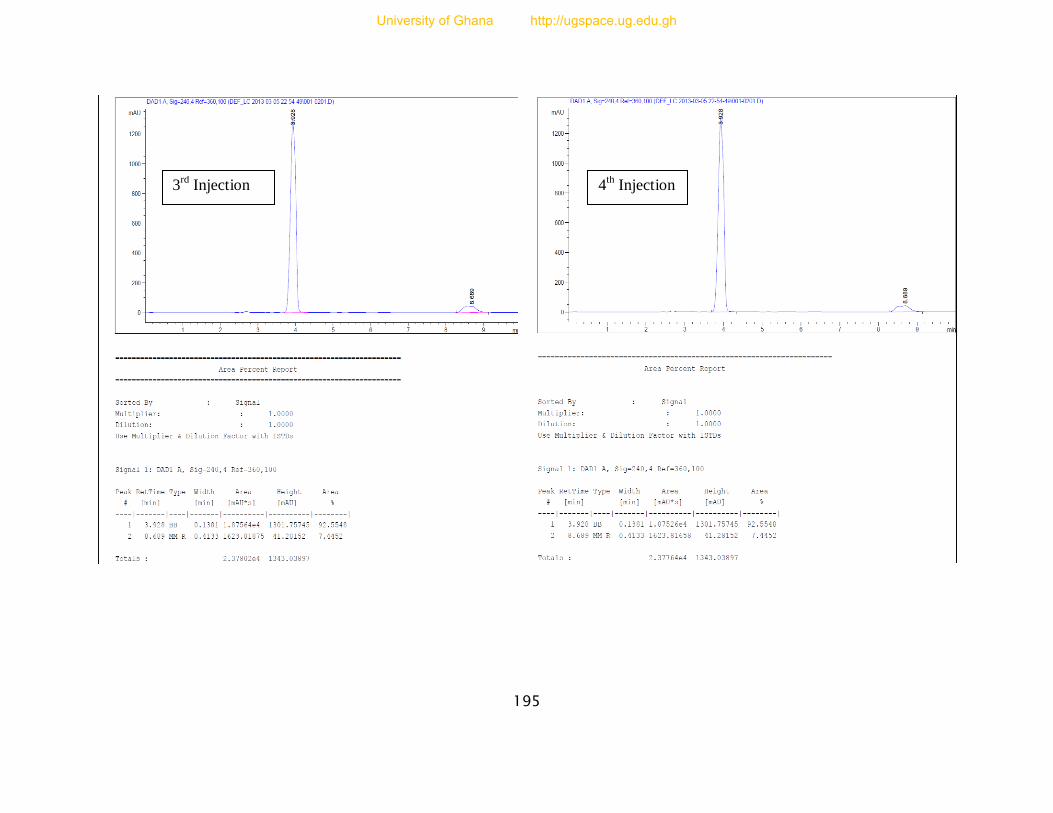
195
3rd
Injection 4th Injection
University of Ghana http://ugspace.ug.edu.gh
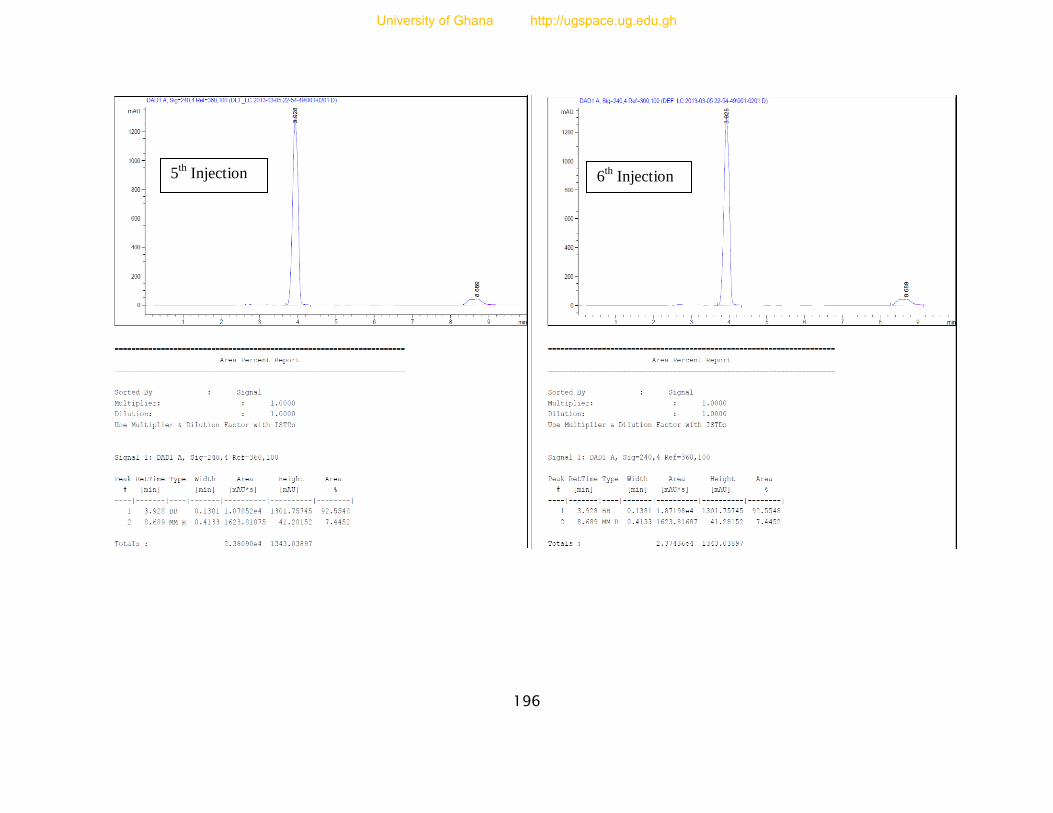
196
5th Injection 6
th Injection
University of Ghana http://ugspace.ug.edu.gh
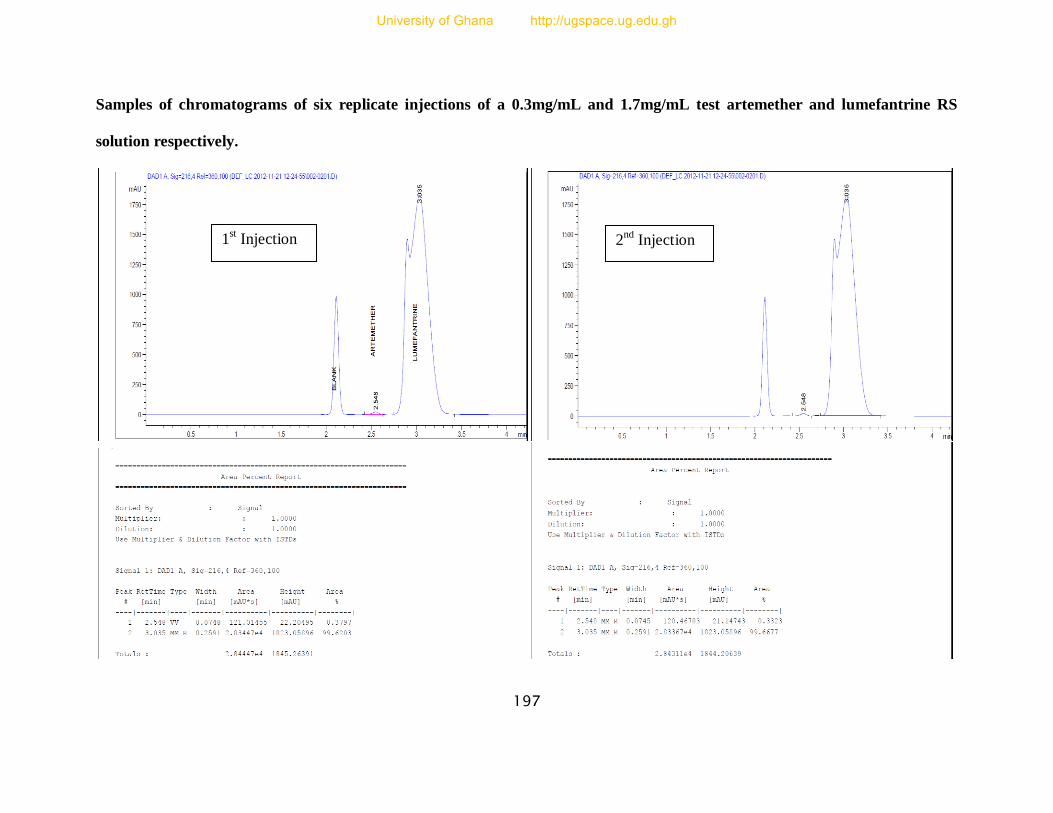
197
Samples of chromatograms of six replicate injections of a 0.3mg/mL and 1.7mg/mL test artemether and lumefantrine RS
solution respectively.
1st Injection 2
nd Injection
University of Ghana http://ugspace.ug.edu.gh

198
3rd
Injection 4
th Injection
University of Ghana http://ugspace.ug.edu.gh
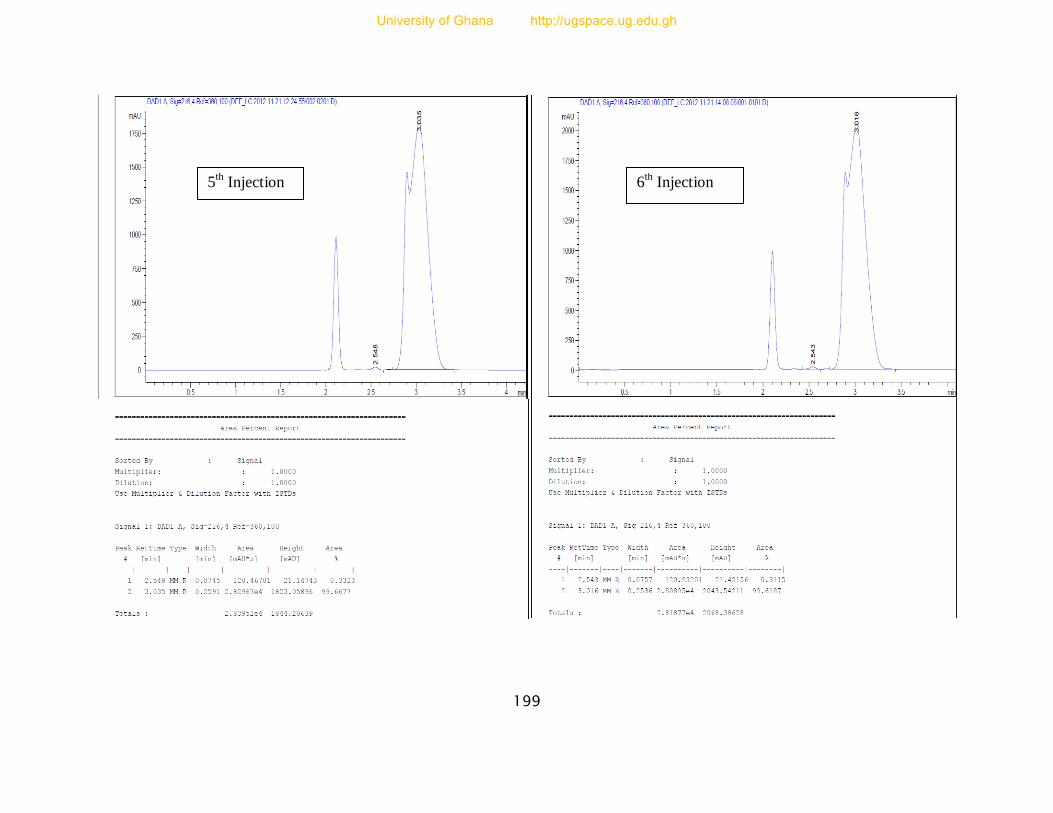
199
5th Injection 6
th Injection
University of Ghana http://ugspace.ug.edu.gh