Embed Size (px)
Citation preview

Post-harvest losses in potato value chains in Kenya Analysis and recommendations for reduction strategies
Published by
2
Table of Contents
ABSTRACT 6EXECUTIVE SUMMARY 7 1 InTRodUCTIon 11 1.1 Study objective 11 1.2 Concept of food loss 11 1.2.1 The study approach 11 1.2.2 Definition of loss and critical loss points 12
2 METhodologY 14 2.1 Sampling of counties and value chain actors 14 2.2 Measurement 17 2.3 Load tracking 18
3 PoTATo VAlUE ChAIn In KEnYA – SURVEY RESUlTS 19 3.1 Background 19 3.2 Potato production 21 3.2.1 Ware potato growers 21 3.2.2 Comparison between contracted and non-contracted farmers 28 3.3 Potato marketing 30 3.3.1 Brokers at the farm level 30 3.3.2 Wholesale and retail trade 31 3.3.3 Supermarkets 35 3.3.4 Restaurants 35 3.4 Potato processing 36 4 AnAlYSIS oF Food loSSES And oPTIonS FoR Food loSS REdUCTIon 38 4.1 Assessment of quantitative and financial losses in the potato value chain 38 4.2 Challenges and options for food loss reduction 43 4.2.1 Seed improvements 43 4.2.2 Improved production and harvesting technologies 44 4.2.3 Improved post-harvest handling 45 4.2.4 Improved conditions for the processing industry 46 4.2.5 Capacity building and agricultural finance 47 4.3 List of important actors in the potato sub-sector 48 AnnEX 51 Annex 1: Surveys details and methodology 51 Annex 2: Further survey data 54
QUESTIonnAIRES 67
REFEREnCES 78
Table of CoNTeNTS

3Table of CoNTeNTS
list of tablesTable 1: Critical loss points along the potato value chain 13Table 2: Breakdown of farmer samples 16Table 3: Breakdown of samples of other value chain actors 16Table 4: Traditional potato measures 18Table 5: Traditional measures and their metric conversions 18Table 6: Main potato producing counties and the total area under potato production in Kenya 19Table 7: Land holdings and farming practices 22Table 8: Potato varieties grown 23Table 9: Farmers who experience losses during production and harvest 25Table 10: Sorting and grading practices 26Table 11: Potato storage practices 26Table 12: Losses in storage 27Table 13: Farmers’ transport and marketing practices 28Table 14: Contracted and non-contracted farmers in Bomet and Nyandarua Counties 29Table 15: Potato traders repacking bags 32Table 16: Results of bag tracking in kg 34Table 17: Results of opening bags at different markets 34Table 18: Characteristics of restaurants (multiple choice) 36Table 19: Market shares of different market channels in the potato value chain 36Table 20: Synopsis of reported damage/loss along the value chain 38Table 21: Production and loss/damage at the farm level 39Table 22: Weight and losses at the trader level in kg and % per bag 40Table 23: Average potato purchase prices in October/November 2013 41Table 24: Financial calculation of damage and loss occurring along the ware potato value chain 42Table 25: Relevant institutions and actors along the potato value chain 48Table 26: Surveys by county 51Table 27: Study methodology following the FAO’s five-stage approach 53Table 28: Characteristics of potato farmers 54Table 29: Farmers’ education levels by gender (%) 54Table 30: Characteristics of potato traders 54Table 31: Traders’ educational levels by gender (%) 55Table 32: Main challenges farmers face in potato production as a % (multiple choice) 55Table 33: Potato seed used by farmers 55Table 34: Seasons for potato planting and harvesting expressed – relevance as a % 57Table 35: Potato pre-harvesting practices 57Table 36: Potato harvesting practices - time and protection from sunlight 58Table 37: Potato harvesting practices - second gathering and handling of leftovers 58Table 38: Potato harvesting practices - tools and labour 59Table 39: Losses experienced on farms 60Table 40: Potato marketing practices 61

4 Table of CoNTeNTS
Table 41: Farm-gate potato prices 61Table 42: Main sourcing and sales markets of traders 63Table 43: Most common bag types bought by traders 63Table 44: Trader-perceived advantages and disadvantages of the main packaging materials 64Table 45: Traders’ preferences for potato varieties and reasons for these preferences (ranking) 64Table 46: Current lowest and highest purchase price 65Table 47: Causes of loss and suggested improvements (multiple choice) 65Table 48: Restauranteurs’ perceptions of the benefits of different potato varieties as a % 66 list of FiguresFigure 1: Synopsis of reported damage and loss occurring within different market channels of the potato value chain 8Figure 2: Map showing the four counties surveyed 15Figure 3: Ware potato value chain 21
list of graphsGraph 1: Causes of damages at retail level 33Graph 2: Use and quality of potatoes 41Graph 3: Types of seed used by farmers, as a % 56Graph 4: Number of seasons after which farmers renew seed, as a % 56Graph 5: Months with highest and lowest farm-gate prices – relevance of month in % 62
list of PhotographsPhotograph 1: The Shangi potato variety 23Photograph 2: Fork jembe 25Photograph 3: Seed potato storage – diffused light store 27Photograph 4: Brokers on site filling extended bags 30Photograph 5: Loading and handling of extended bags at Nairobi’s Wakulima Market 30Photograph 6: Conditions at Nairobi’s Wakulima wholesale market 31Photograph 7: Retailer selling out of an opened extended bag 32Photograph 8: Potato sample from load tracking 34

5Table of CoNTeNTS
AbbreviationsBMZ German Federal Ministry for Economic Cooperation and DevelopmentCIP International Potato CenterDLS Diffused light storeEUR EuroFAO Food and Agriculture OrganizationFPEAK Fresh Produce Exporters Association of Kenya FSP Food Security PortalGAP Good agricultural practicesGFP German Food PartnershipGIZ Deutsche Gesellschaft für Internationale Zusammenarbeit (GIZ) GmbHGIZ PSDA Private Sector Development in Agriculture ProgrammeHa HectareHCDA Horticultural Crops Development AuthorityILO International Labour OrganizationKARI Kenyan Agricultural Research InstituteKENFAP Kenyan National Federation of Agricultural ProducersKENOPOFA Kenya National Potato Farmers AssociationKEPHIS Kenya Plant Health Inspectorate ServiceKES Kenyan ShillingKIRDI Kenya Industrial Research and Development InstituteKFA Kenya Farmers AssociationKfW KfW Entwicklungsbankkg KilogramMoALF Ministry of Agriculture, Livestock and FisheriesNPCK National Potato Council of Kenya PHL Post-harvest loss SNRD Sector Network Rural Development
Currency exchange rate: eUR 1 = KeS 118

6 abSTRaCT
Abstract
Potato is the second most important food crop in Kenya after maize and is mostly cultivated by smallholders. The Kenyan Government has recognised the critical role potatoes play in alleviating food shortages given that potato provides higher yields compared to maize and is less affected by climate change. The issue of food loss is a highly important factor in securing the stable produc-tion required to combat hunger and raise incomes. food security is a priority area of German development policy. Therefore, the German federal Ministry for economic Cooperation and Development (bMZ) launched the special unit “one World – No Hunger” in order to inten-sify its dedication to alleviate hunger and malnutrition. This study, commissioned by Deutsche Gesellschaft für Internationale Zusammenarbeit (GIZ) on behalf of bMZ, contributes to these efforts.
The survey on food loss in the potato sub-sector was completed by 247 potato farmers, more than 70 market-ers (brokers, traders, retailers and supermarkets), 3 processors and 10 restaurants. The farmers interviewed were based in the main production areas and thus were more commercially oriented, and, although these farmers’ yields come in above average, they are still low in comparison to yields projected by the Kenyan agricultural Research Institute. The survey showed that up to 95 per cent of recorded damage and loss occurs at the production level and is caused in particular by inappropriate harvesting tools and an insufficiently
trained workforce. With a market share of up to 80 per cent, the retail level is most affected by this, given that any resulting low-quality produce is then supplied to the markets. However, the absence of market signals stress-ing ‘better prices for better quality tubers’ contributes to the low performance in potato production.
The financial assessment of potato damage and loss along the value chain exposes the economic impact of this low performance in potato production. Per season, 19 per cent of produce is damaged or lost. extrapolating these losses to the national production level, we can assume that 815,000 tonnes are damaged or lost each year, representing a value of around KeS 12.9 billion (eUR 109 million).
This study on post-harvest losses of potato contributes to the efforts of the Kenyan Government and private sector to improve the development of the potato value chain. To strengthen market linkages in the potato value chain, it is necessary to stimulate and enhance coop-eration and coordination between the different actors. The intro duction of standardised bags along with per-weight payment and the expansion of contract farming present opportunities to support the market linkage of small-scale farmers. However, an important condition for cooperation is trust between the actors in the value chain.

public and private institutions in Kenya, and also with data from international sources. a verification workshop representing different actors and institutions in the sub-sector was held to discuss the results and elicit further thoughts regarding evaluation and reporting.
Potato is an important food crop in Kenya and is mostly cultivated by smallholders. Potatoes are mainly sold on the market as fresh produce and are then subsequently processed into different foodstuffs at the household or industrial level. Many factors contribute to the loss and damage of produce. at the production level, farmer prac-tices engender heavy losses. land preparation and soil management are poorly conducted, and pests and dis-eases are ineffectively controlled, leading to low yields. a recent survey showed that bacterial wilt was the most prevalent disease, affecting 77 per cent of potato farmers, followed by late blight (67 per cent) and viral diseases (12 per cent) (Kaguongo et al. 2014).
a shortage of clean seed is also contributing to this loss: available certified potato seed meets less than 5 per cent of the national demand for seed potato (Gildemacher et al. 2012). added to this, there is a shortage of high-yield-ing varieties. The farmers interviewed are based in the main production areas and are thus more commercially oriented, achieving yields of 13.5 tonnes per hectare per season. These yields are above average (7-10 tonnes/ha) but are still low when compared to the 25-tonne yields often realised by professional farmers using certified seed and sound agricultural practices. However, the absence of market signals stressing ‘better prices for better qual-ity tubers’ contributes to the low performance in potato production.
The survey showed that up to 95 per cent of recorded damage and loss occurs at the production level and is caused in particular by inappropriate harvesting tools and an insufficiently trained workforce. all produce ear-marked for the fresh food market is packed in so-called extended bags, which farmers and brokers fill with un-selected harvested potatoes – i.e. they include green, cut, bruised or rotten produce. of the potatoes placed on the market, nearly a quarter are damaged or green. almost all of these potatoes are eventually sold, but the quality is-sues mean prices must sometimes be lowered.
every year, a significant proportion of food produced for human consumption is lost or wasted. annual losses have been estimated at about 1.3 billion tonnes by the UN food and agriculture organization (fao 2011). In light of rising food prices, widespread food insecurity and growing pressure on natural resources, avoidable food loss and waste is not acceptable. The world’s natural resources – such as its soil, water, fossil fuels and nutri-ents – are limited and must be used in a more efficient and responsible manner.
The term food wastage, as used by the fao, encompasses both food loss and food waste. Wastage occurs along the entire food value chain and varies in extent depending on the produce and the region. In developing countries, food loss occurs mostly in the post-harvest stages, during marketing and processing.
This study focuses on food loss in the harvesting, pro-cessing and marketing stages. Its main aim is to improve data availability on food loss in an important food value chain in Kenya and to identify options for German Development Cooperation to engage in food loss reduc-tion programmes.1
The scope of the study was to describe a typical value chain for potatoes (from harvest to retailer), providing quantitative and qualitative analysis of food loss, detect hot spots for loss, determining the causes of food loss, identifying important actors and partners in the private and public sectors and the research and donor commu-nities, and examining the role of these actors in reducing food loss along value chain. finally, it aimed to provide recommendations for reducing food loss at the opera-tional and policy level, and for the future engagement of the German federal Ministry for economic Cooperation and Development (bMZ).
The survey was completed by 247 potato farmers, more than 70 marketers (brokers, traders, retailers and super-markets), 3 processors and 22 restaurants. field data have been supplemented with information available from
1 See also the GIZ publication ‘food losses in Cassava and Maize Value Chains in Nigeria. analysis and Recommenda-tions for Reduction Strategies, 2013’.
7exeCUTIVe SUMMaRy
Executive Summary

8 exeCUTIVe SUMMaRy
most affected by the low quality of produce supplied to the markets. losses reported by the processing industry and supermarkets run from 12 per cent to 25 per cent within sector businesses. However, given that their mar-ket share remains small (but growing), this damage and loss only contributes around 5 per cent to the overall damage and loss occurring along the value chain.
The data on loss in the value chain shown in figure 1 below describes the damage and loss reported at each stage in the chain (farmers, processors, marketers). The percentages are based on different produce quantities and are therefore not part of an overall total percentage. However, they do expose significant hot spots and chal-lenges in terms of post-harvest losses. The retail level is
Figure 1: Synopsis of reported damage and loss occurring within different market channels of the potato value chain
Reported damage and loss occurring within different market channels
Farm level 12.8%
Harvesting12.0%
Handling/transport8.8%
Storage0.8%
Sorting 15.6%
open market 24.4%
Processing 12%
Varieties/sorting10%
Quality25%
Processing2%
Demandnot available
Supermarkets 25%
The financial assessment of potato damage and loss along the value chain exposes the economic impact of this low performance in potato production. In each harvest season, 2,715 kg or 19 per cent of per-hectare production is damaged or lost, representing a loss of KeS 42,824 (eUR 363) per hectare. extrapolating these per-hectare losses to the national production level, we can assume that 815,000 tonnes of produce are damaged or lost each year, representing a value of around KeS 12.9 billion (eUR 109 million).
The Kenyan Government has recognised potato’s criti-cal role in alleviating food shortages in the context of the decreasing production of maize and other staples (Mwaura 2009). The development of potato production could form part of the solution to overcome such short-ages given that potatoes have higher yields compared to
maize.2 This being the case, improvements in the potato sub-sector will also benefit food security in the country.
This study on post-harvest losses of potato and its find-ings also intend to contribute to the development of the sub-sector by, in particular, supporting the Kenyan Gov-ernment in its efforts to improve the development of the potato value chain. as such, Chapter 3 of this report sets out the challenges and options for delivering improve-ments along the ware potato value chain, summarised as follows:
2 fao (2009) established the cereal and maize equivalents based on the calorie content of selected foods, which indicate that five units of potato can replace one unit of maize.

9exeCUTIVe SUMMaRy
holders should also group together to share equipment and thereby generate economies of scale.
Improved post-harvest handlingThe currently dominant potato variety is Shangi,3 which has a short dormancy and begins sprouting after only five to six weeks. as such, it is not suitable for longer-term storage, neither as seed nor as ware potato. Improving seed and ware potato quality requires new varieties, which, in turn, requires improved on- and off-farm storage and storage technology. Diffused light stores (DlS) and im-proved traditional stores (with charcoal-coated walls) have proved to be useful low-cost storage alternatives, particu-larly for storing seed potatoes. However, to date, neither of these storage technologies is widely used in Kenya.
The Dutch study ‘Value Chain of Seed and Ware Potatoes in Kenya’ (Janssens et al. 2013) calculated that modern cooled storage facilities should have a minimum capacity of 100 tonnes to make investment worthwhile. Small- capacity storage facilities are relatively expensive and substantially raise investment and running cost per kg of seed potatoes. Consequently, professional modern stor-age is more attractive for the farmers, farmer groups or processors who store big quantities.
Improved packagingThe Kenyan Government and private sector sought to improve packaging by means of legal Notice No 44 of 2005 and No 113 of 2008, which specify that potato must be marketed in standard bags of 110 kg. besides the weight, the standard also defined the packaging mate-rial suitable for potatoes. The implementation of this law did not result in a real change, as it was not properly enforced. Recently the Government, National Potato Council of Kenya (NPCK) and county governments have started a new initiative to introduce maximum 50 kg bags in line with the requirements of the International labour organization (Ilo).
as the survey results show, extended bags have severe impacts on the quality of potatoes marketed. This is because produce is paid for per bag rather than per kilo-gram and bag sizes vary, even within the same categories.
3 Shangi has also been called ‘Zangi’ or ‘Cangi’ in different publications.
Seed improvements – new varieties and rapid multiplicationThe limited availability and use of quality seed potato is a key barrier to increasing productivity in Kenya’s potato sector. To improve certified seed potato supply, research institutes and the private sector have begun introducing an aeroponics technique in which mini-tubers are grown from in vitro plants in protected greenhouses. further-more, after a long period during which Kenya barred seed imports, the Kenyan Ministry of agriculture, live-stock and fisheries (Moalf) has begun cooperating with the Dutch Government and private companies on a fast-track system for rapidly multiplying certified seed.
a further challenge for seed potato production is the ab-sence of a distribution system for certified seeds. farm-ers seeking seed potatoes sometimes must travel more than 200 km to reach quality seed providers. Improving the seed potato distribution network is therefore of the utmost importance for reaching more farmers with cer-tified seed.
Improved production and harvesting technologiesSoil fertility is one of the major problems in potato farm-ing in Kenya. fertiliser use in Kenya is low compared to the recommended rates of application and this results in the rapid decline of soil fertility. The biggest complaint farmers make is about increasing input costs and this factor results in the limited use of agro-inputs. about 38 per cent of farmers in Kenya stated that the costs of fertiliser, fungicide and employee wages have been ris-ing and that this affects their incomes. Consequently, the lack of funds to buy inputs was reported as an important problem affecting potato production in Kenya (Kaguongo et al. 2008). This being the case, small-scale as well as larger-scale farmers should be supported in applying good agricultural practices to improve soil fertility, seed quality, fertilising and spraying.
on smallholdings, most work is performed manually, resulting in significant potato damage and loss. as the survey shows, damage caused by casual labour and har-vesting tools represents 7.4 per cent of on-farm losses. an ongoing challenge for reducing damage is the presence of farms that are too small for mechanisation. as such, the size of potato production and harvesting machinery in Kenya should be geared towards local needs. Small-

10 exeCUTIVe SUMMaRy
a further market signal could come from contract farm-ing, which helps farmers to exit the vicious circle of insecure markets and exploitation through extended bags. Contract farming is a well-known arrangement for supplying the processing industry, but processors in Kenya face problems in their cooperations with farmers. as such, processors and farmers should be supported in developing stable business relationships to ensure the provision of suitable varieties, appropriate sorting and constant supply.
human capacity developmentThere is a need to expand farmers’ training on improved agronomic and management practices, with the support of extension services. Priority should be given to inno-vative approaches that enhance extension and farmer training, such as (i) the use of group approaches, (ii) farm-er-led extension that involves, for example, farmer field schools operating demonstration plots, on-farm trials, etc., and (iii) the provision of communications technol-ogy (ICT) to support agricultural production (Nyagaka et al. 2009).
besides farmers, those involved in trading stock also need comprehensive training to improve their post-harvest handling, storage, processing and marketing. Relevant training should be provided to operators in the wholesale and retail markets to improve their handling and storage of produce with a view to maintaining qual-ity and reducing physical losses.
as such, traders prefer to buy extended bags, as they are more profitable. This encourages farmers and brokers to pack all their potato stock regardless of its quality. In addition, the greater difficulty in handling the large bags and the material used to make them cause further damage.
Market signals rewarding quality are required to encour-age farmers to deliver better production results. There-fore, implementing regulations on marketing standards would be a first step towards better quality and the fair payment of farmers. firstly, having better bag material and a lower bag weight decreases spoilage and damage. furthermore, a fixed bag weight would reduce the ex-ploitation of farmers. also, the content of a smaller bag can be better controlled, which helps improve the quality of produce supplied. To ensure the law is enforced, the process to improve packaging should involve brokers, local traders, wholesalers, retailers and the county au-thorities in order to reach an agreement supported by all actors along the value chain. overall, standards and infrastructure should be established for and awareness raised about marketing potatoes by weight.
Improved conditions for the processing industryKenya has an expanding food processing industry, driven by its growing urban population, changing population structure, new eating habits and increasing tourism. The industry requires potato varieties with better processing qualities to replace the traditional varieties that are assusceptible to bacterial and viral diseases. Processors are calling for the production of suitable varieties to meet their needs for better-quality raw material for pro-cessing.

11IntroductIon
The study will inform Kenyan partners, GIZ and the German food Partnership on how to design appropriate measures and investments to reduce losses in the potato value chain and, in general, how to improve efficiency in value chains.
1.2 Concept of food loss
1.2.1 The study approach although ware potato is the focus of this study on post-harvest losses of potato (PHl study), aspects relating to seed potato use and production at the farm level were also taken into consideration.
This study looks at losses occurring at the pre-harvest, harvest, post-harvest and processing stages, as these are the most relevant in developing countries. following the approach taken in the fao study ‘Global food losses and food Waste (Gustavsson et al. 2011) five system boundaries are distinguished in the food supply chains of vegetable commodities. food loss/waste should be estimated for each of these segments in the chains:
• Pre-harvest: practices affecting the quality of har-vested potatoes.
• Harvest: losses due to mechanical damage during harvesting, as well as crops left in the field due to poor harvesting technologies.
• Post-harvest handling and storage, which includes losses during post-harvest crop sorting and losses during handling, storage and transportation between farms and distribution points including losses caused by packaging (extended bags).
• Processing, which includes losses due to spillage and degradation during industrial processing, such as: when crops being sorted are identified as unsuitable for processing; during washing, peeling, slicing and boiling; during process interruptions; or as a result of accidental spillage.
1.1 Study objective
Potato4 (commonly referred to as Irish potato) is the second most important food crop in Kenya after maize. Potato production in Kenya is expected to grow and could even take the number one spot as food crops like maize become affected by climate change, e.g. due to insufficient rainfall. faced with droughts, farmers are being encouraged by the government to diversify their production. The Ministry of agriculture reported that many farmers are opting to grow potato because it is fast-maturing compared to maize and can be used to bridge the gap during shortages of the staple grain. The number of farmers abandoning maize is not known but, according to the Ministry, the number of potato farmers has grown from 500,000 farmers in 2003 to 800,000 in 2011 ( Thompson Reuters foundation 2011).
In spite of this popularity, several studies have reported major constraints in potato production, such as diseases and pests mainly spread by diseased seed and the lack of crop rotation. other problems are the climate (drought, heavy rains), the costs of inputs for smallholders, seed quality, soil quality and (post-)harvest losses.
The issue of food loss is a highly important factor in ef-forts to combat hunger and raise incomes. However, food loss also represents wasted production resources such as land, water, energy and inputs. These additional envi-ronmental impacts of food loss were not included in this study but were evaluated as part of the GIZ study on ‘The ecological footprint of Cassava and Maize Post-Harvest losses in Nigeria’ (2013),5 which showed that food loss has a significant impact on the environment.
The aim of this study is to improve the availability of data on food loss in the potato value chain in Kenya in order to identify options for the public and private sectors to engage in food loss reduction programmes.
4 The relevance of potatoes (Solanum tuberosum) as a food crop is significant compared to sweet potatoes (Ipomoea batatas), which make up only around 20 per cent of potato production. In 2011, sweet potato cultivation occupied 33,000 hectares and provided a yield of 300,267 tonnes, valued at KeS 3.6 billion (provisional data, HCDa 2012).5 See also GIZ 2013b.
1 Introduction

12 IntroductIon
at the end of the food chain (retail and final consump-tion) is called ‘food waste’ and is the result of retailer and consumer behaviour.
Losses include:
• physical losses – products that are not marketable/consumable, e.g. spoiled, rotten, damaged, green potatoes
• financial losses – lower prices paid due to insufficient quality or loss of value due to bad storage facilities
Critical loss points can occur all along the value chain (Table 1). Given that at certain points not all damaged produce is lost, specifications have been drawn up to distinguish between losses and other uses.
• Distribution, which includes losses and waste in the marketing system – for example, at wholesale markets, supermarkets, retailers and local markets.
• Unlike the fao study, waste occurring during the final consumption stage was not factored into this GIZ PHl study.
1.2.2 definition of loss and critical loss points according to fao, food loss refers to a decrease in edible food mass throughout the part of the supply chain that specifically provides edible food for human consump-tion. Therefore, food destined for human consumption that falls out of the human food chain is considered as food loss or waste. This approach distinguishes between ‘planned’ non-food uses and ‘unplanned’ non-food uses, with the latter being counted as loss. food loss occurring
Financial losses due to low quality of potatoes is a challenge to retailers

13IntroductIon
Stages Critical loss points Specifications of loss according to the Phl study
Production Energy Audit Subsidy Small potatoes are losses if they are not for used for home consumption or for seed.
Capital Cost Subsidy
Harvest Planting and harvesting techniques that leave remnants on the fields (volunteer crops)
Volunteer crops (those left on the field and harvested early the following year) are lost if not used for home consumption.
Harvesting tools cause damage Damaged/cut potatoes: partly for home consumption, with the rest being losses.
Harvest timing – premature harvesting (green potatoes) or harvesting in wet weather
Green potatoes are losses if they are not used for seed.
Packing Quantity and quality of produce packed into extended bags
Size of extended bags
Material of extended bags
Transpor-tation and handling
Weight of extended bags does not allow careful handling
Extended bags become heated (affecting sugar content)
Several stages of loading and unloading prior to reaching the end customer
Losses due to a lack of access roads or poor road conditions
Inadequate means of transport
Storage Lack of storage facilities or simple stores
Unsuitable varieties for storage
Stored products are immature, not disease-free
Market conditions
Wet markets (dirt, contamination, weather) Lower prices due to market oversupply/fluctuations are not losses.
Losses caused by lack of sales are incorporated.
Green potatoes due to sunlight and inadequate packaging material (nylon)
Reduction of prices due to low quality (green/cut potatoes) cause financial losses.
Processing Wrong varieties for processing
Sorting and grading losses Additional labour required to sort/cut potatoes causes financial losses.
Forced to process by-products Potato peel is not a loss.
Table 1: Critical loss points along the potato value chain

14 Methodology
Bomet County was selected to gain an understanding of contract farming from farmers producing potatoes for processors. The production, marketing and handling practices of contract farmers are influenced by contrac-tual arrangements. They plant varieties preferred by processors, allow the crop to fully mature before harvest and, in the main, pack potatoes in standard 110 kg bags.
Meru County farmers have secured a niche market, sup-plying potatoes to most of the markets in the drylands of northern Kenya, such as Marsabit. They also supply markets in Meru and embu Counties. In Meru County, farmers grow potatoes off-season and use irrigation. both irrigating and non-irrigating farmers allow the crop to fully mature before harvesting.
Nakuru County farmers mainly sell in large extended bags. farmers are known not to wait until their crops are fully mature – traders ask farmers to harvest as soon as the crop flowers and farmers also like to harvest early when the prices are high.
Nyandarua County farmers grow potatoes in all sub-counties as their main crop. Contract farming was in-troduced in 2013 but is not progressing well. Nyandarua farmers also tend to harvest potatoes before they are fully mature to take advantage of high prices. Nyandarua and Nakuru Counties are two of the major sources of potatoes marketed in Nakuru, Nairobi and Mombasa. Ware potato growers/farmers all the major potato growing sub-counties in each of the four selected counties were included in the survey. Two sub-counties were selected in bomet (bomet Central and bomet east), three in Nakuru (Molo, Kuresoi, Njoro), four in Nyandarua (Kinangop, Mirangine, Nyandarua North and ol Kalou) and two in Meru (buuri and Meru Central).
The sample size was calculated according to potato producing households and using information from the Seed Potato Sub-sector Master Plan for Kenya 2009-2014 (Kaguongo et al. 2010).
The chosen methodology was based on a five-step approach (details in Table 27, annex 1) following that of the fao (van otterdijk 2012).
1. Screening of food losses including rapid appraisal.2. Survey on food loss assessment. 3. Sampling including load-tracking assessment.4. Data analysis, verification workshop and reporting.5. Synthesis: recommendations and solution finding.
General data for the study were collected from published sources and through key informants, and specific data through questionnaires and group discussions.6 Con-ducting a rapid appraisal to determine specific issues during the preparatory stage proved to be crucial for get-ting a better understanding of the context and for better preparing the survey.
Data was collected during the survey from the major participants along the value chain and on the major sources, causes and also quantities of loss and waste. a randomised survey was used so that statistically reliable quantitative data could be obtained on losses at the defined critical points. Multi-stage sampling was employed so that different regions and types of farmer, broker and trader were included in the survey. The survey results were discussed in a verification workshop, which provided further input to the reporting.
2.1 Sampling of counties and value chain actors
The farmer survey was conducted in four main potato-growing counties in Kenya, namely bomet and Nakuru Counties in the Rift Valley area, Nyandarua County in Central Kenya and Meru County in eastern Kenya (fig-ure 2). These four were purposively selected to provide a representative overview of potato production, post-harvest handling and marketing practices in the country. In bomet and Nyandarua counties contract farming is already underway.
6 The questionnaires are attached in annex 3.
2 Methodology

15Methodology
ed according to the number of potato producing house-holds in the four counties. In bomet, 52 farms (39 individual farmers and 13 contracted farmers) were included; in Nakuru, 69 farms; in Nyandarua, 73 farms (60 individual potato farmers and 13 contracted farmers); and, in Meru, 53 farms were surveyed. The results in the tables and graphs summarised under ‘all’ show the weighted average of the counties.
and in each sub-location administrative units were listed and a sample selected. from each unit, villages were listed and a sample selected, and then the farmers who grow and sell potatoes in each village were listed and a sample selected. on average, a sample of four farmers per village were interviewed. farmers with contract farming arrange-ments were indicated in the questionnaires using the relevant respondent code.
0 100 200 300 km
0 50 100 150 miles
N
©GIZ/Ira Olaleye
1
2
3
5
7
6
8
4
10
9
11
4212
13
14
1516
17
2246
23
47
26
2524
28
2930
3132
33
36
4039
38
3743
3534
41
44
45
27
21
20
1918
1 Turkana 2 Marsabit 3 Samburu 4 Laikipia 5 Isiolo 6 Mandera 7 Mandera 8 Garissa 9 Tana River 10 Lamu 11 Kilifi 12 Kwale 13 Taita-Taveta 14 Kitui 15 Makueni 16 Kajiado 17 Machakos 18 Nairobi 19 Kiambu 20 Murang’a 21 Nyeri 22 Embu 23 Meru 24 Nyandarua
25 Nakuru 26 Narok 27 Bomet 28 Migori 29 Kisii 30 Nyamira 31 Kericho 32 Homa Bay 33 Kisumu 34 Siaya 35 Vihiga 36 Nandi 37 Kakamega 38 Uasin Gishu 39 Elgeyo-Marakwet 40 Baringo 41 West Pokot 42 Mombasa 43 Busia 44 Trans Nzoia 45 Bungoma 46 Kirinyaga 47 Tharaka-Nithi
Counties
Ethiopia
Somalia
South Sudan
Tanzania
Uganda
NAIROBI
Lake Victoria
To collect data from farmers, specific questionnaires were developed (annex 3). The questionnaires were used as an interview guide for the trained enumerators tasked with collecting information from farmers. Using enumerators was important as some of the farmers were not able to read and therefore could not complete the questionnaires without assistance. a sample of 247 randomly selected farmers was interviewed.7 The sample size was calculat-
7 a multi-stage sampling technique was adopted to select the farmers. In each of the counties, all the sub-counties that grow potatoes were listed and then a sample was selected at random. once the sample of sub-counties was obtained, the wards in each sub-county were listed and a sample of these was then selected. from here, locations in the chosen wards were listed and a sample selected. In each location, the sub-locations were listed and a sample selected
Figure 2: Map showing the four counties surveyed

16 Methodology
challenges. on this basis, broker selection was purposive and, as they work in groups, it was decided to organise group discussions. Groups from the sub-counties with the highest potato production and marketing activities were selected (Table 3).
Brokers brokers’ characteristics are the same in each county in terms of how they operate, link up with traders and farmers, get paid for the work they do, and grade and package potatoes, and also in that they face the same
County Brokers group Wholesalers Retailers Supermarkets Restaurants Processors
BOMET 1 4 3 1
MERU 1 4 3 1
NAKURU 1 4 3 1 1
NYANDARUA 1 4 3 1 1
MOMBASA 4 3 3
NAIROBI 16 12 2 3 2
4 63 3 10 3
Table 3: Breakdown of samples of other value chain actors
County Sub-county Villages surveyed number of farmers County sample size
BOMET Bomet Central 9 36 52
Bomet East 4 16
MERU Meru Central 4 17 53
Buuri 9 36
NAKURU Kuresoi 7 28 69
Njoro 5 17
Molo 6 24
NYANDARUA Kinangop 6 24 73
Mirangine 6 24
Nyandarua North 3 12
Ol Kalou 1 13
60 247 247
Table 2: Breakdown of farmer samples 8
8
8 See also Table 26 in annex 1.

17Methodology
2.2 Measurement
With regard to farm size and potato fields, the interview discussions with farmers were based on quarter acres (1,000 m2) but that was later changed to one hectare (10,000 m2). Since farmers use several plots on their farm for potatoes, they were asked to quantify according to the output of their largest potato plot under production. This approach meant farmers could provide more concrete answers but also carried the risk that they would overes-timate output when converting the information to the farm scale. all data were finally converted into quantities per hectare.
Since different measures are used for business transac-tions across the surveyed counties, quantities and prices were difficult to standardise. Various measures for the so-called extended bags are currently in use, and all transactions are calculated in buckets/bags rather than by weight. The weight and content of extended bags are assessed according to the number of buckets required to fill a bag. an average bucket contains 17 kg of potatoes.
There are two key measurement terms associated with extended bags: Kamba determines the size of the bag’s netting top section and Kata determines the additional pieces of cut bags used to extend a standard bag (Table 4). Traders also use different names for different sizes of bag – for example, Gatabuko corresponds with Kata 2 Kamba 4, or Wa kaguku or Bomb correspond with Kata 2 Kamba 5. Mukurinu describes the closed-bag packing method used, with bags ranging in size from 160 to 200 kg.
The observed weight per bag type varied by 7 to 10 kg (Table 5). The bag size keeps on changing from one season to another and from one locality to another depending on the buyer. bags tend to be biggest at peak harvesting seasons and smallest when potatoes are in short supply. It should be noted that, because the survey was taken in the off-season period, the range of packaging types used in the market was fairly limited in many areas.
Three types of bag materials are used to pack and market potato, namely jute, sisal and nylon. Potatoes kept for longer than a week in nylon bags spoil.
Wholesalers and retailers Trader samples were selected at random. The potato traders present in each market were listed and three wholesalers and four retailers were randomly selected and interviewed. In Nairobi, four different market places were included: Wakulima, Gikomba, Kangemi and Githurai. a total of 63 traders were interviewed: 27 wholesalers, 27 retailers, and 9 traders who conducted both wholesale and retail operations.
SupermarketsSupermarkets are mainly located in the major urban cen-tres. In many supermarkets, purchasing is centralised and branches receive weekly goods deliveries. The pattern of purchasing agricultural produce is similar for most of the supermarkets, with produce being supplied centrally by a contracted supplier on a weekly basis. Purposive sampling was used to select the three major supermarket chains – Nakumatt, Uchumi and Tuskeys – for interviews with branch supervisors. Data were collected from one branch in Nairobi and one in Nakuru town.
ProcessorsPotato processors who make crisps and chips are few in Kenya. The main processors are the Nairobi-based com-panies Deepa Industries, Norda, Pioneer and Propack, and also Midlands, located in Nyandarua county. Pur-posive sampling was used to select three processors for interview.
Restaurants Restaurants were sampled randomly from the high streets of selected towns.9 one restaurant was inter-viewed in each main town of the four study counties; in Nairobi and Mombasa, the biggest potato markets in Kenya, three restaurants were selected in each city.
9 Sample selection involved picking one restaurant located in one of the three main streets of the principal towns of each of the four study counties. In Nairobi and Mombasa three restaurants were selected for each city.

18 Methodology
2.3 load tracking
bag size, weight and material are expected to have a significant impact on produce quality and losses. To measure the impact of extended bags on the quality of the potatoes and, thus, on losses, three bags were traced along the supply chain.
Starting on a farm in Kanjuiri village in ol Kalou Sub-County, Nyandarua County, the packing of bags was observed. following this, packed bags were opened to analyse their content. The sorting was performed on the basis of selecting and weighing green, damaged/cut and rotten potatoes. bucket-size samples were taken on the farm to determine the levels of quality and loss accord-ing to the above-mentioned definition.
Table 4: Traditional potato measures
Packaging types
Non-extended bag Bucket Kamba 6 Kata 210 Mukurinu
name of packaging Size Average weight
Bucket 1 bucket 17 kg
Non-extended bag 7 buckets 119 kg
Kata 2 Kamba 4 11 buckets 180-187 kg
Kata 2 Kamba 5 12 buckets 195-204 kg
Mukurinu Different sizes 160-200 kg
Table 5: Traditional measures and their metric conversions
The identified bags (of Kata 2 Kamba 5 size) were traced from their place of origin to their destination market in Nairobi. at the retail market level (the produce’s final destination and location where bags are opened and re-packed), each of the bags were weighed and then opened and the various categories of potato in each bag were separated out and weighed. To get a broader understand-ing on the losses caused by the bags, interviews with re-tailers included questions related to seasonal effects. 10
10 Kamba 6 is the size of the netting top section the bag. Kata 2 indicates the number of additional cut bag pieces used for the bag extension panels; in this case, it means two pieces of cut nylon bag are used with half a nylon bag for the top section.

19POTATO VALUE CHAIN IN KENYA – SURVEY RESULTS
smallholders dedicating 0.2 to 0.4 hectares to potato production, while approximately 17 per cent of potato plots belong to larger-scale farmers dedicating 2 to 10 hectares to the crop (Janssens et al. 2013). average production in Kenya is estimated at 7 to 10 tonnes per hectare (Muthoni et al. 2011), compared to a global average yield of 17 tonnes per hectare (faoSTaT 2011). Kenyan farmers achieve up to two harvests per year.
The total production area has increased in recent years and is estimated to have reached 150,000 to 160,000 hectares to date (Table 6).
3.1 Background
Potato is the second most important staple food in Kenya after maize. The most favourable climatic conditions for potato cultivation in Kenya are found in areas at altitudes between 1,500 and 3,000 metres above sea level, where the country’s main staple food, maize, has no compara-tive advantage. at this altitude, potatoes grow faster than maize and produce more energy and protein per hectare per day. Potato production areas are found mainly in the highlands of the Central, eastern and Rift Valley regions and on the slopes of Mount Kenya. also, other regions like Mount elgon (bungoma County) in Western Kenya are prominent production areas (see figure 2).
Potatoes are grown by up to 800,000 farmers, who are mainly smallholders.11 It is estimated that 83 per cent of the land under potato cultivation belongs to
11 The exact number is not known. ‘The National Root and Tuber Crops Policy’ published by the Ministry of agriculture in 2010 estimates the number of farmers to be 790,000. In 2011, the Ministry reported 800,000 farmers.
3 Potato value chain in Kenya – survey results
County Area in ha 2010 2011 2012
Meru 17,463 12,500 18,092
Nyandarua 28,688 30,577 27,520
Nakuru 16,053 16,804 22,566
Bomet 2,900 3,680 2,987
Elgeyo Marakwet 8,311 15,097 20,992
Narok 6,836 7,808 6,292
Kiambu 11,271 10,092 18,769
Nyeri 8,067 6,404 7,821
Bungoma 5,113 6,051 5,321
Estimated total area under potato production 150,000-160,000 haSource: HCDa 2012, Kaguongo et al. 2013, and author’s own estimations.
Table 6: Main potato producing counties and the total area under potato production in Kenya

20 POTATO VALUE CHAIN IN KENYA – SURVEY RESULTS
over KeS 40 billion or eUR 339 million (1 per cent) to the national economy (Kasina & Nderitu 2010). It therefore follows that potato is an important economic crop.
In addition to there being up to 800,000 potato farmers, another 2.5 million people work in the potato value chain (Kaguongo et al. 2013). Potato is ideal as a food security crop as it has a short season and provides food within just 2.5 to 3 months, especially when planting fast-maturing varieties. at the same time, farmers are assured of a harvest as the crop is drought resistant and will provide some produce, even with little rain.
The ware potato value chain is structured rather simply (figure 3) given that most of the potatoes marketed are bought and consumed as fresh produce by end-consumers. farmers sell their produce mostly via brokers to local traders. local traders take the produce to the wholesale markets where, again, brokers organise sales on behalf of the traders. only farmers engaged in contract farming for the processing industry sell directly to their custom-ers. Processing accounts for only around 9 per cent of marketed produce,12 although a trend towards increasing demand for processed products has been observed. average per capita consumption is estimated at 30 kg and is expected to rise due to increases in potato consumption by urban populations (fao 2013) and rapid population growth. Present estimates indicate that around 1 to 1.5 million tonnes of potatoes are marketed in Kenya per season.13 Currently, potatoes contribute
12 according to NPCK estimates.13 In 2012, Kenya had a population of 41 million and this is expected to rise to 50 million by 2020 (Zulu et al. 2012).
The common packing of potatoes in heavy bags causes damages

21POTATO VALUE CHAIN IN KENYA – SURVEY RESULTS
The education levels of ware potato growers correspond with their age (Table 28 in annex 2). bomet County, where potato production often involves contract farming for processors, there are more young farmers. farmers in this County also had the highest levels of literacy, with 73.1 per cent having completed secondary education and college. Compare this with Nakuru County, for example, where farmers had a low literacy level and only 49.3 per cent had completed secondary and college education. a comparison of male and female respondents showed higher illiteracy among women (10.3 per cent to 2.4 per cent of men) and consequently a lower education level (Table 29 in annex 2).
age and education is known to have an impact on openness to change and innovation and on the com-mercialisation of agricultural production. farmers with higher levels of education tend to be more efficient in production. better performance by more educated farm-ers may be attributed to the fact that education gives the farmers the ability to perceive, interpret and respond to
3.2 Potato production
3.2.1 Ware potato growersThe characteristics of the potato farmer sample (Table 28 in annex 2) indicate the dominance of elder male farm-ers heading a family of five to six persons (68 per cent of the respondents were men, 32 per cent women). That said, the sub-sector is known for being gender-balanced. GIZ’s PSDa14 programme conducted labour studies in selected agriculture sub-sectors and the study on the potato sub-sector showed that women (49 per cent) and men (51 per cent) are nearly equally involved in the op-erations.15 Some operations are heavy-duty in nature, meaning they are more likely to be performed by men (e.g., the handling of extended bags); conversely, women dominate the retail business.
14 http://www.gtzpsda.co.ke/index.php?option=com_content&view=article&id=18&Itemid=5515 This runs in contrast to sweet potato production where, according to the GIZ PSDa study, women perform 75 per cent of the production activities.
Figure 3: Ware Potato Value Chain
StageConsump-
tion
Operators
End- users
House-holds
Farmers
Brokers Brokers Retailers
Contract farmers
Local traders
Industrial processors
Whole- salers
Restaurants
Super- market
on-farm production
Packaging/transport
Processing Wholesale/retail trade

22 POTATO VALUE CHAIN IN KENYA – SURVEY RESULTS
new information and improved technology such as ferti-lisers, pesticides and planting materials much faster than their counterpartss (Nyagaka et al. 2009).
land holdings and production methodsSmallholders with farm sizes averaging less than 2 hec-tares dominate the potato sub-sector in Kenya. land ownership is predominantly freehold. The average farm size of surveyed potato farmers was 1.6 hectares (Table 7), while the average area of land given over to potato growing was 0.6 hectares, or 35.4 per cent of their overall farmland. Nyandarua County had the largest average land holding (1.9 hectares), with 0.7 hectares being dedi-cated to potato growing. Conversely, bomet County had the smallest average land holding (1.4 hectares) and also the smallest area dedicated to potato growing (0.3 hectares).
Putting together a serious estimate of harvested and marketed potato in Kenya is difficult as data on produc-tion areas and yields are not systematically collected. also, bag sizes used by traders vary from one area to an-other. Moalf and the Horticultural Crops Development authority (HCDa) publish annual production data and, in 2012, HCDa calculated a production of 2.53 million tonnes on a 143,000-hectare area. The Kenyan agricul-tural Research Institute (KaRI) estimates smallholder yields to be in the region of 7 to 10 tonnes per hectare,
equivalent to 1 to 1.5 million tonnes per season. The farmers interviewed for the study looking at main pro-duction areas harvest on average 13.5 tonnes per hectare per season, which is higher than the national average.
Most farmers produce two potato crops a year because of the bimodal rainfall in most potato growing areas. The long rainy season lasts from March/april to June/July, while the short rainy season lasts from october to December (Table 34 in annex 2). among the surveyed counties, only farmers from Meru (79.2 per cent) practise substantial off-season farming using irrigation, and these off-season crops secure higher prices (Table 7).
The majority of surveyed potato farmers (95.5 per cent) indicate that they practise crop rotation. However, the effectiveness of this crop rotation could not be deter-mined as farmers did not report their rotation schedule. It is known that farmers rotate crops with, for example, maize, beans or cabbages; however, such rotations are not designed for the control of pests and diseases. CIP reported that 21 per cent of farmers grow potatoes continuously on the same plot and only one out of two farmers practises some form of rotation (Kaguongo et al. 2008).
Bomet n=52
Meru n=53
nakuru n=69
nyandarua n=73
All n=247
Potato yield (kg/ha) 13,243.8 11,888.6 14,950.3 13,629.4 13,551.6
Quantities eaten per farmer family (kg/ha) 1,295.6 2,032.7 1,326.8 1,041.8 1,394.9
Land holding in ha
Total farm size 1.4 1.5 1.6 1.9 1.6
Land for potato production 0.3 0.4 0.7 0.7 0.6
Farming practices (%)
Potato production irrigated 0.0 79.2 8.7 2.7 20.2
Farmer practising crop rotation 100 100 92.8 91.7 95.5
Table 7: land holdings and farming practices

23POTATO VALUE CHAIN IN KENYA – SURVEY RESULTS
Kenya’s soil-borne diseases,16 limited pest management and low soil fertility mean current production practices are not sustainable. This situation is further aggravated by the remnants left in the field after harvest that pro-duce so-called volunteer plants in the next season. even though crops are rotated, the volunteer plants will carry diseases from one season into the next. The PHl survey showed that 97 per cent of interviewed farmers report leaving volunteer plants in the field, using them mostly for home consumption. The average quantities remain-ing in the field are estimated at 0.65 tonnes per hectare, Given surveyed farmers report an average yield of 13.5 tonnes per hectare, we can deduce that at least 5 per cent of the potato crop is left in the ground. a total of 53.2 per cent of farmers allow the volunteer plants to grow for home use, while others uproot the remnants (Table 37 in annex 2).
16 a recent survey showed that bacterial wilt was the most prevalent disease, affecting 77 per cent of potato farms, followed by late blight affecting 67 per cent and viral diseases affecting 12 per cent (Kaguongo et al. 2014). See also Janssens et al. 2013.
Farmers’ seed systemMore than 60 potato varieties are grown in Kenya, but relatively few are widely distributed. The dominance of certain varieties shifts over time. Today, Shangi17 (a farmers’ variety, shown in Photograph 1) and Tigoni (an officially released variety) are the main varieties be-cause of market preferences (Table 45 in annex 2). Shangi has a very short cooking time, saving energy and cutting costs, and so is preferred by low-income households. al-though most varieties in Kenya have white skin, there is preference in some regions for red skin varieties.
17 Shangi is also called ‘Zangi’ or ‘Cangi’ in other publications.
Potato varieties grown in each county (% within the county)
Bomet n=52
Meru n=53
nakuru n=69
nyandarua n=73
All n=247
Shangi 30.8 49.1 98.5 100 74.0
Asante 0.0 79.2 5.9 6.8 20.7
Dutch Robjin 96.2 0.0 2.9 0.0 21.1
Tigoni 3.8 0.0 17.6 38.4 17.1
Sherekea 0.0 50.9 5.9 8.2 15.0
Kenya Karibu 7.7 0.0 14.7 23.3 12.6
Tigoni Red 0.0 52.8 0.0 0.0 11.4
Désirée 23.1 3.8 4.4 11 10.2
Table 8: Potato varieties grown
Photograph 1: The Shangi potato variety

24 POTATO VALUE CHAIN IN KENYA – SURVEY RESULTS
The farmer seed system currently dominates the sub-sector. Due to limited seed production, the lack of attrac-tive varieties and an insufficient distribution network, certified seed18 – including clean seed and positive select-ed seed – only meets around 5 per cent of the national demand for seed potato, according to NPCK. The limited availability and use of quality (and certified) seed potato is a key barrier to increasing productivity in Kenya’s potato sector. Given farmers tend to practise short crop rotations, seed potato quality is an important factor in improving the sustainability of production. Clean seeds have the greatest impact on yields followed by irrigation, fungicides and fertilisers. However, clean seeds have the lowest adoption rate (Wang’ombe & van Dijk 2013). of the farmers interviewed, most (77.7 per cent) used farm-ers’ seed, with the main sources being their own harvest or seed from neighbouring farms (Table 33 in annex 2). only 6.9 per cent of farmers use certified seed purchased from certified seed suppliers (Graph 3 in the annex 2).
only 42 per cent of farmers renewed seed regularly (Graph 4 in annex 2). The seed renewal rate was higher in bomet and Meru where more than 60 per cent of farmers renewed seed after one to three seasons. Conversely, over 50 per cent of farmers in Nyandarua and Nakuru Coun-ties never renewed their seed. farmers from Meru and bomet showed the highest rate of certified seed applica-tion (30 per cent). Note that in bomet farmers are much more likely to be involved in producing for the process-
18 Clean seed: Multiplied at farm level, clean seed originates from certified or basic seed and its production follows guidelines laid down in farmer training programmes delivered by organisations like Moalf, KaRI or GIZ. Most production guidelines used in the production of certified seed are also used to produce clean seed – the only differ-ence is that the sample testing and supervision by KePHIS is lacking. Negative selection is used to remove diseased and weak plants.Positively selected seeds: Positively selected seeds are produced from ordinary or farmer-saved seeds through a process of selection undertaken by farmers who know how to select and manage good seed. However, Kenyan law stipulates that certified seed developed in accordance with strict production guidelines and inspected by the Kenya Plant Health Inspectorate Service (KePHIS) are the only seeds that can be traded. all other seeds – including positively selected seeds, clean seeds and farmers’ own seeds – are considered to be non-tradable by law (Kaguongo, W. et al. 2014).
ing industry and industrial clients generally provide the required seed material.
on-farm seed multiplication is further supported by varieties like Shangi; however, the variety is not certi-fied and clean Shangi seed is not available. So, despite its advantages of higher yields and fast growth, the variety is easily affected by disease. Shangi germinates rapidly after harvest, meaning seed tubers can be planted out within just a few weeks. This short dormancy means the seed from one season can be planted in the next growing sea-son. as ware potato, the variety is immediately sold after harvest, given it is not suitable for storage.
harvesting practicesa total of 64 per cent of the farmers reported that they do not harvest potatoes when it is raining. However, those who do harvest during the rains experience damage and loss of up to 1,469 kg/ha, mostly caused by the potatoes rotting. When converted to the average of surveyed farmers, these losses stand at 344.2 kg/ha (Table 9). farm-ers tend to harvest during the rains in order to reach the market early and fetch higher prices. also, traders force farmers to harvest early. a comparison of farmers from bomet and Nyandarua engaged in contract farming (Table 13) clearly indicates the impact of market forces on harvesting during the rains – e.g. contracted farmers from bomet report 90 per cent less rain-induced damage than non-contracted farmers in the county. Still, weath-er conditions also play a role, such as when unexpected rains occur during a harvest. annual rainfall patterns are becoming less easy to predict, with both drought and unseasonable rainfalls affecting production.

25POTATO VALUE CHAIN IN KENYA – SURVEY RESULTS
Meru County was the only location where sticks were reported to be used (by 41.5 per cent); and, in Nyandarua, 97.2 per cent of farmers use a fork jembe.
The fork jembe is the main harvesting tool for farmers although most farmers (87.0 per cent) consider that the tool damages (cuts and bruises) potatoes during harvest. The damage caused by using fork jembes was estimated at 679 kg/ha. That said, other tools such as the hoe or stick damage crops even more.
Most farmers (85.4 per cent) used casual labour for harvesting potatoes and only 12.1 per cent also employ family members as part of their workforce (Table 38 in annex 2). an important reason for this relates to how work is paid for: work provided by family members is usually not paid for and this makes them less willing to work on the family farm. Most farmers (80.8 per cent) considered harvesting operations to be the main cause of potato damage during harvest. The amount of damage caused by this type of labour was estimated at 488.2 kg/ha. However, as shown in Table 9, farmers experience most of their losses during production, e.g. through disease and other issues that are not reflected in this study.
Most small-scale farmers cannot afford motorised mech-anisation (no cash to invest, farm acreage and plots are too small) and do most of their work manually (planting, fertilising, harvesting). The most commonly used tool for harvesting potatoes is the fork jembe (52.8 per cent), followed by oxen (23.2 per cent). However, the tools used varied from one county to another (Table 38 in annex 2): in bomet County, the majority (92.3 per cent) use oxen;
Photograph 2: Fork jembe
Bomet n=52
Meru n=53
nakuru n=69
nyandarua n=73
All n=247
Potato yield (kg/ha) 13,243.8 11,888.6 14,950.3 13,629.4 13,551.6
Farmers experiencing losses (%) 94.2 100.0 97.1 100.0 98.0
Stages at which losses occur (%)
Production 77.6 81.1 74.6 55.6 71.0
Harvesting 53.1 56.6 44.8 45.8 49.4
Sales 28.6 39.6 26.9 36.1 32.8
Storage 8.2 15.1 10.4 15.3 12.4
Damage caused during harvest
Harvesting in rain (kg/ha) 179.9 185.1 633.6 261.5 344.2
Harvesting tools (kg/ha) 430.3 525.1 759.2 528.7 568.2
Harvesting labour (kg/ha) 213.1 537.5 631.0 514.7 488.2
Table 9: Farmers who experience losses during production and harvest

26 POTATO VALUE CHAIN IN KENYA – SURVEY RESULTS
Post-harvesting practicesMost farmers reported sorting and grading potatoes at harvest. The majority of farmers (60.0 per cent) graded by size, with 85 per cent of their crop being either medium- or large-size potatoes (Table 10). Sorting and grading mainly involved separating out small potatoes for seed. after deducting potatoes for home use, medium and large tubers end up being bagged for sale along with cut, bruised and green tubers.
as there are usually only a few months between harvests, it is not common practice to store ware potatoes in Kenya, although smaller quantities may be stored on farms. Those operating modern storage facilities are the larger processors or larger producers of seed potato. The major-ity of the surveyed farmers (92.2 per cent) stored some potatoes after harvest, but most farmers (60.4 per cent) stored potato for seed (Table 11).
26
Bomet n=52
Meru n=53
nakuru n=69
nyandarua n=73
All n=247
Farmers sorting and grading potatoes (%) 94.1 100 98.5 100 98.4
Stage of sorting and grading (%)
During harvesting 85.4 94.3 86.4 90.1 89.1
Just before storing 10.4 5.7 10.6 4.2 7.6
When selling 4.2 0 3 5.6 3.4
Sorting and grading potatoes of each category obtained from a hectare (%)
Small 11.0 8.4 9.5 6.2 8.4
Medium and large 85.1 84.3 81.5 86.3 84.9
Cut and bruised 3.7 5.3 7.5 4.9 5.2
Greening tubers 0.2 1.6 1.0 2.0 1.1
Off-type variety 0 0.4 0.5 0.6 0.4
Table 10: Sorting and grading practices
Bomet n=52
Meru n=53
nakuru n=69
nyandarua n=73
All n=247
Farmers who store potatoes (%) 94.1 96.2 91.0 88.9 92.2
Where the farmer stores potatoes (%) n=51 n=48 n=61 n=64 n=224
Dark store 27.1 64.7 22.0 7.9 29.0
Store allowing light 47.9 15.7 22.8 49.2 35.7
Store with a wooden floor 18.8 2.0 15.3 20.6 14.5
Others 6.2 17.6 33.9 22.3 20.8
Why the farmer stores potatoes (%)
To wait for better prices 9.1 55.1 1.7 10.9 18.0
Home consumption 2.3 30.6 16.7 32.8 21.7
For seed 88.6 14.3 81.7 56.2 60.4
Table 11: Potato storage practices

27POTATO VALUE CHAIN IN KENYA – SURVEY RESULTS
a survey carried out as part of the Seed Potato Sub- sector Masterplan (Kaguongo et al. 2010) showed that although more than 90 per cent of interviewed farmers store seeds, only 4 per cent had been trained in seed storage and suitable technologies such as diffused light stores (DlS).19
only 18 per cent of the farmers surveyed stored potatoes in order to wait for better market prices, although the majority of farmers (55.1 per cent) in Meru County stored stocks for reasons of price (Table 11). farmers in Meru in particular set aside potatoes from rain-fed production to wait for better prices. off-season production produced under irrigation secures high prices so, in the main,
19 In diffused light stores (DlS), seed tubers are stored on trays or racks and the stores are shaded and aerated. This type of store provides excellent conditions for seed tubers, but it is not widely used (Photograph 3).
farmers sell directly after harvest. Meru farmers who stored potatoes reported, however, that this year’s prices were not significantly higher – the difference being just KeS 1.3 per kg. It is possible that, in other years, storing ware potatoes will prove more financially rewarding.
The majority of farmers (83.9 per cent) reported expe-riencing losses during potato storage, mainly caused by rotten potatoes (82.5 per cent) affected by disease or damage (Table 12). on average, 119 kg/ha (0.8 per cent of the production) were lost in storage. The highest such losses were reported in Meru where larger quantities of ware potatoes are stored.
27
Bomet n=52
Meru n=53
nakuru n=69
nyandarua n=73
All n=247
Farmers experiencing losses (%) 80.4 84.3 84.2 85.7 83.9
Causes of damage during storage
Pests and diseases (%) 40.5 10.5 10.4 9.3 16.4
Rotting (%) 59.5 84.2 89.6 90.7 82.5
Others (frost, rodents, etc.) (%) 32.7 5.7 24.6 50.0 29.7
Losses during storage (kg/ha) 122.8 414.0 105.6 62.6 119.0
Table 12: losses in storage
Photograph 3: Seed potato storage - diffused light store

28 POTATO VALUE CHAIN IN KENYA – SURVEY RESULTS
Bomet n=52
Meru n=53
nakuru n=69
nyandarua n=73
All n=247
Packers of bags for selling (%)
Broker 49.0 88.7 76.8 91.8 78.0
Trader 27.5 7.5 11.6 0.0 10.6
Farmer 19.6 3.8 8.7 4.1 8.5
Workers 3.9 0.0 2.9 4.1 2.8
Consumer 3.8 0.0 1.4 0.0 1.2
To whom the farmer sells potatoes (%)
Local trader 63.5 96.2 56.5 60.3 67.6
Wholesaler 3.8 15.4 40.6 37.0 26.3
Processor 17.8 0.0 0.0 0.0
Table 13: Farmers’ transport and marketing practices
When selling potatoes, bags were mainly packed by brokers (78 per cent) as the majority of farmers (67.6 per cent) sold their potatoes via brokers to local traders (Ta-ble 13). farmers from bomet selling their potatoes to pro-cessors (17.8 per cent) also take on the packing of their produce (19.6 per cent). In the 2013 season, bomet farm-
ers remained the only group in the survey cohort selling to the processing industry. farmers from Nyandarua were contracted to produce for the processing industry but this arrangement did not work out and the produce was eventually sold to traders (see chapter 3.2.2).
3.2.2 Comparison between contracted and non- contracted farmersa comparison of ware potato growers operating as con-tract farmers in bomet and Nyandarua County is set out in Table 14. as the results show, improved conditions under contract farming end up delivering better produc-tion performance, in particular when supported with the provision of inputs like fertiliser or seed. However, challenges are arising in the cooperations between farm-ers and processors, especially regarding fulfilment of the contract. The costs of the inputs provided are based on market prices but, sometimes, the pricing and quality of these inputs is questioned: farmers accuse processors of calculating higher than market prices or the quality of seed is called into question. In return, processors com-plain about farmers breaching their contracts despite the fact that they have provided them with inputs. also, unmet quality standards are an issue needing discussion, given that farmers generally do not receive any training on improved agricultural practices.
farmers from bomet work closely with potato crisp manufacturers, hence the prevalence of the Dutch Robjin variety, which is preferred by the processing industry and grown by both contracted and non-contracted farmers in bomet County. Non-contracted farmers in bomet sell Dutch Robjin to the fresh produce markets as there is also demand for the variety in retail markets. a notable difference between the two kinds of farmer is that con-tracted farmers use certified seed more (23.1 per cent) than non-contracted farmers (10.3 per cent).
The quantities harvested per hectare were 14,945.9 kg for contracted farmers and 12,572.6 kg for non-contracted farmers, or 16 per cent less. The high yield for contracted farmers may be attributed to the use of high quality seed and improved production practices. The quantity of damaged potatoes per hectare for contracted farmers was 383 kg, whereas non-contracted farmers reported damages of 842 kg. Nevertheless, bomet farmers’ losses come in nearly 50 per cent lower than all other surveyed

29POTATO VALUE CHAIN IN KENYA – SURVEY RESULTS
Bomet contracted n=13
Bomet non-contracted n=39
nyandarua contracted n=13
nyandarua non-contracted n=60
Main varieties grown (%)
Shangi 15.4 35.9 100.0 100.0
Tigoni 0.0 5.1 100.0 26.2
Dutch Robjin 100.0 94.9 - -
Kenya Karibu - - 75.0 13.1
Désirée 15.4 25.6 50.0 3.3
Type of seed used (%)
Farmers' seed 61.5 71.4 88.3 91.8
Positively selected seed 15.4 17.9 0.0 3.3
‘Clean’ seed 0.0 0.0 8.3 4.9
Certified seed 23.1 10.3 8.3 0.0
Harvest
Quantity harvested (kg/ha) 14,945.9 12,572.6 16,877.6 12,356.4
Quantity damaged (kg/ha) 383.1 842.3 1,618.8 1,202.4
by harvesting tool (kg/ha) 306.0 416.4 791.1 443.3
by harvesting in rain (kg/ha) 25.8 265.4 142.1 297.3
by harvest workforce (kg/ha) 51.3 160.5 685.6 461.8
Percentage of damaged harvested potatoes 1.9 6.7 9.6 9.7
Table 14: Contracted and non-contracted farmers in Bomet and nyandarua Counties
farmers. The difference can be explained by the varieties selected (mainly Dutch Robjin) as well as the handling of produce. In all the categories of harvest-related damage, the quantities reported in bomet were significantly lower than those of other counties (Table 9).
In Nyandarua, the quantity harvested per hectare was 16,877.6 kg for contracted farmers and 12,356.4 kg for non-contracted farmers. The high yield for contracted farmers may be attributed to better crop husbandry. However, different to the situation in bomet, contracted farmers in Nyandarua had high quantities of damaged
potatoes per hectare (1,618.8 kg/ha) in comparison to non-contracted farmers (1,202.4 kg/ha). It has been reported that the losses were the result of the contrac-tor’s strict sorting requirements. farmers here are new to contract farming and do not have enough experience in reducing damage or unwanted potatoes. as such, they produced more waste compared to non-contracted farmers. The introduction of unfamiliar standards led to a high proportion of rejects by the contracting processor and so the farmers ended up selling the bulk of the har-vest to traders.

30 POTATO VALUE CHAIN IN KENYA – SURVEY RESULTS
During the wet season, brokers organise tractors to transport potatoes from the field to the road. at other times, potatoes are transported using donkey or ox carts or loaded onto donkeys. lorries/trucks or pickups are also used (Table 40 in annex 2). brokers normally load potatoes onto the truck. Depending on its size, a single bag is carried by three to six people or is loaded on the shoulders of one broker who subsequently throws the bag into a wheelbarrow.
Photograph 4: Brokers on site filling extended bags
Photograph 5: loading and handling of extended bags at nairobi’s Wakulima Market
3.3 Potato marketing
3.3.1 Brokers at the farm levelbrokers act as intermediaries between farmers and local traders and keep in close contact with farmers to stay abreast of the quantities and varieties they have available. brokers work in groups and each group can deal with 30 to 70 farmers. brokers get a fixed fee per bag from local traders.
brokers tend always to be male as the work involves lots of heavy lifting. brokers, contrary to the perception that they exploit farmers, work under very difficult condi-tions. They reported that lifting the heavy bags damages their health and that some have been injured when load-ing and offloading extended bags. It was observed that many of them appeared in poor health.
one of the challenges brokers come up against is the failure to implement standards in potato marketing. as intermediaries between farmers and traders, they have to convince farmers to accept extended bags for sale. Imple-mentation of standard bags would facilitate their busi-ness operations. When brokers pack, they try to avoid including bad quality potatoes in the bags; however, they do not grade or buy potatoes by grade.

31POTATO VALUE CHAIN IN KENYA – SURVEY RESULTS
from here, the produce is usually then distributed to other towns or markets or even to neighbouring coun-tries. There is no storage at the wholesale level and the produce is distributed and sold within a short period. Traders selling at Wakulima in Nairobi cooperate with brokers based at the wholesale markets. The brokers wait for the trucks to arrive at the market and inform their customers about the expected load. all transactions are in the hands of the wholesale market brokers and, when a transaction is agreed, the trader is provided with a receipt of the purchased produce, quantities and price. brokers at Wakulima Market earn commission of around KeS 40-50 (eUR 0.35-0.40) on each bag.
Currently, the main wholesale market in Nairobi (photo-graphs taken in December 2013) is highly congested and spills over into the surrounding areas, where conditions are very unhygienic. The same is true for other markets around the country, yet, in recent years, only a few mar-ket places have benefited from refurbishment.
In rural areas, road infrastructure is very poor and bro-kers have difficulty transporting potatoes from farms. The poor roads cause delays in collecting purchased stocks, which can result in the potatoes going bad. This kind of loss is transferred to the brokers, as the trader may not take the spoilt stock. brokers consider that the main dam-age to potatoes is caused by extended bag sizes but also acknowledge that delayed collection leads to damaged stock. brokers estimate that in each 110 kg standard bag an average of 5 kg of stock will be damaged/lost.
3.3.2 Wholesale and retail tradeDistances from farms to sales points range from 15 km (i.e., a market local to producing areas) to up to 500 km (i.e., where Mombasa or Kampala is the furthest point). Traders buying in the surveyed counties come from Wakulima Market in Nairobi, Kongowea Market in Mombasa or Northern Tanzania. Wakulima Market in Nairobi is the largest terminal market and is estimated to handle over 50 per cent of all potatoes traded in Kenya.
Photograph 6: Conditions at nairobi‘s Wakulima wholesale market

32 POTATO VALUE CHAIN IN KENYA – SURVEY RESULTS
because most of the markets have sections catering to both sectors. Wakulima Market in Nairobi also includes a retail section located in the old covered-market building (Table 42 in annex 2).
The packaging bought also depends on the season and availability of produce. a total of 25 per cent of whole-salers bought standard bags with a Mukurinu closure. These are normally cheaper because the bag is totally closed up, meaning the content is not visible (Table 43 in annex 2). Nylon bags are most commonly purchased and their average weight totals 173 kg. Nylon bags are cheap and strong enough to carry larger quantities compared to jute bags (Table 44 in annex 2).
The majority of retailers interviewed (70.4 per cent) were female and the majority of wholesalers (77.8 per cent) were male. The findings also indicate that most respond-ents (63.5 per cent) had completed higher-level educa-tion at secondary school and college, with male traders having a slightly higher level of education than female traders (66.4 per cent to 59.2 per cent; Tables 30 and 31 in annex 2).
Wholesalers travel more than 300 km to transport pota-toes from the main production areas to the main mar-kets. larger trucks are used to transport goods to urban centres. Retailers mostly buy at the wholesale market or at retail markets with an attached wholesale section and these outlets are used by both retailers and wholesalers
Retailer n=27
Wholesaler n=27
Both retail/wholesale n=9
All n=63
Traders expecting/experiencing damages
from the farm (%) 100.0 76.0 88.9 88.5
from transportation (%) 59.3 60.0 22.2 54.1
from market conditions (%) 96.3 100.0 100.0 98.4
Traders opening bags and repacking (%) 96.2 59.1 77.8 78.9
Main reasons for repacking (%)
When there is visible damage 61.5 13.6 0.0 33.3
When potato greening is visible 29.2 15.4 14.3 22.7
To create into smaller units for sale 95.8 84.6 85.7 90.9
Table 15: Potato traders repacking bags
observations at retail and wholesale markets showed that potato bags are not usually opened until the bags reach the final customer: the retailer. In all, 59 per cent of the interviewed wholesalers reported opening the bags, but mainly to break the stock up into smaller quantities (Table 15). bad quality is not considered an important enough issue for wholesalers to open bags, although they do expect damage from transportation and market con-ditions or even from farms packing bad quality stock in the bags.
Photograph 7: Retailer selling out of an opened extended bag

33POTATO VALUE CHAIN IN KENYA – SURVEY RESULTS
bags, retailers sort the potatoes and any smaller or cut potatoes are then offered to buyers at reduced prices. Retailers consider that, along with the mishandling of extended bags, harvesting methods have a significant im-pact on potato quality (Graph 1).
Since the sorting and grading of harvested potato tubers, undertaken by farmers and brokers, is an activity that neither party takes seriously, the damage occurring to stock at the farm level is then transferred to retailers. It is retailers who eventually open the bags and must deal with the quality of stock they contain. after opening the
opening bags for the load tracking undertaken as part of the survey indicated that damaged, green, diseased and/or infested potatoes are put into bags destined for vari-ous markets. bags opened on farms for the load tracking exercise contained 31 kg of damaged stock in a 198.6 kg bag, with cut potatoes being the most prevalent form of
damage. There were also up to 5.5 kg of green potatoes per bag. When the bags were subsequently opened in the Nairobi market the quantity of damaged stock had risen to 17.5 kg (Table 16), also mainly of cut potatoes. It is expected that this increase in cut potatoes is caused by transport impacts.
graph 1: Causes of damages at retail level
Mishandling at loading/ unloading
10092 92 92
6863,6
59,1
48
Cut tubers Bruised tubers Rotten potatoes greening potatoe
Use of fork/hoe for
harvesting
Harvesting in the rain
Harvesting in the rain
Use of fork/hoe for
harvesting
Dragging/ dropping of
extended bag
Harvesting premature
tubers
Market conditions
Retailers’ opinion on causes of damages in %

34 POTATO VALUE CHAIN IN KENYA – SURVEY RESULTS
In the off-season, cut/damaged potatoes (called makom-bola) are still sold on the market; however, in high season there is less demand for cheap potatoes as prices are lower. The price of cut/damaged tubers is half the price of good tubers – e.g., 1 kg of good-quality tubers is sold at KeS 30 (eUR 0.25) whereas 1 kg of makombola sells at KeS 15 (eUR 0.12).
Table 17 below shows, however, that it is difficult to gen-eralise about damage being caused by packaging, trans-portation and bag handling. During the survey, further bags were opened at retail markets and it became obvi-ous that the quality of potato bags opened in the markets of Mombasa and Nairobi differs significantly. It was reported that bags destined for Mombasa are more care-fully packed than those going to Nairobi because of the long distance involved in transporting goods to Mom-basa. Cut potatoes, which can still be sold at the Nairobi
Place Type of bag Weight per bag Cut green Rotten Total kg losses per bag
Tracking from Nyandarua to Nairobi
Nyandarua – farm level Kata 2 Kamba 5
198.6 23 5.5 2.5 31
Nairobi – retail market Kata 2 Kamba 5
196.5 36 10 2.5 48.5
Place Type of bag Weight per bag in kg Cut in kg green in kg Rotten in kg Total kg losses per bag
Mombasa retail market
Kata 2
Kamba 4
187 11 0 0.5 12
Mukurinu 171 15 0.75 1.5 17.3
Kata 2 Kamba 5
198.5 17 1 1 19
Nairobi retail market
Kata 2
Kamba 4
185 33 33 1 66
Mukurinu 174 53 5 0 59
Kata 2 Kamba 5
205 31 1 1 33
Table 16: Results of bag tracking in kg
Table 17: Results of opening bags at different markets
Photograph 8: Potato sample from load tracking

35POTATO VALUE CHAIN IN KENYA – SURVEY RESULTS
in supermarkets are sold by the kilogram. The sales price of a kilogram varies according to the variety and super-market, but average prices range from KeS 30-80 (eUR 0.25-0.68) per kg.
Supermarkets do not store potatoes, so storage losses are not a factor in their case. losses do occur, however, in shop displays through rotting, greening and weight loss from shrinking and sprouting. Shangi, the most common variety, is known for weight loss and sprouting and Tigoni quickly turns green on the shelves. The losses are esti-mated at up to 25 per cent of the produce traded. as such, supermarkets are keen to procure high-quality potatoes with a long shelf life. However, part of the reported losses could also be attributed to a lack of demand/sales in the supermarkets because consumers prefer to purchase po-tatoes at fresh produce markets.
3.3.4 RestaurantsRestaurants are major outlets for the potatoes consumed in Kenya’s main urban centres. Many of them specialise in chips, a popular dish with the urban population, es-pecially young people. Restaurants use potatoes to make chips banjia (spiced slices of potatoes) and mash-based dishes that use potato on its own or mixed with other ingredients. an increase in fast food restaurants coupled with the arrival of international fast-food restaurants chains like Kentucky fried Chicken (KfC), Chicken Inn and others indicates that the demand for potatoes for processing is increasing.
The majority of the 22 restaurants surveyed (68.2 per cent) source their potatoes from various markets and suppliers, mostly from wholesale and retail markets. The main suppliers are wholesalers (54.5 per cent) but contracted local traders also deliver direct to restaurants (Table 18). Chips were the most common product sold by the restaurants interviewed (90.9 per cent), followed by potato stew and kienyeji (a mashed vegetable dish that is also called mukimo). Chips are prepared manually rather than being purchased ready-made.
market, might be rotten before they reach the market in Mombasa. a further reason might be that there is in-creased quality awareness among customers involved in the tourism sector around Mombasa.
3.3.3 Supermarkets Supermarkets in Kenya come in various sizes: some are quite small and independently owned whereas others are national or multinational retail chains. The large super-market chains like Nakumatt, Uchumi and Tuskeys are expanding with branches in all of Kenya’s larger cities.
The average quantity of potatoes sold per week in each supermarket branch is estimated at 120 kg. Supermarkets are not a popular source of fresh potatoes because con-sumers prefer to buy from open-air markets where they are cheaper and fresher. Supermarkets’ share of potato sales is estimated at just 1 per cent.20
Contracted traders supply the large supermarket chains with fresh potatoes on a weekly basis. The potatoes are brought to the central distribution centre for onward dis-tribution to branches nationwide. Supermarkets handle their own transportation to branches, using crates and refrigerated trucks to prevent any losses during trans-port. Supermarkets buy graded potatoes and will buy-in big tubers and baby potatoes according to consumer de-mand. The potatoes are supplied already sorted and any defective potatoes found in the consignment delivered are returned to the supplier – this includes green, dam-aged or rotten tubers. However, returns are minimal as it is expected that the supplies will meet the standards laid down by the supermarket management.
Purchase prices are more or less stable at all times due to the contractual arrangements in place, averaging KeS 4,000 (eUR 34) for a 110 kg standard bag (eUR 0.31 per kg). The price is relatively high due to the higher quality of potatoes supplied. Supermarkets are the only buyer at the retail level that reward quality supply. Supermarkets do not experience seasonal fluctuations because sup-ply and demand is almost constant. Supermarkets sell fresh potatoes, frozen chips and potato crisps. Potatoes
20 NPCK puts forward an estimate of a 1 per cent market share. Hoeffler and Maingi (2006), on the other hand, reported a 2 per cent market share.

36 POTATO VALUE CHAIN IN KENYA – SURVEY RESULTS
Kenya has an expanding food processing industry, driven by its growing urban population, changing population structure, new eating habits and increased tourism. Three processing companies located in Nairobi and Nyandarua County were interviewed. Two of the processors make potato crisps while the other processes ready-to-cook fresh chips, banjia and ready-to-cook peeled whole po-tatoes.
The most popular processing variety for crisps is Dutch Robjin, grown by farmers in bomet who are contracted to supply the potatoes. Processors are also get their sup-plies from contracted traders who collect potatoes from farmers. Processors complain that contract farming faces many challenges and concerted efforts are required to improve the contract agreements. a particular, complaint processors report is that farmers breach their contracts even though they have been provided with inputs. bro-kers are accused of encouraging farmers to break their agreements by paying them a few KeS more than the contract price.
Most restaurants (90 per cent) stated that they bought graded/sorted potatoes by size (small, medium, large). The preferred variety is Shangi due to its taste and avail-ability (Table 48 in annex 2). on average, restaurants store potatoes for three days, meaning that restaurants are supplied with potatoes two to three times a week. Restaurants did not report on losses occurring when purchasing and processing potatoes, other than that lost through peeling, which is not categorised as loss.
3.4 Potato processing The local fresh potato markets, including supermarkets and retail shops, are the main destinations for produce. according to NPCK estimations, only about 9 per cent of produce goes into potato processing (Table 19). although, in future, a significant increase in demand for processed products is expected, particularly for french fry and po-tato crisp processing. local and international fast-food restaurant chains are reported to be increasing their branch networks in Kenya.
Restaurants purchases In %
Where restaurants buy potatoes (%)
Open market 68.2
Direct from farms 27.3
Delivered to the premises 45.5
From whom restaurants buy potatoes (%)
Wholesalers 54.5
Retailers 22.7
Contracted trader 45.5
Farmers 22.7
Main potato products sold by the restaurant (%)
Potato stew/food 77.3
Chips 90.9
Kienyeji (Mukimo) 31.8
How restaurants prepare potatoes prior to cooking (%)
Peeling by hand/machine 90.9
Shredding by hand/machine 68.2
Table 18: Characteristics of restaurants (multiple choice) Table 19: Market shares of different market channels in the potato value chain
End use Estimated current
Local market 80%
Supermarkets 1%
Restaurants/institutions 10%
Processing 9%
French fries 5%
Crisps and other snacks 3%
Starch/potato flour/flakes 1%
Source: author’s own estimations.

37POTATO VALUE CHAIN IN KENYA – SURVEY RESULTS
Some processors do not have a potato store, so they expe-rience supply shortages in March/april and November/December. Processors operating cold storage facilities store stock for up to four months in 25 kg wooden and plastic crates, which are more suitable for storage. little is lost during storage and using crates also helps to minimise damage and rotting during transportation and storage.
an estimated 1 per cent of each batch of potato crisps will turn brown during frying and must be removed and discarded. another 1 per cent can end up broken and so are discarded or used as an ingredient in other snacks.
Processing companies buy and process 5 to 15 tonnes of potatoes a week. of the potatoes supplied, 3-5 per cent are damaged, immature or rotten. These are considered as rejects and are removed and returned to the supplier, who then discards them. Processors have problems get-ting the right size potatoes for their processing machines: 1 per cent of the potatoes supplied by contractors are undersize and must be removed and discarded, and 4-7 per cent are oversize and cannot be fed through the processing machines. To treat oversize produce, com-panies employ extra personnel to halve the potatoes so they fit into the processing machines.
The Kenyan potato processing industry is expected to increase substantially

38 ANALYSIS OF FOOD LOSSES AND OPTIONS FOR FOOD LOSS REDUCTION
ed potatoes. Since around 53 per cent of these volunteer stocks are later used for home consumption, only 47 per cent (304.2 kg) of these potatoes are ultimately lost.
4.1 Assessment of quantitative and financial losses in the potato value chain
Critical loss points and quantitative assessmentall reported forms of damage and loss occurring along the value chain are listed in the following table. However, it is not possible to calculate totals for the reported losses because the relevance of each market channel differs in terms of potato sales.
4 Analysis of food losses and options for food loss reduction
VC function Critical loss points Average losses Average damages Remarks
Harvesting Left in the field 2.1%Average yield of 14.2 tonnes/ha (including stock set aside for home use)
Harvesting tool 4.0%
Harvesting in the rain 2.8%
Casual labour 3.4%
Storage Storage losses 0,8%
Broker Sorting by brokers 5% Per standard bag of 110 kg
Transport/ packaging
6.5% cut 2.3% green
Per extended bag
Wholesaler/
retailer
Market share 80%
1.3% rotten 11.6% cut 2.8% green
Per extended bag
Supermarket Display shelves Market share 1%
25% Per consignment
Restaurants Market share 10%
No losses reported
Processing Quality checking of supplies
Market share 9%
3-5% rejects, 1% undersized
Per consignment
5% over-sized Extra cutting that requires employing extra staff
Processing 2% Burned, broken
Table 20: Synopsis of reported damage/loss along the value chain
The results of this study show rough loss data but do not consider the economics of these losses. In reality, it is not feasible to achieve zero losses and a certain level of losses must be accepted, depending on market prices and exist-ing infrastructure. actual losses for farmers, processors and marketers are therefore smaller than estimated in this study.
loss and damage reported at the farm level in the survey are summarised in Table 21. all quantities shown repre-sent the overall average for surveyed farms in one season. Potatoes left in the field (volunteer plants) amount to about 650.1 kg per hectare and are added to the harvest-

39ANALYSIS OF FOOD LOSSES AND OPTIONS FOR FOOD LOSS REDUCTION
The difference between the percentage of damage and loss found at the farm gate (15.6 per cent) and at the retail point (24.4. per cent) (Table 22) can be attributed to bag handling, packaging and transportation. because they are so heavy, large bags are dragged and dropped. This results in splitting and bruising tubers, which even-tually rot. also, because of the packing methods used, potatoes can be exposed to sunlight, which turns them green.
With regard to the other listed forms of damage/loss, it is difficult to define the real losses at the farm level because, as Table 22 shows, large quantities of damaged potatoes still leave the farm and are sold on to traders and retail-ers. In this context, 12.8 per cent of potatoes produced can be classified as lost or damaged. Harvesting tools caused the highest amount of damage on farms, followed by harvesting labour and harvesting during the rain.21 losses occurring during the storage of seed potatoes are of minor importance.
21 The figures used here for the quantities of stock damaged through harvesting in the rain represent the average levels of damage expected on farms overall.
Production and loss at the farm level per ha All farmers interviewed As a %
Production and losses per ha per season
Yields in kg per ha 13,551.6
Left in field after second gathering (kg) 650.1
Total production plus produce left in field (kg) 14,201.7
Loss/damage at the farm level
Losses from produce being left in the field (kg) 304.2 2.2%
Damage caused by harvesting in the rain (kg) 344.2 2.4%
Damage caused by harvesting tools (kg) 568.2 4.0%
Damage caused by labour (kg) 488.2 3.4%
Losses during storage (kg) 119.0 0.8%
Total damage and losses at the farm level (kg) 1,823.9
Percentage damaged/lost at the farm level 12.8%
Table 21: Production and loss/damage at the farm level
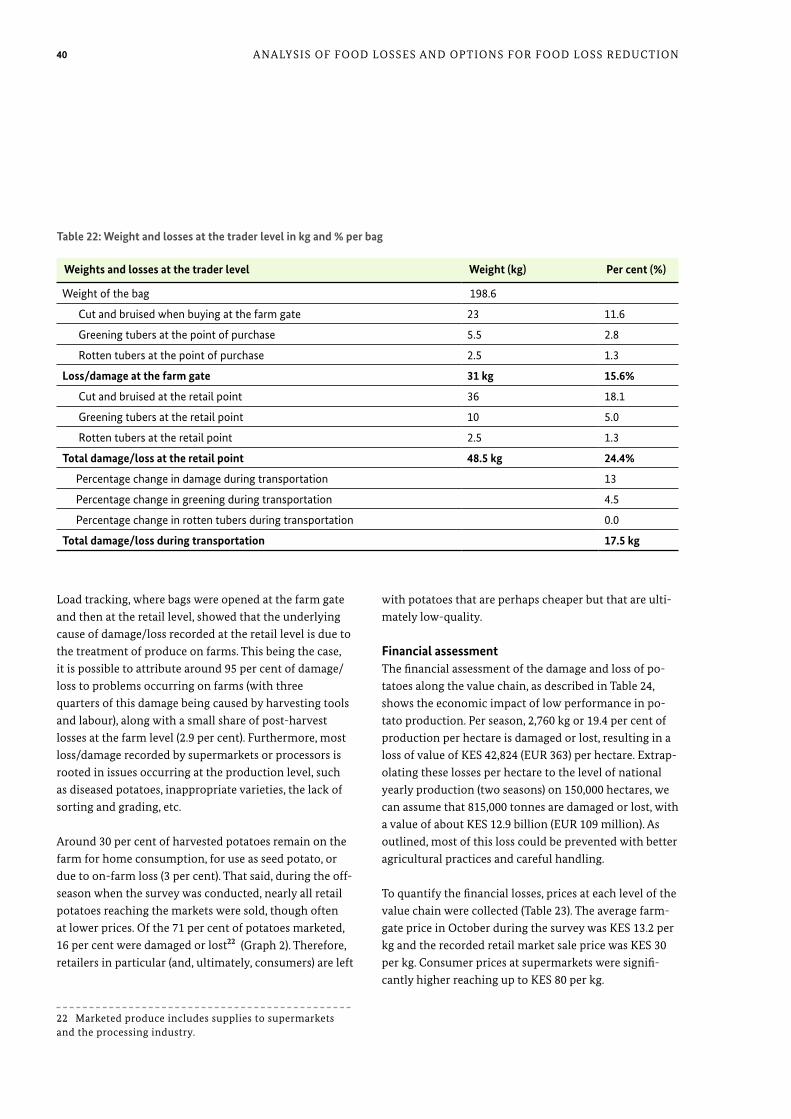
40 ANALYSIS OF FOOD LOSSES AND OPTIONS FOR FOOD LOSS REDUCTION
with potatoes that are perhaps cheaper but that are ulti-mately low-quality.
Financial assessment The financial assessment of the damage and loss of po-tatoes along the value chain, as described in Table 24, shows the economic impact of low performance in po-tato production. Per season, 2,760 kg or 19.4 per cent of production per hectare is damaged or lost, resulting in a loss of value of KeS 42,824 (eUR 363) per hectare. extrap-olating these losses per hectare to the level of national yearly production (two seasons) on 150,000 hectares, we can assume that 815,000 tonnes are damaged or lost, with a value of about KeS 12.9 billion (eUR 109 million). as outlined, most of this loss could be prevented with better agricultural practices and careful handling.
To quantify the financial losses, prices at each level of the value chain were collected (Table 23). The average farm-gate price in october during the survey was KeS 13.2 per kg and the recorded retail market sale price was KeS 30 per kg. Consumer prices at supermarkets were signifi-cantly higher reaching up to KeS 80 per kg.
load tracking, where bags were opened at the farm gate and then at the retail level, showed that the underlying cause of damage/loss recorded at the retail level is due to the treatment of produce on farms. This being the case, it is possible to attribute around 95 per cent of damage/ loss to problems occurring on farms (with three quarters of this damage being caused by harvesting tools and labour), along with a small share of post-harvest losses at the farm level (2.9 per cent). furthermore, most loss/damage recorded by supermarkets or processors is rooted in issues occurring at the production level, such as diseased potatoes, inappropriate varieties, the lack of sorting and grading, etc.
around 30 per cent of harvested potatoes remain on the farm for home consumption, for use as seed potato, or due to on-farm loss (3 per cent). That said, during the off-season when the survey was conducted, nearly all retail potatoes reaching the markets were sold, though often at lower prices. of the 71 per cent of potatoes marketed, 16 per cent were damaged or lost22 (Graph 2). Therefore, retailers in particular (and, ultimately, consumers) are left
22 Marketed produce includes supplies to supermarkets and the processing industry.
Weights and losses at the trader level Weight (kg) Per cent (%)
Weight of the bag 198.6
Cut and bruised when buying at the farm gate 23 11.6
Greening tubers at the point of purchase 5.5 2.8
Rotten tubers at the point of purchase 2.5 1.3
loss/damage at the farm gate 31 kg 15.6%
Cut and bruised at the retail point 36 18.1
Greening tubers at the retail point 10 5.0
Rotten tubers at the retail point 2.5 1.3
Total damage/loss at the retail point 48.5 kg 24.4%
Percentage change in damage during transportation 13
Percentage change in greening during transportation 4.5
Percentage change in rotten tubers during transportation 0.0
Total damage/loss during transportation 17.5 kg
Table 22: Weight and losses at the trader level in kg and % per bag

41ANALYSIS OF FOOD LOSSES AND OPTIONS FOR FOOD LOSS REDUCTION
23
23 http://www.hortinews.co.ke/article.php?id=593 (20th february 2013).
Value chain october/november 2013 Remarks
Farm gate: farmer 9-19 KES/kg
13.2 KES/kg PHL survey data
Farm gate: broker 11.8 KES/kg Information from brokers on farm gate prices
Wholesalers 18.7 KES/kg Information from brokers
10.0-21.4 KES/kg 15.6%
14.4 KES/kg Survey data
Processing 20.0 KES/kg Information from processors23
Supermarkets 36.4 KES/kg
Retailers 13.3-26.6 KES/kg PHL survey data
16.5 KES/kg Average price paid by retailers
Restaurant 26.8 KES/kg
Consumer 30-80 KES/kg KES 30 at retail markets and up to KES 80 in supermarkets
Table 23: Average potato purchase prices in october/november 2013
graph 2: Use and quality of potatoes
Marketed produce (decent quality) 55%
Retail level damages 9%
Market losses 1%
Transport damages 6%
Home use 12%
Seed 14%Storage loss 1%
Left over in the field 2%
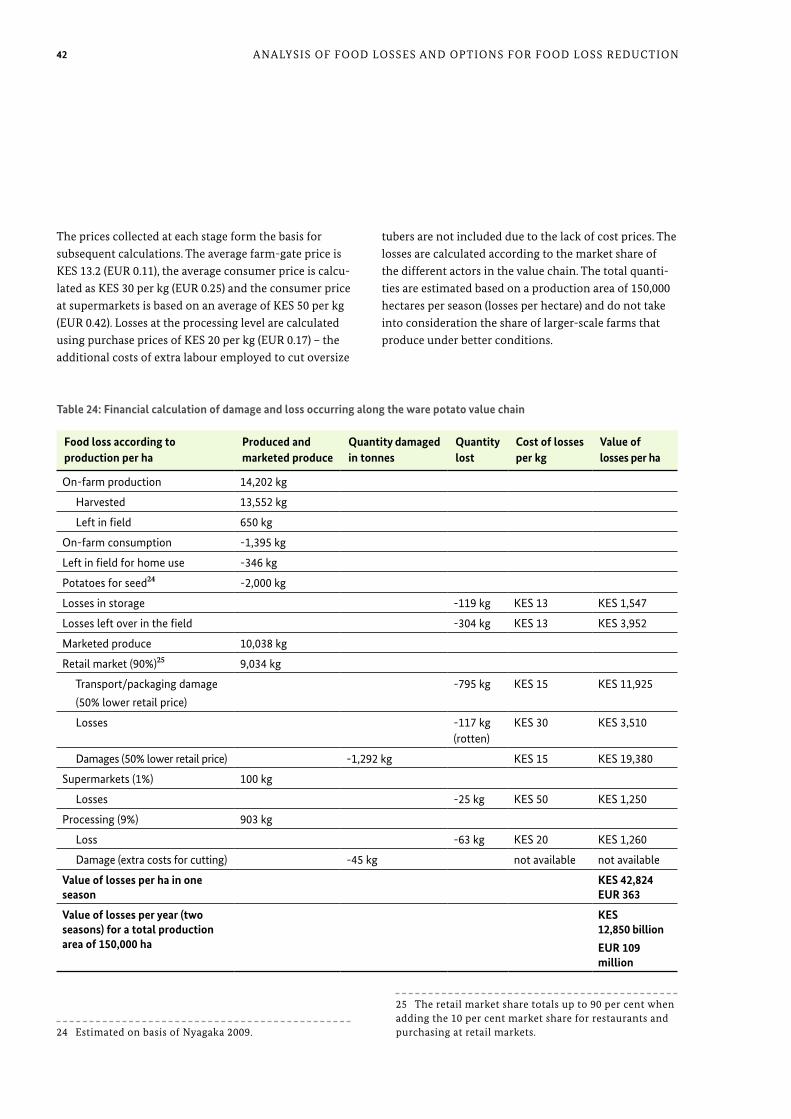
42 ANALYSIS OF FOOD LOSSES AND OPTIONS FOR FOOD LOSS REDUCTION
tubers are not included due to the lack of cost prices. The losses are calculated according to the market share of the different actors in the value chain. The total quanti-ties are estimated based on a production area of 150,000 hectares per season (losses per hectare) and do not take into consideration the share of larger-scale farms that produce under better conditions.
The prices collected at each stage form the basis for subsequent calculations. The average farm-gate price is KeS 13.2 (eUR 0.11), the average consumer price is calcu-lated as KeS 30 per kg (eUR 0.25) and the consumer price at supermarkets is based on an average of KeS 50 per kg (eUR 0.42). losses at the processing level are calculated using purchase prices of KeS 20 per kg (eUR 0.17) – the additional costs of extra labour employed to cut oversize
Food loss according to production per ha
Produced and marketed produce
Quantity damaged in tonnes
Quantity lost
Cost of losses per kg
Value of losses per ha
On-farm production 14,202 kg
Harvested 13,552 kg
Left in field 650 kg
On-farm consumption -1,395 kg
Left in field for home use -346 kg
Potatoes for seed24 -2,000 kg
Losses in storage -119 kg KES 13 KES 1,547
Losses left over in the field -304 kg KES 13 KES 3,952
Marketed produce 10,038 kg
Retail market (90%)25 9,034 kg
Transport/packaging damage
(50% lower retail price)
-795 kg KES 15 KES 11,925
Losses -117 kg (rotten)
KES 30 KES 3,510
Damages (50% lower retail price) -1,292 kg KES 15 KES 19,380
Supermarkets (1%) 100 kg
Losses -25 kg KES 50 KES 1,250
Processing (9%) 903 kg
Loss -63 kg KES 20 KES 1,260
Damage (extra costs for cutting) -45 kg not available not available
Value of losses per ha in one season
KES 42,824 EUR 363
Value of losses per year (two seasons) for a total production area of 150,000 ha
KES 12,850 billion
EUR 109 million
Table 24: Financial calculation of damage and loss occurring along the ware potato value chain
24
24 estimated on basis of Nyagaka 2009.
25
25 The retail market share totals up to 90 per cent when adding the 10 per cent market share for restaurants and purchasing at retail markets.

43ANALYSIS OF FOOD LOSSES AND OPTIONS FOR FOOD LOSS REDUCTION
signal could come from contract farming, which helps farmers to exit the vicious circle of insecure markets and exploitation through extended bags. as the case of the contract farmers in Nyandarua shows, capacity building of farmers – especially with the support of extension ser-vices – is key for delivering on-farm improvements.
below, the challenges to and options for improving the performance of the ware potato sub-sector along its value chain are outlined and serve to contribute towards the development of the sub-sector. as outlined in the World Resource Institute’s working paper (lipinski et al. 2013), it is important to note that technical solutions, for example, can only be effective when deployed in close coordination with other parts of the value chain. for example, improved on-farm storage will not ultimately lead to reductions in food loss if market prices do not provide profit gains from storage. Therefore, progress in reducing food loss and waste will require an integrated value-chain approach.
4.2.1 Seed improvements New varieties and rapid multiplicationSeed potato research is dominated by KaRI-Tigoni (National Potato Research Centre) and supported by the International Potato Center (CIP). along with being the main bodies involved in potato research in the country, these two organisations constitute the major sources of breeding materials and pre-basic seed potatoes. Until 2008, the only source of mini-tubers in Kenya was a con-ventional soil-based production system at KaRI-Tigoni. In 2008, aeroponics technology for mini-tuber produc-tion was introduced in order to speed up the distribution of newly released varieties to farmers.
Due to Kenya’s very strict quarantine regulations, im-porting high-quality seed potatoes has been difficult and, over the past 30 years, no certified seed potatoes have been imported. However, after a long period during which Kenya barred seed imports, the Kenyan Ministry of agriculture, livestock and fisheries has begun coop-erating with the Dutch Government and private compa-nies on a fast-track system for the rapid multiplication of certified seed. after agreement between the Kenyan and Dutch phytosanitary authorities was reached, Dutch seed potatoes of the Désirée variety (a variety registered in Kenya) were imported.
4.2 Challenges and options for food loss reduction
The Kenyan Government has recognised the critical role potato plays in alleviating food shortages in the context of the decreasing production of maize and other staples (Mwaura 2009). The development of potato production could form part of the solution for tackling food short-ages given that potato has higher yields compared to maize.26 as such, improvements in the potato sub-sector will also benefit food security in the country. Due to the increasing importance of the potato crop, a number of initiatives to improve performance in the potato sub-sector are now in place. Several international donor projects and local and international NGos are working in cooperation with CIP and Kenyan institutions like KaRI and NPCK on the different challenges arising along the value chain.
It is intended that the findings of this study on post-harvest losses of potato will also contribute to the devel-opment of the sub-sector and, in particular, will serve to support the Kenyan Government in its efforts to improve the development of the potato value chain.
although the study focuses on post-harvest losses, the results indicate that a very high level of loss-causing factors occur at the production level, because potato production practices in Kenya remain suboptimal. The problems identified as occurring on farms require capac-ity building and investment in order to change produc-tion patterns and improve harvesting techniques and on-farm infrastructure.
Therefore, to make significant change happen, market signals involving better prices for better quality27 are re-quired to stimulate farmers’ interest in better production results. a starting point for improvements could be the introduction of standardised bags, allowing better han-dling and the fair payment of farmers. a further market
26 fao (2009) established cereal and maize equivalents based on the calorie content of selected foods, which indicate that five units of potato can replace one unit of maize. 27 farmers cited market demand and pricing as important challenges (Table 47 in annex 2).

44 ANALYSIS OF FOOD LOSSES AND OPTIONS FOR FOOD LOSS REDUCTION
fungicide and employee wages have been rising and that this affects their incomes. Consequently, the lack of funds to buy inputs was reported as the second most important problem affecting potato production in Kenya (Kaguongo et al. 2008). In short, plant diseases and access to inputs and seed are the major challenges farmers face in their production activities (Table 32 in annex 2).
The situation is further aggravated by the fact that rem-nant tubers remain in the soil after harvest and produce volunteer plants in the next crop. farmers reported up to 304 kg/ha remain in the field and these allow diseases to carry over from one season to the next.
KaRI28 performed a cost-benefit analysis on different seed types under current and target conditions which showed that, although yields from certified seeds were the highest (12.7 tonnes/ha), they still fell well short of the expected yields of 25 tonnes/ha envisaged by KaRI-Tigoni. although seed quality is important in determin-ing yields, other factors like management practices, disease prevalence and control methods play equally important roles.
Therefore, both small-scale and larger-scale farmers should be supported in developing good agricultural practices to improve soil fertility, seed quality, fertilis-ing and spraying. at present, NPCK and CIP are working on guidelines for good agricultural practices (GaP) in the potato sub-sector in cooperation with Kenya-GaP, a GlobalGaP-benchmarked GaP initiative in Kenya for fruit, vegetables and flowers (Muthoni et al. 2013).
28 Kenya GaP is a trademark is registered to the fresh Produce exporters association of Kenya (fPeaK). Kenya GaP is a quality assurance scheme based on: the principles of good agricultural practice, hazard analysis critical control point principles for food handling and marketing, local regulations, and Ilo conventions ratified by the Govern-ment of Kenya.
The limited availability and use of quality seed potato is a key barrier to increasing productivity in Kenya’s potato sector. as such, seed potatoes need to be made available and affordable for small-scale growers. a survey conduct-ed as part of a study on the ‘Value of seed potatoes from four systems in Kenya’ (Kaguongo et al. 2014) showed that farmers were aware of the importance of using high-quality seed and were willing to pay higher prices for quality. on average, farmers were willing to pay 190 per cent of the price of farmer seed for certified seed and 170 per cent of the price of farmer seed for clean seed. This indicates that farmers recognise the importance of good quality seed in potato production and are willing to pay a premium price for quality.
Improved distribution networkThe major weakness in seed potato production is the absence of a distribution system for certified seed output. farmers wishing to buy seed potatoes must travel to, for example, KaRI centres, which are sometimes located more than 200 km away. Improving the seed potato dis-tribution network is therefore of the utmost importance if more farmers are to have access to certified seed.
4.2.2 Improved production and harvesting technologies Improved soil fertility, soil analysis and crop husbandrySoil fertility is one of the major problems for potato farm-ing in Kenya. The poor yields that farmers achieve are directly linked to the poor state of their soils and a lack of crop rotation. although interviewed farmers reported that they carry out crop rotation, the frequency of their rotations is low. according to CIP (Kaguongo et al. 2008), 21 per cent of farmers indicate that they grow potatoes in the same plot continuously, with another 24 per cent in-dicating that they grow potatoes in the same plot in three out of every four seasons. only 55 per cent of farmers practice some form of regular rotation, with at least two out of every four seasons being given over to crops other than potato.
fertiliser use in Kenya is low compared to the recom-mended rates of application, which results in the rapid decline of soil fertility. The biggest complaint farmers make is about increasing input costs and this factor re-sults in the limited use of agro-inputs. about 38 per cent of farmers in Kenya stated that the costs of fertiliser,

45ANALYSIS OF FOOD LOSSES AND OPTIONS FOR FOOD LOSS REDUCTION
Kenya Mpya) or for processing (such as the Dutch Robjin or Désirée). The unofficial variety, Shangi, which is the most popular on the market, showed poor levels of stor-ability but could be planted two to three months after harvest. That said, KaRI still favours the Shangi variety due to its short dormancy periods. according to KaRI, the variety Shangi should be officially recognised as a quick sprouting variety, which is a good characteristic for complementing on-farm storage and mitigating climate change.
Cold storage for seed potatoesaccording to the Dutch study ‘Value chain of seed and ware potatoes in Kenya’ (Janssens et al. 2013), modern cooled storage facilities should have a minimum capacity of 100 tonnes, given that costs decrease the more storage capacity is increased. The costs of storing seed potato long term are calculated to be eUR 0.33 per kg in a 100-tonne store and drop to eUR 0.13 per kg in a 400-tonne store. Investments required per tonne are rather high for storage capacities of 400 tonnes or less. Thus, small cold storage facilities are relatively expensive and will substantially raise seed prices. Consequently, professional modern storage is more attractive for farm-ers, farmer groups or processors who store big quantities.
Improved packagingSorting and grading of potatoes is not performed in earnest because the fresh produce market currently fails to reward good quality. The market offers no price in-centives for quality potatoes – potatoes are traded on a per-bag basis with no price differential for mature, large tubers. farmers are, therefore, not motivated to grade po-tatoes or to pack well-matured potatoes.
The Kenyan Government attempted to improve packag-ing in 2005 and again in 2008. legal Notice No 113 of 2008 and No 44 of 2005 specified that potato must be marketed in a standard 110 kg bag. However, the imple-mentation of this law did not effect real change as it was not properly enforced. Recently, the Government, NPCK and counties have kick-started a new initiative to intro-duce a maximum 50 kg bag in line with the requirements of the International labour organisation (Ilo).
Adequate harvesting toolsThe level of mechanisation on medium-size and large-scale farms is medium to low and machinery is often fairly old. on smallholdings, most work is performed manually, which results in significant damage to and losses of potatoes. as the survey shows, damage caused by casual labour and harvesting tools like the fork jembe equals 7.3 per cent of on-farm losses.
an ongoing challenge for reducing damage is the pres-ence of farms that are too small for mechanisation. Therefore, the size of machinery supplied for potato pro-duction in Kenya should be tailored to local needs and take into account the workforce involved in harvesting. Smallholders should also group together to share equip-ment and thereby generate economies of scale.
4.2.3 Improved post-harvest handling Traditional storage alternativesa major challenge in improving the on- and off-farm use of storage and storage technology is the improvement of seed and ware potato varieties and quality. Diffused light stores (DlS) and improved traditional stores (with char-coal-coated walls) have proved to be useful low-cost stor-age alternatives, in particular for storing seed potatoes. However, neither of these storage technologies is widely used in Kenya because the provision of information and training on these technologies is limited. a further aspect limiting the use of and investment in storage is the cur-rent preference for growing Shangi potatoes, which are not suitable for storage.
KaRI recently conducted an on-farm storage trial in Nyandarua County using seed tubers of eight officially recognised Kenyan potato varieties as well as farmers’ preferred variety, Shangi. The seeds were stored for up to eight months under DlS conditions in low-cost struc-tures to test the feasibility of prolonged seed storage on farms.
The results of this study have shown that it is feasible to store healthy seed tubers of currently available potato va-rieties in Kenya on farms and at low cost. Varieties select-ed for long-term storage should have a long dormancy and be in high demand, either for the market (such as the

46 ANALYSIS OF FOOD LOSSES AND OPTIONS FOR FOOD LOSS REDUCTION
Market infrastructureThe major markets for potatoes are in large urban areas like Nairobi, Mombasa, Nakuru and Kisumu. The Wakulima Market in Nairobi is the largest terminal market handling over 50 per cent of all potatoes traded in urban markets. However, the 2.4-hectare market can no longer cope with supply and demand. This situation has resulted in high levels of congestion and market activities spilling over into surrounding areas where conditions are very unhygienic. The physical improve-ment of Nairobi Market is decades overdue but the efforts of the international donor community to convince the Government and Nairobi City Council to set up a new wholesale market outside the city centre have so far failed. The same applies for other marketplaces in the country and only a few market sites have been refurbished in recent years.
Improving the marketing system, and in particular market infrastructure, would help to reduce losses as it is reasonable to assume that modern infrastructure would also have an impact on quality awareness.
4.2.4 Improved conditions for the processing industry VarietiesKenya has an expanding food processing industry, driven by its growing urban population, changing population structure, new eating habits and increased tourism. The industry requires potato varieties with better processing qualities (for example, Dutch Robjin, which is suitable for crisps) to replace the traditional varieties that are suscep-tible to bacterial and viral diseases. Processors are calling for suitable varieties that meet their needs for better-quality raw material for processing. There is a need for a concerted effort from all stakeholders to introduce new processing varieties in the country in order to improve the competitiveness of the industry.
furthermore, processors should be supported in develo-ping stable business relationships with farmers to ensure the provision of suitable varieties, appropriate sorting and constant supply. The production of properly sorted suitable varieties would, in particular, have a notable impact on reducing losses and, hence, on the com-petitiveness of the industry.
a study conducted by KaRI in 2009/2010 (Kasina & Ndritu 2010) analysing the low levels of adoption of the 2008 legal Notice showed that 92 per cent of interviewed traders were aware of the new potato packaging regula-tions, though only 16 per cent implemented them. lack of enforcement and the absence of additional benefits/incentives are the main reasons traders fail to comply with the regulation. Traders reported good profits from trading with extended-size bags (with 53 per cent gains) compared with standard bags (with 44 per cent gains). The key challenge for implementing the regulations is market competition (24 per cent), since demand for extended bags among retailers remains high. The rea-son extended bags are popular is that using a fixed bag size and weight results in sales being charged accord-ing to weight. The advantage of using extended bags is, conversely, the vague definition of bag sizes that can be used to exploit farmers. Damage/losses are costed in and mean lower prices for traders. Therefore, traders offering standard-size bags fear losing out to competitors offering extended ones. among the farmers interviewed, 97 per cent were aware of the new regulations but competition (63 per cent) and the lack of enforcement by Government agencies (27 per cent) were cited as barriers to implemen-tation.
as the survey shows, extended bags have a severe im-pact on the quality of produce marketed. The fact that payments for large volumes are inadequate encourages farmers (and brokers) to pack all potato stocks regard-less of their quality. furthermore, the packaging material and difficulty in handling the large bags cause additional losses. an agreement on smaller bag sizes would be a first step towards better quality and would send an important market signal to farmers.
To ensure the law is enforced, any process to improve packaging should involve brokers, local traders, whole-salers, retailers and local authorities so that the result-ing agreement is supported by all actors along the value chain.29 In general, standards should be established for general measurement according to weight.
29 extended bags are also commonly used for other commodities. Therefore, legal notices should not be limited to potatoes.

47ANALYSIS OF FOOD LOSSES AND OPTIONS FOR FOOD LOSS REDUCTION
4.2.5 Capacity building and agricultural finance Human capacity developmentThe level of education of farmers, number of extension visits and access to credit are significant variables for improving the level of economic efficiency in potato production. It is, therefore, necessary to expand farmer training in improved agronomic and management prac-tices, with the support of extension services. Priority should be given to innovative approaches that enhance extension and farmer training, such as: (i) the use of group approaches; (ii) farmer-led extension, such as farmer field schools with demonstration plots and on-farm trials; and (iii) the provision of communications technology (ICT) to support agricultural extension (Nyagaka 2009).
In addition to farmers, traders are also in need of com-prehensive training to improve the capacity of those in-volved in post-harvest handling and storage, and in pro-cessing and marketing. Training should also be provided to operators in the wholesale and retail markets on how to improve product handling and storage and thereby maintain quality and reduce physical losses.
Agricultural financea major problem also seen as affecting the financial situation of farmers is that of achieving economies of scale. When operating small potato plots of 0.2 to 0.6 hectares, it is difficult for an individual smallholder to earn enough income to cover the costs of the required inputs. The banking system in Kenya is well capitalised and is known to work well, even in rural areas. access to short-term credit for input supply or working capital has improved and is increasingly being used. yet, reaching the majority of smallholders needing to invest in their agriculture remains a challenge.
Contract farmingContract farming is already a well-known arrangement in Kenya. However, problems are arising in the coopera-tions between the potato processing industry and ware potato farmers. farmers surveyed in Nyandarua had had their contract with the processing industry terminated because of issues arising from the strict sorting standards and they ended up selling the bulk of their stock to local traders. Processors cooperating with farmers in bomet encountered problems with side-selling and also termi-nated their agreement. Conversely, farmers complain about the high price or low quality of supplied inputs. The potato processing industry is still in its infancy and this is also true of the partnerships being developed be-tween potato farmers and the industry.
Contract farming is a business model for the interface between farm supply and industrial procurement, link-ing the buyer’s strategy with the suppliers’ farming systems. It can be an appropriate tool for promoting inclusive business models, giving small-scale farmers an opportunity to join in the venture, an equal voice in contract negotiations, a fair reward and a reasonable ap-proach to risk sharing.
Contract farming is primarily characterised by the in-terdependency of the contracting parties and the risks involved should the contract farming arrangement not be appropriate for ensuring either partner fulfils their obligations. Default risks are high on both sides and are frequently reasons for failure, as outlined above. There-fore, sound planning, appropriate skills and adequate approaches are key to the success and sustainability of contract farming schemes. With its recently published Contract farming Handbook (Will 2013), GIZ provides practical guidance to practitioners on the business model required to deliver innovation at the interface between farm supply and firm procurement. a train-the-trainer curriculum has been developed and a first round of courses has been delivered in Zimbabwe, Kenya and Thailand. In addition, projects in eastern and Western africa are currently adapting the training course to meet the needs of different target groups (e.g., farmer business Schools). Teams of local and international business advi-sors are available for assisting companies and farmers to set up contract farming schemes using GIZ’s business model approach.

48 ANALYSIS OF FOOD LOSSES AND OPTIONS FOR FOOD LOSS REDUCTION
4.3 list of important actors in the potato sub-sector
The following table provides an overview of relevant actors in the potato sub-sector who may be able to con-tribute to minimising losses in potato production and marketing.31
31 Government of Kenya, agricultural Sector Coordination Unit (aSCU), National agricultural Sector extension Policy (NaSeP), June 2012.
Given that enhanced access to credit will contribute to productivity gains, innovative ways need to be devised to ensure farmers can access credit at a reasonable cost. Contract farming can also play a role in opening up ac-cess to finance and achieving economies of scale – for instance, the economies of scale that a contractor (a large farm or processor) can achieve will cut the cost of inputs and transportation. furthermore, the contract can be used as guarantee for the banks, resulting in a tripartite agreement between the bank, processor and farmer.30
30 Main sources: Moalf 2010 and Kaguongo 2013.
Actors name Role
Government Ministry of Agriculture, Livestock and Fisheries (MoALF),
State Department of Agriculture
The Ministry is aiming to revitalise the Kenyan potato sector and is responsible for implementing the Agricultural Sector Development Strategy 2010-2020, the National Root and Tuber Crops Policy (2010), the Seed Potato Strategy (2009) and the Seed Potato Sub-sector Master Plan 2009-2014, as well as legal notices addressing the packaging of seed and ware potatoes.
Extension services In 2012, the Government published the National Agricul-tural Sector Extension Policy to improve the extension system.31
Extension services are mainly provided by the public sector (central and local governments, research and training institutions) and private and civil society sector operators (companies, NGOs, cooperatives and community-based organisations).
Research/
institutions
Kenyan Agricultural Research
Institute (KARI)
This national institution brings together research programmes in various fields. Seed potato research is dominated by KARI-Tigoni (National Potato Research Centre) and supported by the International Potato Center (CIP). Along with being the main bodies involved in potato research in the country, these two organisations constitute the major sources of breeding materials and pre-basic seed potatoes.
Table 25: Relevant institutions and actors along the potato value chain30

49ANALYSIS OF FOOD LOSSES AND OPTIONS FOR FOOD LOSS REDUCTION
Actors name Role
Kenya Plant Health Inspectorate Service (KEPHIS)
KEPHIS is the regulatory agency for the quality assurance of agricultural inputs and produce in Kenya. It undertakes plant variety protection, seed certification, phytosanitary inspection of imports and exports, and analysis of soil, water, agricultural produce, fertilisers and pesticides. KEPHIS is a government institution with the mandate for both quarantine issues and seed certification. KEPHIS is also responsible for providing import permits for seed potatoes and performing import inspections.
Kenya Industrial Research and Develop-ment Institute (KIRDI).
The processing value chain is regulated by KIRDI. It is a national research institute under the Ministry of Trade and Industry and is mandated to undertake multidisciplinary research and development in industrial and allied technolo-gies. The mandate includes reducing post-harvest food losses through development, adoption, adaptation and transfer of appropriate food processing and storage tech-nologies. Specific activities or projects related to the potato processing industry are not known.
The National Potato Council of Kenya (NPCK)
NPCK was formed as a result of the transformation of the potato value chain development committee, which had been formed through GIZ-PSDA and MoALF initiatives. The NPCK was registered in August 2010 and was launched on 25th November 2010 by the Permanent Secretary of the Ministry of Agriculture. NPCK provides coordination, link-ages and information support for the various actors and operators in the potato industry.
International Potato Center (CIP) CIP is headquartered in Peru and has a regional office in Nairobi. CIP is an international research institute that is part of the Consultative Group on International Agricultural Research (CGIAR). It is responsible for global potato germ plasm and develops and disseminates new and improved clones, varieties and technologies aimed at improving yields, nutrition and market access. Over the years, CIP has provid-ed technological backstopping to the seed potato industry in the country.
Farmers’ organisations
Kenyan National Federation of Agricultural Producers (KENFAP)
KENFAP is the umbrella body of farmers in the country, bringing together 60 farmers’ associations at the county level, 36 national commodity-based associations, 16 co-operatives and close to 8,000 farmers’ groups. Since the federation started focusing on group-based institutional members, the membership has grown to include commod-ity associations such as the Kenyan National Potato Farmers Association. KENFAP partnered MoALF in implementing the legal notice on standard bags in 2005 and developed a bag specifically for handling potatoes.

50 ANALYSIS OF FOOD LOSSES AND OPTIONS FOR FOOD LOSS REDUCTION
Actors name Role
Kenya National Potato farmers as-sociation (KeNaPofa)
KeNoPofa operates under the umbrella of KeNfaP and is also engaged in implementing standard bags. KeNaPofa officials are now also recognised as enforce-ment officers. The association was founded in 2003 and has a membership of 10,400 farmers who grow 3,350 hectares of potato. KeNaPofa’s offices are located within KaRI-NaRl and it employs a coordinator under the supervision of the NPCK.
Large-scale farms involved in seed production
Agricultural Development Corporation (ADC)
As a provider of quality seed to Kenyan farmers, the para-statal institution ADC is a main seed grower in Kenya. ADC currently has around 80 ha under certified seed potatoes, but this area is projected to increase to almost 300 ha. The corporation’s long-term goal is to cultivate 1,200 ha of cer-tified seed potatoes. ADC is in the process of building up its capacity for basic seed production by installing greenhouses and aeroponics units. ADC’s major weakness is its lack of a distribution system for the certified seeds it produces – farmers seeking their seed potatoes must travel to Molo.
Midlands Midlands is a private company with farmers owning shares and is registered to produce certified seed.
Kisima Farm Kisima Farm is a farmer-owned company specialising in horticulture (flowers) and arable farming (1,300 ha), and is registered to produce seed potato (100 ha). As a leading certified seed producer, Kisima Farm has supported over 40,000 smallholders with clean seed material. The farm produces 2,700 tonnes of certified clean seeds with its aero-ponics system.
Processing sindustry
DEEPA Industries Ltd This processor has an 80% market share of potato crisp production and uses contract farming approaches to work with ware potato growers in Bomet county.
NORDA NORDA is a smaller-scale but high-quality potato crisp manufacturer. The crisp processing line has a capacity of 15 tonnes of fresh potato per week. Norda exclusively sources the Dutch Robjin variety, mainly from Bomet County, but also from Narok and Meru Counties (which operate irrigation systems).
Njoro Canning Njoro Canning contracts farmers to produce and supply potatoes. It processes and stores frozen fast food in its storage depots located in Njoro, Nairobi and Mombasa.
MIDLANDS Processing Co. Ltd MIDLANDS Processing Co. Ltd has contracted with up to 10,000 farmers in Nyandarua County. It has a processing capacity of 50 tonnes per hour. The company has contracted farmers to produce potatoes and other horticultural pro-duce. It is the only company that produces and processes potatoes, offering fresh, pre-cooked, frozen and blanched potatoes.

51ANNEX
Annex
County Sub-county Ward/ location
Sub- location
Village number of farmers
Sample size
BoMET Bomet Central
Township Kapsimotwo Kapsimotwo 4
Kipkoi Kipkoi 4
Chesoen Chesoen 4
Chepngaina Kecheyat 4
Singorwet Singorwet Singorwet 4
Chuiyat 4
Chambor 4
Matumbru 4
Aisaik Aisaik 4
Bomet East Merigi Merigi Kaptemo 4
Merigi Merigi 4
Chemaner Chemaner Chemaner 4
Chambori Chambori 4
Total 2 4 13 52
County Sub-county Ward/ location
Sub- location
Village number of farmers
Sample size
MERU Buri Kibiricha Kibiricha Kiriko 4
Mugae Mugae 4
Karanene Karanene 4
Timau Ngushishi Ngushishi 4
Mijogene Lucerne 4
Kisima Muroone 4
Kirua/Nari Njotene Njotene 4
Muruguma Muruguma 4
Kironya Kironya 4
Meru Central Marathi Marathi Marathi 4
Mwereru Mwereru A 4
Mwereru B 4
County total 2 4 12 13 53 53
Table 26: Surveys by county
Annex 1. Surveys details and methodology

52 ANNEX
County Sub-county Ward/ location
Sub- location
Village number of farmers
Sample size
nAKURU Kuresoi Kuresoi Kuresoi Tegat 4
Kipsonoi 4
Temyota 2 4
Temyota 3 4
Kerenget Keriget Jagoror 4
Chepitoik 4
njoro Mau Narok Njoro Likia 3
Mathangauta 4
Gatimu 3
Mauche Mauche Mwishowalami 3
Mau 4
Molo Molo Molo Molo 4
Tayari 4
Turi 4
Kiambiriria 4
Chandera 4
Milimatatu 4
Total 3 5 5 18 69 69
County Sub-county Ward/ location
Sub- location
Village number of farmers
Sample size
nYAndARUA Kinangop Njabini Njabini Kiburu 4
Kiandege 4
Njabini 4
Mutonyora 4
Bamboo 4
Mutura 4
Mirangine Tumaini Tumaini Karungu 4
Sabugo 4
Mirangine Mirangine 4
Mathakwa 4
Kihoto 4
Maritati 4
nyandarua north Shamata Shamata Pesi 4
Shamata 4
Karandi 4
ol Kalou Ol Kalou Gaswe Gaswe-Mamugp 13
Total 4 4 5 15 73 73

53ANNEX
1. Screening of food losses including rapid appraisal 2. Survey on food loss assessment
• Review of secondary data (sources: NPCK, PSDA, FAO, etc.)
• Key-informant interviews as an input to prepare the study: KARI, market actors, etc.
• Selection of marketing channels and definition of the regions
• Rapid appraisal in the selected regions
• Characterisation of food losses in selected value chains defining critical loss points
• Planning the survey (questionnaires, interview guidelines, etc.) and the sampling methods
a. Training enumerators
• recruitment
• preparation and purchase of training materials
• training arrangements
• training
• pre-testing
b. Survey implementation
• supervision: daily review and verification of collected data
• data collection
• mobility
• tools
• communication
• handling of questionnaires
c. Key-informant interviews
3. load-tracking assessment 4. data analysis, verification and reporting
• Evaluation of collected information, decision on necessary surveys/trials to get more information on specific problems
• Setting the objective of surveys, e.g. based on critical loss points such as extended bags
• Choosing the load/location and defining the unit of measurement
• Surveying–tracking–replication
• Analysis and findings on causes
5. Synthesis: recommendations and solution finding
• Importance of causes
• Investment options to reduce losses
• Impact and feasibility of solutions/cost-benefit analysis
• Final report
Table 27: Study methodology following the FAo’s five-stage approach

54 ANNEX
Annex 2: Further survey data Socio-economic data of farmers and traders
Meru n=53
Bomet n=52
nakuru n=69
nyandarua n=73
All n=247
Gender of respondent (%)
Male 71.7 82.7 59.4 64.4 68.4
Female 28.3 17.3 40.6 35.6 31.6
Age of respondent in years 53.3 41.4 42.6 47.7 46.1
Family size of respondent (persons) 5.12 5.9 5.84 4.72 5.37
Level of education (%)
Primary and below 49 26.9 50.7 42.5 43
Secondary 47.2 51.9 31.9 46.6 43.7
College 3.8 21.2 17.4 11.0 13.3
Retailer n=27
Wholesaler n=27
Both roles n=9
All n=63
Gender of respondent (%)
Male 29.6 77.8 77.8 57.1
Female 70.4 22.2 22.2 42.9
Age of respondent 40 38 35 38
Number of years in potato business 8 10 6 9
Level of education (%)
Primary and below 33.3 33.3 33.3 33.3
Secondary 40.7 37.0 33.3 38.1
College and A-level 22.2 39.6 22.2 25.4
No education 3.7 0 11.1 3.2
Malen=169
Female n=78
All n=247
Illiterate 2.4 10.3 4.9
Primary 34.3 46.2 38.1
Secondary 47.9 34.6 43.7
Post-secondary 15.4 9.0 13.4
Table 28: Characteristics of potato farmers
Table 30: Characteristics of potato traders
Table 29: Farmers’ education levels by gender (%)

55ANNEX
Survey data: production, harvest and post-harvest
Bomet n=52
Meru n=53
nakuru n=69
nyandarua n=73
All n=247
Main source of seed (%)
Own harvest 42 42.3 76.5 93.2 67.1
Neighbours 48 23.1 26.5 9.6 25.1
Shop/local market 0 36.5 1.5 1.4 8.6
Clean/positively selected producers 12 0 2.9 5.4 4.9
Certified seed producers 30 30.8 13.2 5.5 18.1
Rank Challenges All n=247
Bomet n=52
Meru n=53
nakuru n=69
nyandarua n=73
1 Prices 98.4 98.1 96.2 100.0 98.6
2 Diseases 97.2 96.2 98.1 95.7 98.6
3 Market demand 91.5 88.5 81.1 94.2 98.6
4 Inputs 89.5 82.7 83.0 88.4 100.0
5 Seeds 87.4 84.6 77.4 87.0 97.3
6 Storage 79.4 67.3 67.9 78.3 97.3
7 Mechanisation 70.9 82.7 20.8 88.4 82.2
8 Irrigation 60.7 50.0 56.6 58.0 74.0
9 Losses 59.9 53.8 30.2 68.1 78.1
10 Others 27.5 36.5 0 31.9 37.0
Malen=36
Female n=27
All n=63
Illiterate 2.8 3.7 3.2
Primary 30.6 37.0 33.3
Secondary 33.3 44.4 38.1
Post-secondary 33.1 14.8 25.4
Table 32: Main challenges farmers face in potato production as a % (multiple choice)
Table 33: Potato seed used by farmers
Table 31: Traders’ educational levels by gender (%)

56 ANNEX
graph 3: Types of seed used by farmers, as a %
Bomet Meru Nakuru Nyandarua All
100%
90%
80%
70%
60%
50%
40%
30%
20%
10%
0%
Certified seed Clean seed Positively selected seed Farmer seed
69,2 69,876,8 90,4 77,7
0
13,5 9,45,8 1,4 6,9
1,92,9
5,52,8
17,3 18,914,5
2,7
12,6
graph 4: number of seasons after which farmers renew seed, as a %
21,2 18,9
56,5 58,9
41,7
11,5
7,5
20,313,7
13,8
3,8 0 2,99,6
4,4
63,573,6
20,3 17,8
40,1
Bomet Meru Nakuru Nyandarua All
100%
90%
80%
70%
60%
50%
40%
30%
20%
10%
0%
Very rarely After 4-6 seasons After 1-3 seasons Never renew

57ANNEX
Planting months harvesting months
Meru Nyandarua Nakuru Bomet Total Meru Nyandarua Nakuru Bomet Total
January 3.8 37 20.6 21.2 22.0 32.1 15.1 19.1 15.4 19.9
February 26.4 28.8 26.5 13.5 24.4 34.0 8.2 10.3 21.2 17.1
March 28.3 19.2 29.4 7.7 21.5 11.3 8.2 5.9 15.4 9.8
April 15.1 37 22.1 9.6 22.4 9.4 26.0 17.6 21.2 19.1
May 26.4 13.7 20.6 28.8 21.5 3.8 11.0 10.3 7.7 8.5
June 1.9 4.1 20.6 21.2 11.8 17.0 21.9 27.9 11.5 20.3
July 3.8 11 23.5 19.2 14.6 17.0 19.2 27.9 9.6 19.1
August 1.9 42.5 25 13.5 22.8 35.8 43.8 26.5 13.5 30.9
September 47.2 30.1 25 23.1 30.9 17.0 6.8 16.2 28.8 16.3
October 15.1 6.8 5.9 17.3 10.6 3.8 8.2 16.2 23.1 12.6
November 5.7 4.1 16.2 19.2 11 0.0 13.7 17.6 15.4 12.2
December 13.2 1.4 2.9 13.5 6.9 5.7 52.1 38.2 26.9 32.9
Table 34: Seasons for potato planting and harvesting expressed – relevance as a %
Bomet n=52
Meru n=53
nakuru n=69
nyandarua n=73
All n=247
Pre-harvest practices
Farmers who prepare potatoes before harvesting (%)
98.1 92.5 94.2 93.2 94.3
How farmers prepare potatoes for harvesting (%)
Dehaulming 86.3 56.3 52.3 22.4 51.9
Leave shoots to dry 13.7 43.8 47.7 77.6 48.1
Table 35: Potato pre-harvesting practices
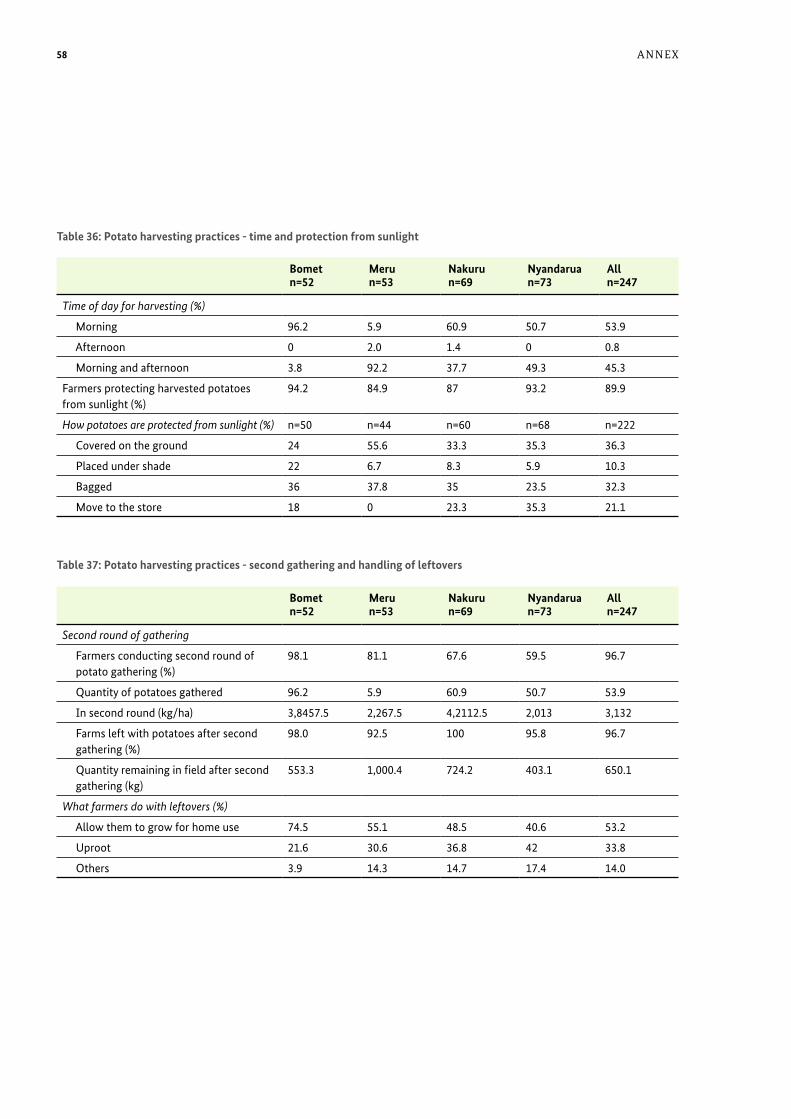
58 ANNEX
Bomet n=52
Meru n=53
nakuru n=69
nyandarua n=73
All n=247
Time of day for harvesting (%)
Morning 96.2 5.9 60.9 50.7 53.9
Afternoon 0 2.0 1.4 0 0.8
Morning and afternoon 3.8 92.2 37.7 49.3 45.3
Farmers protecting harvested potatoes from sunlight (%)
94.2 84.9 87 93.2 89.9
How potatoes are protected from sunlight (%) n=50 n=44 n=60 n=68 n=222
Covered on the ground 24 55.6 33.3 35.3 36.3
Placed under shade 22 6.7 8.3 5.9 10.3
Bagged 36 37.8 35 23.5 32.3
Move to the store 18 0 23.3 35.3 21.1
Bomet n=52
Meru n=53
nakuru n=69
nyandarua n=73
All n=247
Second round of gathering
Farmers conducting second round of potato gathering (%)
98.1 81.1 67.6 59.5 96.7
Quantity of potatoes gathered 96.2 5.9 60.9 50.7 53.9
In second round (kg/ha) 3,8457.5 2,267.5 4,2112.5 2,013 3,132
Farms left with potatoes after second gathering (%)
98.0 92.5 100 95.8 96.7
Quantity remaining in field after second gathering (kg)
553.3 1,000.4 724.2 403.1 650.1
What farmers do with leftovers (%)
Allow them to grow for home use 74.5 55.1 48.5 40.6 53.2
Uproot 21.6 30.6 36.8 42 33.8
Others 3.9 14.3 14.7 17.4 14.0
Table 36: Potato harvesting practices - time and protection from sunlight
Table 37: Potato harvesting practices - second gathering and handling of leftovers

59ANNEX
Bomet n=52
Meru n=53
nakuru n=69
nyandarua n=73
All n=247
Harvesting tools (%)
Fork jembe 1.9 56.6 42.0 97.2 52.8
Oxen 92.3 1.9 11.6 0 23.2
Hoe 1.9 0 31.9 1.4 9.8
Sticks 0 41.5 0 0 8.9
Hands 3.8 0 13.0 1.4 4.9
Panga 0 0 1.4 0 0.4
Harvesting labour (%)
Family 21.2 7.5 11.6 9.6 12.1
Casual 73.1 86.8 88.4 90.4 85.4
Others (oxen, etc.) 5.7 5.7 0 0 2.5
Table 38: Potato harvesting practices - tools and labour
Small-scale potato producers still do most of their work manually

60 ANNEX
Bomet n=52
Meru n=53
nakuru n=69
nyandarua n=73
All n=247
Farmers harvesting potatoes in the rain (%) 22.6 19.2 59.4 34.2 36.0
Damage caused by harvesting in the rain (kg/ha)
185.1 179.9 633.6 261.5 344.2
Farmers experiencing potato damage from harvesting tools (%)
84.6 94.3 94.2 97.3 93.1
Damage from harvesting tools (kg/ha)
Hands n=8 0.0 0.0 1,120.4 0.0 1,120.4
Sticks n=19 0.0 77.7 0.0 0.0 77.7
Hoe n=21 335.9 0.0 860.5 503.9 819.1
Oxen/ donkey plough n=51 512.8 168.0 719.3 0.0 519.7
Fork jembe n=127 503.9 903.0 735.1 560.2 678.8
Farmers experiencing damage from harvesting labour (%)
83.0 54.0 84.1 94.5 80.8
Damage caused by labour (kg)
Casual labour n=173 455.5 649.1 720.3 577.0 624.4
Family labour n=23 297.4 336.9 894.1 256.9 444.6
Help from neighbours n=3 503.9 923.8 0.0 0.0 783.5
Farmers experiencing storage losses (%) 80.4 84.3 84.2 85.7 83.9
Causes of damage during storage
Pest and diseases (%) 40.5 10.5 10.4 9.3 16.4
Rotting (%) 59.5 84.2 89.6 90.7 82.5
Others (frosts, rodents, etc.) (%) 32.7 5.7 24.6 50.0 29.7
Losses during storage (kg) 122.8 414.0 105.6 62.6 119.0
Table 39: losses experienced on farms

61ANNEX
Bomet n=52
Meru n=53
nakuru n=69
nyandarua n=73
All n=247
Farmers who transport potatoes before selling (%)
84.3 64.2 91.3 100 86.6
Where potatoes are transported (%)
Homestead 46.5 75 24.2 41.1 41.9
Main road 53.5 25 74.2 58.9 57.1
Market 0 0 1.6 1.4 1
Main means of transport (%)
On back 27.9 51.0 60.3 78.1 57.8
Lorry 7.0 25.5 11.1 1.4 10.4
Handcart 11.6 5.9 1.6 11 7.4
Donkey cart 44.2 5.9 4.8 2.7 11.7
Others (pick-up, tractor, etc.) 9.3 11.7 22.2 6.8 12.7
Packers of bags for selling (%)
Broker 49.0 88.7 76.8 91.8 78.0
Trader 27.5 7.5 11.6 0.0 10.6
Farmer 19.6 3.8 8.7 4.1 8.5
Workers 3.9 2.9 4.1 2.8
Consumer 3.8 1.4 0.0 1.2
To whom farmer sells potatoes (%)
Local trader 63.5 96.2 56.5 60.3 67.6
Wholesaler 3.8 15.4 40.6 37.0 26.3
Processor 17.8 0.0 0.0 0.0 4.8
Table 40: Potato marketing practices
Survey data: packaging, transport and marketing
Sales prices of potatoes in KES/kg Bomet n=52
Meru n=53
nakuru n=69
nyandarua n=73
All n=247
Sales price in October 2013 14.1 14.8 13.1 11.4 13.2
Highest price 24.2 18.5 19.8 15.2 19.1
Lowest price 12.2 10.3 8.8 7.3 9.5
Table 41: Farm-gate potato prices

62 ANNEX
graph 5: Months with highest and lowest farm-gate prices – relevance of month in %
45
40
35
30
25
20
15
10
5
0
Nyandarua
Jan Feb March April May June July Aug Sep Oct Nov Dec
Nakuru Meru Bomet
60
50
40
30
20
10
0
Nyandarua
Jan Feb March April May June July Aug Sep Oct Dec
Nakuru Meru Bomet
Month with highest farm-gate prices
Month with lowest farm-gate prices

63ANNEX
Retailer n=27
Wholesaler n=27
Both roles n=9
All n=63
Most important source of potato (%)
Nakuru 48.1 25.9 22.2 34.9
Narok 14.8 33.3 66.7 30.2
Nyandarua 22.2 7.4 11.1 14.3
Meru 11.1 18.5 0 12.7
Others (Bomet, Mombasa) 3.7 14.8 0 7.9
Most important sales county (%)
Nairobi 37.0 51.9 77.4 49.2
Nakuru 22.2 7.4 11.1 14.3
Meru 11.1 18.5 0 12.7
Nyandarua 14.8 7.4 11.1 11.1
Mombasa 14.8 11.1 0 11.1
Bomet 0 3.7 0 1.6
Most important sales market (%)
Gikomba Nairobi 7.4 7.4 44.4 12.7
Githurai Nairobi 7.4 14.8 11.1 11.1
Wakulima Nairobi 11.1 11.1 11.1 11.1
Kangemi Nairobi 11.1 7.4 11.1 9.5
Kongowea Mombasa 14.8 11.1 0 11.1
Wakulima Nakuru 18.5 7.4 0 11.1
Potato bag types bought by traders (%) Retailer n=27
Wholesaler n=27
Total n=63
Material type of packaged bags
110 kg bag with flat net or no net 110 kg + 14.8 3.7 11.1
Kata 2 with flat net or no net 11.1 7.4 7.9
110 kg bag with Mukurinu top 14.8 25.9 23.8
Kata 2 and Kamba 2 3.7 14.8 9.5
Kata 2 and Kamba 4 7.4 11.1 7.9
Kata 4 and Kamba 4 11.1 7.4 7.9
110 kg bag and Kamba 11 11.1 3.7 6.3
Average weight of potato bags in kg 175.2 170.5 173.5
Material type of packaged bags
Sisal or jute bags (%) 18.5 14.8 14.3
Nylon bags (%) 81.5 85.2 85.7
Table 42: Main sourcing and sales markets of traders
Table 43: Most common bag types bought by traders
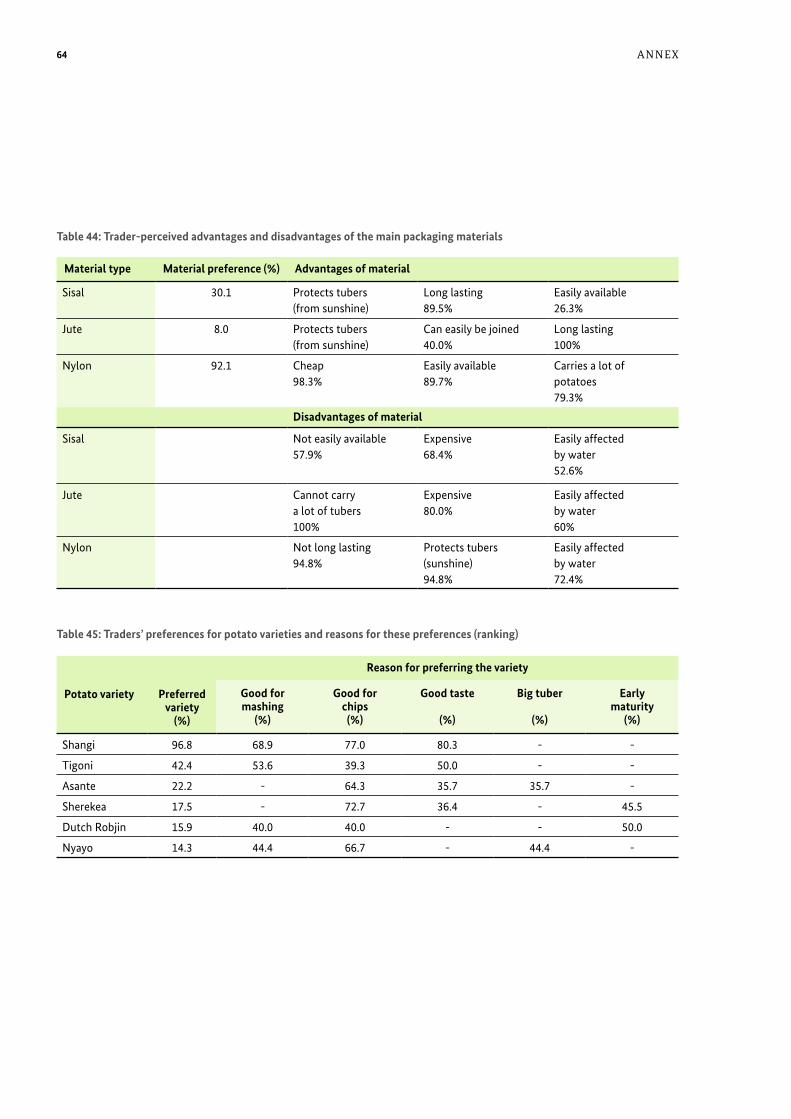
64 ANNEX
Material type Material preference (%) Advantages of material
Sisal 30.1 Protects tubers (from sunshine)
Long lasting 89.5%
Easily available 26.3%
Jute 8.0 Protects tubers (from sunshine)
Can easily be joined 40.0%
Long lasting 100%
Nylon 92.1 Cheap 98.3%
Easily available 89.7%
Carries a lot of potatoes 79.3%
disadvantages of material
Sisal Not easily available 57.9%
Expensive 68.4%
Easily affected by water 52.6%
Jute Cannot carry a lot of tubers 100%
Expensive 80.0%
Easily affected by water 60%
Nylon Not long lasting 94.8%
Protects tubers (sunshine) 94.8%
Easily affected by water 72.4%
Potato variety
Preferred variety
(%)
Reason for preferring the variety
good for mashing
(%)
good for chips
(%)
good taste
(%)
Big tuber
(%)
Early maturity
(%)
Shangi 96.8 68.9 77.0 80.3 - -
Tigoni 42.4 53.6 39.3 50.0 - -
Asante 22.2 - 64.3 35.7 35.7 -
Sherekea 17.5 - 72.7 36.4 - 45.5
Dutch Robjin 15.9 40.0 40.0 - - 50.0
Nyayo 14.3 44.4 66.7 - 44.4 -
Table 44: Trader-perceived advantages and disadvantages of the main packaging materials
Table 45: Traders’ preferences for potato varieties and reasons for these preferences (ranking)

65ANNEX
Purchase prices of potatoes in KES/kg Retailer n=27
Wholesaler n=27
Current price (November) 16.5 14.4
Lowest price 13.3 10.8
Highest price 26.6 21.4
Table 46: Current lowest and highest purchase price
Retailer n=27
Wholesaler n=27
Both roles n=9
All n=63
How traders think losses can be reduced in the potato trade (%)
Better handling methods 23.5 13.6 16.7 17.8
Better harvesting techniques 47.1 40.9 83.3 48.9
Improved packing methods 5.9 13.6 0.0 8.9
Timely delivery 29.4 13.6 0.0 17.8
Better transport 17.6 27.3 33.3 24.4
Kind of improvement needed to improve the quality/quantity of potatoes (%)
n=21 n=26 n=8 n=55
Educating farmers in better farming practices 9.5 26.9 12.5 18.2
Getting farmers to use quality seeds 42.9 30.8 50.0 38.2
Offering farmers subsidies on their inputs 19.0 3.8 12.5 10.9
Getting farmers to use appropriate fertilisers 42.9 11.5 25.0 25.5
Standardised potato pricing 9.5 11.5 12.5 10.9
Putting policies and rules/regulations in place for potato 28.6 42.3 37.5 36.4
Table 47: Causes of loss and suggested improvements (multiple choice)

66 ANNEX
Annex 3: Questionnaires
• Study on post-harvest losses of potato – farmers
• Study on post-harvest losses of potato – brokers
• Study on post-harvest losses of potato – traders
• Study on post-harvest losses of potato – processors
• Study on post-harvest losses of potato – restaurants
Preferred varieties as a % Shangi n=19
Tigoni n=9
Asante n=4
Tana n=4
Cooks quickly 10.5 22.2 0.0 25.0
Tastier 84.2 55.6 50.0 25.0
Big tubers 21.1 22.2 25.0 75.0
Good looking 0.0 22.2 0.0 25.0
Uses relatively less oil 21.1 11.1 25.0 0.0
Variety of uses 10.5 11.1 0.0 0.0
Easily available 31.6 0.0 0.0 25.0
Table 48: Restauranteurs’ perceptions of the benefits of different potato varieties as a %
Survey data: restaurants
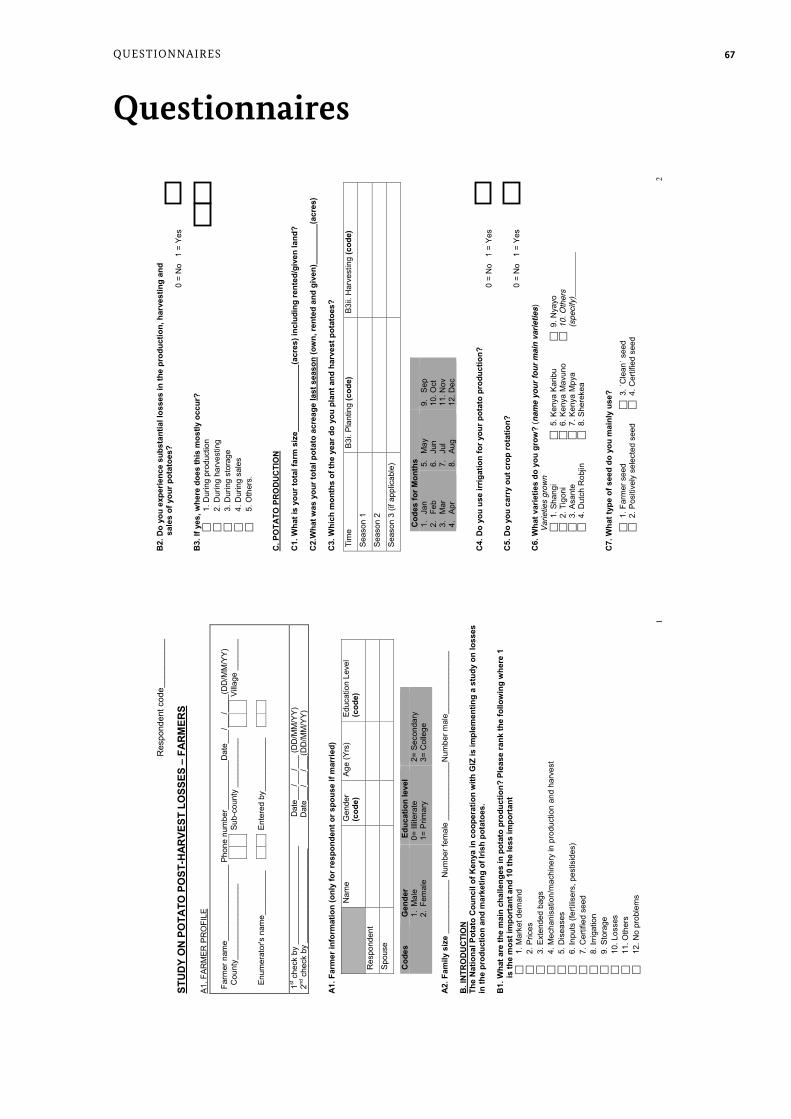
67QUeSTIoNNaIReS
Questionnaires
1
Res
pond
ent c
ode_
____
____
_ ST
UD
Y O
N P
OTA
TO P
OST
-HA
RVE
ST L
OSS
ES –
FA
RM
ERS
A1. F
ARM
ER P
RO
FILE
Fa
rmer
nam
e___
____
____
____
__ P
hone
num
ber_
____
____
__D
ate_
__/_
__/_
___(
DD
/MM
/YY)
C
ount
y___
____
____
____
__
Sub-
coun
ty _
____
____
__
Villa
ge _
____
__
En
umer
ator
's n
ame_
____
____
_
En
tere
d by
____
____
____
1st c
heck
by
____
____
____
____
____
__
D
ate_
__/_
__/_
__ (D
D/M
M/Y
Y)
2nd c
heck
by
____
____
____
____
____
_
D
ate_
__/_
__/_
__(D
D/M
M/Y
Y)
A1.
Far
mer
info
rmat
ion
(onl
y fo
r res
pond
ent o
r spo
use
if m
arrie
d)
N
ame
Gen
der
(cod
e)
Age
(Yrs
) Ed
ucat
ion
Leve
l (c
ode)
Res
pond
ent
Spou
se
A
2. F
amily
siz
e __
____
____
__ N
umbe
r fem
ale
____
____
____
_Num
ber m
ale_
____
____
____
_ B
. IN
TRO
DU
CTI
ON
Th
e N
atio
nal P
otat
o C
ounc
il of
Ken
ya in
coo
pera
tion
with
GIZ
is im
plem
entin
g a
stud
y on
loss
es
in th
e pr
oduc
tion
and
mar
ketin
g of
Iris
h po
tato
es.
B1.
Wha
t are
the
mai
n ch
alle
nges
in p
otat
o pr
oduc
tion?
Ple
ase
rank
the
follo
win
g w
here
1
is th
e m
ost i
mpo
rtan
t and
10
the
less
impo
rtan
t
1.
Mar
ket d
eman
d
2.
Pric
es
3. E
xten
ded
bags
4.
Mec
hani
satio
n/m
achi
nery
in p
rodu
ctio
n an
d ha
rves
t
5.
Dis
ease
s
6.
Inpu
ts (f
ertil
iser
s, p
estis
ides
)
7.
Cer
tifie
d se
ed
8. Ir
rigat
ion
9. S
tora
ge
10. L
osse
s
11
. Oth
ers
12. N
o pr
oble
ms
Cod
es
Gen
der
Edu
catio
n le
vel
1. M
ale
2. F
emal
e 0=
Illit
erat
e 1=
Prim
ary
2=
Sec
onda
ry
3= C
olle
ge
2
B2.
Do
you
expe
rienc
e su
bsta
ntia
l los
ses
in th
e pr
oduc
tion,
har
vest
ing
and
s
ales
of y
our p
otat
oes?
0
= N
o 1
= Y
es
B
3. If
yes
, whe
re d
oes
this
mos
tly o
ccur
?
1.
Dur
ing
prod
uctio
n
2.
Dur
ing
harv
estin
g
3.
Dur
ing
stor
age
4. D
urin
g sa
les
5. O
ther
s.
C. P
OTA
TO P
RO
DU
CTI
ON
C
1. W
hat i
s yo
ur to
tal f
arm
siz
e___
____
____
____
(acr
es) i
nclu
ding
rent
ed/g
iven
land
? C
2.W
hat w
as y
our t
otal
pot
ato
acre
age
last
sea
son
(ow
n, re
nted
and
giv
en)_
____
____
(acr
es)
C3.
Whi
ch m
onth
s of
the
year
do
you
plan
t and
har
vest
pot
atoe
s?
Tim
e
B3i.
Plan
ting
(cod
e)
B3ii.
Har
vest
ing
(cod
e)
Seas
on 1
Seas
on 2
Seas
on 3
(if a
pplic
able
)
C
odes
for M
onth
s
1.
Jan
2.
Feb
3.
Mar
4.
Ap
r
5.
May
6.
Ju
n
7.
Jul
8.
Aug
9.
Sep
10
. Oct
11
. Nov
12
. Dec
C
4. D
o yo
u us
e irr
igat
ion
for y
our p
otat
o pr
oduc
tion?
0
= N
o 1
= Y
es
C
5. D
o yo
u ca
rry
out c
rop
rota
tion?
0
= N
o 1
= Y
es
C
6. W
hat v
arie
ties
do y
ou g
row
? (n
ame
your
four
mai
n va
rietie
s)
Varie
ties
grow
n
1. S
hang
i
2. T
igon
i
3. A
sant
e
4. D
utch
Rob
jin
5
. Ken
ya K
arib
u
6. K
enya
Mav
uno
7
. Ken
ya M
pya
8
. She
reke
a
9
. Nya
yo
1
0. O
ther
s (s
peci
fy)_
____
____
_
C7.
Wha
t typ
e of
see
d do
you
mai
nly
use?
1. F
arm
er s
eed
2
. Pos
itive
ly s
elec
ted
seed
3. ˈ
Cle
anˈ s
eed
4
. Cer
tifie
d se
ed

68 QUeSTIoNNaIReS
3
C8.
Wha
t is
the
mai
n so
urce
of y
our s
eed?
1. O
wn
harv
est
2
. Nei
gbou
r
3. S
hop/
loca
l mar
ket
4
. Cle
an/ p
ositi
vely
sel
ecte
d se
ed p
rodu
cer
5
. Cer
tifie
d se
ed p
rodu
cer (
ADC
, Kis
ima
etc)
6. O
ther
(spe
cify
)___
____
___
C9.
Afte
r how
man
y se
ason
s do
you
buy
new
see
d?
1
. Nev
er b
uy n
ew s
eed
2
. 1-3
sea
sons
3. 4
-6 s
easo
ns
4
. 7-1
0 se
ason
s
5. O
ver 1
0 se
ason
s
6. O
ther
(spe
cify
)___
____
___
D. P
RE-
HA
RVE
ST P
RA
CTI
CES
D
1. D
o yo
u do
any
thin
g to
pre
pare
you
r pot
ato
befo
re h
arve
stin
g?
0 =
No
1 =
Yes
a.
If
yes,
wha
t do
you
do to
pre
pare
you
r for
pot
ato
harv
estin
g?
1
. Deh
aulm
ing
2
. Lea
ve th
e sh
oot t
o dr
y
3. O
ther
(spe
cify
)___
____
____
____
____
_
b. If
no,
why
don
’t yo
u do
any
thin
g to
pre
pare
you
r for
pot
ato
harv
estin
g?
1
. I d
on’t
know
how
to p
repa
re
2
. I h
arve
st e
arly
to g
et h
igh
pric
es
3
. I h
arve
st e
arly
to a
void
rain
s
4
. Don
’t w
ant t
o in
cur e
xtra
cos
t
5. O
ther
(spe
cify
)___
____
___
E. P
OTA
TO H
AR
VEST
AC
TIVI
TIES
E1
. Wha
t was
you
r lar
gest
por
tion
of la
nd u
nder
pot
atoe
s ha
rves
ted
last
sea
son?
___
___a
cres
E2. W
hat w
as th
e to
tal q
uant
ity h
arve
sted
from
this
larg
est p
ortio
n of
land
?
Q
uant
ity
Uni
ts
(cod
e)
Tota
l qua
ntity
har
vest
ed
Pota
toes
from
the
larg
est p
lot e
aten
at h
ome
Pota
toes
from
the
larg
est p
lot s
old
Cod
es
1.
Bags
2.
C
rate
s 3.
kg
4.
O
ther
(spe
cify
) __
____
____
_
4
E3. C
ould
you
def
ine
the
type
and
siz
e of
bag
/cra
te th
at y
ou a
re u
sing
? In
the
tabl
e be
low
,
de
scrib
e th
e m
ain
type
of b
ag u
sed
for h
arve
stin
g an
d se
lling
pot
atoe
s.
Lo
cal
nam
e of
th
e ba
g
Type
of
ba
g/
cont
aine
r (u
se C
ode)
Net
type
(u
se
code
)
Num
ber
of
buck
ets
(17
kg
buck
et)
Wei
ght
in k
g M
ater
ial
type
Pi
ctur
e co
de
Har
vest
ing
bag/
crat
e
Sellin
g ba
g/cr
ate
Type
of b
ag
N
et/to
p ty
pe
Mat
eria
l typ
e 1.
50
kg
crat
e 2.
11
0 kg
bag
3.
Ka
ta 1
4.
Ka
ta 2
5.
Ka
ta 3
6.
Kata
4
7.
Kata
5
8.
Kata
6
9.
Kata
7
10. O
ther
(spe
cify
) __
____
____
_
0.
No
net
1.
Flat
net
2.
M
ukur
inu
3.
Kam
ba 1
4.
Ka
mba
2
5.
Kam
ba 3
6.
Ka
mba
4
7.
Kam
ba 6
8.
O
ther
(spe
cify
)___
____
1.
Sisa
l/jut
e ba
gs
2.
Hal
f sis
al/ju
te h
alf
nylo
n 3.
N
ylon
bag
s 4.
C
rate
s 5.
O
ther
(s
peci
fy)_
____
___
E4. W
hat t
ools
do
you
mos
t com
mon
ly u
se fo
r har
vest
ing?
H
arve
stin
g to
ols
1
. Han
ds
2
. Stic
ks
3
. Pan
ga
4
. For
k Je
mbe
5. H
oe
6
. Ox/
don
key
plou
gh
7
. Oth
er (s
peci
fy)
____
____
____
__
E5. D
o th
e ty
pes
of to
ols
you
use
in h
arve
stin
g da
mag
e th
e tu
bers
?
0 =
No
1 =
Yes
a.
If ye
s, e
stim
ate
the
dam
age
caus
ed b
y ea
ch m
entio
ned
tool
?
Tool
1
Tool
2
Har
vest
ing
tool
(use
cod
es)
Qua
ntity
dam
aged
per
¼ a
cre
Amou
nt
Uni
t (us
e co
des)
In k
g
Cod
es fo
r har
vest
ing
tool
s C
odes
for u
nits
1.
H
ands
2.
St
icks
3.
Pa
nga
4.
Fo
rk J
embe
5.
Hoe
6.
O
x/ d
onke
y pl
ough
7.
O
ther
(spe
cify
)___
____
____
1.
17 k
g bu
cket
2.
C
rate
(50
kg)
3.
Oth
er (S
peci
fy)_
____
____
_
Enum
erat
ors:
ple
ase
note
the
quan
tity
in u
nits
giv
en a
nd th
en c
onve
rt in
to k
g

69QUeSTIoNNaIReS
5
E6. W
hat t
ype
of la
bour
do
you
mai
nly
use
for h
arve
stin
g?
Ty
pe o
f lab
our
1. F
amily
labo
ur
2
. Cas
ual l
abou
r
3. O
xen/
don
key
plou
gh
4
. Per
man
ent e
mpl
oyee
(s)
5
. Hel
p fro
m n
eigh
bour
s/ re
lativ
es
6
. Oth
ers
(spe
cify
)___
____
E7. D
oes
the
type
of l
abou
r use
d fo
r har
vest
ing
on y
our f
arm
cau
se d
amag
e
to th
e tu
bers
?
0 =
No
1 =
Yes
a.
If ye
s, e
stim
ate
the
amou
nt o
f dam
age
per ¼
acr
e___
____
_
= _
___k
gs/ ¼
Acr
e
Uni
t cod
es
1.
17 k
g bu
cket
2.
C
rate
(50
kg)
3.
Oth
er (s
peci
fy)_
___
Enum
erat
ors:
ple
ase
note
the
quan
tity
and
units
giv
en a
nd th
en c
onve
rt in
to k
g E8
. Wha
t tim
e of
the
day
do y
ou h
arve
st y
our p
otat
oes?
1. M
orni
ng
2
. Afte
rnoo
n
3. M
orni
ng a
nd a
ftern
oon
E9
. Do
you
prot
ect p
otat
oes
from
dire
ct s
un a
fter h
arve
stin
g?
0=
No
1=Y
es
E1
0. If
yes
, how
do
you
prot
ect t
he h
arve
sted
pot
atoe
s fr
om d
irect
sun
?
1
. Cov
er th
e tu
bers
2. P
ut th
em in
the
shad
e
3. P
ut th
em in
the
bag
4
.Mov
e th
em in
to th
e st
ore
imm
edia
tely
5. O
ther
(spe
cify
)___
____
____
____
___
E1
1. D
o yo
u ha
rves
t pot
atoe
s w
hen
it is
rain
ing?
0 =
No
1 =
Yes
a.
If ye
s, w
hat i
s th
e es
timat
ed d
amag
e ca
used
by
harv
estin
g w
hen
it is
wet
?
__
____
____
__
=
____
____
____
kg
per ¼
acr
e
Uni
t cod
es
1.
17 k
g bu
cket
2.
C
rate
(50
kg)
3.
Oth
er (s
peci
fy)_
____
__
Enum
erat
ors:
ple
ase
note
the
quan
tity
and
units
giv
en a
nd th
en c
onve
rt in
to k
g
6
E12.
Do
you
cond
uct a
sec
ond
roun
d of
har
vest
ing
to g
athe
r/col
lect
pot
atoe
s
lef
t in
the
field
?
0= N
o 1
=Yes
a.
If
yes,
wha
t is
the
quan
tity
of p
otat
oes
gath
ered
in th
e se
cond
roun
d pe
r ¼ a
cre
of h
arve
sted
land
?
i. __
____
___
ii.
In w
eigh
t ___
____
____
___k
gs
Uni
t cod
es
1.
17 k
g bu
cket
2.
C
rate
(50
kg)
3.
Oth
er (s
peci
fy)_
____
____
En
umer
ator
s: p
leas
e no
te th
e qu
antit
y an
d un
its g
iven
and
then
con
vert
into
kg
E13.
Do
any
pota
toes
rem
ain
in th
e so
il af
ter h
arve
stin
g an
d se
cond
-rou
nd g
athe
ring
(ˈl
eft o
vers
ˈ/ˈvo
lunt
eers
ˈ)?
0
= N
o 1
=Yes
a.
If
yes,
wha
t is
the
estim
ated
qua
ntity
of p
otat
oes ˈle
ft ov
erˈ i
n a
harv
este
d ¼
acr
e?
i._
____
____
____
____
ii.
In w
eigh
t___
____
____
_kgs
Uni
t cod
es
1.
17 k
g bu
cket
2.
C
rate
(50
kg)
3.
Oth
er (s
peci
fy)_
____
____
_ En
umer
ator
s: p
leas
e no
te th
e qu
antit
y an
d un
its g
iven
and
then
con
vert
into
kg
b.
Wha
t doe
s th
e fa
rmer
do
with
the”
left
over
s” in
the
farm
?
1
. Allo
w th
em to
gro
w fo
r eat
ing
2. A
llow
them
to g
row
for s
ellin
g
3
. Upr
oot t
hem
whe
n th
ey g
row
4. O
ther
(spe
cify
)___
____
____
____
____
____
____
____
_ F.
STO
RA
GE
F1. D
o yo
u st
ore
pota
toes
afte
r har
vest
?
0
= N
o 1
= Y
es
a.
If y
es, w
here
do
you
stor
e yo
ur p
otat
oes?
(mai
n st
ore)
Type
s of
sto
res
1. D
ark
stor
e
2.
Sto
re a
llow
ing
light
3.
Unc
over
ed in
the
field
4.
Cov
ered
in th
e fie
ld
5. P
lace
d in
a h
ole
in th
e gr
ound
6.
Dar
k ar
ea in
the
hous
e
7.K
ept u
ncov
ered
in a
con
cret
e flo
or h
ouse
8.
Kep
t cov
ered
in a
mud
floo
r hou
se
9.K
ept c
over
ed in
a c
oncr
ete
floor
hou
se
10.H
eape
d in
a c
oncr
ete-
floor
ed s
tore
11
. Hea
ped
in a
woo
den-
floor
ed s
tore
12
. Diff
used
ligh
t sto
re (D
LS)
13. H
eape
d in
a m
ud-fl
oore
d st
ore
14. G
unny
bag
s pl
aced
in th
e op
en
15. O
ther
(spe
cify
) __
____
____
____
__

70 QUeSTIoNNaIReS
7
b.
How
long
do
you
stor
e? N
umbe
r of d
ays
____
____
____
____
____
_
c.
Why
do
you
stor
e th
em?
1
. To
wai
t for
bet
ter p
rices
2. F
or h
ome
cons
umpt
ion
3
. See
d po
tato
es
4
. Oth
er (s
peci
fy)_
____
____
____
____
d.
W
hat q
uant
ity o
f har
vest
ed p
otat
oes
from
the
larg
est p
ortio
n of
land
was
sto
red?
____
____
_bag
s or
___
____
____
____
kgs
F2. D
o yo
u ex
perie
nce
any
loss
es/ d
amag
es d
ue to
sto
rage
?
0 =
No
1 =
Yes
I. If
yes,
wha
t cau
ses
the
loss
es/d
amag
es?
1
. Rot
ting
2
. Pes
ts a
nd d
isea
ses
3
. Oth
er (s
peci
fy)_
____
____
____
____
____
____
_
II.
Wha
t qua
ntity
of p
otat
oes
are
lost
/dam
aged
due
to s
tora
ge?
i.___
____
____
____
__
i
i. In
wei
ght_
____
____
___k
gs
U
nit c
odes
1.
17
kg
buck
et
2.
Cra
te (5
0 kg
) 3.
O
ther
(spe
cify
)___
____
____
En
umer
ator
s: p
leas
e no
te th
e qu
antit
y an
d un
its g
iven
and
then
con
vert
into
kg
G. S
OR
TIN
G A
ND
GR
AD
ING
G
1. D
o yo
u so
rt a
nd g
rade
you
r pot
atoe
s?
0
= N
o 1
= Y
es
a.
If ye
s, a
t wha
t sta
ge d
o yo
u gr
ade?
1
. Dur
ing
harv
est
2
. Jus
t bef
ore
stor
ing
3
. Whe
n se
lling
4
. (O
ther
spe
cify
)___
____
____
____
___
b.
How
do
you
sort
and
grad
e po
tato
es?
Cod
es fo
r gra
ding
0. D
o no
t gra
de
1
. Rem
ove
dam
aged
2. G
rade
by
size
s ch
arts
, sm
all,
med
ium
, lar
ge
3
. Rem
ove
char
ts/s
mal
l sto
ck fo
r see
d
4. R
emov
e gr
eeni
ng tu
bers
5. G
rade
by
varie
ty
6
. Oth
ers
(spe
cify
) __
____
____
_
8
G2.
Of t
he to
tal p
otat
oes
sort
ed, w
hat q
uant
ity o
f eac
h ca
tego
ry is
obt
aine
d fr
om a
¼ a
cre
plot
?
Cat
egor
y
Qua
ntity
pe
r ¼
acre
Uni
ts
code
U
ses
code
1.
Smal
l and
cha
rts
2.
M
ediu
m a
nd la
rge
3.
C
ut a
nd b
ruis
ed p
otat
oes
4.
G
reen
ing
pota
toes
5.
Off-
type
var
iety
Uni
ts
U
ses
1.
17
kg
buck
et
2.
10 k
g bu
cket
3.
11
0 K
g ba
g 4.
N
et b
ag
5.
Kata
1
6.
Kata
2
7.
Kata
3
8.
Kata
4
9.
Oth
ers
(spe
cify
) __
____
____
1.
Seed
2.
H
ome
cons
umpt
ion
3.
Sell
4.
Live
stoc
k fe
ed
5.
Proc
essi
ng
6.
Thro
w a
way
as
was
te
7.
Oth
er (s
peci
fy)
____
____
__
H. P
AC
KAG
ING
AN
D M
AR
KET
ING
H
1. D
o yo
u tr
ansp
ort p
otat
oes
befo
re s
ellin
g?
0
= N
o 1
= Y
es
a.
To w
here
?
1
. Hom
este
ad
2
. Mai
n ro
ad
3
. Oth
er p
lace
(spe
cify
)___
____
____
____
_
b.
Dis
tanc
e? _
____
____
____
____
____
____
(in k
m)
H 2
. Wha
t are
the
mai
n m
eans
of t
rans
port
?
1. H
and
cart
2
. Bic
ycle
3
. Mot
orcy
cle
4
. Tra
ctor
5. P
ick-
up/c
ar
6
. Lor
ry
7. O
n ba
ck
8
. Oth
er (s
peci
fy)_
____
____
____
H
3. W
ho p
acks
the
bags
for s
ellin
g?
1
. Far
mer
2. B
roke
rs
3
. Tra
der
4
. Em
ploy
ees/
wor
kers
5. O
ther
s___
____
____
__

71QUeSTIoNNaIReS
9
H5.
To
who
m d
o yo
u m
ostly
sel
l?
1
. Loc
al tr
ader
2. W
hole
sale
r
3. C
onsu
mer
4. P
roce
ssor
5. O
ther
s (s
peci
fy)_
____
____
____
____
__
H5.
Wha
t are
the
curr
ent,
low
est a
nd h
ighe
st p
rices
of t
he ty
pe o
f pot
ato
bags
you
hav
e
sold
in th
e re
cent
pas
t to
loca
l tra
ders
? Ty
pe o
f bag
rece
ntly
sol
d C
urre
nt p
rice
(KES
) Lo
wes
t pric
e an
d m
onth
H
ighe
st p
rice
and
mon
th
Pric
e (K
ES
) M
onth
Pr
ice
(KE
S)
Mon
th
Cod
es fo
r mon
ths
13
. Jan
14
. Feb
15
. Mar
16
. Apr
17. M
ay
18. J
un
19. J
ul
20. A
ug
21. S
ep
22. O
ct
23. N
ov
24. D
ec
H6.
Oth
er th
an w
hat h
as a
lread
y be
en m
entio
ned,
do
othe
r los
ses
or d
amag
e oc
cur
durin
g po
tato
pro
duct
ion
and
mar
ketin
g?
0
= N
o 1
= Y
es
a.
If
yes,
exp
lain
and
giv
e an
est
imat
e fo
r eac
h ty
pe o
f los
s or
dam
age
men
tione
d.
____
____
____
____
____
____
____
____
____
____
____
____
____
____
____
____
__
Enum
erat
ors:
ple
ase
note
the
unit
(use
cod
e) a
nd c
onve
rt in
to k
g

72 QUeSTIoNNaIReS
1 ST
UD
Y O
N P
OST
-HA
RVE
ST L
OSS
ES O
F PO
TATO
– B
RO
KER
S
PRO
FILE
S 1.
Lo
catio
n, a
vera
ge a
ge, a
vera
ge e
duca
tion
leve
ls o
f bro
kers
2.
Wha
t are
the
gend
er c
ateg
orie
s of
bro
kers
?
POTA
TO B
USI
NES
S 1.
W
hat a
re th
e m
ain
chal
leng
es e
xper
ienc
ed w
hen
deal
ing
with
pot
atoe
s?
VAR
IETI
ES
1.
Wha
t are
the
diffe
rent
pot
ato
varie
ties
avai
labl
e fro
m fa
rmer
s?
2.
Wha
t are
the
diffe
rent
pot
ato
varie
ties
pref
erre
d by
cus
tom
ers?
a.
Wha
t are
the
reas
ons
for p
refe
rring
the
diffe
rent
pot
ato
varie
ties?
3.
Do
trade
rs h
ave
a pr
oble
m w
ith th
e qu
ality
, ava
ilabi
lity,
pac
king
of b
ags,
and
pric
es o
f mar
kete
d po
tato
varie
ties?
a.
If ye
s, w
hat a
re th
e pr
oble
ms?
FIN
DIN
G F
AR
MER
S 1.
H
ow d
o br
oker
s id
entif
y fa
rmer
s w
ho s
ell p
otat
oes?
2.
How
man
y fa
rmer
s do
bro
kers
dea
l with
on
aver
age?
3.
Do
brok
ers
know
qua
ntiti
es a
nd q
ualit
ies
of p
otat
oes
farm
er h
ave?
SOR
TIN
G/G
RA
DIN
G
1.
Do
brok
ers
buy
pota
toes
by
grad
e?
2.
Who
pac
ks p
otat
oes
for t
rade
rs?
PAC
KAG
ING
1.
W
hat m
ater
ials
are
the
pack
ing
bags
mad
e of
?
2.
Are
the
pack
agin
g ba
g si
zes
the
sam
e fo
r all
the
farm
ers?
3.
Do
trade
rs h
ave
diffe
rent
nam
es fo
r diff
eren
t typ
es o
f bag
s, if
yes
wha
t are
the
nam
es?
4.
How
man
y 17
kilo
gram
buc
kets
can
fit i
nto
each
type
of b
ag u
sed
for p
otat
o pa
ckag
ing?
5.
How
man
y tim
es c
an e
ach
type
of b
ag b
e re
used
? (ju
te, s
isal
, nyl
on)
6.
Are
ther
e an
y ha
ndlin
g pr
oble
ms
asso
ciat
ed w
ith a
ny ty
pe o
f bag
s us
ed in
the
mar
ket?
a.
If ye
s, e
xpla
in?
PRIC
ES
1.
Wha
t is
the
curr
ent f
arm
-gat
e an
d m
arke
t pric
e fo
r eac
h si
ze o
f bag
sol
d?
2.
Whi
ch m
onth
s of
the
year
do
farm
ers
get t
he h
ighe
st a
nd lo
wes
t pric
es, a
nd w
hat a
re th
ese
pric
es?
TRA
NSP
OR
T
1.
How
do
you
trans
port
pota
toes
from
farm
to th
e se
lling
poin
t?
2.
How
do
you
load
and
offl
oad
pota
to b
ags
ob to
/from
the
mea
ns o
f tra
nspo
rt yo
u us
e?
3.
How
far f
rom
the
farm
are
the
trade
rs’ s
ellin
g po
ints
?
4.
Who
are
the
mai
n bu
yers
and
whe
re a
re th
ey fr
om?
LOSS
ES
1.
Wha
t ki
nd
of
loss
es/d
amag
e do
tra
ders
in
cur
for
each
va
riety
an
d w
hen?
(Est
imat
e th
e da
mag
e/lo
sses
in w
eigh
t, if
any.
) a.
Pu
rcha
sing
from
farm
ers
b.
Pack
agin
g
c.
Tran
spor
ting
d.
Sellin
g to
the
mar
ket/
cust
omer
s e.
St
orin
g f.
Oth
ers
(ple
ase
spec
ify)_
____
____
____
____
____
____
_
2.
Are
ther
e an
y ot
her l
osse
s tra
ders
incu
r in
the
cour
se o
f the
ir bu
sine
ss?
a.
If ye
s, p
leas
e ex
plai
n?
3.
How
cou
ld lo
sses
be
redu
ced?
4.
Wha
t kin
ds o
f im
prov
emen
ts a
re n
eces
sary
to in
crea
se th
e yi
elds
, qua
ntiti
es a
nd q
ualit
y of
pot
atoe
s?
2

73QUeSTIoNNaIReS
1 ST
UD
Y O
N P
OTA
TO P
OST
-HA
RVE
ST L
OSS
ES –
TR
AD
ERS
C
S M
ID n
umbe
r (C
= C
ount
y, S
= S
ubco
unty
of o
pera
tion,
M =
Mar
ket o
f op
erat
ion
and
last
3 d
igits
= N
umbe
r of t
he p
erso
n in
terv
iew
ed)
A
. BA
SIC
DA
TA
Trad
er n
ame_
____
____
____
__ P
hone
num
ber_
____
____
____
_
Dat
e___
/___
/___
_(D
D/M
M/Y
Y)
Cou
nty_
____
____
____
____
Su
b-co
unty
___
____
____
En
umer
ator
's n
ame_
____
____
_
En
tere
d by
____
____
____
1st c
heck
by
____
____
____
____
____
__
D
ate_
__/_
__/_
__ (D
D/M
M/Y
Y)
2nd c
heck
by
____
____
____
____
____
__
D
ate_
__/_
__/_
__ (D
D/M
M/Y
Y)
A.1
Nam
e of
the
mar
ket/
plac
e of
inte
rvie
w
B. D
ETAI
LS O
F IN
TER
VIEW
EE A
ND
PO
TATO
BU
SIN
ESS
B1.
Gen
der
1= M
ale
2
= Fe
mal
e
B2.
Age
of t
rade
r
yea
rs
B3.
Edu
catio
n Le
vel
Use
edu
catio
n co
des
belo
w
B4.
Wha
t kin
d of
pot
ato
busi
ness
are
you
doi
ng?
1.
Ret
aile
r
2. W
hole
sale
r 3.
Bot
h re
taile
r and
who
lesa
ler
4.
Oth
er (s
peci
fy)_
____
__
B5.
Mos
t im
port
ant s
ourc
e of
pot
ato
a.
C
ount
y___
___
b.
Sub
-cou
nty/
tow
n___
____
____
_
M
arke
t___
____
__
B
6. M
ost i
mpo
rtan
t sel
ling
plac
e/ d
estin
atio
n
a.
Cou
nty_
____
_
b. S
ub-c
ount
y/to
wn_
____
____
__
Mar
ket_
____
____
B
7. H
ow m
any
year
s ha
ve y
ou b
een
in th
is b
usin
ess?
y
ears
(s
houl
d be
mor
e th
an s
ix m
onth
s ol
d)
Cod
es fo
r Cou
ntie
s
Cod
es fo
r edu
catio
n le
vel
1 =
Nai
robi
2
= N
yand
arua
3
= N
akur
u
4 =
Bom
et
5 =
Mer
u 6
= M
omba
sa
0 =
no
educ
atio
n 1-
8 =
stan
dard
1 to
8
9-12
= fo
rm 1
to fo
rm 4
13-1
4 =
A le
vel 1
to A
leve
l 2
15 =
col
lege
16
= c
an re
ad a
nd w
rite
2 B
8. W
hich
mon
ths
of th
e ye
ar h
ave
no s
ale,
min
or s
ales
and
maj
or s
ales
?
(use
cod
es fo
r eac
h m
onth
)
B
9. W
hat
are
the
mai
n po
tato
var
ietie
s yo
u tr
ade
in a
nd w
hat
are
the
reas
ons
for
the
mar
ket p
refe
rrin
g th
e va
riety
? (N
ame
max
imum
of f
our m
ain
varie
ties)
.
Varie
ty s
old
Rea
son
1 R
easo
n 2
Rea
son
3 Va
riety
1
Varie
ty 2
Varie
ty 3
Varie
ty 4
B10
. How
do
you
iden
tify
farm
ers
who
sel
l pot
atoe
s?
1.
By u
sing
bro
kers
2.
M
ove
arou
nd/v
isiti
ng th
e fa
rms
3.
I do
have
farm
er c
onta
cts
4.
Farm
er c
ontra
ct
5.
Oth
er, p
leas
e sp
ecify
____
____
____
____
____
____
____
Ja
n
Feb
M
ar
A
pr
May
J
un
0 =
No
sale
1
= M
inor
sal
e 2
= M
ajor
sal
e Ju
ly
Aug
S
ept
O
ct
Nov
D
ec
Code
s fo
r var
ietie
s Re
ason
for v
arie
ty p
refe
renc
e 1.
Sh
angi
2.
Ti
goni
3.
As
ante
4.
D
utch
robj
in
5.
Keny
a ka
ribu
6.
Keny
a M
avun
o 7.
Ke
nya
mpy
a 8.
Sh
erek
ea
9.
Nya
yo
10. O
ther
s (s
peci
fy)_
____
____
__
1.
Goo
d fo
r mas
hing
2.
G
ood
for c
hips
3.
G
ood
tast
e 4.
Ea
rly m
atur
ity
5.
Big
tube
rs
6.
Col
our o
f the
ski
n 7.
O
ther
(spe
cify
)___
____
___

74 QUeSTIoNNaIReS
3 B
11. D
o yo
u bu
y so
rted
or g
rade
d po
tato
es?
0 =
No
1 =
Yes
a.
If ye
s, h
ow a
re p
otat
oes
grad
ed o
r sor
ted?
Cod
es fo
r gra
ding
0.
N
ot g
rade
d 1.
R
emov
e da
mag
ed
2.
Gra
de b
y si
zes-
char
ts: s
mal
l, m
ediu
m, l
arge
3.
R
emov
e ch
arts
/sm
all f
or s
eed
4.
R
emov
e gr
eeni
ng tu
bers
5.
G
rade
by
varie
ty
6.
Oth
ers
(spe
cify
)
B12
. Who
mai
nly
pack
s th
e ba
gs?
1.
Fa
rmer
and
his
/her
wor
kers
2.
Brok
er
3.
Trad
er h
imse
lf
4.
Oth
ers
(spe
cify
)___
____
____
_
C. P
AC
KAG
ING
, TR
AN
SPO
RTA
TIO
N A
ND
MA
RK
ETIN
G
C1.
How
far d
o yo
u tr
ansp
ort p
otat
oes
from
the
buyi
ng p
oint
to y
our m
ain
selli
ng p
oint
? __
____
__km
C
2. D
o yo
u bu
y po
tato
es fr
om fa
rms
that
are
far f
rom
tarm
ac ro
ads?
0
= N
o 1
= Y
es
a.
If ye
s, w
hat k
ind
of fe
eder
road
s do
you
use
to a
cces
s th
ese
farm
s?
1.
Mud
dy e
arth
road
s 2.
M
oram
road
3.
Fo
otpa
th
4.
Oth
er, p
leas
e sp
ecify
____
____
____
____
____
_ b.
W
hat m
ode
of tr
ansp
ort d
o yo
u us
e on
the
feed
er ro
ads?
Cod
es
1.
On
head
/ bac
k 2.
H
and
cart
3.
Don
key/
ox
cart
4.
Bicy
cle
5.
M
otor
cycl
e 6.
Tr
acto
r/pic
k-up
/lorry
/truc
k
7.
Publ
ic tr
ansp
ort/m
atat
u 8.
O
ther
(spe
cify
)___
____
____
____
____
___
c.
H
ow fa
r fro
m th
e m
ain
road
do
you
sour
ce y
our p
otat
oes?
___
___k
m
d.
Do
you
use
a di
ffere
nt m
ode
of tr
ansp
orta
tion
to tr
ansp
ort p
otat
oes
to
the
tarm
ac ro
ads?
0 =
No
1 =
Yes
4
a.
If ye
s, w
hat m
eans
of t
rans
porta
tion
do y
ou u
se to
tran
spor
t
pota
toes
on
tarm
ac ro
ads?
Cod
es fo
r mea
ns o
f tra
nspo
rtat
ion
1.
On
head
/bac
k 2.
H
and
cart
3.
Don
key/
ox c
art
4.
Bicy
cle
5.
Mot
orcy
cle
6.
Trac
tor/p
ick-
up/lo
rry/tr
uck
7.
Pu
blic
tran
spor
t/mat
atu
8.
Oth
er (s
peci
fy)_
____
____
____
C
3. F
or tr
ader
s w
ho b
uy n
ear/a
long
tarm
ac,
wha
t is
your
mai
n m
ode
of tr
ansp
ort t
o th
e se
lling
poi
nt?
Cod
es fo
r mea
ns o
f tra
nspo
rtat
ion
1.
On
head
/bac
k 2.
H
and
cart
3.
Don
key/
ox c
art
4.
Bicy
cle
5.
Mot
orcy
cle
6.
Trac
tor/p
ick-
up/lo
rry/tr
uck
7.
Publ
ic tr
ansp
ort/m
atat
u 8.
O
ther
(spe
cify
)___
____
____
__
C4.
How
are
the
pota
toes
you
buy
pac
kage
d?
Ba
g ty
pe
Com
mon
na
me
of t
he
bag
Type
of
bag
N
et
type
N
umbe
r of
bu
cket
s (1
7 kg
bu
cket
)
Wei
ght
in k
g
Mat
eria
l ty
pe
Pict
ure
code
Type
1
Type
2
Type
3
C
odes
Ty
pe o
f bag
N
et/to
p ty
pe
Mat
eria
l typ
e 1.
50
kg
crat
e 2.
11
0 kg
bag
3.
Ka
ta 1
4.
Ka
ta 2
5.
Ka
ta 3
6.
Ka
ta 4
7.
Ka
ta 5
8.
Ka
ta 6
9.
Ka
ta 7
10
. Oth
er (s
peci
fy)
____
____
___
0.
No
net
1.
Flat
net
2.
M
ukur
inu
3.
Kam
ba 1
4.
Ka
mba
2
5.
Kam
ba 3
6.
Ka
mba
4
7.
Kam
ba 6
8.
O
ther
(spe
cify
) __
____
____
__
1.
Sisa
l/jut
e ba
gs
2.
Hal
f sis
al/ju
te, h
alf n
ylon
3.
N
ylon
bag
s 4.
C
rate
s 5.
O
ther
(spe
cify
) __
____
____
__

75QUeSTIoNNaIReS
5 C
5. W
hat a
re th
e ad
vant
ages
and
dis
adva
ntag
es o
f the
mai
n pa
ckag
ing
m
ater
ials
use
d?
Mat
eria
l typ
e A
dvan
tage
s
Dis
adva
ntag
es
1.
Sisa
l bag
s
2.
Sisa
l hal
f nyl
on
3.
Jute
bag
4.
Ju
te h
alf n
ylon
5.
N
ylon
bag
s 6.
C
rate
s 7.
O
ther
(spe
cify
) __
____
____
__
1.
Che
ap
2.
Easi
ly a
vaila
ble
3.
Lo
ng la
stin
g 4.
C
an c
arry
a lo
t of p
otat
oes
5.
Wat
er/ra
in p
roof
6.
Pr
otec
t tub
ers
from
sun
shin
e 7.
C
an e
asily
join
ed to
geth
er
8.
Oth
er (s
peci
fy)
____
____
____
1.
Expe
nsiv
e
2.
Not
eas
ily a
vaila
ble
3.
D
on’t
last
long
4.
C
an’t
carry
a lo
t of t
uber
5.
Ea
sily
affe
cted
by
wat
er/ra
in
6.
Doe
s no
t pro
tect
tube
rs
from
sun
shin
e 7.
C
an’t
be e
asily
join
ed
toge
ther
8.
O
ther
(spe
cify
)___
____
___
C6.
Wha
t are
the
curr
ent,
low
est a
nd h
ighe
st p
rices
of t
he p
otat
o ba
g ty
pe y
ou p
urch
ased
in
the
rece
nt p
ast f
rom
farm
ers/
at th
e fa
rm g
ate?
Ty
pe o
f bag
bo
ught
C
urre
nt p
rice
(K
ES)
Low
est p
rice
and
mon
th
Hig
hest
pric
e an
d m
onth
Pric
e (K
ES)
Mon
th
Pric
e (K
ES)
Mon
th
Cod
es
Bag
type
M
onth
s
11. 5
0 kg
cra
te
12. 1
10 k
g ba
g 13
. Kat
a 1
14. K
ata
2
15. K
ata
3
16. K
ata
4
17. K
ata
5 18
. Kat
a 6
19. K
ata
7 20
. Oth
er (s
peci
fy)
____
____
____
1.
Jan
2.
Feb
3.
Mar
4.
Ap
r
5.
May
6.
Ju
n
7.
Jul
8.
Aug
9.
Sep
10
. Oct
11
. Nov
12
. Dec
C7.
D
o yo
u ex
pect
/exp
erie
nce
dam
ages
cau
sed
on
the
farm
?
0
= N
o 1
= Y
es
durin
g tra
nspo
rtatio
n?
0 =
No
1 =
Yes
by m
arke
t con
ditio
ns (s
un, n
o sh
ades
, rai
n, e
tc.)
0
= N
o 1
= Y
es
Oth
er (s
peci
fy)_
____
____
____
0
= N
o 1
= Y
es
Mat
eria
l typ
e Ad
vant
ages
D
isad
vant
ages
6 C
8.
Can
you
qua
ntify
the
expe
cted
dam
ages
in k
g or
as
a %
?
durin
g tra
nspo
rtatio
n
1 =
kg
2 =
%
on fa
rm
1
= kg
2
= %
by m
arke
t con
ditio
ns
1
= kg
2
= %
Oth
ers
(spe
cify
)___
____
____
1
= kg
2
= %
C9.
In w
hich
cas
e do
you
ope
n th
e ba
gs a
nd re
pack
?
0= N
o 1
= Y
es
a.
If ye
s, fo
r wha
t rea
son
do y
ou o
pen
the
bags
?
Whe
n th
ere
is v
isib
le d
amag
e
0
= N
o 1
= Y
es
Whe
n po
tato
gre
enin
g is
vis
ible
0
= N
o 1
= Y
es
To b
reak
into
sm
alle
r qua
ntiti
es fo
r sel
ling
0 =
No
1 =
Yes
Oth
ers
(spe
cify
)___
____
___
0 =
No
1 =
Yes
C10
. In
case
that
you
do
not o
pen
the
bag
desp
ite th
ere
bein
g vi
sibl
e da
mag
es/g
reen
po
tato
es, b
y w
hat p
erce
ntag
e do
you
low
er th
e pr
ice
on a
vera
ge?
___
____
____
__%
C
11. I
f, af
ter o
peni
ng th
e ba
g, th
ere
are
brui
sed
or ro
tten
pota
toes
, wha
t do
you
cons
ider
to
be
the
caus
e fo
r thi
s da
mag
e?
Cat
egor
y
Dam
age
caus
e 1
Dam
age
caus
e 2
Dam
age
caus
e 3
1.
Cut
tube
rs
2.
Brui
sed
tube
rs
3.
Gre
enin
g po
tato
es
4.
Rot
ten
Cod
es
1.
Use
of n
ylon
pac
kagi
ng m
ater
ial
2.
Dra
ggin
g an
d dr
oppi
ng o
f ext
ende
d ba
g 3.
Br
uise
d by
mea
ns o
f tra
nspo
rt:
bic
ycle
, mot
or c
ycle
, don
key,
4.
M
isha
ndlin
g w
hen
load
ing
and
unlo
adin
g
5.
Use
of f
ork/
hoe
for h
arve
stin
g
6.
H
arve
stin
g pr
e-m
atur
e tu
bers
7.
H
arve
stin
g un
cure
d tu
bers
8.
H
arve
stin
g in
the
rain
9.
Va
riety
wea
knes
s 10
. Mar
ket c
ondi
tions
(sun
/rain
) 11
. Oth
ers
(spe
cify
)___
____
____
__

76 QUeSTIoNNaIReS
7 5.
U
se o
f for
k/ho
e fo
r har
vest
ing
11. O
ther
s (s
peci
fy)_
____
____
____
7 C
12. W
hen
you
brea
king
up
bags
into
sm
alle
r qua
ntiti
es, i
n w
hat p
acka
ges/
s
mal
ler u
nits
do
you
mos
tly s
ell p
otat
oes?
a.
Hea
ps/m
ound
s b.
Bu
cket
s of
10
kg
c.
Buck
ets
of 1
7 kg
d.
110
kg b
ag
e.
50 k
g cr
ates
f.
Oth
er s
peci
fy__
____
____
____
C13
. Do
you
grad
e or
sor
t pot
atoe
s w
hen
brea
king
up
bags
into
sm
alle
r uni
ts?
0 =
No
1 =
Yes
b.
If ye
s, h
ow d
o yo
u so
rt an
d gr
ade
the
pota
toes
?
Cod
es fo
r gra
ding
1.
D
o no
t gra
de
2.
Rem
ove
dam
aged
3.
G
rade
by
size
s-ch
arts
: sm
all,
med
ium
, lar
ge
4.
R
emov
e ch
arts
/sm
all f
or s
eed
5.
R
emov
e gr
eeni
ng tu
bers
6.
G
rade
by
varie
ty
7.
Oth
ers
(spe
cify
)___
____
____
_
C14
. Of t
he p
otat
oes
sort
ed, w
hat q
uant
ities
of e
ach
cate
gory
is o
btai
ned
from
e
ach
type
of b
ag b
ough
t?
Cat
egor
y
Type
of b
ag/
cont
aine
r pu
rcha
sed
Qua
ntity
(kg)
so
rted
U
ses
1.
Smal
l and
cha
rts
2.
M
ediu
m a
nd la
rge
3.
C
ut a
nd b
ruis
ed p
otat
oes
4.
G
reen
ing
pota
toes
5.
Off-
type
var
iety
6.
Rot
ten
U
nits
Use
s
1.
17 k
g bu
cket
2.
10
kg
buck
et
3.
110
Kg
bag
4.
Net
bag
5.
Ka
ta 1
6.
Kata
2
7.
Kata
3
8.
Kata
4
9.
Oth
ers
(spe
cify
) __
____
____
__
1.
Seed
2.
H
ome
cons
umpt
ion
3.
Sell
4.
Live
stoc
k fe
ed
5.
Proc
essi
ng
6.
Thro
w a
way
as
was
te
7.
Oth
er (s
peci
fy)
____
____
____

77QUeSTIoNNaIReS
1
STU
DY
ON
PO
ST-H
AR
VEST
LO
SSES
OF
POTA
TO –
PR
OC
ESSO
RS
Nam
e of
cou
nty_
____
____
____
___
N
ame
of s
ub-c
ount
y/to
wn_
____
____
____
____
___
1.
W
hat p
otat
o pr
oduc
ts d
oes
the
proc
esso
r pro
duce
?
2.
W
hat v
arie
ties
are
suita
ble
for p
rodu
cing
eac
h pr
oduc
t?
3.
W
hat q
ualit
ies
do p
roce
ssor
s lo
ok fo
r whe
n ch
oosi
ng th
e va
rietie
s to
pro
duce
eac
h pr
oduc
t?
4.
W
hat a
re th
e sh
ortc
omin
gs in
eac
h va
riety
cho
sen
for e
ach
prod
uct?
5.
From
whe
re d
o pr
oces
sors
get
thei
r pot
atoe
s?
6.
W
hat p
robl
ems
do p
roce
ssor
s ha
ve w
hen
acqu
iring
the
varie
ties
they
nee
d?
7.
D
oes
the
proc
esso
r con
tract
farm
ers?
If y
es, w
hat a
re th
e pr
os a
nd c
ons
of c
ontra
ct fa
rmin
g?
8.
Ar
e th
ere
any
prob
lem
s as
soci
ated
with
pot
ato
bags
and
the
mat
eria
ls u
sed
for
the
supp
ly o
f po
tato
es?
9.
If
yes,
des
crib
e th
e po
tato
bag
s an
d m
ater
ials
, and
the
prob
lem
s as
soci
ated
with
eac
h.
10
. Wha
t is
the
curr
ent b
uyin
g pr
ice
for e
ach
size
of b
ag b
ough
t?
11
. Whi
ch m
onth
s of
the
year
hav
e th
e hi
ghes
t and
low
est b
uyin
g pr
ices
and
wha
t are
thos
e pr
ices
?
12. H
ow a
re p
otat
oes
trans
porte
d fro
m th
e fa
rm to
the
proc
essi
ng p
oint
?
13. H
ow d
o yo
u lo
ad a
nd o
ff lo
ad p
otat
o ba
gs o
n to
/from
the
mea
ns o
f tra
nspo
rt yo
u us
e?
14
. Ple
ase
desc
ribe
the
stag
es o
f pro
cess
ing.
15.
Do
proc
esso
rs e
xper
ienc
e an
y lo
sses
from
pro
cess
ing
pota
toes
?
a.
If ye
s, h
ow d
o th
e lo
sses
occ
ur?
How
muc
h is
lost
at e
ach
stag
e of
pro
cess
ing?
16. W
hat a
re th
e m
ain
chal
leng
es e
xper
ienc
ed w
hen
deal
ing
with
pot
atoe
s?
1
STU
DY
ON
PO
ST-H
AR
VEST
LO
SSES
OF
POTA
TO –
RES
TAU
RA
NTS
N
ame
of th
e co
unty
___
____
____
____
_
Nam
e of
sub
-cou
nty/
tow
n __
____
____
____
____
_
1.
Whe
re d
o yo
u bu
y po
tato
es?
2.
Whi
ch v
arie
ties
of p
otat
oes
are
com
mon
ly p
refe
rred
by c
onsu
mer
s/cl
ient
ele
and
why
? 3.
H
ow a
re p
otat
oes
prep
ared
for c
onsu
mpt
ion?
4.
In w
hat p
acka
ges/
quan
titie
s ar
e po
tato
es b
ough
t?
5.
W
hat t
ypes
of p
acka
ging
mat
eria
l are
pot
atoe
s pa
cked
in w
hen
buyi
ng a
nd w
hen
sellin
g?
6.
Ar
e th
ere
any
loss
es a
ssoc
iate
d w
ith p
acka
ging
pot
ato
bags
or s
izes
of b
ags
used
in tr
adin
g?
7.
W
hat a
re th
e un
it pr
ices
of t
he d
iffer
ent p
otat
o va
rietie
s bo
ught
?
8.
Doe
s po
tato
ava
ilabi
lity
vary
acc
ordi
ng to
the
seas
on?
9.
D
o yo
u bu
y so
rted
and
grad
eg p
otat
oes?
a.
If ye
s, w
hat a
re th
e di
ffere
nt g
rade
s on
the
mar
ket?
b.
W
hat a
re th
e di
ffere
nt s
izes
pre
ferre
d?
10
. Wha
t is
the
curr
ent b
uyin
g pr
ice
for e
ach
size
of b
ag b
ough
t?
11
. Whi
ch m
onth
s of
the
year
hav
e th
e hi
ghes
t and
low
est b
uyin
g pr
ices
and
wha
t are
thes
e pr
ices
?
12. H
ow a
re p
otat
oes
trans
porte
d fro
m b
uyin
g to
sel
ling
poin
ts?
13
. Do
you
expe
rienc
e an
y lo
sses
from
pot
atoe
s yo
u bu
y?
a.
If ye
s, h
ow d
o th
e lo
sses
occ
ur?
b.
Wha
t is
the
scal
e of
the
loss
es?
14
. Wha
t are
the
mai
n ch
alle
nges
exp
erie
nced
whe
n de
alin
g w
ith p
otat
oes?

78
Kaguongo, W. et al., Farmer Practices and Adoption of Improved Potato Varieties in Kenya and Uganda, Social Sciences Working Paper No. 2008-5, CIP, Lima: http://nkxms1019hx1xmtstxk3k9sko.wpengine.netdna-cdn.com/wp-content/uploads/publication%20files/working%20papers/004365.pdf Kaguongo, W. et al., Seed Potato Sub-sector Master Plan or Kenya (2009-2014), National Potato Council of Kenya, Nairobi, 2010.
Kaguongo, W. et al., A policymakers’ Guide to Crop Diversification: The Case of the Potato in Kenya, FAO, Rome, 2013: http://www.fao.org/docrep/018/i3329e/i3329e.pdf
Kaguongo, W. et al., The Value of Seed Potatoes from Four Systems in Kenya, American Journal of Potato Research 91/2014, p. 109-118.
Kasina, M. and Nderitu, J.H., Policy Implementation and its Economic Impact on the Potato Marketing Value Chain in Kenya, KARI-NARL, 2013: http://www.kari.org/conference/conference12/docs/POLICY%20IMPLEMENTATION%20AND%20ITS%20ECONOMIC%20IMPACT%20ON%20 POTATO%20MARKETING%20VALUE%20CHAIN%20IN%20KENYA.pdf
Lipinski, B. et al., Reducing Food Loss and Waste, Working Paper, World Resources Institute, Washington D.C., 2013: http://www.unep.org/pdf/WRI-UNEP_Reducing_Food_Loss_and_Waste.pdf
Muthoni, J. et al., Feasibility of Low-Cost Seed Potato Storage in Kenya: The Case of Diffused Light Storage in Nyandarua County, Journal of Agricultural Science 6/2014 (1), p. 59-65.
Muthoni, J. et al., Up-scaling Production of Certified Potato Seed Tubers in Kenya: Potential of Aeroponics Technology, KARI, Tigoni, 2011: http://academicjournals.org/article/ article1379433027_Muthoni%20et%20al.pdf
RefeReNCeS
References
FAO, Crop Production Aggregation, 2009: ftp://ftp.fao.org/docrep/fao/011/i0515e/i0515e26.pdf
FAOSTAT, Production Crops, 2010 data, FAO, Rome, 2011. Government of Kenya/Agricultural Sector Coordination Unit (ASCU), National Agricultural Sector Extension Policy (NASEP), Nairobi, 2012.
Gustavsson, J. et al., Global Food Losses and Food Waste, FAO, Rome, 2011: http://www.fao.org/fileadmin/user_ upload/suistainability/pdf/Global_Food_Losses_and_Food_Waste.pdf
Gildemacher, P.R., Innovation in Seed Potato Systems in Eastern Africa, Thesis, Wageningen University, Wageningen, 2012: http://edepot.wur.nl/212110
GIZ, The Ecological Footprint of Cassava and Maize Post-Harvest Losses in Nigeria. A Lifecycle Assessment, Eschborn, 2013a: https://www.donorplatform.org/cobalt/item/24- postharvest-losses/2120-the-ecological-footprint-of- cassava-and-maize-post-harvest-losses-in-nigeria?start=120
GIZ, Food Losses in Cassava and Maize Value Chains in Nigeria. Analysis and Recommendations for Reduction Strategies, Eschborn, 2013b: http://www.donorplatform.org/cobalt/item/24-postharvest-losses/2121-food-losses-in-cassava-and-maize-value-chains-in-nigeria
HCDA et al., Horticulture Validated Report 2012, Nairobi: http://www.hcda.or.ke/Statistics/2012/Horticulture%20 perfomance%202010%20to%202012.pdf
Hoeffler, H. and Maingi, G., Rural-urban Linkages in Practice: Promoting Agricultural Value Chains, Rural 21 2/2006, p. 62-64.
Janssens, S.R.M. et al., The Value Chain of Seed and Ware Potatoes in Kenya: Opportunities for Development, LEI Memorandum 13-080, 2013: http://edepot.wur.nl/279729

79RefeReNCeS
Mwaura, N., Kenya Seeks to Mainstream the Potato Crop as a Strategic Staple, African Science News, 2009.
MoALF, The National Root and Tuber Crops Policy, 2010: http://www.kilimo.go.ke/kilimo_docs/pdf/Root%20and% 20Tuber%20Crops%20final%20%20draft%20policy%20 document%202010.pdf Nyagaka, D.O. et al., Economic Efficiency of Smallholder Irish Potato Producers in Kenya: A Case of Nyandarua North District, Conference Paper, 2009: http://ageconsearch.umn.edu/bitstream/49917/2/CCONTRIBUTED_PAPER_98.pdf
Thompson Reuters Foundation, 2011: http://www.trust.org/item/20110209134400-4gex1/?source=spotlight van Otterdijk, R., Methodology for Addressing Food Losses. Food Loss Assessment and Development of a Food Loss Reduction Strategy. Guidelines on Tools and Methodology, FAO, Rome, 2012.
Wang’ombe, J. G. and van Dijk, M.P., Low Potato Yields in Kenya: Do Conventional Input Innovations Account for the Yields Disparity?, Agriculture & Food Security 2 (14), 2013: http://www.agricultureandfoodsecurity.com/content/2/1/14
Will, M., Contract Farming Handbook: A Practical Guide for Linking Small-Scale Producers and Buyers Through Business Model Innovation, GIZ, Competitive African Cotton Initiative (COMPACI), and Agricultural Input Supply Project/ Zimbabwe, Bonn, Eschborn, and Mutare, 2013: http://www.giz.de/expertise/html/7982.html
Zulu, E. et al., Population Dynamics, Climate Change and Sustainable Development in Kenya, African Institute for Development Policy (AFIDEP) and Population Action International (PAI), Nairobi and Washington D.C., 2012: http://populationaction.org/wp-content/uploads/2013/01/Kenya_Country_Report_Final.pdf

Published byDeutsche Gesellschaft für Internationale Zusammenarbeit (GIZ) GmbH
Registered officesBonn and Eschborn,Germany Sector Project Sustainable Agriculture Friedrich-Ebert-Allee 40 Dag-Hammarskjöld-Weg 1-5 53113 Bonn 65760 Eschborn Germany Germany Tel. +49 (0) 228 44 60 - 0 Tel. +49 (0) 6196 79 - 0Fax +49 (0) 228 44 60 - 1766 Fax +49 (0) 6196 79 - 1115 [email protected]/sustainable-agriculture
In cooperation withGerman Food Partnership (GFP)/Potato Initiative Africa (PIA)
AuthorsWachira Kaguongo, National Potato Council of Kenya (NPCK), Nairobi, Kenya Gladys Maingi, Consultant to National Potato Council of Kenya (NPCK), Nairobi, KenyaSigrid Giencke, Agricultural Marketing Consultant, Hamburg, Germany
EditorsKerstin Lohr, Tanja Pickardt, Heike Ostermann Design and layoutJeanette Geppert, Frankfurt
Printed by Top Kopie GmbH, Frankfurt Printed on FSC-certified paper
Photo creditsFront page © CIP; p. 12, 37 © Jackson Muchoki; p. 59 © GIZ/Dirk Ostermeier; other photos © authors
As atAugust 2014
GIZ is responsible for the content of this publication.
On behalf ofGerman Federal Ministry for Economic Cooperation and Development (BMZ);Special unit „One World - No Hunger“
Addresses of the BMZ officesBMZ Bonn BMZ BerlinDahlmannstraße 4 Stresemannstraße 94 53113 Bonn 10963 Berlin Germany GermanyTel. +49 (0) 228 99 535 - 0 Tel. +49 (0) 30 18 535 - 0 Fax +49 (0) 228 99 535 - 3500 Fax +49 (0) 30 18 535 - 2501