Embed Size (px)
Citation preview

For comments, suggestions or further inquiries please contact:
Philippine Institute for Development StudiesSurian sa mga Pag-aaral Pangkaunlaran ng Pilipinas
The PIDS Discussion Paper Seriesconstitutes studies that are preliminary andsubject to further revisions. They are be-ing circulated in a limited number of cop-ies only for purposes of soliciting com-ments and suggestions for further refine-ments. The studies under the Series areunedited and unreviewed.
The views and opinions expressedare those of the author(s) and do not neces-sarily reflect those of the Institute.
Not for quotation without permissionfrom the author(s) and the Institute.
The Research Information Staff, Philippine Institute for Development Studies18th Floor, Three Cyberpod Centris - North Tower, EDSA corner Quezon Avenue, 1100 Quezon City, PhilippinesTelephone Numbers: (63-2) 3721291 and 3721292; E-mail: [email protected]
Or visit our website at http://www.pids.gov.ph
May 2016
DISCUSSION PAPER SERIES NO. 2016-15
Post-EPIRA Impacts of Electric PowerIndustry Competition PoliciesAdoracion M. Navarro, Keith C. Detros
and Kirsten J. dela Cruz

Post-EPIRA Impacts of Electric Power Industry Competition Policies
Adoracion M. Navarro, Keith C. Detros and Kirsten J. dela Cruz*
Abstract
This study evaluates the achievement of the desired outcomes of the competition policies contained in
the Electric Power Industry Restructuring Act of 2001 (EPIRA). We set the context by tracing the
evolution of the electric power industry before EPIRA and post-EPIRA. We look at impacts on the
consumers in terms of price affordability and supply reliability and impact on production efficiency in
terms of system loss reduction. Pre-EPIRA, electricity price in the Philippines was already high relative to
other countries. Trends show that, in real terms, there was a price uptrend during the transition (2001-
2005) toward the start of competition in the generation sector. There was a slight downtrend in the real
price of electricity after the introduction of spot electricity trading but the price of electricity remains
high and it has not declined to pre-EPIRA levels. Supply reliability is still an ongoing concern but the
recent past record shows that shortages were managed and did not reach nationwide crisis levels
reminiscent of the 1990s. Nevertheless, production efficiency gains were achieved through the
reduction of system losses.
There is a danger that the findings on price trends could provide ammunition to those advocating the
repeal of the EPIRA and re-nationalization of the industry. It must be emphasized, however, that the
country has a long history of private sector-led electric power industry: more than eight decades of
private sector-led generation capacity development (1890-1972), less than one and a half decades of
government monopoly in generation (1972-1987), less than a decade of mixed private and public sector
generation (1987-2006), and an evolving competition with many stakeholder participants, including end-
users (2006-present). Moreover, the nationalization years were marked by inefficiencies and fiscal
problems that were not borne by electricity consumers alone but by the whole country. Thus, calls to
repeal EPIRA are ill-advised. What needs to be done is to find ways of improving its implementation. We
must recognize that the evolution in the governance structure of the industry is still unfinished. The
electricity spot market has to be governed by an independent market operator; regulatory capacity has
to be strengthened; and the energy department needs to beef up its planning function.
Key words: EPIRA, electric power industry, competition, restructuring, electricity price
* PIDS Senior Research Fellow, Research Specialist and Research Analyst, respectively.

Contents 1. Introduction .......................................................................................................................................... 4
2. The evolution of the electric power industry ....................................................................................... 6
2.1 The industry pre-EPIRA ................................................................................................................. 6
2.1.1 A historically private sector-led electric power industry ...................................................... 6
2.1.2 A period of public sector-led development .......................................................................... 7
2.1.3 The re-entry of private sector generation through the IPPs................................................. 7
2.1.4 The bankruptcy of the NPC: a GOCC problem that became a national problem ................. 8
2.2 The industry post-EPIRA .............................................................................................................. 10
2.2.1 Electric power generation ................................................................................................... 11
2.2.2 Wholesale electricity market .............................................................................................. 13
2.2.3 Transmission ....................................................................................................................... 18
2.2.4 Electricity distribution ......................................................................................................... 19
2.2.5 Retail electricity supply ....................................................................................................... 19
3. Post-EPIRA impacts ............................................................................................................................. 23
3.1 Price affordability .............................................................................................................................. 23
Trends on the system rate .................................................................................................................. 23
Changes in price volatility ................................................................................................................... 28
Trends in the components of electricity price .................................................................................... 31
3.2 Supply reliability ................................................................................................................................ 32
3.2 System loss reduction ....................................................................................................................... 36
4. Conclusions ......................................................................................................................................... 42
References .................................................................................................................................................. 44
List of Figures
Figure 1. Post-EPIRA Market Structure ....................................................................................................... 11
Figure 2.Spot Quantity vs Bilateral Quantity Load ...................................................................................... 17
Figure 3. Average system rates per type of utility, in nominal terms ......................................................... 24
Figure 4. Nominal and real prices of electricity .......................................................................................... 26
Figure 5. Annual inflation of nominal system rates .................................................................................... 29
Figure 6. Volatility of Representative Electricity Price, January 1994 - October 2015 ............................... 30

3
Figure 7. Supply Reliability in the Luzon Grid, 2005-2014 .......................................................................... 34
Figure 8. Supply Reliability in the Visayas Grid, 2005-2014 ........................................................................ 35
Figure 9. Supply Reliability in the Mindanao Grid, 2005-2014 ................................................................... 36
Figure 10. Transmission System Loss vs. ERC caps, per Grid, 2001-2015 ................................................... 38
Figure 11. Distribution System Loss of Electric Cooperatives, 1990-2014 ................................................. 39
Figure 12. Distribution System Loss of MERALCO, 1990-2014 ................................................................... 40
Figure 13. Transmission and Distribution Losses across ASEAN, 2012 ....................................................... 41
List of Tables
Table 1.Spot Quantity vs Bilateral Quantity Load (MWh), July 2006 – Jan 2015........................................ 13
Table 2. Summary of Relevant Policy Issuances for the Implementation of RCOA .................................... 20
Table 3. Summary of RCOA Registration ..................................................................................................... 22
Table 4. Summary of RCOA Applications .................................................................................................... 22
Table 5. Average System Rates (PHP/kWh), 1990-2014 ............................................................................. 23
Table 6. National average system rate in nominal and real terms, 1994-2014 .......................................... 25
Table 7. Retail Electricity Tariffs across Selected Asian Countries (June 1998) .......................................... 26
Table 8. Growth Rates of MERALCO Rate Components (All Customer Groups), 2004-2014 ..................... 31
Table 9. Growth Rate of ECs’ Rate Components (Residential only), 2008-2013 ........................................ 31
Table 10. System Loss: Average Annual Growth Rates, Pre- and Post-EPIRA ............................................ 37
Table 11.Cross-country studies on the impact of electricity market liberalization on energy prices ........ 42

4
1. Introduction
Through the General Appropriations Act (GAA) of 2014, the Philippine Institute for Development Studies
(PIDS) was given a mandate and the resources to conduct impact evaluation studies for selected projects
and programs of the government (e.g., reforestation program, irrigation projects, and social service
projects). As impact evaluation should also apply to policies, the PIDS also pursued the evaluation of
outcomes of specific laws such as Republic Act No. 9136 or the Electric Power Industry Restructuring Act
of 2001 (hereafter, EPIRA) and RA 8794 or the Motor Vehicle Users’ Charge Law. This study focuses on
impact evaluation related to EPIRA and narrows down the scope of the evaluation to the desired
outcomes of the competition policies contained in the EPIRA.
This study therefore aims to assess the impacts of competition policies in the restructured electric
power industry that is brought about by the implementation of the EPIRA. The study clarifies what these
competition policies are and attempts to find evidence of their impacts. In pursuing the study, we
conducted a series of focus group and key informant interviews with market players and the regulator,
mined through the data of energy sector agencies, and reviewed the experiences of other electricity
markets.
As the EPIRA restructured one whole industry and affected the whole population, there is no
counterfactual in the usual sense of impact evaluation counterfactual concept which utilizes a control
group that can be compared with a treatment group.1 The second best approach then is to compare the
situation of the population pre-EPIRA and post-EPIRA. The foremost indicators we look at on the
consumption side are electricity price affordability and electricity supply reliability. On the production
side, we assess systems losses as an indicator of production efficiency.
The desired outcomes related to electricity price and supply that were set by the EPIRA (enacted on
June 8, 2001) can be gleaned from the declaration of policy in Section 2. In particular, Section 2 of the
law states, among others,
“It is hereby declared the policy of the State…
(b) To ensure the quality, reliability, security and affordability of the supply of electric power
(c) To ensure transparent and reasonable prices of electricity in a regime of free and fair
competition and full public accountability to achieve greater operational economic efficiency
and enhance the competitiveness of Philippine products in the global market…
(j) To establish a strong and purely independent regulatory body and system to ensure
consumer protection and enhance the competitive operation of the electricity market…”
It is to be noted that the EPIRA does not exactly promise reducing electricity prices relative to pre-EPIRA
levels but ensuring that such are affordable. To sum up, the desired outcomes are:
1 In project or program impact evaluation parlance, a control group is used as a baseline measure in the sense that it is composed of population (households or individuals) with similar characteristics as the population in the treatment group except that it does not receive the treatment or intervention. The treatment group is the population which received the intervention, such as social services through a project or program.

5
reliable, secure and affordable electric power
transparent and reasonable electricity price
free and fair competition
independent regulation
consumer protection
The major competition-related policies enacted through the EPIRA are:
Unbundling a vertically integrated industry and introducing competition in the generation
sector
Creating a retail supply sector and introducing competition in the end-user sector
To enable competition, other requisite policies were also introduced, as follows:
Privatization of the government generation assets and power grid operation and
maintenance
Creation of a spot market for wholesale electricity trading
Enabling open access to wires
Establishment of a quasi-judicial regulator
Setting market share limits
Prohibiting cross-ownership between transmission and generation/distribution and setting
cross-ownership limit between generation and distribution
Entry regulation through licensing and registration and price regulation in specific areas
Nevertheless, to immediately demonstrate a price impact of the legislation, Section 72 of the EPIRA
mandated a rate reduction, as follows: "Upon the effectivity of this Act, residential end-users shall be
granted a rate reduction from NPC rates of thirty centavos per kilowatt-hour (P0.30/kWh). Such
reduction shall be reflected as a separate item in the consumer billing statement."

6
2. The evolution of the electric power industry
2.1 The industry pre-EPIRA
The electric power industry started in the Philippines as a private sector-led industry in 1890 and
remained so until the late 1960s; the government pursued rural electrification through the cooperative
business model starting in 1969; the monopoly of generation by the National Power Corporation (NPC)
started in 1973; and then the re-entry of private sector in the generation sector through independent
power producers (IPPs) started in 1987. Prior to the 2001 restructuring under the EPIRA, the electric
power industry had a vertically integrated generation and transmission sector through the NPC and
wholesale power purchases from the IPPs were predominantly through the NPC. Distribution utilities
were local monopolies in their respective service areas.
2.1.1 A historically private sector-led electric power industry
According to the NEA’s narrative of the historical background of the industry, from 1890 to the late
1960s, power generation and distribution were largely controlled by private entities. Although
Commonwealth Act 120 created the NPC in 1936, the law tasked it to develop the country’s hydropower
potential, thus making it one among the then existing developers of generation capacity (NEA n.d.).
World Bank (1994) explains that government intervention through NPC was justified on the grounds that
(i) decisions with regard to the development of particular hydro sites required inputs from and had an
impact on a number of other sectors of the economy; and (ii) the construction of hydro facilities
involved capital investments so large that only the govermment was thought to have the needed
resource mobilization capacity.
The Manila Electric Company (Meralco) remained the largest privately-owned utility which also had the
highest contribution to the country’s total generation capacity. Moreover, back then, there were small
generating systems that were installed and owned by private operators and local government units (NEA
n.d.). Private interests developed virtually all electric power facilities and vertically integrated investor
owned businesses supplied most load centers in Luzon, Visayas and Mindanao. It was only in
hydropower generation and through the NPC where the government had a significant generation
ownership and participation (World Bank 1994). Such was the situation for more than eight decades,
that is, until 1972.

7
2.1.2 A period of public sector-led development
On August 14, 1969, Republic Act 6038 created the National Electrification Administration (NEA) and laid
the groundwork for accelerated electrification in the countryside. The law provided a framework for
rural electrification through not-for-profit cooperatives as a business model and loans and technical
assistance from the NEA. In 1972, then President Ferdinand Marcos imposed Martial Law and shortly
thereafter, the Marcos administration seized the assets of Meralco.
Marcos issued Presidential Decree No. 40 which granted monopoly powers to the NPC as it
concentrated all generation and transmission ownership and development rights to the entity. This also
entailed the government implementing artificially suppressed pricing policies to keep electricity prices
low for residential consumers and other small consumers.
2.1.3 The re-entry of private sector generation through the IPPs
After almost one and a half decades of government dominance in the electric power industry, in 1986,
the administration of then president Corazon Aquino reverted Meralco to private ownership. The
administration then decided not to operate the Bataan Nuclear Power Plant “for reasons of safety and
economy” (EO 55 s. 1986).2 Dolan (1991) also reported that the Aquino government decided not to use
the facility because it was located on a seismic fault.3 In 1987, Aquino issued Executive Order (EO) 215
reversing the policy of granting generation monopoly to NPC and entertained proposals from
independent power producers (IPPs) for build-operate-transfer (BOT) and build-own-operate (BOO)
arrangements for new generating capacity. EO 215 s. 1987 amended PD 40 to specifically allow the
private sector to generate electricity and categorically state that "the generation of electricity, unlike the
transmission and distribution of electricity, is not a natural monopoly and can be undertaken by more
2 In addition, to relieve the NPC of the foreign debt service burden related to the plant as it will not be able to earn revenues for such, the national government assumed the corresponding foreign and peso obligations incurred by the NPC in constructing the plant (EO 55 s. 1986). 3 The debate on whether the BNPP is worth reviving resurfaced in 2009 when then Congressman Mark Cojuangco authored a bill mandating the immediate rehabilitation, commissioning and commercial operation of the plant. But scientists debunked the scientific soundness of the assumptions of the bill; for instance, a professor emeritus of the University of Illinois at Chicago said that BNPP commissioning proponents are selective of facts and ignore inconvenient scientific truths that are easily available and verifiable and then laid down the such verifiable evidences in his paper "Geological Hazards of the Bataan Nuclear Plant: Propaganda and Scientific Fact" (Rodolfo 2009). A 2012 scientific journal article also shed more light on the BNPP safety issue: Lagmay et al (2012) reports the result of detailed geological fieldwork in Mt. Natib, the site of the BNPP, and concluded, among other things, that the nearest eruptive center of the volcano is 5.5 km away from the plant, pyroclastic flows can affect the BNPP site, and an associated thrust fault at the nuclear site cuts through lahars up to the ground surface.
8
than one entity." The first BOT contract for a power plant was then signed in 1989 by the NPC and
Hopewell Energy Management, Ltd.4
As reported by Woodhouse (2005), the Philippines’ move toward independent power generationthis
move is consistent with the experience in many other developing countries. The move was also meant
to avert power shortages that were expected to arise due the removal of what would have been a large
chunk of new capacity from the BNPP. A power crisis did occur during the last year of the Aquino
administration and during the early years of the presidency of Fidel Ramos, who successfully ended the
power crisis in 1994. However, it was not only the BNPP non-operation that led to the crisis; it was
compounded by the slow approval of NPC projects and the El Nino-caused droughts, which in turn
reduced the capacity of hydropower plants. Woodhouse (2005) described that at the peak of the
shortage, the blackouts averaged 12-14 hours per day, 300 days per year and the World Bank (1994)
estimated that the gross economic cost of the outages was US$0.50/kWh.
The vast majority of IPP contracts were with the NPC because until 1991, the NPC interpreted EO 215 s.
1987 as not entailing direct supplies to electricity distributors and that it should be the single buyer of
generated electricity. But as the power shortage worsened, the government allowed the direct supply of
IPPs to Meralco (World Bank 1994). In the late 1990s, the depreciation of the peso due to the Asian
financial crisis caused the NPC’s contracted IPP payments to balloon and, at a time when indicators
point toward an impending fiscal crisis during the Estrada presidency, social awareness and criticism of
the IPPs grew exponentially (Woodhouse 2005).
2.1.4 The bankruptcy of the NPC: a GOCC problem that became a national problem
The deteriorating NPC financial position and eventual bankruptcy in the 1990s is well known.
Woodhouse (2005) partly attributes this to the impact of the Asian financial crisis. According to him, the
financial crisis did not affect the Philippines as suddenly or severely as its South-East Asian neighbors.
During 1997 to 1999, major macroeconomic indicators declined severely, but not as steeply as in
Indonesia, Malaysia or Thailand. Although the Philippine market was not impacted as severely as those
in Indonesia, Malaysia, or Thailand, neither has it rebounded as those markets have. Rather, the
Philippines continued to move along with growth rates of between 3-5% annually. Similarly, where the
currencies of Malaysia and Thailand had rebounded somewhat from there mid-crisis lows, the Philippine
peso had continued its progressive decline in relation to the dollar. In the IPP sector, this resulted in a
continued increase in the peso cost of power from dollar-denominated IPP contracts. Thus, where the
impact of the crisis on other South-East Asian countries was sudden and acute, in the Philippines, the
crisis introduced a new period of sustained decline.
4 EO 215 s. 1987 preceded the formal policy using public-private partnerships in financing and building infrastructure which used to be undertaken by the government: RA 6957. In 1990, RA 6957 legislated the framework for the use of the BOT mode and its variants in the financing, construction, operation and maintenance not only of power plants but of all other infrastructure projects.

9
In the assessment of Woodhouse, this decline affected the IPP sector in two ways. First, because of a
shortfall in electricity demand precisely when significant new capacity came on line, the electricity
sector entered a period of excessive oversupply in the late 1990s. Constrained by the take-or-pay
provisions of the IPP contracts, Napocor began paying higher unit prices for electricity as dispatch of
plants sank to as low as 30-40%. Second, while recovering its IPP payments from a dwindling number of
kilowatt hours sold, Napocor also saw its IPP payments increase substantially due to the pesos’ loss of
value.
The overoptimistic power demand projections complicated the problem. Woodhouse described that in
the early- and mid-1990s, the government forecast demand growth as ranging from 9.5-12% per year,
although these projections were abruptly derailed by the Asian financial crisis. However, in 1994, the
World Bank already warned implicitly against the risk of over-commitment through the uncoordinated
signing of power purchase agreements with IPPs, which essentially passed demand risk to the consumer
through take-or-pay provisions.
The assessment in the 2004-2010 Medium Term Philippine Development Plan (MTPDP) also described
the deterioration of the NPC’s financial position. The operations and financial conditions of NPC until
end of 1997 were viable and satisfactory. However, due to the significant devaluation of the Philippine
peso brought about by the Asian financial crisis, NPC has incurred significant losses amounting to PhP3.2
billion in 1998 (NEDA 2004).
SEPO (2006) also explained that contributing to NPC’s net income loss was the faster growth of
operating expenses compared to operating revenues. The poor revenue growth was attributed largely to
NPC’s inability to charge rates that could at least recover its cost. The financial statements of NPC
showed that it consistently registered a net income loss from 1999 to 2004, the largest of which was the
P117.0 billion loss in 2003. It has also failed to register a positive net income since 1997.
Another factor is the significant increase in coal and oil prices. Given the significant levels of fuel
purchases, the NPC is very sensitive to price volatilities and availability of fuel in the market, thus, the
need to cover for such volatilities and fuel availability uncertainties. The NPC debt portfolio had three
major currencies, namely, US dollar, Japanese yen and the euro. Historical averages and forward rates
indicated depreciation of the peso against these currencies. Furthermore, there was a mismatch
between the revenues received in pesos and the debts paid in foreign currencies (NEDA 2004). This
provided the boost to the then growing sentiment toward privatizing NPC assets, and restructuring the
electricity industry.
Immediately prior to EPIRA enactment, the industry structure can be summarized as follows: The
generation, transmission and supply activities were vertically integrated and the state-owned NPC acted
as the transmission grid operator, dominant generator, and dominant supplier of wholesale electricity to
distribution utilities (i.e., private distribution utilities, local government-owned distribution utilities, and
electric cooperatives). Other generators, that is, the independent power producers, sell the bulk of their
generated power to NPC and some to Meralco.
10
2.2 The industry post-EPIRA
The government then took several steps through the EPIRA to restructure the electric power industry.
The law abolished the Energy Regulatory Board and created the Energy Regulatory Commission (ERC) to
enforce regulations for a new and restructured industry. The law also created the Power Sector Assets
and Liabilities Management Corporation (PSALM) to take over the assets and liabilities of NPC, privatize
generation assets (i.e., generating plants and IPP administration contracts), and use the proceeds to pay
down the outstanding debt of NPC.
The EPIRA also created the National Transmission Corporation (Transco) to assume the ownership of the
transmission assets, initially take over the power grid operation function, and gradually divest the sub-
transmission assets. Eventually, the concession for grid operation was offered to the private sector
through a competitive bidding. The private National Grid Corporation of the Philippines (NGCP) won the
bid and now operates the Luzon, Visayas and Mindanao power grids.
The distribution sector is still a regulated sector with local monopolies held by the distribution utilities in
their respective franchise areas. Open access to distribution wires and retail competition is now allowed.
Under retail competition, consumers with at least one megawatt of electricity consumption can freely
choose their suppliers. The transition to retail competition officially began on June 26, 2013 and 239
consumers in the contestable market are now being supplied by their chosen suppliers. A new sector
was thus created, the retail electricity supply sector. Under the law, the contestable market shall be
extended to end-users consuming 750 kilowatts of electricity after two years of implementing retail
competition.
The Philippines' electric power industry now has four distinct sectors: generation, transmission,
distribution, and retail electricity supply. Ownership is also mixed as both the government and the
private sector owns electricity generation assets, the government owns the power grid, and
cooperatives and private utilities own distribution assets (Figure 1). With the emergence of a more
complex market structure in the electric power industry, a huge challenge to spot and curb market
power exercise also emerged.

11
Figure 1. Post-EPIRA Market Structure
Source: KPMG Global Energy Institute, 2013
2.2.1 Electric power generation
To facilitate the privatization process, the EPIRA provided for the creation of the Power Sector Assets
and Liabilities Management Corporation (PSALM) to take over all existing generation assets and
liabilities of the NPC. PSALM was also tasked to use the revenue generated to pay the outstanding debt
of the NPC. Furthermore, Executive Order No. 215 series of 1987, which allows private sector to
generate electricity, classifies four types of generating plants: (1) co-generation units or the
simultaneous generation of both electricity and heat from the same fuel, (2) electric generating plants
intending to sell their production to the grids, (3) electric generating plants intended primarily for the
internal use of the owner, and (4) electric generating plants outside the NPC grids.
The latest EPIRA status report released by the Department of Energy (DOE), which covers November
2014 to April 2015 period, highlights the privatization of the remaining generation assets, particularly
the Power Barges (PBs) 101-104 as well as the transfer of contract to an Independent Power Producer
Administrator (IPPA) of Unified Leyte Geothermal Power Plant (ULGPP) for the Bulk Energy. As of June
2015 4, the privatization level of NPC generating facilities has reached 89.7%, following the successful
bid of Naga Power Plant Complex in March 2014. Meanwhile, the proposed closing and turn-over
schedule of Angat Hydro-electric Power Plant to Korean Water Resources, Inc. was officially done in
October of the same year.
Another entity established by the EPIRA is the Energy Regulatory Commission (ERC). Its main task is to
promote competition, encourage market development, and enforce regulations in the newly
restructured market. This is because, contrary to PD 40, power generation under the EPIRA was not
considered a public utility operation, as stated in Section 6 of RA 9136 otherwise known as EPIRA Act of

12
2001. This made the generation sector of the industry competitive and opens to other players in the
market. Under the EPIRA, any person or entity engaged in generation and supply shall not be required to
apply for a national franchise; provided that it secures a certificate of compliance from the ERC.
Based on the 26th EPIRA Status Report, the generation sector is still dominated by the San Miguel Energy
Corporation (SMEC) with 25% in the Luzon Grid or 18 % of the National Grid. This is followed by the
Aboitiz Power Corporation with 18% and 16% of the Luzon Grid and National Grid, respectively, while
First Gen Corporation has 17% and 15%. Meanwhile, Global Business Power Corporation (GBPC) lead the
Visayas region with 29.64% share for the Visayas Grid, while in Mindanao, the state continues to control
the generation sector, with NPC and PSALM holding 47% and 18% of the generation capacity,
respectively.
Meanwhile, with the privatization of assets and the advent of opportunities for new industry players,
the EPIRA also provided for a mechanism for competition under the Wholesale Electricity Spot Market
(WESM).
Thus, under the present market, generated power is traded though 1) bilateral contracting between
generating firms and DUs and big end-users, and 2) through the wholesale electricity spot market
(WESM). With bilateral contracts, generation firms can have agreements with various distribution
companies. To address the concern on weak competition for DUs’ power purchases, the DOE issued in
June 2015 a circular which mandates all DUs to undergo Competitive Selection Process (CSP) in Securing
Power Supply Agreements (PSA). The general principles behind said circular are to (a) increase
transparency in the procurement process, (b) promote and instill competition in the procurement and
supply of electric power to end-users, (c) ascertain least-cost outcomes, and (d) protect public interest.
Entities that will be covered are the different players in the distribution sector (see discussion under
distribution section). Small players and IPPs, which have little or no cross-ownership and control with
ECs and DUs, will also have a fairer level playing field in obtaining supply contracts.
Meanwhile, in accordance with the WESM rules, generation firms with facilities connected to a grid shall
make information available to the market operator to enable the latter to implement appropriate
dispatch scheduling. Based on the DOE’s 26th EPIRA report, some of the regulatory measures presented
include revisiting the recommendations on establishing and implementing a market floor price under
the WESM Design Study and PEMC’s Market Studies on WESM Price Cap and Floor Price as well as on
Mitigating Measures. In addition, DOE issued another circular which aims to promulgate the protocol for
the central scheduling and dispatch of energy and contracted reserves in preparation for the commercial
operations of the WESM reserve market. With the said protocol, the DOE can be able to monitor all
available generation capacity in both energy and reserve. Similarly, it would provide more preparations
to the participants for the eventual commercial operation of the WESM Reserve Market.
On the other hand, for remote areas not connected to the grid (also known as missionary areas), the
generation of power is the responsibility of Small Power Utilities Group (SPUG). Upon the enactment of
EPIRA into law, the role of SPUG was strengthened. SPUG is authorized to undertake missionary
electrification or electrification of areas not connected to the main transmission network. As provided
by law, SPUG will implement the Missionary Electrification Development Plan and is to be funded by
SPUG revenues and from the “universal charge” collected from all end-users.

13
2.2.2 Wholesale electricity market
With the privatization of NPC generation assets, many players in the generation sector emerged and competition was introduced through the establishment of the wholesale electricity spot market (WESM) in Luzon in 2006 and in Visayas in 2010. WESM provides for a centralized platform where the electricity is treated as a commodity and prices are determined via bids based on actual use (demand) of buyers and availability of electricity (supply) traded sellers. The Philippine Electric Market Corporation (PEMC) and the National Grip Corporation (NGCP) of the Philippines work together in the operation of the WESM, with the former as the market operator, while the latter is the designated system operator of the spot market. WESM started its operation in Luzon in 2006 and in Visayas in 2010. As of April 2015, the integrated WESM (Luzon and Visayas) has a total of 237 registered participants, including 67 generating companies and 170 customers, which in turn are comprised of 14 Private Distribution Utilities (DUs), 71 Electric Cooperatives (ECs), 78 Bulk users, and 7 Wholesale Aggregators. The wholesale electricity market now consists of the bilateral market, where contracting between a DU and a genco occurs and each medium to long-term power supply agreement is subject to review and approval by the regulator, and the spot market, where hourly trading of electricity happens. As shown in Table 1 (data beginning from July 2006 up to January 2015), majority of the metered electricity quantity is derived from bilateral contracts between DUs and gencos.
Table 1.Spot Quantity vs Bilateral Quantity Load (MWh), July 2006 – Jan 2015
Month Metered Quantity (Load), MWh
Spot Quantity (Load), MWh
%
Bilateral Contract Quantity (Load), MWh
%
Jul-06 3,094,164.95 1,355,434.37 44% 1,738,730.58 56%
Aug-06 3,147,800.36 1,159,428.23 37% 1,988,372.13 63%
Sep-06 3,314,855.13 1,291,334.84 39% 2,023,520.30 61%
Oct-06 2,873,285.25 1,224,467.60 43% 1,648,817.65 57%
Nov-06 3,234,958.03 1,069,288.10 33% 2,165,669.93 67%
Dec-06 2,972,091.65 519,152.06 17% 2,452,939.59 83%
Jan-07 3,035,805.04 589,925.05 19% 2,445,879.99 81%
Feb-07 3,102,610.89 510,281.30 16% 2,592,329.59 84%
Mar-07 2,980,658.77 536,155.65 18% 2,444,503.12 82%
Apr-07 3,407,504.68 698,602.96 21% 2,708,901.72 79%
May-07 3,460,944.49 503,878.03 15% 2,957,066.46 85%
Jun-07 3,561,655.99 805,535.91 23% 2,756,120.08 77%
Jul-07 3,408,973.90 531,237.60 16% 2,877,736.29 84%
Aug-07 3,286,050.22 460,225.65 14% 2,825,824.57 86%

14
Month Metered Quantity (Load), MWh
Spot Quantity (Load), MWh
%
Bilateral Contract Quantity (Load), MWh
%
Sep-07 3,362,494.13 358,578.07 11% 3,003,916.06 89%
Oct-07 3,229,031.96 247,585.19 8% 2,981,446.77 92%
Nov-07 3,204,655.78 346,596.90 11% 2,858,058.88 89%
Dec-07 3,083,441.24 371,343.26 12% 2,712,097.98 88%
Jan-08 3,131,009.80 411,372.54 13% 2,719,637.26 87%
Feb-08 3,212,635.82 454,532.74 14% 2,758,103.08 86%
Mar-08 3,041,008.30 354,398.37 12% 2,686,609.93 88%
Apr-08 3,634,855.57 634,329.07 17% 3,000,526.50 83%
May-08 3,323,367.13 356,234.23 11% 2,967,132.90 89%
Jun-08 3,538,106.32 400,132.11 11% 3,137,974.21 89%
Jul-08 3,435,104.78 408,863.87 12% 3,026,240.91 88%
Aug-08 3,399,912.16 372,803.00 11% 3,027,109.16 89%
Sep-08 3,530,050.75 511,447.58 14% 3,018,603.17 86%
Oct-08 3,421,671.57 466,154.42 13.60% 2,955,517.15 86%
Nov-08 3,447,266.38 535,759.02 15.50% 2,911,507.37 84%
Dec-08 3,151,245.74 545,175.13 17.30% 2,606,070.61 83%
Jan-09 2,906,720.56 604,622.65 20.80% 2,302,097.92 79%
Feb-09 3,358,810.66 766,465.14 22.80% 2,592,345.53 77%
Mar-09 3,222,969.29 537,701.69 16.70% 2,685,267.60 83%
Apr-09 3,503,547.55 414,910.72 11.80% 3,088,636.83 88%
May-09 3,463,438.29 516,030.34 14.90% 2,947,407.95 85%
Jun-09 3,608,313.89 475,456.08 13.20% 3,132,857.82 87%
Jul-09 3,538,571.31 357,675.26 10.10% 3,180,896.05 90%
Aug-09 3,671,459.51 586,189.83 16.00% 3,085,269.69 84%
Sep-09 3,652,903.81 486,078.85 13.30% 3,166,824.96 87%
Oct-09 3,347,101.84 512,979.44 15.30% 2,834,122.40 85%
Nov-09 3,575,986.76 474,059.82 13.30% 3,101,926.94 87%
Dec-09 3,381,576.00 447,970.83 13.20% 2,933,605.16 87%
Jan-10 3,391,691.08 464,968.76 13.70% 2,926,722.32 86%
Feb-10 3,709,258.54 678,908.20 18.30% 3,030,350.34 82%
Mar-10 3,496,870.27 479,469.01 13.70% 3,017,401.26 86%
Apr-10 3,785,877.48 587,784.31 15.50% 3,198,093.17 84%
May-10 4,025,236.25 632,741.76 15.70% 3,392,494.49 84%
Jun-10 4,120,067.20 711,151.61 17.30% 3,408,915.59 83%
Jul-10 3,705,460.47 594,644.27 16.00% 3,110,816.20 84%
Aug-10 3,900,844.43 462,747.56 11.90% 3,438,096.86 88%
Sep-10 3,893,171.32 321,815.88 8.30% 3,571,355.44 92%
Oct-10 3,721,843.57 363,704.17 9.80% 3,358,139.40 90%

15
Month Metered Quantity (Load), MWh
Spot Quantity (Load), MWh
%
Bilateral Contract Quantity (Load), MWh
%
Nov-10 3,791,123.99 448,742.73 11.80% 3,342,381.26 88%
Dec-10 3,618,918.64 403,623.82 11.20% 3,215,294.82 89%
Jan-11 4,065,400.56 272,481.78 6.70% 3,792,918.77 93%
Feb-11 4,405,384.21 470,203.49 10.70% 3,935,180.72 89%
Mar-11 4,072,738.35 263,789.55 6.50% 3,808,948.79 94%
Apr-11 4,313,514.71 202,777.98 5% 4,110,736.73 95%
May-11 4,675,217.40 399,466.39 9% 4,275,751.00 91%
Jun-11 4,665,692.14 453,082.12 10% 4,212,610.01 90%
Jul-11 4,496,424.04 358,118.31 8% 4,138,305.73 92%
Aug-11 4,588,527.67 280,049.63 6% 4,308,478.03 94%
Sep-11 4,591,257.49 364,979.67 8% 4,226,277.81 92%
Oct-11 4,359,048.50 435,802.47 10% 3,923,246.03 90%
Nov-11 4,597,790.37 460,942.12 10% 4,136,848.25 90%
Dec-11 4,386,874.52 524,084.49 12% 3,862,790.03 88%
Jan-12 4,335,207.47 261,447.91 6% 4,073,759.57 94%
Feb-12 4,519,990.57 251,555.63 6% 4,268,434.94 94%
Mar-12 4,416,326.59 389,036.20 9% 4,027,290.40 91%
Apr-12 4,724,661.49 303,929.41 6% 4,420,732.08 94%
May-12 4,980,881.89 373,513.98 7% 4,607,367.91 93%
Jun-12 5,080,154.44 513,897.32 10% 4,566,257.12 90%
Jul-12 4,756,271.85 686,471.55 14% 4,069,800.30 86%
Aug-12 4,502,480.50 288,702.16 6% 4,213,766.33 94%
Sep-12 4,745,836.69 391,723.48 8% 4,354,113.21 92%
Oct-12 4,656,469.61 382,553.20 8% 4,273,916.41 92%
Nov-12 4,744,798.66 405,825.13 9% 4,338,973.53 91%
Dec-12 4,607,806.64 425,066.37 9% 4,182,740.26 91%
Jan-13 4,414,305.72 389,527.57 9% 4,024,778.15 91%
Feb-13 4,621,906.41 436,075.11 9% 4,185,831.30 91%
Mar-13 4,440,321.96 489,406.63 11% 3,950,915.33 89%
Apr-13 5,165,108.01 690,301.91 13% 4,474,806.09 87%
May-13 5,164,987.79 649,414.99 13% 4,515,572.80 87%
Jun-13 5,216,803.55 462,431.41 9% 4,754,372.14 91%
Jul-13 4,987,292.11 372,992.40 7% 4,614,299.70 93%
Aug-13 4,849,001.48 298,890.93 6% 4,550,110.55 94%
Sep-13 4,987,626.49 376,226.02 8% 4,611,400.47 92%
Oct-13 4,766,261.63 512,972.96 11% 4,253,288.67 89%
Nov-13 4,677,500.80 528,864.25 11% 4,148,636.54 89%
Dec-13 4,609,734.84 596,725.33 13% 4,013,009.51 87%

16
Month Metered Quantity (Load), MWh
Spot Quantity (Load), MWh
%
Bilateral Contract Quantity (Load), MWh
%
Jan-14 4,312,799.83 237,572.21 6% 4,075,227.62 94%
Feb-14 4,567,631.21 381,847.63 8% 4,185,783.58 92%
Mar-14 4,377,185.09 363,153.84 8% 4,014,031.24 92%
Apr-14 5,127,579.02 365,717.19 7% 4,761,861.83 93%
May-14 5,398,330.57 311,115.95 6% 5,087,214.61 94%
Jun-14 5,529,234.27 392,073.55 7% 5,137,160.72 93%
Jul-14 4,838,209.25 405,791.36 8% 4,432,417.88 92%
Aug-14 5,142,299.09 269,169.24 5% 4,873,129.84 95%
Sep-14 5,114,897.88 327,069.32 6% 4,787,828.56 94%
Oct-14 5,038,319.29 402,860.62 8% 4,635,458.47 92%
Nov-14 5,198,478.23 362,334.42 7% 4,836,143.75 93%
Dec-14 4,829,185.14 367,714.59 8% 4,461,470.55 92%
Jan-15 4,469,259.37 246,913.22 6% 4,222,346.15 94%
Source: PEMC.
As shown in Figure 2, bilateral contract transactions have been generally increasing (or spot transactions have been generally declining) since the WESM opened in 2006, peaking at 94% of the total metered quantity load in May 2014.

17
Figure 2.Spot Quantity vs Bilateral Quantity Load
Source: PEMC
0.00
1,000,000.00
2,000,000.00
3,000,000.00
4,000,000.00
5,000,000.00
6,000,000.00
Spot Quantity vs Bilateral Quantity (MWh), July 2006 – Jan. 2015
Spot Quantity (Load), MWh Bilateral Contract Quantity (Load), MWh

18
2.2.3 Transmission
In the restructured electric power industry, the transmission function of NPC was initially transferred to
a new government entity and then eventually to a private firm via a concession contract. Section 8 of
the EPIRA law created the National Transmission Commission, or Transco. Transco is mandated by law to
assume NPC’s authority and responsibility for the planning, construction, operation and maintenance of
transmission facilities, including grid interconnections and ancillary services. In March 1, 2003, the
transfer of transmission function was completed and Transco started operating and managing the
power transmission system.5
The EPIRA also provided for the privatization of the operation and further development of the
transmission network. In Section 21, the law directed the PSALM to award the operation and
development of the transmission facilities to a qualified party via an outright sale or concession
agreement. On December 12, 2007, the consortium of Monte Oro Grid Resources Corporation, Calaca
High Power Corporation, and State Grid Corporation of China won in a bidding conducted by PSALM for
the operation and maintenance of the nationwide transmission network. The winning bid amounted to
P3.95 billion. The consortium later reorganized to become the National Grid Corporation of the
Philippines (NGCP).
Finalizing the privatization process of the transmission network, Republic Act No. 9511 (also known as
the Franchise Law) was signed into law on December 1, 2008. The Franchise law granted a 25-year
concession to NGCP, which is renewable for another 25 years. Although the Franchise Law authorizes
the National Grip Corporation of the Philippines (NGCP) to operate and manage the transmission
netwrok, the ownership of all transmission assets remain with the Philippine government through the
TRANSCO.
Technically, the transmission network is a natural monopoly, with NGCP as the sole operator in the
country. Given this, the Franchise Law has included guidelines in the preventing anti-competitive
behavior, and unfair trade practices. Specifically, Section 7 of the EPIRA law prohibits cross-ownership
between NGCP and other electric power industry players in the generation, distribution, and retail
supply. In particular, any stockholders, directors, and officers of the NGCP or any of their relatives up to
the fourth level degree of consanguinity and their respective spouses are not allowed to hold shares of
stock in other power industry stakeholders. Further, losing bidders for the concession agreement shall
not be allowed to share in the ownership or share of stocks of NGCP within 10 years of the effectivity of
the Franchise law.
One aspect that presents a potential to abuse market power, given that the NGCP is the sole player in
the transmission business, is the setting of the transmission rates. However, safeguards have been in
place by virtue of Section 7 of the EPIRA. The law states that the transmission of electricity shall be a
‘regulated’ common carrier business, with ERC having supervision in the ratemaking aspects. Pursuant
to Section 43(f) of the same law and Rule 15, Section 5(a) of the corresponding Implementing Rules and
Regulations, the ERC was given authority to develop and implement a methodology that shall be used to
set the transmission wheeling rates. In May 29, 2003, the ERC released Case No. 2003-34 and
5 See www.transco.gov.ph.

19
promulgated Guidelines on the Methodology for Setting Transmission Wheeling Rates. The said
guidelines has been revised and re-issued in July 20, 2009 by virtue of ERC Case No. 2009-008RM.
Each regulatory period for NGCP is set to five (5) calendar years.6 Currently, the concessionaire is
implementing the third regulatory period until December 2015. Steps to for the 4th Regulatory Period
are being pursued by both the ERC and the NGCP which is set to commence by 2016. Issues being
discussed for the implementation of the 4th round of rate setting include alternative building blocks of
transmission rates and the extension of the regulatory period from five (5) years to ten (10) years.7
2.2.4 Electricity distribution
As for the distribution sector, it is still a regulated common carrier business run by local monopolies with
defined franchise areas. The distribution sector is composed of electric cooperatives (ECs), private
distribution utilities (DUs), local government unit (LGU)-owned utilities, and other duly authorized
entities regulated by the ERC. Based in the Distribution Development Plan 2010-2019, there are
currently 121 ECs, 17 private DUs, and 8 LGUs in the distribution sector.
The EPIRA has also brought about the unbundling of rates. Currently, end-users are able to see the
various components of their electric bills: generation charge, transmission wheeling rate, system loss,
distribution charge, consumer subsidies, universal charge, and government taxes. The current "lifeline
rate" or socialized pricing mechanism and the universal charge for "missionary electrification” were also
schemes introduced by the EPIRA.
2.2.5 Retail electricity supply
The EPIRA also laid down the framework for the formation of the retail supply sector. Under the retail
competition and open access (RCOA) of distribution wires, eligible consumers have the liberty to
contract their supply of electricity among authorized suppliers, rather than through the franchised
distribution utility. For the initial implementation, Section 31 of the EPIRA provides that end-users that
consume a monthly average of at least 1 megawatt for the preceding 12 months of the effectivity of the
law shall be part of the contestable market. Two years after the implementation, the threshold level
shall be lowered to 750 kilowatts as stated in the EPIRA-IRR. EPIRA stipulates that the ERC shall conduct
evaluations every year after that with the aim of lowering the threshold until it reaches the household
demand level.
To fully comprehend the RCOA regime, an introduction of the terms and the industry platers is in order.8
The ‘contestable market’ refers to the end-users who are given the choice to select their supplier, as
determined by the ERC. The ‘contestable customer’ is an entity that is part of the contestable market.
6 Section 2.5.1 of the Revised Transmission Wheeling Rates Guidelines. 7 NGCP Issues Paper for the 4th Regulatory Period. 8 See DOE Department Circular No. 2012-05-005 and Department Circular No. 2012-11-0010.

20
On the other hand, there are also ‘directly connected customers’ which refer to industrial or bulk
electricity customers which are directly supplied by a generation company. The ‘supplier’ or a ‘retail
electricity supplier’ herein is the any person or entity authorized by ERC to sell, broker, market or
aggregate electricity. This is different from a ‘local retail electricity supplier’ is the DU, but refers to the
non-regulated business segment catering to the contestable market in its respective franchise area.
Local retail electricity suppliers are not required by the ERC to obtain a license for its provision of supply
services. Should a contestable customer fail to secure a supplier, the ‘supplier of last resort’ is
designated to serve the demand of the contestable customer based on the rules set by ERC. Technically,
the DUs are considered as the supplier of last resort. Should the DU is not able to accommodate the
demand, the ERC shall designate a neighboring DU to serve as the supplier of last resort. There are also
‘retail metering services provider’ in the market which provides metering services to the contestable
customers. Finally, ‘aggregators’ refer to any person or entity engaged in consolidating demand for the
purpose of purchasing or reselling on a group basis. The aggregators become active in the retail market
in 2016 when aggregators can compete with suppliers for contestable customer with an average
monthly demand of 750 kW to 999 kW.
On June 6, 2011, by virtue Resolution No. 10, Series of 2011, the ERC has certified that all the
preconditions necessary for RCOA are already in place9. Further, DOE Department Circular No. 2012-02-
0002 has designated the PEMC as the Central Registration Body. The CRB is tasked to oversee the
development and management of RCOA as a market. Included in the tasks of the CRB: i) review of
WESM rules and manuals; ii) development of market infrastructure, systems and processes; iii) conduct
of training for market participants; iv) comply with DOE directives; and v) coordinate with stakeholders
and government agencies. The CRB remains under the supervision of the DOE. Since then, the ERC, DOE
and industry stakeholders (inputs gathered through public consultations) have been working on
hammering out the framework for the implementation of RCOA. Relevant policy issuances which
provided for the rules and framework under which RCOA operates are summarized below. The
commercial operation of RCOA, starting with those with a monthly average consumption of at least 1
megawatt, officially commenced on June 26, 2013.
Table 2. Summary of Relevant Policy Issuances for the Implementation of RCOA
Date Policy Issuance Title
24-Feb-12 DOE Department Circular
No. 2012-02-0002 Designating the Philippine Electricity Market Corporation (PEMC) as the Central Registration Body (CRB)
9-May-12 DOE Department Circular
No. DC 2012-05-005 Prescribing the General Policies for the Implementation of the Retail Competition and Open Access
9 Section 31 of the EPIRA laid out five (5) preconditions that should be met before RCOA implementation:
a) Establishment of the wholesale electricity spot market;
b) Approval of unbundled transmission and distribution wheeling charges;
c) Initial implementation of the cross subsidy removal scheme;
d) Privatization of at least seventy (70%) percent of the total capacity of generating assets of NPC in Luzon
and Visayas; and
e) Transfer of the management and control of at least seventy percent (70%) of the total energy output of
power plants under contract with NPC to the IPP Administrators.

21
Date Policy Issuance Title
29-Nov-12 DOE Department Circular
No. DC 2012-11-0010
Providing for Additional Guidelines and Implementing Policies for Retail Competition and Open Access and Amending Department Circular No. (DC) 2012-05-0005
17-Dec-12 ERC Resolution No. 16,
series of 2012 Resolution Adopting the Transitory Rules for the Implementation of RCOA
9-Jan-13 DOE Department Circular
No. 2013-01-0002
Promulgating the Retail Rules for the integration of Retail Competition and Open Access in the Wholesale Electricity Spot Market
28-May-13 Joint Statement on the
Implementation of RCOA DOE and ERC On the Implementation of Retail Competition and Open Access
9-Jul-13 DOE Department Circular
No. 2013-07-0014
Promulgating the Retail Market Manuals for the Implementation of RCOA and Providing for Transitory Arrangements
19-Jun-15 DOE Department Circular
No. 2013-06-0010 Providing Policies for the Full Implementation of RCOA in the Electric Power Industry
Source: DOE and ERC
On June 19, 2015, the DOE has provided for the full implementation of RCOA by virtue of Department
Circular No. 2015-06-0010. In its initial implementation, the DOE has allowed eligible contestable
customers to remain with their respective DUs as the transition to RCOA continues. However, full
implementation of RCOA means that this interim period is only until June 25, 2016. By June 26, 2016,
mandatory contestability shall be enforced on all eligible members of the contestable market. This
means contestable customers are mandated to secure a retail supply contract with a supplier, a
generator, or a prospective generation company. As per PEMC’s data, only 40% of the projected
contestable customers have registered with the PEMC.
Another relevant provision in the same circular is the expansion of contestability. Starting June 26, 2016,
users with an average monthly demand of 750 kW to 999 kW for the preceding 12-month period are
now part of the contestable market and should secure their respective retail supply contracts. In this
segment of the contestable market, retail aggregators are allowed to compete with suppliers,
generation companies or prospective generators. Contestable customers sharing a contiguous area may
contact an ERC-licensed aggregator as long as the pooled demand shall not be lower than 750 kW.
Section 2 (d) of the same circular stated that the ERC shall promulgate guidelines for retail aggregation
before its implementation. The department circular also provides that, subject to ERC’s evaluation of the
retail market’s performance, those with an average demand of 501 kW to 749 kW shall be allowed to
choose their suppliers effective June 26, 2018.
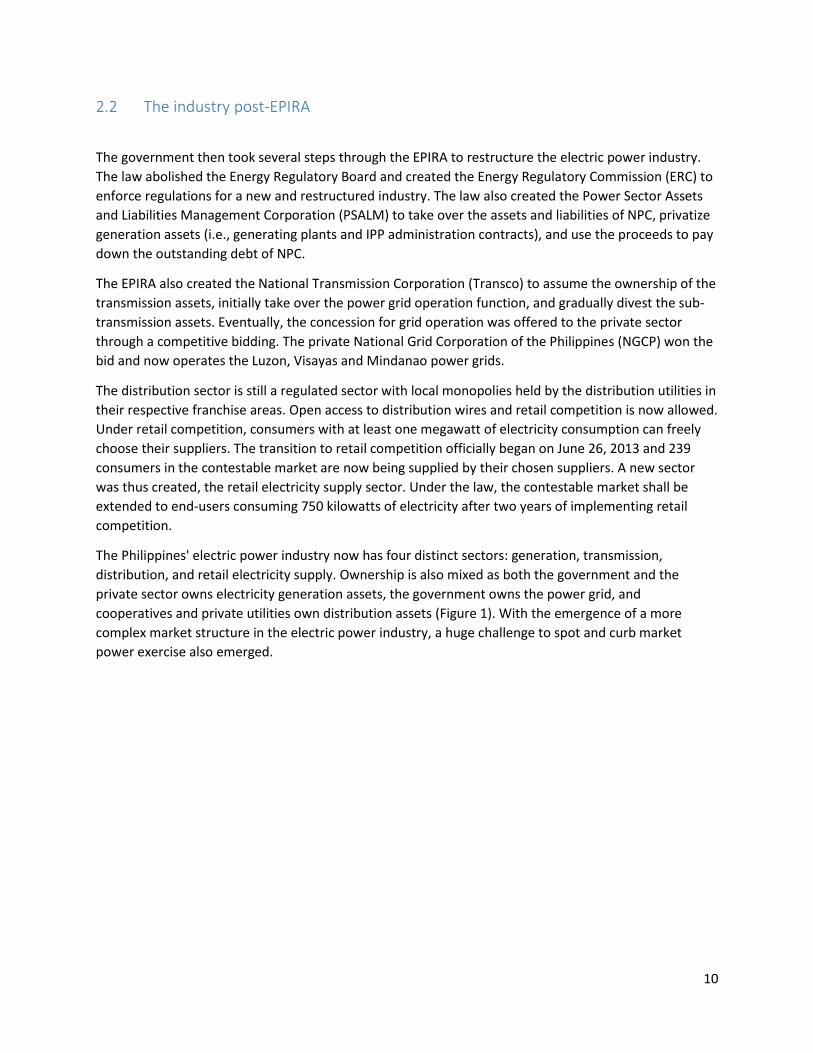
In terms of the players in the market, the CRB has registered 435 total participants or equivalent to 40%
of the prospective players as identified by the ERC. In 2014, the RCOA regime only had 275
participants10. Currently, there are 377 contestable customers, 12 local retail suppliers, 16 retail
10 Philippine News Agency. (2015). ‘Number of WESM retail participants surges from a year ago’. Accessed November 12, 2015 from http://goo.gl/k57xlv.
22
electricity supplier, 24 retail metering service provider and 6 registered suppliers of last resort. This
number continues to grow as the CRB continues processing applications for entry into the market. Table
3 details the market structure, in comparison to the projected number of players; while Table 4 shows
the number of pending applications.
Table 3. Summary of RCOA Registration
Participants Prospective based
on ERC Dataa Registeredb Percentage
Contestable Customer 970 377 39%
Local Retail Electricity Supplier 23 12 52%
Retail Electricity Supplier 18 16 89%
Retail Metering Service Provider 39 24 62%
Supplier of Last Resort 27 6 22%
Grand Total 1,077 435 40%
Notes: a Data from the 26th EPIRA Status Report b Number of participants are from the PEMC Participant List, last updated October 2015
Source: PEMC
Table 4. Summary of RCOA Applications
Participants Applications
Contestable Customer 15 Local Retail Electricity Supplier 2
Retail Electricity Supplier 4
Retail Metering Service Provider 5
Supplier of Last Resort 3
Grand Total 29 Source: PEMC

23
3. Post-EPIRA impacts
Fourteen years after the EPIRA and nine years after the introduction of a competitive electricity spot
market, we analyze what happened to the indicators of price affordability, supply reliability and system
loss reduction (as a measure of production efficiency). Data for this analysis are not readily available in
the public domain but the PIDS research team exhausted every means possible in getting such data from
energy sector stakeholders and other entities.
3.1 Price affordability
Trends on the system rate
We tried to construct a time series of price data and found it very challenging for various reasons. The
NEA averaging of system rates uses simple average of the rates of ECs and DUs, not weighted by MW
sold by EC or DU. There is also no information on MW sold and therefore we cannot reconstruct a more
correct way of getting the average price per kWh. Not all years have complete data set—for instance, of
the 12 private DUs in Luzon in 2007, only three DUs have price data. Monthly volatility calculations using
the system rates cannot be done because the monthly price data of NEA began only in 2011 and the
data from 1990 to 2010 are annual price data. There was no 2014 data for private DUs except the
December average rate; we therefore used the December 2014 price data as proxy for the whole year.
Table 5. Average System Rates (PHP/kWh), 1990-2014
Electric Cooperatives
Private Distribution Utilities
National Average
1990 2.18 1.81 1.99 1991 2.86 2.28 2.57 1992 3.13 2.40 2.76 1993 3.36 2.59 2.98 1994 3.48 2.81 3.14 1995 3.53 2.84 3.19 1996 3.65 3.01 3.33 1997 3.82 3.23 3.52 1998 4.15 3.59 3.87 1999 4.29 3.59 3.94 2000 4.58 4.07 4.32 2001 5.24 3.94 4.59 2002 5.23 4.49 4.86 2003 4.67 4.44 4.55 2004 5.12 4.77 4.95 2005 6.16 5.65 5.90

24
Electric Cooperatives
Private Distribution Utilities
National Average
2006 6.90 6.02 6.46 2007 6.99 5.91 6.45 2008 6.68 6.16 6.42 2009 6.86 6.57 6.72 2010 7.59 7.05 7.32 2011 8.03 8.21 8.12 2012 8.67 8.77 8.72 2013 8.81 8.42 8.62 2014* 9.16 8.28 8.72
Note: *For year 2014, the available figure for private distribution utilities is the average rate for
December only and this is used as proxy for the annual private DU rate. Electric cooperatives have
complete data for 2014.
Source: NEA for ECs; DOE for the others
Figure 3. Average system rates per type of utility, in nominal terms
-
1.00
2.00
3.00
4.00
5.00
6.00
7.00
8.00
9.00
10.00
19
90
19
91
19
92
19
93
19
94
19
95
19
96
19
97
19
98
19
99
20
00
20
01
20
02
20
03
20
04
20
05
20
06
20
07
20
08
20
09
20
10
20
11
20
12
20
13
20
14
PH
P/k
Wh
Electric Cooperatives Private DUs National Average

25
We compute below the system rate in real terms. The consumer price index (CPI) used in converting
nominal figures to real figures has 2006 as base year. Since the rebased CPI time series of the Philippine
Statistics Authority starts at 1994, the 1990-1993 real prices cannot be computed.
Table 6. National average system rate in nominal and real terms, 1994-2014
System rate in nominal terms
System rate in real terms
CPI (2006=100)
1994 3.14 6.19 50.7
1995 3.19 5.89 54.1
1996 3.33 5.68 58.6
1997 3.52 5.68 62.0
1998 3.87 5.71 67.8
1999 3.94 5.48 71.9
2000 4.32 5.64 76.7
2001 4.59 5.68 80.8
2002 4.86 5.85 83.0
2003 4.55 5.36 84.9
2004 4.95 5.56 89.0
2005 5.90 6.23 94.8
2006 6.46 6.46 100.0
2007 6.45 6.27 102.9
2008 6.42 5.76 111.4
2009 6.72 5.78 116.1
2010 7.32 6.07 120.5
2011 8.12 6.44 126.1
2012 8.72 6.70 130.1
2013 8.62 6.43 134.0
2014* 8.72 6.25 139.5
Note: *For year 2014, the available figure for private distribution utilities is the average rate for
December only and this is used as proxy for the annual private DU rate. Electric cooperatives have
complete data for 2014.
Source: NEA for ECs; DOE for the others

26
Figure 4. Nominal and real prices of electricity
It is also worth recalling that pre-EPIRA, electricity price in the Philippines was high relative to other
countries (Table 7).
Table 7. Retail Electricity Tariffs across Selected Asian Countries (June 1998)
Utility Residential Tariffs Industrial Tariff
Perusahan Listrik Negara, Indonesia 0.63 0.66
Korea Electric Power Corp., Korea 4.83 1.95
Metropolitan Electricity Authority, Thailand 5.54 2.24
Tenaga Nasional Berhad, Malaysia 5.92 2.39
Taiwan Power, Taiwan 6.46 2.41
Singapore Power, Singapore 6.96 2.84
Manila Electric Company, The Philippines 9.51 3.84
China Light & Power, Hong Kong 11.46 4.63
Kansai Electric, Japan 12.18 4.92
The peso exchange rate against the dollar in June 1998 was P49.39 to $1
Source: Velasco, M. (2005) as cited in Woodhouse (2005).
0.0
1.0
2.0
3.0
4.0
5.0
6.0
7.0
8.0
9.0
10.0
19
94
19
95
19
96
19
97
19
98
199
9
20
00
20
01
20
02
20
03
20
04
20
05
20
06
20
07
20
08
20
09
201
0
20
11
20
12
20
13
20
14
PH
P/k
Wh
Real price of electricity Nominal price of electricity

27
The national average system rate in nominal terms is essentially the nominal price of electricity in the
country on the average, and the national average system rate in real terms is essentially the real price of
electricity in the country on the average. The nominal price of electricity is the value of electricity in
terms of money whereas the real price of electricity is its value in terms of the bundle of goods and
services in the CPI basket. If we see an increasing trend in the real price of electricity, then it is rising
more quickly than the general price level. If we see a downtrend, then it is rising more slowly.
Unfortunately, the time series is too short to yield a meaningful regression result for pre-EPIRA and
post-EPIRA years. Thus, we rely on calculation of averages.
Figure 4 above shows that:
the electricity price rose more slowly than the general price level during the pre-EPIRA years
(1994-2000)
the electricity price rose relatively more quickly during the transition toward the establishment
of a competitive wholesale market for electricity (2001-2005), and
an ambiguous pattern from the time the WESM was introduced up to 2014.
Calculating the average annual growth of the real prices clears up the ambiguity:
1994-2000 -1.55% average annual growth rate (AAGR)
a downtrend during the pre-EPIRA years
2001-2005 2.34% AAGR an uptrend during the transition
2006-2014 -0.40% AAGR a downtrend after the establishment of the WESM
If we are to exclude the 2014 data (given that the 2014 private DU component of the system rate is
incomplete), we also get a downtrend albeit at a slower rate.
2006-2013 -0.06% AAGR a downtrend after the establishment of the WESM
Why was the real price of electricity on a downtrend in 1994-2000? It will be hard to argue that such is
due to NPC’s productivity because it was during this time that the financial problems and eventual
bankruptcy of the NPC was eating up what little fiscal space the national government then had. Note,
however, that the 1994-2000 period covers the Asian financial crisis period and the average annual
inflation then was 7.14 percent. Thus, the more correct way of viewing the pattern is that the general
price level, that is, the representative price of all goods, was rising more quickly than that of electricity in
1994-2000. Moreover, Woodhouse (2005) explained that once the power crisis abated11 and the
government had learned from its early IPP experiences, prices fell again—the average postpower crisis
IPP was 12% less expensive in terms of cost/kWh than its predecessors, a result of both a more
competitive bidding environment and a shift away from expensive fuel.
11 It was generally agreed that the power crisis has been resolved by 1994.

28
What could explain the uptrend during the transition toward the establishment of the WESM or the
start of competition in the generation sector? With the benefit of hindsight, we can surmise that one of
the reasons is the oil price crises of the 2000s. It could also be partly due to generation rate adjustments
after the large-scale privatization of NPC's generating assets, resulting in electricity price increases that
were faster than the general price inflation. What is clear is that the 2001-2005 period involved
transition pains.
What could explain the downtrend after the establishment of the WESM? Given the problem of
attribution, one should not be easily tempted to attribute this alone to EPIRA gains and conclude that
competition is indeed working. We must nevertheless grant that it could be one among many possible
reasons. Another possible reason is the drastic fall in the price of oil from 2008 onwards, which could
have lowered the real cost of power generation in the country. Moreover, although the CPI average
inflation is already low during the period (4.25% annual average inflation from 2006-2014), the rate of
increase of the prices of other commodities in the CPI basket could have been higher than that of the
price of electricity.
Overall, although we have observed a slight downtrend in the real price of electricity after the
introduction of competition in the spot market, we conclude that the price of electricity remains high
and it has not declined to pre-EPIRA levels. However, we reiterate that the desired outcome expressed
in the declaration of principles of the EPIRA is not necessarily price declines but price affordability.
Changes in price volatility
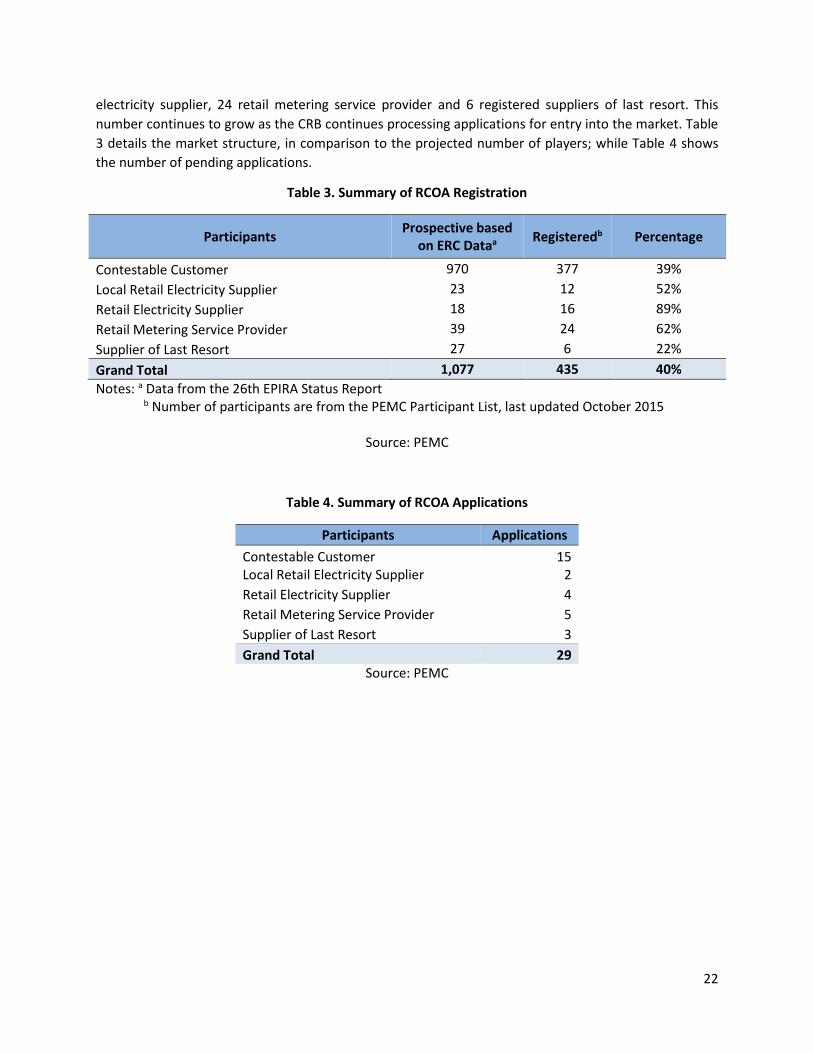
Price variation over the long term is shown in Figure 5 below. The trend on annual inflation of nominal
system rates shows the high-inflation environment of the early 1990s, when no new capacity was built
to replace the mothballed nuclear power plant. Rolling brownouts in many parts of the country were
experienced at the time. The post-EPIRA years show both inflation and deflation (negative inflation).
29
Figure 5. Annual inflation of nominal system rates
The volatility of prices is its variation over a period of time, and a volatility indicator tells us how
turbulent the price is during a given time period. Calculating standard deviation is one way of estimating
volatility and we apply it here. We use the time-series data on the price index of the representative
electricity price in the component "Housing, Water, Electricity, Gas, and Other Fuels" of the Philippine
CPI. 12 The time series does not indicate which of the 146 distribution utilities around the country are
considered representative. But it is likely that the representative utility or utilities in the price index are
large utilities and representing large segments of end-users; therefore, it can be surmised that they are
significant buyers of electricity in the WESM and are affected by spot volatility.
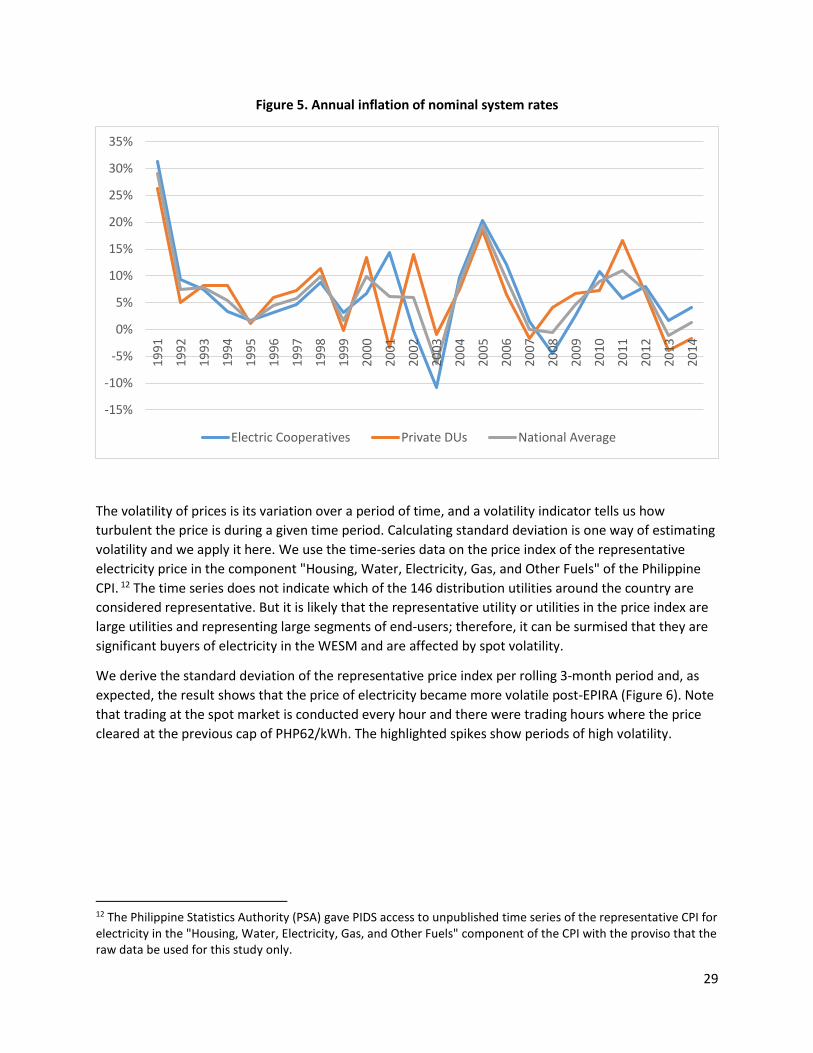
We derive the standard deviation of the representative price index per rolling 3-month period and, as
expected, the result shows that the price of electricity became more volatile post-EPIRA (Figure 6). Note
that trading at the spot market is conducted every hour and there were trading hours where the price
cleared at the previous cap of PHP62/kWh. The highlighted spikes show periods of high volatility.
12 The Philippine Statistics Authority (PSA) gave PIDS access to unpublished time series of the representative CPI for electricity in the "Housing, Water, Electricity, Gas, and Other Fuels" component of the CPI with the proviso that the raw data be used for this study only.
-15%
-10%
-5%
0%
5%
10%
15%
20%
25%
30%
35%1
99
1
19
92
19
93
1994
19
95
19
96
19
97
1998
19
99
20
00
20
01
2002
20
03
20
04
20
05
2006
20
07
20
08
20
09
20
10
20
11
20
12
20
13
20
14
Electric Cooperatives Private DUs National Average
30
Figure 6. Volatility of Representative Electricity Price, January 1994 - October 2015
What attracts attention by the public and policymakers is not what happened in the long term but what
is occurring in the short term. For instance, the late 2013 price spikes in the WESM which led to a
sudden upsurge in Meralco rates affected more than 70% of the Luzon consumers and the spikes
became very controversial.
Consumers and businesses naturally desire price stability as large swings in prices could, at the least,
complicate their planning for expenditures and, at worst, result in financial losses. The EPIRA, however,
did not categorically promise price stability and the debates then on the proposed EPIRA recognized that
there will be price volatility in the spot market for electricity. Nevertheless, policymakers must look at
ways to curb sudden price spikes. One current measure that is being looked at is to permanently reduce
the PHP62/kWh bid cap in the WESM. Another measure is to re-design the market in such a way that
incentives to exercise market power are minimized.

31
Trends in the components of electricity price
Among the price components, universal charges (23.5%) and government taxes (19.25) account for the
highest rate of increase since 2004. This is followed by generation charge which increases annually at a
rate of 4.6% over the past decade. Another data worth noting is the decrease in system loss charges
billed to the consumers. This improved efficiency by Meralco has resulted to the -0.3% decrease in the
system loss price. In total, the Meralco rates have an average increase of 4.7% over the same period.
Table 8. Growth Rates of MERALCO Rate Components (All Customer Groups), 2004-2014
2004 2014*
Average Annual Growth Rate
Generation 3.458 5.425 4.6%
Transmission 0.863 0.942 0.9%
System Loss 0.467 0.451 -0.3%
Distribution 1.111 1.628 3.9%
Subsidies -0.025 0.001 - Universal Charge 0.040 0.328 23.5%
Gov't Taxes 0.138 0.794 19.2%
TOTAL 6.050 9.568 4.7%
Note: Annual average rates for all customer group. *2014 is Year-to-Date annual average, as of October 2014.
Source: Meralco
Table 9. Growth Rate of ECs’ Rate Components (Residential only), 2008-2013
2008 2013 AAGR
Generation 2.92 4.88 11%
Transmission 1.12 1.18 1%
System Loss 0.62 0.86 7%
Distribution* 1.73 1.73 0%
RSFC - 0.37 -
Subsidies and other charges**
0.02 -0.09 -240%
Government Charges*** 0.53 0.96 12%
Total 6.94 9.89 7%
Notes: * includes Distribution, Metering and Supply ** includes Lifeline and Inter-class cross subsidies *** includes Universal Charges, VAT, and other taxes
32
The large negative figure for subsidies and other charges may have been due to the EPIRA-mandated removal of cross-subsidies. Although universal charges are not a tax, the NEA lump these together with government taxes. No separate EC figures distinguishing universal charges from government taxes are found from the NEA data. RSFC stands for Reinvestment Fund for Sustainable Capital Expenditure
Source: National Electrification Administration
For the electric cooperatives, data available is only for the residential customers. As with the Meralco-
franchise area, regions served by electric cooperative experienced an average annual increase of 12% in
government charges for the period of end-year 2008 to end-year 2013. Government charges include
universal charges, VAT, and other taxes. This is followed by the generation charge which has the average
annual growth rate of 11%. However, unlike Meralco, the electric cooperatives have an increase in
system loss charge. This is pegged at 7% over the same period of time.
3.2 Supply reliability
One of the objectives of the EPIRA is to have a secure and reliable power supply in the country. This
means that the supply of electricity must always meet the demand of the consumers to ensure
continuous access to electricity. However, electricity is a good that have some unique characteristics.
For one, it cannot be stored like other produced goods, thus the need to balance the supply and the
demand at all times is critical. Otherwise, when supply shortage occurs, rotating brownouts and outages
are experienced by the end-users.
To fully comprehend the intricacies of the supply and demand dynamics of the electricity sector, the
supply aspect (in terms of capacities in the grid) and the demand aspect (in terms of peak demand and
reserve margin) must be introduced.
The installed capacity refers to the maximum capacity of the generating plants which are connected to
the grid. It is important to distinguish what is installed from what is dependable in terms of power
supply. The dependable capacity refers to the capacity that is left when taking into account ambient
limitations for a time period such as a month or a season. This includes factors such as efficiency ratios
and the temperature. Essentially, dependable capacity is lower than the installed capacity to take into
account these adjustments that the power plants need to continuously run. Finally, the available
capacity refers to what is actually injected or dispatched into the grid. Available capacities may be lower
than the dependable capacity due to equipment limitations such as unforced outages, or scheduled
maintenance of the generation facilities.
As earlier stated, the capacity in the grid needs to be able to meet the demand to ensure that electricity
is served to end-users in a reliable manner. In this case, it is not only the peak demand that needs to be
met, but also the required reserve margin. The required reserve margin refers to the allowance over the

33
peak demand to ensure the integrity of the grin and avoid power interruptions13. To examine the trends
of supply reliability in the post-EPIRA market structure, we discuss below the supply demand situation in
the past ten years.
For Luzon, the demand has been increasing at a faster rate than the supply over the past ten years. The
average annual growth rate of the peak demand is at 3.35%; while available capacity has been
increasing by only 0.84%. In terms of installed and dependable capacity, the average annual growth over
the last ten years has been 0.96% and 1.03% respectively. Given that the peak demand and the
corresponding reserve margin needed is rising at a greater rate, there is a need to ensure that new
power plants are constructed to help ensure supply in the coming years.
Outages, forced and unforced, must also be constantly monitored to avoid load curtailment in the grid.
In 2013 for example, there were a multitude of breakdowns in the generation facilities. In May that year,
a cascading outage involving five power plants resulting in approximately 3,700 MW of electricity to
come offline. The outages included Calaca Units 1 and 2 (2 x 300 MW), Ilijan Block 1 (3 x 204 MW), San
Lorenzo module 50 and 60 (2 x 265 MW), Sta Rita module 10 to 40 (4 x 265 MW), Sual Unit 1 (647 MW).
Further, GNPower Units 1 and 2 (2 x 325 MW) has several unforced outages since its operation in May
2013 due to high vibrations of tube leaks. The Pagbilao Unit 2 was also offline from 31 August to 13
November 2013; while San Lorenzo Unit 2 (265 MW) had transformer trouble and was offline from May
2013 to May 2014. Figure 7 below shows the demand supply situation in the Luzon grid from 2005-2014.
13 For Luzon and Visayas, the ERC-approved required reserve margin above peak demand is 23.4% –
composed of 2.8% Load Following and Frequency Regulation, 10.3% Spinning Reserve, 10.3% Back-Up.
As for Mindanao, the ERC-approved required reserve margin above peak demand is 21% -- composed of
(2.8% Load Following and Frequency Regulation, 9.1% Spinning Reserve, 9.1% Back-Up.

34
Figure 7. Supply Reliability in the Luzon Grid, 2005-2014
Source: Department of Energy and National Grid Corporation of the Philippines Note: The ERC-approved reserve margin for Luzon and Visayas is 23.4%.
For the Visayas grid, the same trend can be observed in terms of the peak demand outgrowing the
available capacity. For the previous ten years, peak demand was increasing at an average of 6.02%
annually. On the other hand, the available capacity was increasing at rate of 5.24%. The installed
capacity was increasing at a rate of 3.85% annually, while the dependable capacity had an average
annual increase of 4.08% in the last decade.
In 2009, the required reserve margin was more than the dependable capacity which led to rotating
brownouts in Cebu and other areas in the region. However, this was addressed in 2010 with
approximately 590 MW of power plants coming online. Coal fire plants by Cebu Energy Development
Corporation (3 x 82 MW), Panay Energy Development Corporation (2 x 72 MW) and KEPCO-Salcon (2 x
100) were commissioned. Despite this development however, brownouts were still experienced in 2010
as the available capacity were below the peak demand. This was due to maintenance works to the Panay
Diesel Plant and power barges 102 and 103. Figure 8 below shows the demand supply situation in the
Visayas grid from 2005-2014.
-
2,000
4,000
6,000
8,000
10,000
12,000
14,000
2005 2006 2007 2008 2009 2010 2011 2012 2013 2014
In M
w
Installed Capacity Dependable Capacity
Available Capacity Peak Demand
Peak Demand + Reserve Requirement

35
Figure 8. Supply Reliability in the Visayas Grid, 2005-2014
Note: The ERC-approved reserve margin for Luzon and Visayas is 23.4%. Source: Department of Energy and National Grid Corporation of the Philippines
As for the Mindanao grid, the supply has been tight since 2009 where the required margin is over
available capacity by 195 MW. Rotating brownouts has been experienced especially during summer
times and dry season where water levels in hydropower plants such as the Agus and Pulangi
hydropower compelxes are affected. These fluctuations in capacity have not been able to meet the
steady growth of demand in Mindanao. For the last decade, the peak demand is increasing at average
annual rate of 2.77%. Meanwhile, the available capacity only has an average growth rate of 1.12%.
Although installed capacity is growing at an average of 2.97% annually, dependable capacity average
annual growth (2.42%) is still lower than the peak demand average annual growth.
Since 2009, the required reserve margin the Mindanao has not been met by the available capacity. What
is more alarming is that since 2010, the available capacity has been almost equal with the peak demand,
not to mention the required reserves. Thus, the Department of Energy has implemented initiatives such
as the Interruptible Load Program to curtail such crisis. Figure 9 below shows the demand supply
situation in the Mindanao grid from 2005-2014.
-
500
1,000
1,500
2,000
2,500
3,000
2005 2006 2007 2008 2009 2010 2011 2012 2013 2014
In M
w
Installed Capacity Dependable Capacity
Available Capacity Peak Demand
Peak Demand + Reserve Requirement
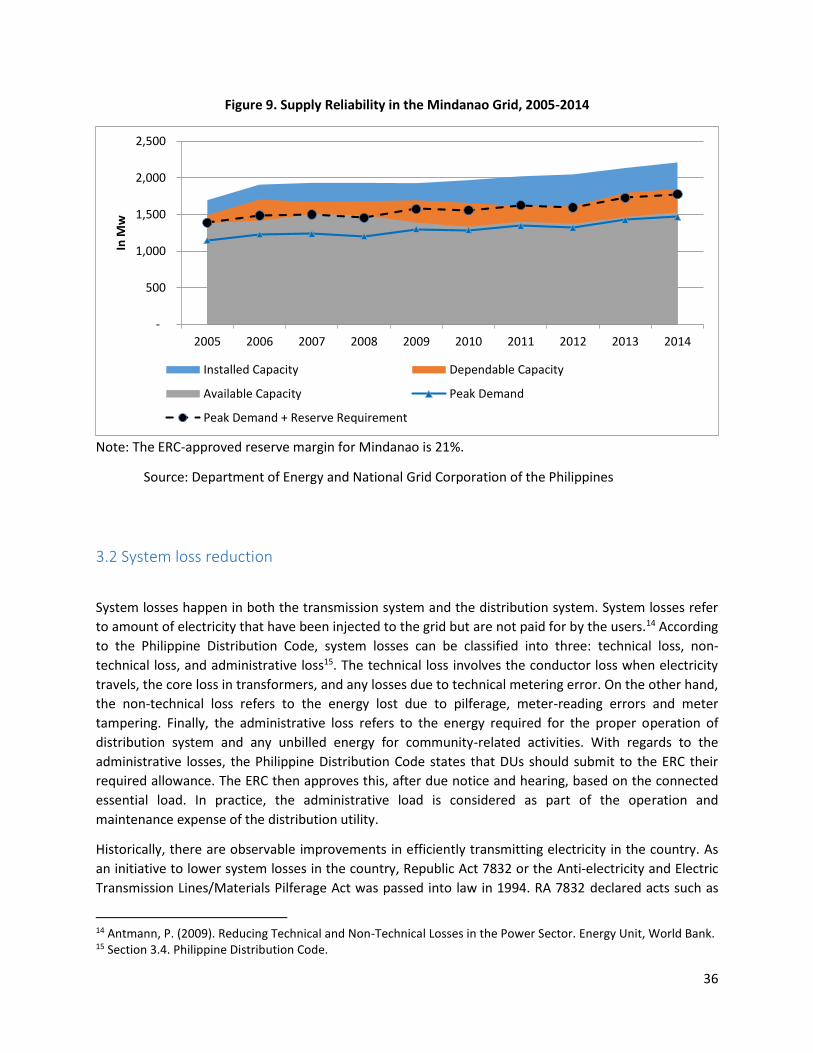
36
Figure 9. Supply Reliability in the Mindanao Grid, 2005-2014
Note: The ERC-approved reserve margin for Mindanao is 21%.
Source: Department of Energy and National Grid Corporation of the Philippines
3.2 System loss reduction
System losses happen in both the transmission system and the distribution system. System losses refer
to amount of electricity that have been injected to the grid but are not paid for by the users.14 According
to the Philippine Distribution Code, system losses can be classified into three: technical loss, non-
technical loss, and administrative loss15. The technical loss involves the conductor loss when electricity
travels, the core loss in transformers, and any losses due to technical metering error. On the other hand,
the non-technical loss refers to the energy lost due to pilferage, meter-reading errors and meter
tampering. Finally, the administrative loss refers to the energy required for the proper operation of
distribution system and any unbilled energy for community-related activities. With regards to the
administrative losses, the Philippine Distribution Code states that DUs should submit to the ERC their
required allowance. The ERC then approves this, after due notice and hearing, based on the connected
essential load. In practice, the administrative load is considered as part of the operation and
maintenance expense of the distribution utility.
Historically, there are observable improvements in efficiently transmitting electricity in the country. As
an initiative to lower system losses in the country, Republic Act 7832 or the Anti-electricity and Electric
Transmission Lines/Materials Pilferage Act was passed into law in 1994. RA 7832 declared acts such as
14 Antmann, P. (2009). Reducing Technical and Non-Technical Losses in the Power Sector. Energy Unit, World Bank. 15 Section 3.4. Philippine Distribution Code.
-
500
1,000
1,500
2,000
2,500
2005 2006 2007 2008 2009 2010 2011 2012 2013 2014
In M
w
Installed Capacity Dependable Capacity
Available Capacity Peak Demand
Peak Demand + Reserve Requirement
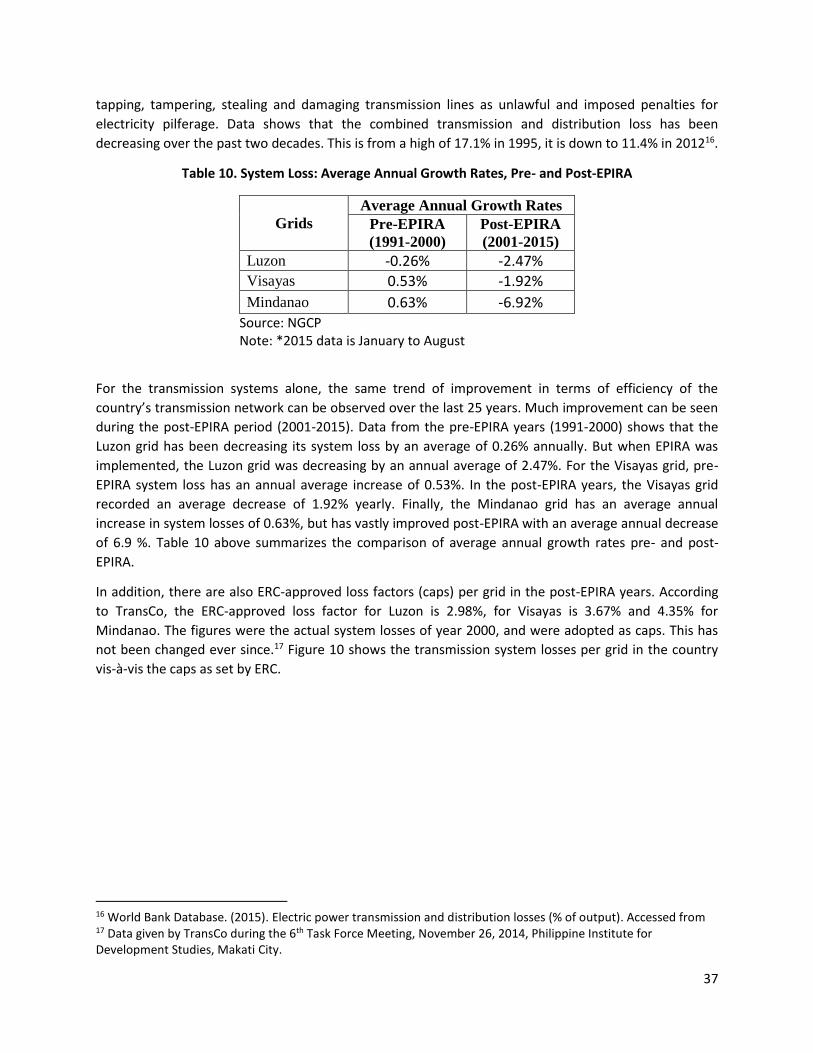
37
tapping, tampering, stealing and damaging transmission lines as unlawful and imposed penalties for
electricity pilferage. Data shows that the combined transmission and distribution loss has been
decreasing over the past two decades. This is from a high of 17.1% in 1995, it is down to 11.4% in 201216.
Table 10. System Loss: Average Annual Growth Rates, Pre- and Post-EPIRA
Grids
Average Annual Growth Rates
Pre-EPIRA
(1991-2000)
Post-EPIRA
(2001-2015)
Luzon -0.26% -2.47% Visayas 0.53% -1.92%
Mindanao 0.63% -6.92% Source: NGCP Note: *2015 data is January to August
For the transmission systems alone, the same trend of improvement in terms of efficiency of the
country’s transmission network can be observed over the last 25 years. Much improvement can be seen
during the post-EPIRA period (2001-2015). Data from the pre-EPIRA years (1991-2000) shows that the
Luzon grid has been decreasing its system loss by an average of 0.26% annually. But when EPIRA was
implemented, the Luzon grid was decreasing by an annual average of 2.47%. For the Visayas grid, pre-
EPIRA system loss has an annual average increase of 0.53%. In the post-EPIRA years, the Visayas grid
recorded an average decrease of 1.92% yearly. Finally, the Mindanao grid has an average annual
increase in system losses of 0.63%, but has vastly improved post-EPIRA with an average annual decrease
of 6.9 %. Table 10 above summarizes the comparison of average annual growth rates pre- and post-
EPIRA.
In addition, there are also ERC-approved loss factors (caps) per grid in the post-EPIRA years. According
to TransCo, the ERC-approved loss factor for Luzon is 2.98%, for Visayas is 3.67% and 4.35% for
Mindanao. The figures were the actual system losses of year 2000, and were adopted as caps. This has
not been changed ever since.17 Figure 10 shows the transmission system losses per grid in the country
vis-à-vis the caps as set by ERC.
16 World Bank Database. (2015). Electric power transmission and distribution losses (% of output). Accessed from 17 Data given by TransCo during the 6th Task Force Meeting, November 26, 2014, Philippine Institute for Development Studies, Makati City.

38
Figure 10. Transmission System Loss vs. ERC caps, per Grid, 2001-2015
Source: NGCP Note: * 2015 data cover January to August
As the figures would show, over the last five years, there is a considerable improvement in minimizing
the system loss across the grids. The losses are below the ERC-approved loss factors. As for the
performance of NGCP as the transmission concessionaire, the system losses has also shown a decreasing
trend since 2009. Luzon grid has an average annual decrease of 4.09%, while Visayas grid has an average
annual decrease of 1.99%. Mindanao has seen the greatest improvement since 2009 as it has been able
to decrease system losses by an average or 6.92% yearly. According to NGCP, this can be attributed to
the investments they have made over the years, and better metering systems they have installed to
better capture the input and outputs of the grid.
For the distribution system loss, RA 7832 also established a cap on the recoverable rate of system loss.
The cap for private distribution utilities was set at 9.5% at the end of the fourth year following the act,
0.00
0.50
1.00
1.50
2.00
2.50
3.00
3.50
4.00
4.50
5.002
00
1
20
02
20
03
20
04
20
05
20
06
20
07
20
08
20
09
20
10
20
11
20
12
20
13
20
14
20
15
Pe
rce
nt
Luzon ERC-Approved Loss Factor
0.00
1.00
2.00
3.00
4.00
5.00
6.00
20
01
20
02
20
03
20
04
20
05
20
06
20
07
20
08
20
09
20
10
20
11
20
12
20
13
20
14
20
15
Pe
rce
nt
Visayas ERC-Approved Loss Factor
0.00
1.00
2.00
3.00
4.00
5.00
6.00
20
01
20
02
20
03
20
04
20
05
20
06
20
07
20
08
20
09
20
10
20
11
20
12
20
13
20
14
20
15
Pe
rce
nt
Mindanao ERC-Approved Loss Factor

39
while the cap for electric cooperatives was at 14%. The system loss cap was further lowered by virtue of
ERC Resolution No. 17, Series of 2008. Under the revised caps, the actual cost of the technical and non-
technical losses shall be passed on by the distribution utilities to the consumers, but shall not exceed
8.5% for private distribution utilities, and 13% for the electric cooperatives. As of 2014, 67.5% of the
electric cooperatives are under the set cap of ERC.
For the distribution system of electric cooperatives, there is also a decreasing trend in terms of system
losses. For the electric cooperatives, it has a record low system loss of 11.61% in 2013. For 2014, this has
slightly increased to 11.67%. In general, the system losses for electric cooperatives has been decreasing
by an annual average of 2.55% over the past two decades. Figure 11 details the historical system losses
of electric cooperatives.
Figure 11. Distribution System Loss of Electric Cooperatives, 1990-2014
Source: NEA
As for the performance of electric cooperatives for 2014, commendable are the electric cooperatives of
Misamis Oriental I (2.71%), Leyte II (3.80%) and Dinagat Island (5.23%) which has the lowest system loss
within their respective franchise areas. Meanwhile, regulatory agencies can help the electric
cooperatives in ARMM improve the distribution of electricity. It is important to highlight that
Maguindanao recorded almost half of their electrical transmission as losses (at 42.92% system loss).
Basilan (31.72%) and Sulu (31.24%) also needs careful attention.
21.7
21.3
20.819.7
19.4
18.2
18.3
17.7
17.3
16.916.0
15.4
15.6
15.2
14.5
14.3
14.3
13.9
13.2
12.6
12.3
11.9
11.8
11.6
11.7
0.00
5.00
10.00
15.00
20.00
25.00
Pe
rce
nt
EC Distribution System Loss

40
Figure 12. Distribution System Loss of MERALCO, 1990-2014
Source: MERALCO
As for MERALCO, the largest private distribution utility in the country, system losses has also shown a
decreasing trend. For 2014, the system loss is also a record low for the company at 6.49%. In the post-
EPIRA period, the system losses in the MERALCO franchise area peaked in 2004. MERALCO has stated
that this can be attributed to the ‘difficulty of times’ brought about by prevailing economic conditions.18
MERALCO believes when the cost of electricity is high, pilferage is also high. In general, MERALCO has
been able to reduce their system losses by an average of 3.6% decrease annually in the post-EPIRA
period. This is an improvement considering in the pre-EPIRA years of 1990, the average annual decrease
is at 4.1%.
On the other hand, in comparison to other ASEAN nations, the Philippines has the 3rd largest
transmission and distribution losses with 11.46% as of 2012. Cambodia and Myanmar are the countries
with the highest losses. On the other hand, Singapore leads the ASEAN countries in efficiency with losses
only at 1.60%. This is followed by Thailand and Brunei Darrusalam with 5.70% and 6.18% respectively.
18 Gatdula, D. ‘Meralco reports jump in system losses to 11.1% in 2004’. Accessed November 15, 2015 from http://goo.gl/7CHqcU.
15.42
14.48
14.8715.59
14.80
13.02
12.15
12.40
11.80
11.60
10.18 10.39
10.85
10.85
11.10
10.21
10.10
9.65
9.28
8.61
7.94
7.357.04
6.92
6.49
0.00
5.00
10.00
15.00
20.00
Pe
rce
nt

41
Figure 13. Transmission and Distribution Losses across ASEAN, 2012
Note: No data available for Lao PDR.
Source: World Bank Database
The data suggests that despite the improvement of system losses in the country in the last two decades,
the Philippines still lags behind most of its ASEAN counterparts in terms of efficiency. The system losses
is also another form of economic loss, especially taking into account the fact that generated power
comes from fuel.19 Investments in improving distribution services of electricity should be pursued. In
terms of non-technical losses such as theft and pilferage, stakeholders state that there is a need to
forcefully implement the RA 7832. Minimizing the technical losses (through investments) and the non-
technical laws (through RA 7832) would certainly help in reducing the cost of electricity in the country.
19 Ibid. 12
1.60
5.70
6.18
6.22
9.11
9.81
11.46
18.27
25.26
0.00 5.00 10.00 15.00 20.00 25.00 30.00
Singapore
Thailand
Brunei Darussalam
Malaysia
Indonesia
Vietnam
Philippines
Cambodia
Myanmar
Percent

42
4. Conclusions
The assessment shows that electricity prices post-EPIRA remain high and although there was a slight
downtrend after the introduction of the WESM, prices were still high relative to pre-EPIRA levels. Supply
reliability is still an ongoing concern but the recent past record shows that shortages were managed and
did not reach nationwide crisis levels reminiscent of the 1990s. Moreover, production efficiency gains
were achieved through the reduction of system losses.
There is a danger that the findings on price trends could provide ammunition to those advocating the
repeal of the EPIRA and re-nationalization of the industry. It must be emphasized, however, that the
country has a long history of private sector-led electric power industry: more than eight decades of
private sector-led generation capacity development (1890-1972), less than one and a half decades of
government monopoly in generation (1972-1987), less than a decade of mixed private and public sector
generation through IPPs and the NPC (1987-2006), and evolving competition with many stakeholders
participating, including end-users (2006-present). Moreover, the nationalization years were marked by
inefficiencies and fiscal problems that were not borne by electricity consumers alone but by the whole
country.
Looking at prices alone can also lead to contradictory results. For instance, in the studies of electricity
market liberalization in Table 11 below, seven out of 12 studies show an increase in household
electricity prices.
Table 11.Cross-country studies on the impact of electricity market liberalization on energy prices
Studies The steps of electricity market liberalization Electricity prices
Households Industrial
Consumers
Steiner (2000)
Wholesale electricity market, unbundling of electricity production from transmission, allowing TPA access to the grid
↑ ↓
Privatization ↑ ↑
Doove et al. (2001) Wholesale electricity market, unbundling of electricity production from transmission, allowing TPA access to the grid
↓ ↓
Zhang et al. (2002) Wholesale electricity market, privatization, independent regulatory agency
- -
Evans, Green (2003) Wholesale electricity market ↑ ↑
Hatori, Tsutsui (2004)
Wholesale electricity market ↓ ↓
Unbundling of electricity production from transmission, TPA access to the grid, privatization
↑ ↑
Retail electricity market ↑ ↓
Roques et al. (2005) Liberalization of electricity markets - -

43
Studies The steps of electricity market liberalization Electricity prices
Households Industrial
Consumers
Joskow (2006) Wholesale electricity markets, retail electricity market
↓ ↓
Hogan, Meade (2007) Unbundling of electricity production from transmission
↑ ↑
Fiorio et al. (2008) Unbundling of electricity production from transmission
↓ ↓
Bushnell et al. (2008) Unbundling of electricity production from transmission
↑ ↑
Yarrow (2008) Liberalization of electricity markets ↓ ↓
Nagayama (2009) Liberalization of electricity market in Eastern Europe
↓ ↓
Source: Transformation in Business & Economics 12:3(30), 2013
It is also important also to look at how well other energy policy targets are being met. Among such
objectives are ensuring reliability of supply and avoiding, or at least minimizing, brownouts, and
reducing system losses. It is also important to take a look back at the situation pre-EPIRA and managing
the fiscal affairs of the government as one more objective.
Finally, we must recognize that the evolution in the governance structure of the industry is still
unfinished. The WESM has to be governed by an independent market operator; the ERC’s regulatory
capacity needs strengthening; and the DOE needs to beef up its planning function. The government
already has its hands full in the developmental role currently reserved for it in the electricity sector:
rural electrification. The government should remain committed to this role while exploring ways to
engage the private sector as partner in innovative mechanisms for rural electrification. (Right now, it has
a framework provided through the mandates of NEA and DOE on rural electrification and it can improve
on that framework.) With respect to the EPIRA, what needs to be done is not to repeal it but to find
ways of improving its implementation. What needs to be amended in the law is also worth examining in
the next Congress.

44
References Aboitiz Power Corporation. 2014. Industry Restructuring Crossroads: The Search for Policy Solutions to
Recurring Hurdles in power Investments. Del Mundo, Rowaldo. 2015. Lessons from the Aggregation and Competitive Selection Process of Electric
Cooperatives in the Philippines. Available at http://www.upecon.org.ph/epdp/wp-content/uploads/2015/08/Del-Mundo-EPDP-Policy-Forum-7Aug2015.pdf (accessed on December 20, 2015).
Department of Budget and Management. 2015. National Expenditure Program for 2016- Budget of
Department of Energy. Available at: https://www.dbm.gov.ph/wpcontent/uploads/NEP2016/DOE/DOE.pdf (accessed on 13 September 2015).
Department of Energy. 2012. Distribution Development Plan 2010-2019. ____________. 2013. Energy Investors’ Guidebook. Available at:
https://www.doe.gov.ph/microsites/ipo%20web/linked%20files/2013/eig13.pd (accessed on 27 August 2015).
____________. 2014a. Final Report of the Task Force to Study Ways to Reduce the Price of Electricity. ____________. 2014b. Energy Sector Accomplishment Report for 2014. Available at:
https://www.doe.gov.ph/doe_files/pdf/Transparency_Seal/Annual%20Report%20-%20Energy%20Sector%20Accomplishment%20Report%202014.pdf (accessed on 02 September 2015).
____________. 2015a. Department Circular No. DC2015-06-0008: Mandating all Distribution Utilities to
Undergo Competitive Selection Process (CSP) in Securing Power Supply Agreements (PSA). ____________. 2015b. 26th Electric Power Industry Reform Act – Implementation Status Report. Dolan, Ronald E. (1991). "Energy" in Philippines: A Country Study (Area Handbook Series). US Library of
Congress Federal Research Division. http://countrystudies.us/philippines/. Accessed on 15 October 2015.
KPMG Global Energy Institute. 2013. The Energy Report: Philippines. Growth and Opportunities in the
Philippine Electric Power Sector. Lagmay et al. 2012. Geological hazards of SW Natib Volcano, site of the Bataan Nuclear Power Plant, the
Philippines. Geological Society London Special Publications 2012 (361):151-169. Mendoza, M.N.V. 2008. Competition in Electricity Markets: The Case of the Philippines. A paper
presented to the APEC-IDRC Conference on Competition Policy.

45
National Economic and Development Authority (NEDA). 2004. Annex 11-1 "Financial Status of the National Power Corporation" of the Medium-Term Philippine Development Plan 2004-2010. Manila: NEDA.
National Electrification Administration. n.d. Historical Background.
http://www.nea.gov.ph/ao39/historical-background/. Accessed on 15 October 2015. Patalinghug, E. E. 2003. An Analysis of the Philippine Electric Power Industry. A paper presented to the
International Conference on the “Challenges to Development: Innovation and Change in Regulation and Competition
Philippine Electricity Market Corporation website. n.d. http://www.wesm.ph/. Philippine Institute for Development Studies. Economic Policy Monitor (2014): Effective Regulations for
Sustainable Growth. Republic Act 9136. An Act Ordaining Reforms in the Electric Power Industry, Amending for the Purpose
Certain Laws and for Other Purposes. Rodolfo, Kelvin S. 2009. Geological Hazards of the Bataan Nuclear Plant: Propaganda and Scientific Fact.
http://www.balangadiocese.com/Frontpagers/Resources/09%200516%20Geological%20Hazard
s%20of%20the%20Bataan%20Nuclear%20%20%20%20%20%20Plant.pdf. Accessed on 15
October 2015.
Senate Economic Planning Office. 2006. A Profile of Selected Philippine Government-Owned and -
Controlled Corporations (GOCCs). Pasay City: SEPO.
Woodhouse, Erick J. 2005. The IPP Experience in the Philippines. Working Paper No. 37. September
2005. Program on Energy and Sustainable Development, Stanford University.
World Bank. 1994. Philippines - Power sector study: structural framework for the power sector.
Washington, DC: World Bank.